What’s Inside
This
Introduction
This report provides a comprehensive assessment of Australia’s economic and property market conditions at a national level, using a structured set of leading indicators that collectively capture the direction of growth, inflation, household behaviour, labour market performance, credit conditions and residential supply.
Rather than relying on any single metric, the analysis brings together a broad dataset spanning macroeconomic activity, monetary policy, consumer behaviour, lending dynamics and housing delivery. This approach allows for a more complete understanding of how the economy is functioning in real time, and more importantly, where it is likely to move next.
The indicators have been structured to tell a clear, sequential story:
• Economic foundation (GDP, CPI, wages) - sets the macro backdrop.
• Policy transmission (cash rate, mortgage rates)
- impacts borrowing capacity.
• Household response (spending, savings)
- drives demand.
• Labour market conditions - underpins income and confidence.
• Population growth - determines underlying housing demand.
• Credit flows - measures active market participation.
• Supply pipeline - determines the market’s ability to respond.
Together, these components provide a forwardlooking view of the Australian economy and residential market, highlighting not just where conditions stand today, but where imbalances, risks and opportunities are emerging.
Importantly, while this report is national in scope, it also considers variations across states and territories. Differences in economic performance, population growth, housing supply and affordability continue to drive divergent market conditions, reinforcing that national trends often mask meaningful regional dynamics.
Purpose of the Report
The purpose of this report is to translate these indicators into clear, actionable insights for market participants. By analysing how each component interacts with the others, the report provides a grounded view on:
• The sustainability of current economic growth
• The trajectory of interest rates and inflation
• The strength and composition of housing demand
• The capacity of the development pipeline to respond
• The key risks and opportunities emerging into 2026
Ultimately, this report is designed to move beyond data description and instead provide a joined-up view of the market, helping inform decision-making across development, investment and policy.
For more information, please visit: www.rpmgrp.com.au
Our Research Consultancy Services create bespoke reports crafted to your specifications, translating rich data into in-depth analysis. For a bespoke report, email the team at: contactus@rpmgrp.com.au
Executive Summary

Michael Staedler
General Manager
Market
Intelligence
m.staedler@rpmgrp.com.au
Australia’s economy and housing market entered 2026 carrying the weight of a full reversal in monetary policy. After a brief easing cycle that delivered three rate cuts between February and August 2025, taking the cash rate to 3.60%, the RBA held through the end of 2025 before pivoting sharply.
Three consecutive hikes delivered between February and May 2026 returned the cash rate to 4.35%; erasing every cut. Inflation, which had appeared to be moderating, re-accelerated sharply to 4.60% in April before easing to 4.00% in May, with the path back to target clearly stalled.
GDP growth tells an interesting story. Annual growth lifted to 2.52% in March 2026 (the strongest read in years) but this reflects a low base from early 2025 rather than genuine momentum. Quarterly growth
eased to 0.27%, and with real wages still negative and household spending contracting sharply through the first quarter before recovering in May, the underlying economy is under clear pressure.
The residential market remains highly fragmented. Darwin, Hobart and Perth are recording the strongest annual price growth across houses, while Sydney and Melbourne pulled back in the March quarter.
Land values continue to diverge sharply, with Perth up 48.5% annually and Hobart down 26.2%. Lending volumes fell seasonally in March 2026 but remain positive year on year, with investor lending growing at nearly twice the pace of owner occupiers.
Supply side conditions are mixed. Approvals eased in March, with apartments 4+ storeys turning negative annually, driven by a sharp deterioration in NSW. Commencements rebounded strongly in December 2025, particularly in medium and high-density. But completions remain broadly flat, with detached housing delivery declining across most states.
Key Takeaways
• Momentum expected to slow as resumed rate tightening flows through household budgets.
• Inflation likely to remain elevated, with further rate increases a live risk. August as a possible trigger.
• Interest rates higher for longer as the 2025 easing cycle has been fully reversed.
• Housing demand is resilient but affordability constrained.
• Investor lending accelerating, outpacing owner-occupiers, is a structural shift in the lending mix.
• Supply recovery is uneven and fragile. NSW and VIC high-density approvals are deteriorating while WA and QLD are leading.
• Construction costs and feasibility remain key constraints, particularly for medium and highdensity delivery.
• Completions remain constrained, particularly for detached housing.
• Supply-demand imbalance is likely to persist into the second half of 2026.
• Global uncertainty is the key downside risk as geopolitical tensions and supply chain disruption skewed against the cost and construction outlook.
Current Market Conditions
Economic conditions at the start of 2026 are being shaped by the sharpest monetary policy reversal in years.
The RBA delivered three cuts between February and August 2025, taking the cash rate to 3.60%, then held through to the end of 2025. Three consecutive hikes from February through May 2026 have returned the cash rate to 4.35%, and with inflation re-accelerating, the risk of further tightening has not passed.
Inflation surged to 4.60% annually in April before partially retreating to 4.00% in May. The disinflation path that appeared to be taking hold through mid2025 has clearly stalled, driven by energy costs, insurance, services and global input pressures. Real wages remain negative (the quarterly CPI of 1.38% outpaced wage growth of 0.56% in Q1 2026) and households are going backwards in purchasing power terms for the third consecutive year.
Households remain under significant pressure:
• Real wages are negative with quarterly CPI (+1.38%) running at more than double wage growth (+0.56%).
• Consumer sentiment collapsed to 80.1 in April, the lowest since July 2022, before a partial recovery to 83.0 in May.
• Spending contracted sharply through January, February and April before rebounding in May. The April bounce follows a -5.8% monthly fall.
• Savings ratio eased to 6.2% in March 2026, suggesting households are beginning to draw on buffers accumulated through 2024–2025.
The labour market is softening gradually. Unemployment reached 4.4% in May 2026, the highest in the current cycle, with employment growth increasingly driven by part time gains. Business confidence turned negative in April and May for the first time since early 2025, consistent with the renewed tightening cycle and rising input costs.
Population growth continues to support underlying housing demand, though it is moderating from peak levels. December 2025 quarterly growth of 78,638 reflects seasonal patterns and normalisation from the 2023 migration surge.
Housing conditions in Q1 2026 are diverging sharply by geography and product type:
• Price leaders: Darwin (+33.3% y/y), Hobart (+24.3% y/y) and Perth (+24.2% y/y) on houses; Perth (+28.1% y/y) on units.
• Price laggards: Sydney (-6.5% q/q on houses) and Melbourne (-5.6% q/q) both pulled back in March, with Melbourne flat year-on-year.
• Land: Perth at +48.5% y/y is the extreme outlier; Hobart land has collapsed -26.2% y/y.
Lending eased seasonally in March 2026, but annual growth remains positive:
• Investor lending grew at +25.0% y/y by value (nearly double the owner occupier growth of +13.9%) signalling a structural shift toward investor led demand.
• Owner occupier demand skewed heavily to established housing (~72% of owner occupier lending by type), with construction above trend and turnkey demand subdued.
• Average loan sizes rising fastest in land (+17.5% y/y) and established housing (+11.9% y/y), reflecting competition for limited supply.
Supply has improved but remains constrained:
• Approvals: total 47,109 in March 2026, above 2023 trough but below long term average. Apartments 4+ storeys are now declining annually (-9.8% y/y), driven by a sharp collapse in NSW (-42.7% y/y).
• Commencements: rebounded strongly in December 2025 (+24.9% y/y total), with broad based medium and high density recovery. Sustainability is uncertain given cost pressures.
• Completions: 47,657 in December 2025, down -3.8% y/y. Detached delivery contracting in most states, with the overall pipeline only marginally above the 3 year average.
Overall, momentum is increasingly uneven. GDP and employment are holding, but the consumer is under pressure, inflation is proving stubborn, and the renewed rate tightening cycle is working against the confidence recovery that briefly took hold in late 2025. The path forward is narrowing.
127,480
Economic Update & Insights
This section outlines Australia’s current macroeconomic environment, covering growth, inflation, interest rates and labour market conditions. External influences, including global trade uncertainty and persistent cost pressures, are also considered in framing the outlook for economic activity through 2026.
Gross Domestic Product
• Quarterly growth eased to 0.27% in Q1 2026, stepping back from the 0.87% recorded in Q4 2025.
• Annual growth accelerated to 2.52%, the strongest annual result since 2022 and up from 1.95% in December 2025.
• The strength in the annual read reflects base effects from soft early-2025 quarters rather than a genuine lift in momentum. The 3-year annual average of 2.12% provides the more honest benchmark.
• With the cash rate at 4.35% and further increases a live risk, the headwinds to near-term growth are building rather than receding.
Quarterly Growth - Mar 2026 +0.27% Annual Growth +2.52%
Gross State Product
• State economic growth remains subdued and increasingly divergent, with 2024/25 national GSP expanding 1.35%.
• ACT (+3.54%) recorded the strongest growth of any state or territory, driven by public sector activity and population gains.
• QLD (+2.23%) is the standout among the larger states, supported by population growth and continued infrastructure investment.
• WA (+1.31%) remains steady, underpinned by its resource base and strong migration-driven demand.
• VIC (+1.13%), TAS (+1.0%), NT (+1.04%) and SA (+0.96%) are clustered in modest positive territory.
• NSW (+0.95%) is the weakest of the major states, falling below 1.0% growth for the first time in recent years, reflecting softer household conditions and high exposure to interest rate sensitivity.
• NSW (30%) and VIC (23%) still account for over half of national output, meaning weakness in these states carries outsized implications for the national economy.
State Final Demand
• NSW (+1.84% q/q) and VIC (+0.95%) led state final demand in Q1 2026, both running well above their 3-year quarterly average of 0.54%. This is a notable reversal from recent underperformance
• QLD (+0.86%) also came above its 3-year average (0.75%), supported by continued populationdriven consumption.
• SA (+0.50%) and WA (+0.45%) both printed below their respective 3-year averages (0.75% and 0.92%), suggesting underlying demand has softened in two previously stronger-performing states.
• NT (-0.43%), ACT (-0.63%) and TAS (-0.66%) all contracted in Q1 2026, with TAS remaining the most consistently weak jurisdiction. Its 3-year average of just 0.29% reflects structural demand challenges.
• Overall, demand is holding in positive territory nationally, but the distribution is uneven. The Q1 result was carried by the two largest states while smaller and mid-tier economies showed signs of fading.
Interest Rates
• The cash rate increased to 4.35% (Jun-26), reversing the brief 2025 easing cycle in full and returning to prior cycle highs.
• Three hikes were delivered from February through May 2026. Further increases remain a live risk, with an August move possible if inflation does not moderate.
• Variable rates have lifted to roughly 6.80%, maintaining pressure on household cash flow and borrowing capacity.
• Fixed rates have repriced above prior cycle levels with the 1-year rate (6.15%) and 3-year rate (6.68%) both exceed their Jun-24 equivalents, signalling expectations of a prolonged higher-rate environment.
• Borrowing capacity remains constrained, limiting housing demand and market activity.
• Overall, policy settings are firmly restrictive, with the full impact of the February–May hikes still flowing through household budgets.
Interest Rates - 2020 to 2026
Source: Australian Bureau of Statistics, RPM Market Intelligence
Consumer Price Index
• Annual inflation re-accelerated to 4.60% in April 2026 before easing to 4.00% in May. This is well above the RBA’s 2–3% target band, with the disinflationary path clearly stalled.
• May monthly CPI fell -0.70% nationally, broad-based across all states, though one month is insufficient to confirm a sustained turning point.
• Adelaide (4.40%) and Hobart (5.00%) recorded the highest annual inflation in May, while Melbourne (3.50%) remained at the lower end of the capital city range
• The April surge was indiscriminate. Every capital city exceeded 4.0% annually, signalling broad-based rather than isolated price pressure.
• Energy, insurance, and services costs continue to drive underlying inflation, with external pressures adding further upside risk.
CPI Change by Capital City (May 2025 vs. May 2026)
Source: Australian Bureau of Statistics, RPM Market Intelligence
Hobart Darwin Canberra
CPI May 2025 CPI May 2026
Wages vs Consumer Price Index
• Wage growth remains solid at 3.22% annually, but below inflation (4.09%), leaving real wages in negative territory.
• Quarterly wage growth eased to 0.56% in Q1 2026, well below the 1.38% quarterly CPI read. This is a real wage gap of -0.82% for the quarter.
• Perth faces the most acute squeeze with wages (3.55%) running materially behind CPI (4.95%), a real deficit of -1.40%.
• Canberra is the closest to wage-price parity (WPI 3.66% vs CPI 3.70%), while Brisbane also remains under pressure (WPI 3.39% vs CPI 4.16%).
• Inflation remains uneven across cities, reinforcing differing cost-of-living pressures.
• Overall, real wages are still going backwards and household purchasing power continues to erode.
New Dwelling Index
• National new dwelling prices rose 0.88% in May 2026 and 5.56% annually, reflecting persistent construction cost pressures.
• Hobart (9.90%), Adelaide (8.50%) and Brisbane (8.30%) are leading annual growth, indicating stronger supply constraints in these markets.
• Canberra (+2.80%) and Adelaide (+2.00%) led monthly growth, while Melbourne (+0.30%) recorded the softest result among the major cities.
• Darwin (-0.30%) is the only city recording a monthly decline, though annual growth (2.30%) remains positive.
• New dwelling prices continue to rise ahead of general CPI in most markets, reinforcing ongoing cost challenges for delivery and affordability.
Rental Index
• National rents increased 0.42% monthly and 3.55% annually, with rental markets remaining tight across most capitals.
• Perth (5.60%), Darwin (5.40%) and Brisbane (4.60%) are leading annual growth, driven by strong population-driven demand.
• Melbourne (2.60%) and Canberra (1.30%) are the softest markets nationally, indicating stabilisation in these cities.
• Hobart (0.70%) and Darwin (0.70%) led monthly growth, highlighting continued volatility in smaller markets.
• Overall, rental markets remain tight with the cash rate back at 4.35%. Rising investor holding costs are likely to sustain upward pressure on rents.
Household Consumption
Quarterly Change in Household Consumption Expenditure
• Electricity, gas and other fuel (+11.66%) led all categories in Q1 2026, though this reflects price-driven cost imposition on households rather than a confidence signal.
• Food (+0.83%) and essential consumption (+0.80%) held up, reflecting non-negotiable household costs.
• Essential spending is more stable, tracking above its longterm average (0.49%).
• Discretionary consumption (+0.09%) remains well below its 3-year average (0.23%), with households remaining highly cautious on non-essential spending.
• Purchase of vehicles (-1.52%) and cigarettes and tobacco (-4.64%) recorded the steepest declines.
• Hotels, cafes and restaurants (+0.02%) were nearstagnant, while recreation and culture (+0.73%) and education (+0.61%) continued to expand.
Other
Insurance & Other Financial Services
Discretionary Consumption
Hotels, Cafes & Restaurants
Furnishings & Household Equipment
Clothing & Footwear
Alcoholic Beverages
Purchase of Vehicles
Cigarettes & Tobacco
Source:
Essential and Discretionary Consumption
• Essential consumption (+0.80%) grew well above its 3-year average of (0.45%) in Q1 2026, driven in part by energy costs flowing through household budgets.
• Discretionary consumption (+0.09%) remains well below its 3-year average (0.23%) and its 5-year average (0.96%), with households pulling back on non-essential spending.
• The gap between essential and discretionary growth is widening with households spending where they have to, not where they want to.
• Post-COVID volatility has largely normalised, with both categories settling into low, steady patterns that reflect structural caution rather than cyclical weakness.
Monthly Household Spending
The Household Spending Indicator provides a timely monthly view of consumer spending, capturing near-term shifts in behaviour across essential and discretionary categories, albeit with more volatility and partial coverage compared to quarterly national accounts data. This is vital in today’s uncertain times.
After sharp contractions through January, February and April, household spending staged a clear and broad-based recovery in May 2026. The turnaround is a meaningful positive signal, with annual growth remaining solidly positive across all categories, confirming the earlier weakness was a correction rather than a structural retreat.
Total Household Spending - % Change from Previous Month
• Total household spending rose +5.9% in May 2026, reversing the -5.8% fall in April and broadly
• WA (+7.0%) and SA (+6.3%) led the rebound; NSW (+6.2%) and VIC (+6.1%) also recorded solid gains.
• ACT (+4.6%) and TAS (+4.8%) were softer but both returned to positive territory.
• Annual growth holds at +4.4%, confirming underlying demand remains intact despite the volatility in monthly outcomes through early 2026.
Source: Australian Bureau of Statistics, RPM Market Intelligence
Monthly Household Spending
• Goods spending rose +6.1% in May, reversing the -4.8% fall in April. Annual growth sits at +5.5%, the strongest of the four categories.
• NSW (+6.7%) and VIC (+6.5%) led the recovery, with QLD (+5.3%) the only major state to underperform the national result.
• NT (+10.2%) recorded the highest annual goods growth, consistent with its outsized monthly volatility.
• Services spending rose +5.8% in May after a -6.8% fall in April. Annual growth of +3.2% remains the weakest of the four categories.
• WA (+8.1%) and SA (+7.3%) led the services rebound, with VIC (+5.6%) and ACT (+4.3%) at the softer end.
• Despite monthly volatility, services remain the most structurally resilient category, underpinned by population growth and pent-up demand.
Household Spending - Goods
Household Spending - Services
Monthly Household Spending
Household Spending - Discretionary
• Discretionary spending rose +6.9% in May, the strongest monthly result of any category. This reversed the -4.3% fall in April. Annual growth sits at +4.9%.
• NSW (+7.1%), VIC (+7.2%) and WA (+7.4%) all recorded strong rebounds, suggesting the April pullback was concentrated and temporary.
• NT (+10.5% annual) continues to record the strongest discretionary growth, though the series is highly volatile.
Household Spending - Non-Discretionary
• Non-discretionary spending rose +4.3% in May (a more moderate recovery than discretionary) following the -8.2% fall in April. Annual growth sits at +3.5%.
• WA (+6.2%) and SA (+5.6%) led, while QLD (+2.6%) and TAS (+2.9%) showed more modest rebounds.
• ACT (+0.7% annual) recorded the weakest non-discretionary growth of any state, consistent with the territory’s broader softening in consumer activity.
Source: Australian Bureau of Statistics, RPM Market Intelligence
Household Savings Ratio
• The savings ratio eased to 6.2% in March 2026, stepping back from the December 2025 peak of 7.0% but remaining above the pre-COVID average of 5.5%.
• The pullback is consistent with the partial recovery in household spending, where households appear to have drawn slightly on accumulated buffers.
• The recovery from the cycle low of 1.9% (mid-2023) reflects cautious consumer behaviour, with households prioritising financial resilience over discretionary spending.
• With the cash rate at 4.35% and further hikes possible, the savings ratio may stabilise or edge higher again through the second half of 2026.
Household Savings Ratio
Source: Australian Bureau of Statistics, RPM Market Intelligence
Consumer Sentiment
• Sentiment remains below neutral at 83.0 in May 2026, following the sharp drop to 80.1 in April. This is the lowest reading since July 2022.
• The April collapse of -11.5 points was the single largest monthly fall in the recent period. This was driven by renewed rate hikes and re-accelerating inflation.
• The brief lift above 100 in November 2025 (103.8) has been fully reversed, with the index now tracking near 2022-23 lows.
• Reflects ongoing cost-of-living pressure and acute interest rate sensitivity. A meaningful recovery appears unlikely while August rate risk remains live.
Consumer Sentiment
Source: Westpac-Melbourne Institute Consumer Sentiment Index
Business Sentiment
• Business confidence turned negative in April (-0.6) and remained so in May (-0.4), the first back-to-back negative months since early 2025.
• The rapid slide from December 2025 (+6.6) reflects the renewed tightening cycle stripping away the optimism that briefly emerged in late 2025.
• Confidence has spent more time below zero than above it since mid-2024, indicating a cautious business outlook with limited appetite for investment or expansion.
• Periods of negative sentiment through 2024–2026 highlight ongoing uncertainty, particularly across interest rate-sensitive sectors such as construction and retail.
Business Sentiment
National Labour Market Snapshot
• Unemployment eased to 4.4% in May 2026, down from April’s 4.5% cycle high, still well above the 3.5–3.7% lows seen through 2023.
• Employment rose 40,343 in May, split between full-time (+5,160) and part-time (+35,183) — part-time drove the bulk of gains, but full-time also grew, it didn’t contract.
• The full-time/part-time mix has swung month to month rather than trending one direction (April saw both fall, May saw both rise) so “persistent shift to part-time” overstates a genuinely choppy pattern.
• Annual employment growth of +151,629 (trailing 12 months to May-26) shows the labour market still expanding despite the softer unemployment trend.
Monthly Change in Employment
Source: Australian Bureau of Statistics,
State Labour Market Snapshot
• National unemployment reached 4.4% in May 2026 (AUS average), up from 4.1% a year earlier.
• TAS (5.3%) and VIC (4.9%) remain elevated, indicating softer labour conditions in the south-east.
• QLD (3.7%) and ACT (3.7%) record the lowest unemployment of any state, both below the national average.
• WA (4.6%) has lifted materially from 3.9% a year ago, showing recent softening in a previously tight market.
• NT (4.0%) improved sharply from 5.2% in April, though the series is highly volatile; SA (4.2%) remains the most stable labour market.
• National employment growth remains positive (+40,343 in May; +151,627 annually), though momentum is moderating.
• VIC (+22,906) and QLD (+18,273) led monthly gains.
• WA (-14,984) recorded the largest monthly decline of any state, consistent with the uptick in WA unemployment.
• TAS is the only state with negative annual employment growth (-4,962), highlighting its structural labour market challenges.
• NSW (+45,643) and QLD (+30,239) have generated the largest absolute employment gains over the year.
• National participation is stable at 66.7%, broadly in line with the 12-month average of 66.8%.
• NT (74.1%) and ACT (72.4%) remain the highest participation states. WA (68.9%) and QLD (66.9%) sit above the national average
• TAS (60.2%) continues to record the lowest participation rate, reflecting its older demographic profile and limited employment base.
• Overall, labour supply remains stable. The rise in unemployment reflects more job seekers entering the market rather than workers exiting the labour force.
Source: Australian Bureau of Statistics, RPM Market Intelligence
National Population Snapshot
• Population growth remains strong and migration-driven, with December 2025 quarter growth of 78,638 persons (+1.51% y/y) easing from the September quarter (111,090) as seasonal patterns and the broader moderation from 2023 peaks continue.
• Net overseas migration (NOM) of 56,613 drove the quarter, down 35.7% from September (88,090). This is consistent with the typical December seasonal softening
• Natural increase eased to 22,025, continuing its gradual structural decline.
• Annual growth of 412,494 remains well above pre-COVID averages, though well below the 601,325 peak in 2022/23 marking a normalisation rather than slowdown.
Quarterly Change in Persons
Source: Australian Bureau of Statistics, RPM Market Intelligence
Natural Increase Net Overseas Migration
State Population Snapshot
• WA (+2.17% y/y) is the fastest growing state annually, followed by VIC (+1.67%) and QLD (+1.64%).
• VIC (22,052) and QLD (19,464) added the most persons in the December quarter, with NSW (18,584) also a significant contributor in absolute terms.
• TAS (+0.50% y/y) remains the weakest state by annual growth rate, with subdued migration appeal and natural increase of just 66 persons in the quarter.
• Growth remains migration-led rather than natural increase-led, with interstate flows continuing to favour QLD and WA over NSW and VIC .
• Overseas migration eased to 56,613 nationally in the December quarter, down 35.7% from September (88,090), reflecting seasonal patterns.
• NSW (17,918) and VIC (15,553) attracted the largest absolute inflows, followed by WA (7,764).
• TAS (+59.1% q/q) recorded the strongest proportional quarterly increase, though from a low base.
• NT (-44.4% annual) and SA (-24.3%) show the sharpest annual easing in overseas migration inflows.
Source: Australian Bureau of Statistics, RPM Market Intelligence
State Population Snapshot
• Natural increase continues to soften nationally, easing 5.4% q/q to 22,025 in December 2025.
• NSW (6,508) remains the largest contributor despite a quarterly decline of 15.2%.
• WA (-26.7%) and QLD (-11.9%) recorded the sharpest quarterly declines among the larger states.
• TAS (66 persons) returned to modest positive natural increase after recording -125 in September, though demographic pressure remains acute.
Interstate Migration
• Interstate migration remains mixed and volatile across states.
• QLD (+4,913) and WA (+2,415) continue to attract net inflows, supporting growth corridors.
• NSW (-5,842) remains the key state losing population interstate, with NT (-420) and ACT (-201) also recording net outflows.
• VIC (-154) is near neutral on interstate flows, a stabilisation after an extended period of more significant outflows.
Source: Australian Bureau of Statistics, RPM
National Population Projections
• National population growth remains steady (1.2% p.a.), reaching 28.6 million by 2027–28.
• Growth profile shows a moderation from recent migrationdriven peaks, but remains above long-term averages.
• Population growth remains migration-led, with net overseas migration (225k–262k p.a.) consistently accounting for the majority of growth.
• Natural increase is materially lower (100k–115k p.a.), contributing roughly one-third of total growth.
• Net overseas migration declined from 262k to roughly 226k, signalling a controlled slowdown rather than a sharp correction.
• Despite easing, migration remains structurally elevated vs pre-COVID levels.
• Continues to be the key lever driving housing demand and population growth.
Persons
Source: Centre of Population
Natural Increase Net Overseas Migration Total Increase
State Population Projections
State Growth Leaders
• WA (1.6% p.a.) is the fastest growing state, underpinned by migration and economic momentum.
• VIC and QLD (both 1.4% p.a.) remain key growth engines, driving both volume and rate of growth.
• ACT (1.3% p.a.) continues to perform strongly on a smaller base.
Mid-Tier Growth
• NSW (1.0% p.a.) shows stable but slower growth, reflecting net interstate outflows.
• NT (1.0% p.a.) also sits in this bracket, though with more volatility.
Volume Growth
• NSW and VIC remain the largest contributors in absolute terms, adding the most population despite slower growth rates.
• QLD and WA continue to gain share, reflecting interstate migration and affordability-driven demand shifts.
Population Projections
Property & Lending Update
This section outlines Australia’s residential market and lending environment, focusing on dwelling price movements, borrowing activity, and buyer composition. It also considers supply-side dynamics, including approvals, commencements and completions, to frame the outlook for housing demand and delivery through 2026.

Residential Prices - Q1 2026
$620,000 $399,000
$635,897 $684,500
Residential Prices
Source: PriceFinder
Lending Activity - Loans
• Total housing finance commitments eased to 127,480 loans in Q1 2026, pulling back 19.4% from the Q4 2025 quarter peak (158,121). This highlights a typical seasonal correction following the strong end-of-year result.
• NSW (34,283) and VIC (34,684) remain the two largest lending markets nationally, with QLD (28,408) a solid third.
• Annual growth remains positive across most states, with total volumes still tracking above long-run averages, confirming the broader lending recovery remains intact despite the quarterly pullback.
• Investor lending is the most resilient category on an annual basis (+18.5% y/y), while FHB (+4.0% y/y) and non-FHB owner-occupier (+1.4% y/y) growth has moderated.
Total Loans by Buyer Type
First Home Buyer Loans
• 27,078 FHB loans nationally in Q1 2026, down 20.4% q/q but +4.0% y/y. Volumes remain above the 3-year average (29,238).
• NSW (6,558) leads FHB volumes, followed by VIC (8,489) and QLD (5,284).
• TAS (+13.2% y/y) recorded the strongest annual FHB growth among states, while SA (-2.3% y/y) was the only state to record an annual decline.
• The FHB segment remains concentrated across VIC, NSW and QLD , which together account for the majority of national entry level lending activity.
First Home Buyer Loans
First Home Buyer Share by State
Source: Australian Bureau of Statistics, RPM Market Intelligence
Non-First Home Buyer Loans
• 48,688 non-FHB owner-occupier loans in Q1 2026, down 19.9% q/q but +1.4% y/y. This is broadly in line with the 3-year average (52,360).
• NSW (12,736) and VIC (13,537) lead volumes, with QLD (11,133) also a significant contributor.
• WA (-10.0% y/y) recorded the only material annual decline, while VIC (+6.6% y/y) and QLD (-1.2% y/y) were broadly stable.
• Upgrader demand remains stable overall, with the quarterly softening consistent with seasonal patterns rather than structural retreat.
Non-First Home Buyer Loans
Non-First
Source: Australian Bureau of Statistics, RPM Market Intelligence
Investor Loans
• 51,714 investor loans nationally in March 2026, down 18.4% q/q but +18.5% y/y. This is the strongest annual growth of any lending category and well above the 3-year average (49,182).
• VIC (+29.3% y/y) and NSW (+16.3% y/y) drove the strongest annual growth among major states.
• NSW (14,989) leads investor volumes nationally, followed by VIC (12,658) and QLD (11,991).
• Investor activity is accelerating on an annual basis and now accounts for the largest share of total lending. A clear structural shift toward investor-led market activity.
Source: Australian Bureau of Statistics, RPM Market Intelligence
Number of New Loan Commitments by Type
• 88,696 owner occupier loans nationally in March 2026, down 19.0% q/q from the December 2025 peak (109,468). A typical seasonal correction following the strong yearend result.
• VIC (24,539) and NSW (22,589) remain the two largest owner occupier markets, with QLD (19,946) a solid third.
• Annual growth of +3.9% confirms the broader owner occupier recovery remains intact despite the quarterly pullback, with volumes tracking above the 3-year average (+3.8%).
• Established dwellings dominate at 72% of total owner occupier lending, while construction and land are gaining modest share on an annual basis.
Count of Loans by Owner Occupier Type
Construction of a Dwelling Newly Erected Dwelling Established Dwelling Residential Land Alteration and Additions Total Average Value
Source: Australian Bureau of Statistics, RPM Market Intelligence
Number of New Loan Commitments by Type
Number of Owner Occupier Loans for Construction of Dwelling
Number of Owner Occupier Loans for Newly Erected Dwellings
• 8,404 construction loans nationally in March 2026 (-13.8% q/q; +10.7% y/y), tracking above the 3-year average (+3.0%). A positive signal for new housing supply.
• WA (+18.9% y/y) and NSW (+17.9% y/y) led annual growth, with VIC (+10.8% y/y) also recording solid gains.
• VIC (2,180) and WA (2,055) remain the largest construction lending markets, followed by QLD (1,833).
• SA (-4.8% y/y) and TAS (-2.7% y/y) are the only states recording annual declines in construction lending.
• 3,890 new dwelling loans in March 2026 (-25.3% q/q; +3.4% y/y). Volumes remain slightly below the 3-year average (-3.4%), indicating subdued turnkey demand.
• WA (+57.5% y/y) and ACT (+55.7% y/y) recorded the strongest annual growth, both from a relatively low base.
• VIC (-12.9% y/y) recorded the largest annual decline among major states, consistent with the broader softening in Victoria’s new dwelling market.
• VIC (1,146) and NSW (1,081) remain the largest markets by volume despite recent softness.
Source: Australian Bureau of Statistics, RPM Market Intelligence
Number of New Loan Commitments by Type
Number of Owner Occupier Loans for Established Dwellings
Number of Owner Occupier Loans for Residential Land
• 63,472 established dwelling loans in March 2026 (-20.5% q/q; +1.2% y/y). The dominant segment at ~72% of total owner occupier lending.
• VIC (18,700) and NSW (16,933) lead established lending volumes nationally, with QLD (13,957) a solid third.
• ACT (+10.8% y/y) and NSW (+7.1% y/y) recorded the strongest annual growth among major markets.
• WA (-13.5% y/y) recorded a material annual decline, reflecting the rotation toward construction and land lending in that market.
• 4,912 land loans in March 2026 (-20.2% q/q; +9.4% y/y). Land is gaining momentum on an annual basis, supported by affordability driven buyers and growth corridor activity.
• WA (+24.8% y/y) and TAS (+60.6% y/y) recorded the strongest annual growth, with WA reflecting sustained greenfield demand.
• WA (972) and VIC (1,168) lead land lending volumes; NSW (959) remains active despite the softer Sydney market.
Source: Australian Bureau of Statistics, RPM Market Intelligence
Value of New Loan Commitments by Type
Total Owner Occupier
• Loan values continue to rise nationally, driven by persistent price growth in more affordable states and ongoing competition for limited established housing supply.
• Established dwellings carry the highest average loan ($742,620), followed by new dwellings ($705,373) and construction ($690,088) while land remains the most affordable entry point ($441,368).
• QLD (+13.6% y/y), SA (+12.1% y/y) and WA (+14.6% y/y) are recording the strongest annual loan growth across construction, reflecting price rises in more affordable markets.
• NSW consistently carries the highest average loan across all product types, reflecting the structural price premium of the Sydney market.
Average Price of New Loans by Type
Construction of a Dwelling Newly Erected Dwelling Established Dwelling Residential Land Alteration and Additions Total Average Value
$800,000
$750,000
$700,000
$650,000
$550,000 $600,000
Value of New Loan Commitments by Type
Value of New Loan Commitments for Construction of Dwelling
Value of New Loan Commitments for Newly Erected Dwellings
• National average construction loan: $690,088 (+0.5% q/q; +9.1% y/y) reflects ongoing build cost inflation across the industry.
• QLD (+13.6% y/y; $715,330), SA (+12.1% y/y; $633,736) and WA (+14.6% y/y; $660,146) are recording the strongest annual growth, reflecting rising construction costs in growth markets.
• NSW ($782,266) remains the highest state, followed by ACT ($740,580) and QLD ($715,330).
• National average new dwelling loan: $705,373 (+1.3% q/q; +8.0% y/y). Moderate growth, with softer momentum relative to construction and established markets.
• QLD (+18.4% y/y; $781,499) recorded the strongest annual growth, while WA (-19.9% y/y; $477,434) recorded a material annual decline. This is the sharpest fall of any state in this segment.
• NSW ($835,708) remains the highest, followed by QLD ($781,499). WA has dropped significantly, likely reflecting a shift toward more affordable product types in that market.
Source: Australian Bureau of Statistics, RPM Market Intelligence
Value of New Loan Commitments by Type
• National average established loan: $742,620 (-0.3% q/q; +11.9% y/y). The highest average loan across all segments, reflecting ongoing competition for limited existing supply.
• WA (+22.4% y/y; $731,191) and QLD (+15.7% y/y; $742,667) recorded the strongest annual growth, consistent with price gains in those markets.
• NSW ($867,879) remains the highest nationally, while SA (+12.0% y/y) also recorded strong growth from a lower base.
• National average land loan: $441,368 (+2.4% q/q; +17.5% y/y). The fastest annual growth of any loan segment, reflecting surging land values in growth corridors.
• SA (+34.5% y/y; $377,647), QLD (+26.8% y/y; $480,205) and WA (+28.4% y/y; $439,095) are leading annual growth. Reflects the premium placed on land in affordable, high-demand markets.
• ACT ($600,000) and NSW ($513,452) remain the highest-priced land markets, reflecting geographic constraints on supply.
Value of New Loan Commitments for Established Dwellings
Value of New Loan Commitments for Residential Land
Value of New Loan Commitments by Type
• National average renovation loan: $230,120 (-3.0% q/q). The smallest loan size segment, with modest quarterly softening after prior strength.
• NT (+54.7% q/q) recorded a sharp quarterly spike, though this reflects high volatility on a small base rather than a structural shift.
• NSW ($254,752) leads by state volume, consistent with the higher cost of trades and materials in Sydney.
• Renovation lending reflects households upgrading in place rather than transacting. A rational response to high transaction costs and persistent affordability constraints.
• Loan values continue to rise nationally, driven by persistent price growth in more affordable states and ongoing competition for limited established housing supply.
• Established dwellings carry the highest average loan ($742,620), followed by new dwellings ($705,373) and construction ($690,088) while land remains the most affordable entry point ($441,368).
• QLD (+13.6% y/y), SA (+12.1% y/y) and WA (+14.6% y/y) are recording the strongest annual loan growth across construction, reflecting price rises in more affordable markets. NSW consistently carries the highest average loan across all product types, reflecting the structural price premium of the Sydney market.
Value of New Loan Commitments for Alterations & Additions
Value of New Loan Commitments - Total
Owner Occupier vs. Investor Activity
• $55,679m in owner occupier lending nationally in March 2026 (-20.2% q/q; +13.9% y/y), pulling back from the December 2025 peak of $69,777m. A seasonal normalisation consistent with prior years.
• NSW ($16,601m) and VIC ($14,858m) remain the two largest owner occupier markets by value, with QLD ($12,167m) a solid third.
• ACT (+22.5% y/y), NSW (+16.6% y/y) and QLD (+15.7% y/y) recorded the strongest annual growth among states. Annual growth of +13.9% remains firmly positive, confirming the owner occupier recovery is intact despite the quarterly pullback.
• $36,670m in investor lending nationally in March 2026 (-19.2% q/q; +25.0% y/y). The fastest growing segment on an annual basis.
• QLD (+29.0% y/y), VIC (+28.7% y/y), WA (+28.8% y/y) and SA (+30.2% y/y) recorded broad-based strong annual growth across most major states. NSW ($12,849m) leads investor lending by value, followed by QLD ($8,522m) and VIC ($7,673m). TAS (+85.3% y/y) recorded the strongest proportional annual growth of any state, though from a very small base ($487m).
• Investor lending is growing nearly twice as fast as owner occupier lending on an annual basis. A clear structural shift toward investor led market activity driven by rental market tightness and yield-seeking behaviour.
Source: Australian Bureau of Statistics, RPM Market Intelligence
Owner Occupier vs. Investor Split
• Owner occupier lending accounts for 60.6% of total lending in March 2026, up from 59.4% in December 2025. A modest short term tilt back toward owner occupiers following the December quarter.
• Long term, investor activity has strengthened materially, with the investor share rising from the 60%+ owner occupier dominance of the 2017–2020 period toward a more balanced national profile.
• Quarter on quarter owner occupier share shifts: NT (+5.2pp), ACT (+4.3pp) and SA (+2.1pp) showed the largest owner occupier share increases; TAS (-2.0pp) was the only state to see a share decline.
• The sustained investor growth trend (with annual gains of +25% nationally) reflects rental market pressure, rising yields and a search for alternative returns in an elevated rate environment.
Owner Occupier Share of Loan Value
Source: Australian Bureau of Statistics, RPM Market Intelligence
Business Lending
• Business lending eased to $3,336.1bn in March 2026, pulling back from the December 2025 record of $3,915.5bn. Consistent with post-year-end seasonal normalization.
• Plant and equipment lending ($3,077.4bn) remains the dominant category, easing from the December peak but still elevated relative to 2023–2024 levels.
• Road vehicle lending ($793.8bn) has moderated from the $913bn September 2025 peak, though remains near cyclical highs.
• The overall trajectory since 2023 remains firmly upward, with business investment in productive assets a positive signal for broader economic activity despite the quarterly pullback.
Value of New Loan Commitments for Businesses
Source: Australian Bureau of Statistics, RPM Market Intelligence
Approvals

Total Approvals
47,109
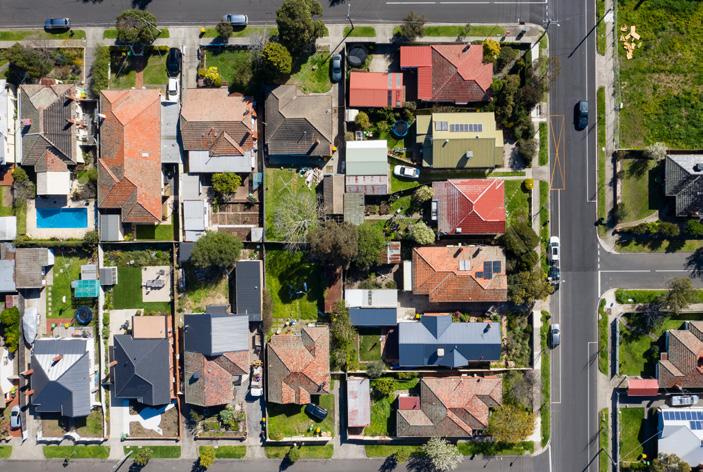
Detached Houses
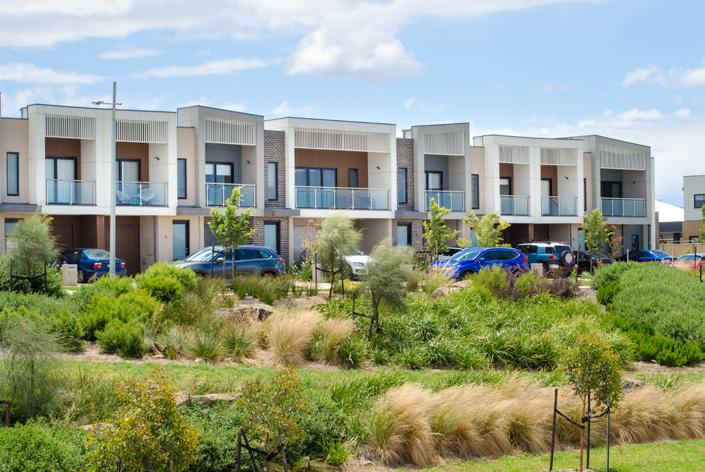
Townhomes 7,858
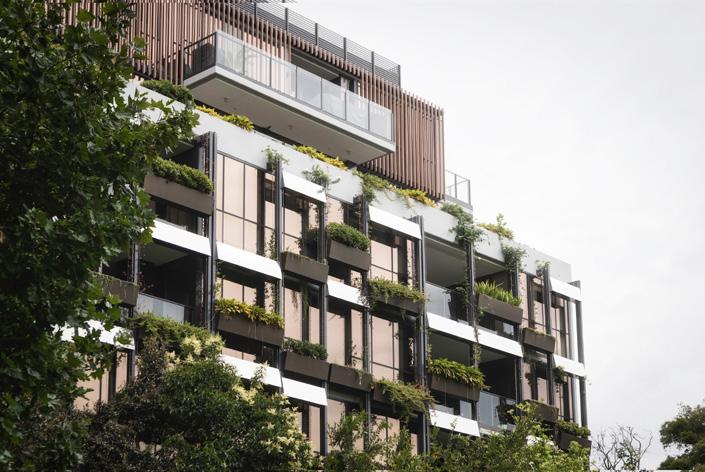
1-3 Storey Apartment
449
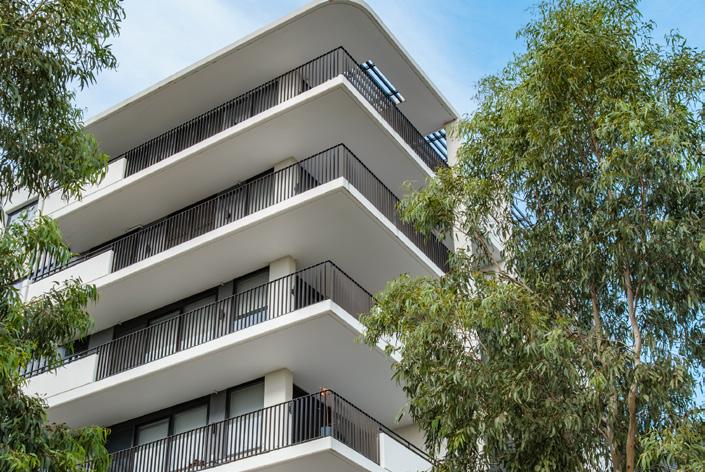
4+ Storey Apartment
10,506
• Market remains above 2023 trough levels (37k–43k) but below the 10-year average (49,415) and COVID peak (62k in Jun-21).
• The quarterly pullback reverses some of the late-2025 improvement, reinforcing that the recovery remains gradual and uneven.
• Largest share of total activity (~60%).
• Annual growth is solid, led by WA and NSW , while VIC continues to lag; volumes remain just below the 10-year average (29,220).
• Detached housing remains the core market, with moderate but stable demand across most states.
• Accounting for ~17% of total approvals.
• Annual growth has moderated from the double-digit gains of 2025, reflecting normalisation after the medium-density surge.
• Townhomes remain a key structural growth segment.
• A small and highly volatile segment (~1% of total).
• The sharp quarterly fall follows the Sep-25 spike (1,548), confirming activity is driven by lumpy project timing rather than sustained demand.
• Annual growth reflects a low base only. Volumes remain well below the 10-year average (925).
• Annual volumes have turned negative, reversing the late2025 stabilisation.
• VIC (-49.3% y/y) is driving the national decline, more than offsetting strong growth in WA (+147.1% y/y) and QLD (+63.0% y/y).
• High-density approvals remain below the 10-year average (11,190).
Building Approvals at the State Level
Detached Home Approvals by State
Townhome Approvals by State
• Detached demand remains resilient nationally, with WA and NSW now leading growth while VIC has returned to positive territory.
• 28,246 approvals in March 2026 (-3.9% q/q; +10.5% y/y).
• Growth driven by:
• WA (+21.5% y/y) and NSW (+14.3% y/y) are the clear leaders.
• QLD (+12.3% y/y) and VIC (+6.1% y/y) also remain positive.
• SA (-2.1% y/y) and NT (-29.0% y/y) the only states recording annual declines.
• Townhomes are growing in QLD and SA but softening in VIC and WA , with the broad-based surge of 2025 moderating.
• 7,858 approvals in March 2026 (-11.8% q/q; +2.9% y/y).
• State divergence is widening:
• SA (+43.2% y/y) remains the standout growth market, though well below the +130% pace of the prior year.
• QLD (+10.7% y/y) solid; NSW (+0.6% y/y) barely positive.
• VIC (-5.4% y/y) and WA (-11.7% y/y) recording annual declines
Building Approvals at the State Level
Apartment Approvals (1-3 Storeys) by State
Apartment Approvals (4+ Storeys) by State
• Low rise apartment activity remains volatile and project-driven, with limited signal value at the state level.
• 499 approvals in March 2026 (-44.7% q/q; +61.5% y/y) — annual growth is a base effect only.
• Notable state movements:
• WA (+1,386% y/y) reflects a shift from near-zero activity (7) to 104. A low-base distortion, not a structural trend.
• NSW (+60.9% y/y) and QLD (+42.1% y/y) also recovering from low bases.
• VIC (-38.9% y/y) continues to contract in this segment.
• High-density recovery is increasingly concentrated in QLD , while NSW has emerged as a major new weakness nationally.
• 10,506 approvals in March 2026 (-10.9% q/q; -9.8% y/y).
• Divergence is stark:
• QLD (+128.5% y/y) and WA (+31.5% y/y) are driving all national growth.
• NSW (-42.7% y/y) has turned sharply negative, a significant deterioration from the prior year.
• VIC (-17.4% y/y) and ACT (-30.6% y/y) also remain in decline.
Source: Australian Bureau of Statistics, RPM Market Intelligence
Commencements

Total Commencements
53,341
+3.0% q/q and +24.9% y/y
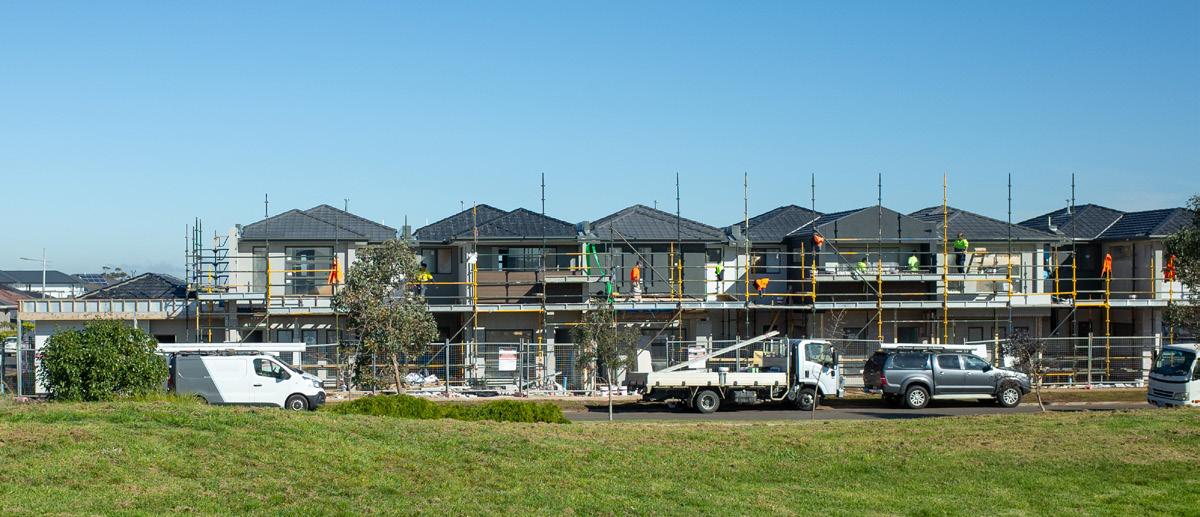
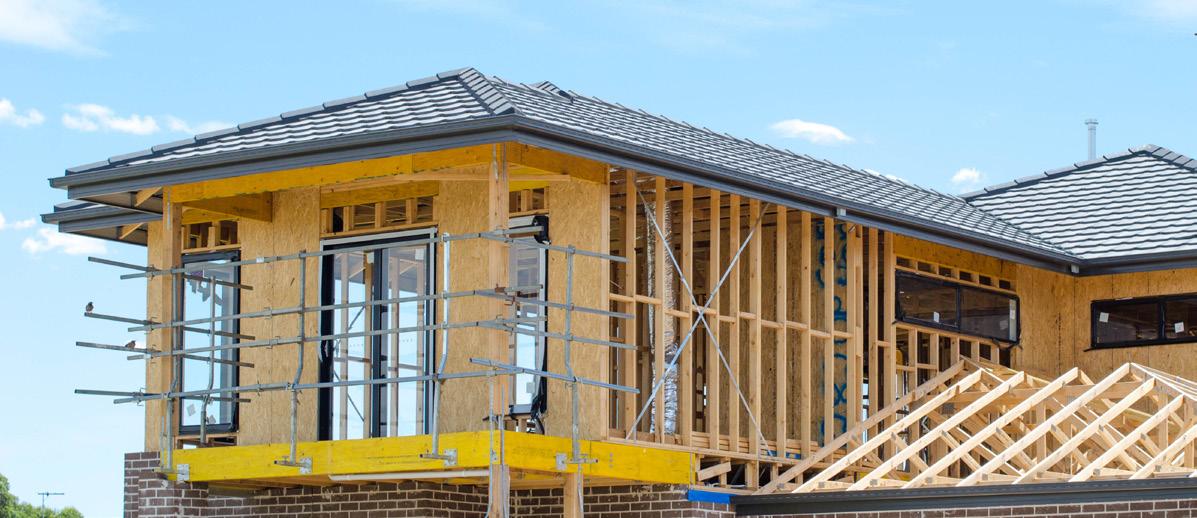
• Dwelling commencements rebounded strongly in December 2025, driven by a sharp recovery in medium and high-density construction across most states.
• The uplift reflects improving feasibility and project activation, with VIC and SA recording particularly strong other-dwelling growth after years of suppression. Sustainability of the recovery is uncertain given ongoing cost pressures and geopolitical risk to construction inputs.
Detached House Commencements 29,174
-5.9% q/q and +7.3% y/y
• Growth is modest and broadly in line with the 3-year average (+0.4%), with WA and VIC now leading and NSW stalled.
• WA (+15.0% y/y) and VIC (+14.7% y/y) lead; QLD (+7.5%) and TAS (+9.2%) also positive. NSW (+0.2%) is flat; SA (-1.8%) is the only major state in decline.
Other Dwelling Commencements 24,167
+16.3% q/q and +56.0% y/y
• Broad-based recovery from the 2022-23 trough, led by SA (+102.9% y/y) and VIC (+96.2% y/y) as delayed projects activate.
• QLD (+48.7%) and WA (+46.2%) also strong; NSW (+18.7%) lags the national pace.
• This is partly a low-base effect from 2022-23 suppression. The recovery is real but fragile, and remains highly sensitive to construction costs, feasibility and funding conditions.
Commencement Forecast
Total Dwelling Commencements Forecast
Total Dwelling Commencements
• Total commencements forecast to increase +16.7% nationally.
• Growth is skewed toward other dwellings driving the uplift.
• The outlook is highly sensitive to global conditions, including geopolitical tensions, supply chain disruption and construction cost volatility, which may delay or defer project delivery.
Commencement Forecast by Product Type
Detached House Commencement Forecast
• Moderate growth (+9.3%), led by WA , QLD and SA , while NSW and VIC remain flat.
• Nevertheless, detached housing is exposed to input cost volatility (materials, trades) and interest rate sensitivity, with global factors potentially constraining builder margins and slowing delivery.
Other Dwellings (Townhomes & Apartments) Forecast
• Strong forecast growth (+29.6%), driven by a rebound from a low base and increased
density supply.
• This segment faces the greatest risk, with feasibility highly sensitive to: global construction cost pressures, financing conditions and capital availability, geopolitical uncertainty impacting materials and delivery timelines.
• Global construction cost pressures.
• Financing conditions and capital availability.
• Geopolitical uncertainty impacting materials and delivery timelines.
• As a result, a portion of forecast supply may not materialise.
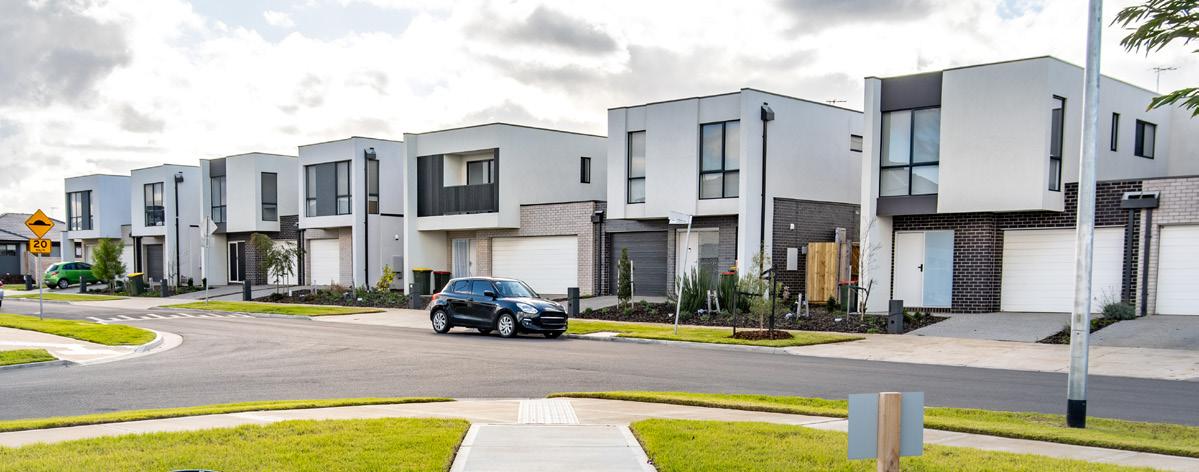
Completions
Total Completions
47,657
+4.7% q/q and-3.8% y/y
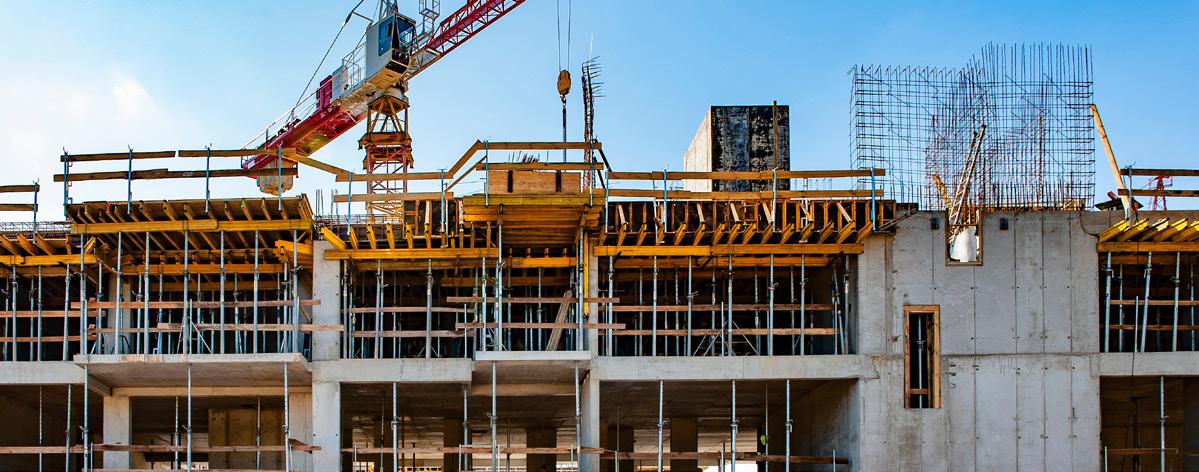
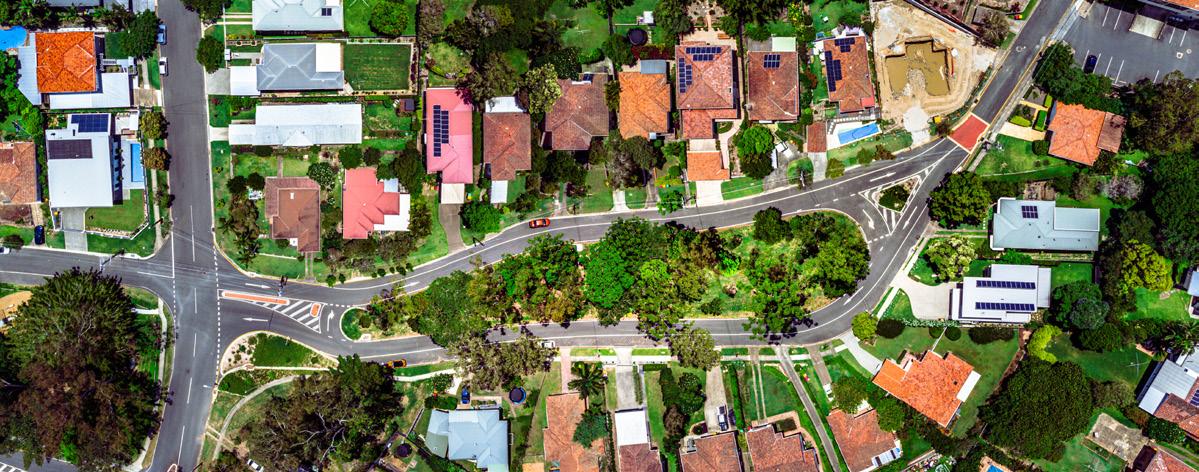
• Broadly flat against the 3-year average (+0.1%), reinforcing persistent supply constraints.
• The quarterly uplift is driven by higher density completions, while detached housing continues to trend weaker on an annual basis.
• Over the medium term, completions remain constrained. The lagged impact of weak commencements and elevated construction costs through 2022–2024 is still flowing through the pipeline.
Detached Houses
28,517
Other Dwellings (Medium/High Density)
19,140
+1.0% q/q and -6.7% y/y
• Delivery remains below the 3 year average (-0.7%) and is contracting in most major states
• Most major states are declining:
• WA (-16.8% y/y), NSW (-10.6% y/y) and VIC (-5.2% y/y) record the largest falls.
• TAS (-20.0% y/y) and ACT (-9.3% y/y) are also contracting.
• QLD (+3.4% y/y), SA (+3.0% y/y) and NT (+34.6% y/y) are the only states recording growth.
q/q and
• Broadly in line with the 3-year average (+1.3%).
• The state picture has shifted materially from the prior quarter:
• SA (+96.0% y/y) surged, reflecting project completions from the prior construction wave.
• VIC (+18.9% y/y) and NSW (+13.3% y/y) also recording positive annual growth.
• WA (-66.5% y/y) and QLD (-32.7% y/y) have reversed sharply into decline after prior-quarter strength.
Economic Outlook
Michael Staedler
General Manager
Market
Intelligence
m.staedler@rpmgrp.com.au
Demand hasn’t gone away. It’s being rationed by rates, while the supply that’s meant to relieve it keeps falling short.
Australia’s economic and housing outlook has shifted from gradual recovery to increasing constraint.
The brief easing window through 2025 (falling rates, improving confidence, recovering lending) has closed, and those conditions have reversed rather than faded.
With the cash rate at 4.35% and a further hike genuinely live for August, borrowing capacity will remain suppressed. Households are under real pressure and sentiment is soft, with consumer confidence down 2.9% in June alone.
Demand isn’t resilient in the sense of genuine buying power. It’s resilient because population growth and a tight rental market are pushing people toward ownership despite weak capacity.
Housing demand will likely stay uneven rather than broadly resilient. Perth, Adelaide and Brisbane retain the strongest support from population inflows and constrained supply, though all three have slowed sharply from earlier pace, annual growth still leads the country, but the trend is decelerating. Sydney remains under pressure from its price premium, limiting buyer capacity in the current rate environment.
Melbourne is a different story. Despite sitting below Sydney and Brisbane on price, it continues to underperform, weighed down by softer economic conditions and elevated investor caution.
Nationally, investor demand is likely to hold up in the near term, supported by improving rental yields and the fact that established property incentives remain unchanged until the negative gearing reform takes effect in mid-2027.
On supply, the commencements recovery through late 2025 is a positive signal but should be read cautiously. Rising construction costs, tight feasibility, and geopolitical risk mean a share of the forecast pipeline may not convert to completions, particularly medium and high-density stock. Detached delivery is likely declining in most states as weaker 2022–23 commencements work through, and higher-density delivery stays the most volatile segment, NSW in particular, through the remainder of 2026.
Overall, the balance of risks is skewed toward slower activity, with persistent affordability challenges, and continued supply constraints through the remainder of 2026. The same shortfall constraining activity now, however, is the structural factor most likely to underpin values once rates and policy settings stabilise.
For more information, please visit: www.rpmgrp.com.au
Our Research Consultancy Services create bespoke reports crafted to your specifications, translating rich data into in-depth analysis. For a bespoke report, email the team at: contactus@rpmgrp.com.au
Our Team
Market Intelligence

Michael Staedler
General Manager
Market Intelligence m.staedler@rpmgrp.com.au

Andrew Raponi
Senior Research Manager a.raponi@rpmgrp.com.au

Laurence Rao
Research Manager - VIC laurence@rpmgrp.com.au

Simon Brinkman
Research Manager - QLD simon@rpmgrp.com.au
Executive, Sales and Marketing Leadership



Paul McMahon
Chief Operating Officer paul@rpmgrp.com.au

Imogene Schaefer
General Manager
Marketing imogene@rpmgrp.com.au
Clinton Trezise
Managing Director
QLD & NSW clinton@rpmgrp.com.au


Luke Kelly
National Managing Director Built Form luke@rpmgrp.com.au
Michael Vilar
General Manager
Medium Density michaelv@rpmgrp.com.au
Peter Neale
Managing Director
QLD & NSW petern@rpmgrp.com.au



Rod Anderson
National Managing Director Communities rod@rpmgrp.com.au
Greg Rankin
General Manager
Communities gregr@rpmgrp.com.au
Tim Hyland
National Strategy Manager
Transactions & Advisory tim@rpmgrp.com.au


Peter Grant
National Managing Director Business Development peter@rpmgrp.com.au
Johnathon Driessen
General Manager
Communities johnathon@rpmgrp.com.au
For detailed insights or custom reporting, contact the team at: contactus@rpmgrp.com.au