Individual Narrative Report (3rd-6th Grade)
The first page you will see in the 3rd-6th grade parent report is the Individual Narrative Report. This report gives an overview of your child’s performance on the CTP5 subtests. This page is meant to help you see your child’s relative performance across different tested areas and includes two main parts:
1 A table showing your child’s scale scores, percentiles, and stanines
2 A graph showing the probable range for your child’s percentile rank
A glossary of terms has been provided to assist you in understanding this report.
Scale Score
A scale score reflects both how many questions your child answered correctly and how difficult those questions were. Two students can get the same number correct but earn different scores if one answered more challenging questions. Scale scores allow fair comparisons across different versions of a test, unlike raw scores which only count correct answers.
Percentile Rank
A percentile rank shows how your child performed compared to other students in a norm group. It is not the percentage of questions correct. For example, the 70th percentile means your child performed as well as or better than 70% of students in the group Percentiles can change depending on the comparison group used
Independent Norm
This compares your child’s performance to students in independent schools who took the CTP5 at the same grade and time over the past three years It is often the most meaningful comparison for independent schools because it reflects a similar student population
Stanines
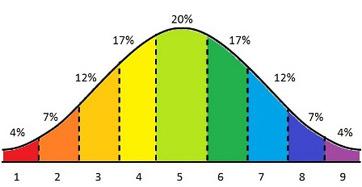
A stanine shows how your child performed compared to a norm group on a 1–9 scale Scores of 1–3 are below average, 4–6 are average, and 7–9 are above average Most students fall in the middle range, with fewer at the high or low ends (a bell curve).
Probable Range
The probable range shows that test scores are estimates, not exact measures. If your child took a similar test, their score might vary slightly. This range shows where their percentile rank would likely fall on another version of the test. Overlapping ranges suggest similar performance across areas, while non-overlapping ranges may indicate a more meaningful difference
Instructional Summary Report (3rd-6th Grade)
The next two pages of your child’s report include the Instructional Summary Report This report gives a closer look at your child’s performance within each tested area While the Individual Narrative Report gives a broader picture, the Instructional Summary Report breaks some areas into smaller skill categories. A glossary of terms has been provided to assist you in understanding this report.
Subscore Categories
This shows the main tests your child took, such as Reading Comprehension, Mathematics, Writing Mechanics, or Vocabulary. Each test includes smaller skill areas called subscores that break down specific skills within that subject. For example, Reading Comprehension may include skills like making inferences or analyzing text. These subscores help show strengths and areas for growth within each subject.
Number of Questions Presented
This tells you how many questions were included in the full test or within a specific skill area. For example, if Reading Comprehension included 37 questions, those questions may be divided among different reading skills. Some questions may ask students to identify explicit information, some may ask students to make inferences, and others may ask students to analyze what they read.
Number of Questions Answered
This shows how many questions your child answered out of the total given. If not all questions were attempted, it may have affected the score and can also give insight into pacing, stamina, confidence, or test-taking habits.
Questions Counted Twice
Some questions are used in both Content and Process categories. This means one question is analyzed in two ways, by subject area (Content) and by type of thinking (Process). This provides more detailed information about skills and does not mean a wrong answer is counted twice in the overall score
Subtests
Auditory Comprehension (2nd & 3rd only)
Measures listening vocabulary and comprehension of orally presented material It may include understanding stated information, identifying the main idea or gist of short passages, and making inferences based on what was heard
Quantitative Reasoning (3rd-6th only)
Measures the ability to analyze mathematical ideas, identify patterns, make generalizations, and compare quantities using mathematical reasoning.
Reading Comprehension
Measures understanding of written text. This may include recalling information, identifying main ideas, drawing conclusions, and using information from passages to make reasonable interpretations.
Mathematics
Measures conceptual understanding, application of mathematical knowledge, problem solving, computation, and estimation.
Verbal Reasoning (3rd-6th only)
Measures the ability to analyze information, draw logical conclusions, recognize relationships between words or ideas, and identify categories or patterns in language.
Vocabulary (4th-6th only)
Measures recognition and understanding of grade-appropriate words. It may also assess a student’s ability to use context clues to determine word meaning.
Word Analysis (2nd only)
Measures the ability to recognize and decode words and understand basic structural elements of the English language.
Writing Concepts and Skills (3rd-6th only)
Measures understanding of effective written composition. This may include organization, clarity, development of ideas, and other features of strong writing.
Writing Mechanics
Measures understanding of spelling, capitalization, punctuation, grammar, and usage conventions.