
2026 Second Quarter

2026 Second Quarter

Paul Brussow President
North America
Periods of rapid growth are often followed by moments of adjustment. For the construction industry, the second quarter of 2026 appears to be one of those moments; less about slowing down and more about settling into a sustainable pace.
Rather than a uniform shift across the board, current data reflects a healthy realignment of market activity. Specialized sectors continue to drive robust investment, with data centers, infrastructure developments, healthcare, and education showing exceptional strength. For example, a surge in data center projects has successfully boosted the national construction backlog indicator to 8.8 months, providing a solid, forward-looking runway of work for commercial and industrial contractors.
This steady performance is mirrored across our geographic regions. While certain metropolitan hubs continue to experience vibrant annual cost growth, led by Honolulu at 5.93%, Phoenix at 5.30%, and Miami at 4.99%, other major cities are establishing an incredibly stable baseline, including Chicago at 1.42% and Dallas at 3.88%. In Canada, Alberta’s energy sector continues to thrive, driving major project investment and significant momentum in nonresidential construction over the last few years. Meanwhile, Ontario’s market remains resilient, bolstered by a 16% increase in public-sector spending on major infrastructure projects such as the Darlington Small Modular Reactor.
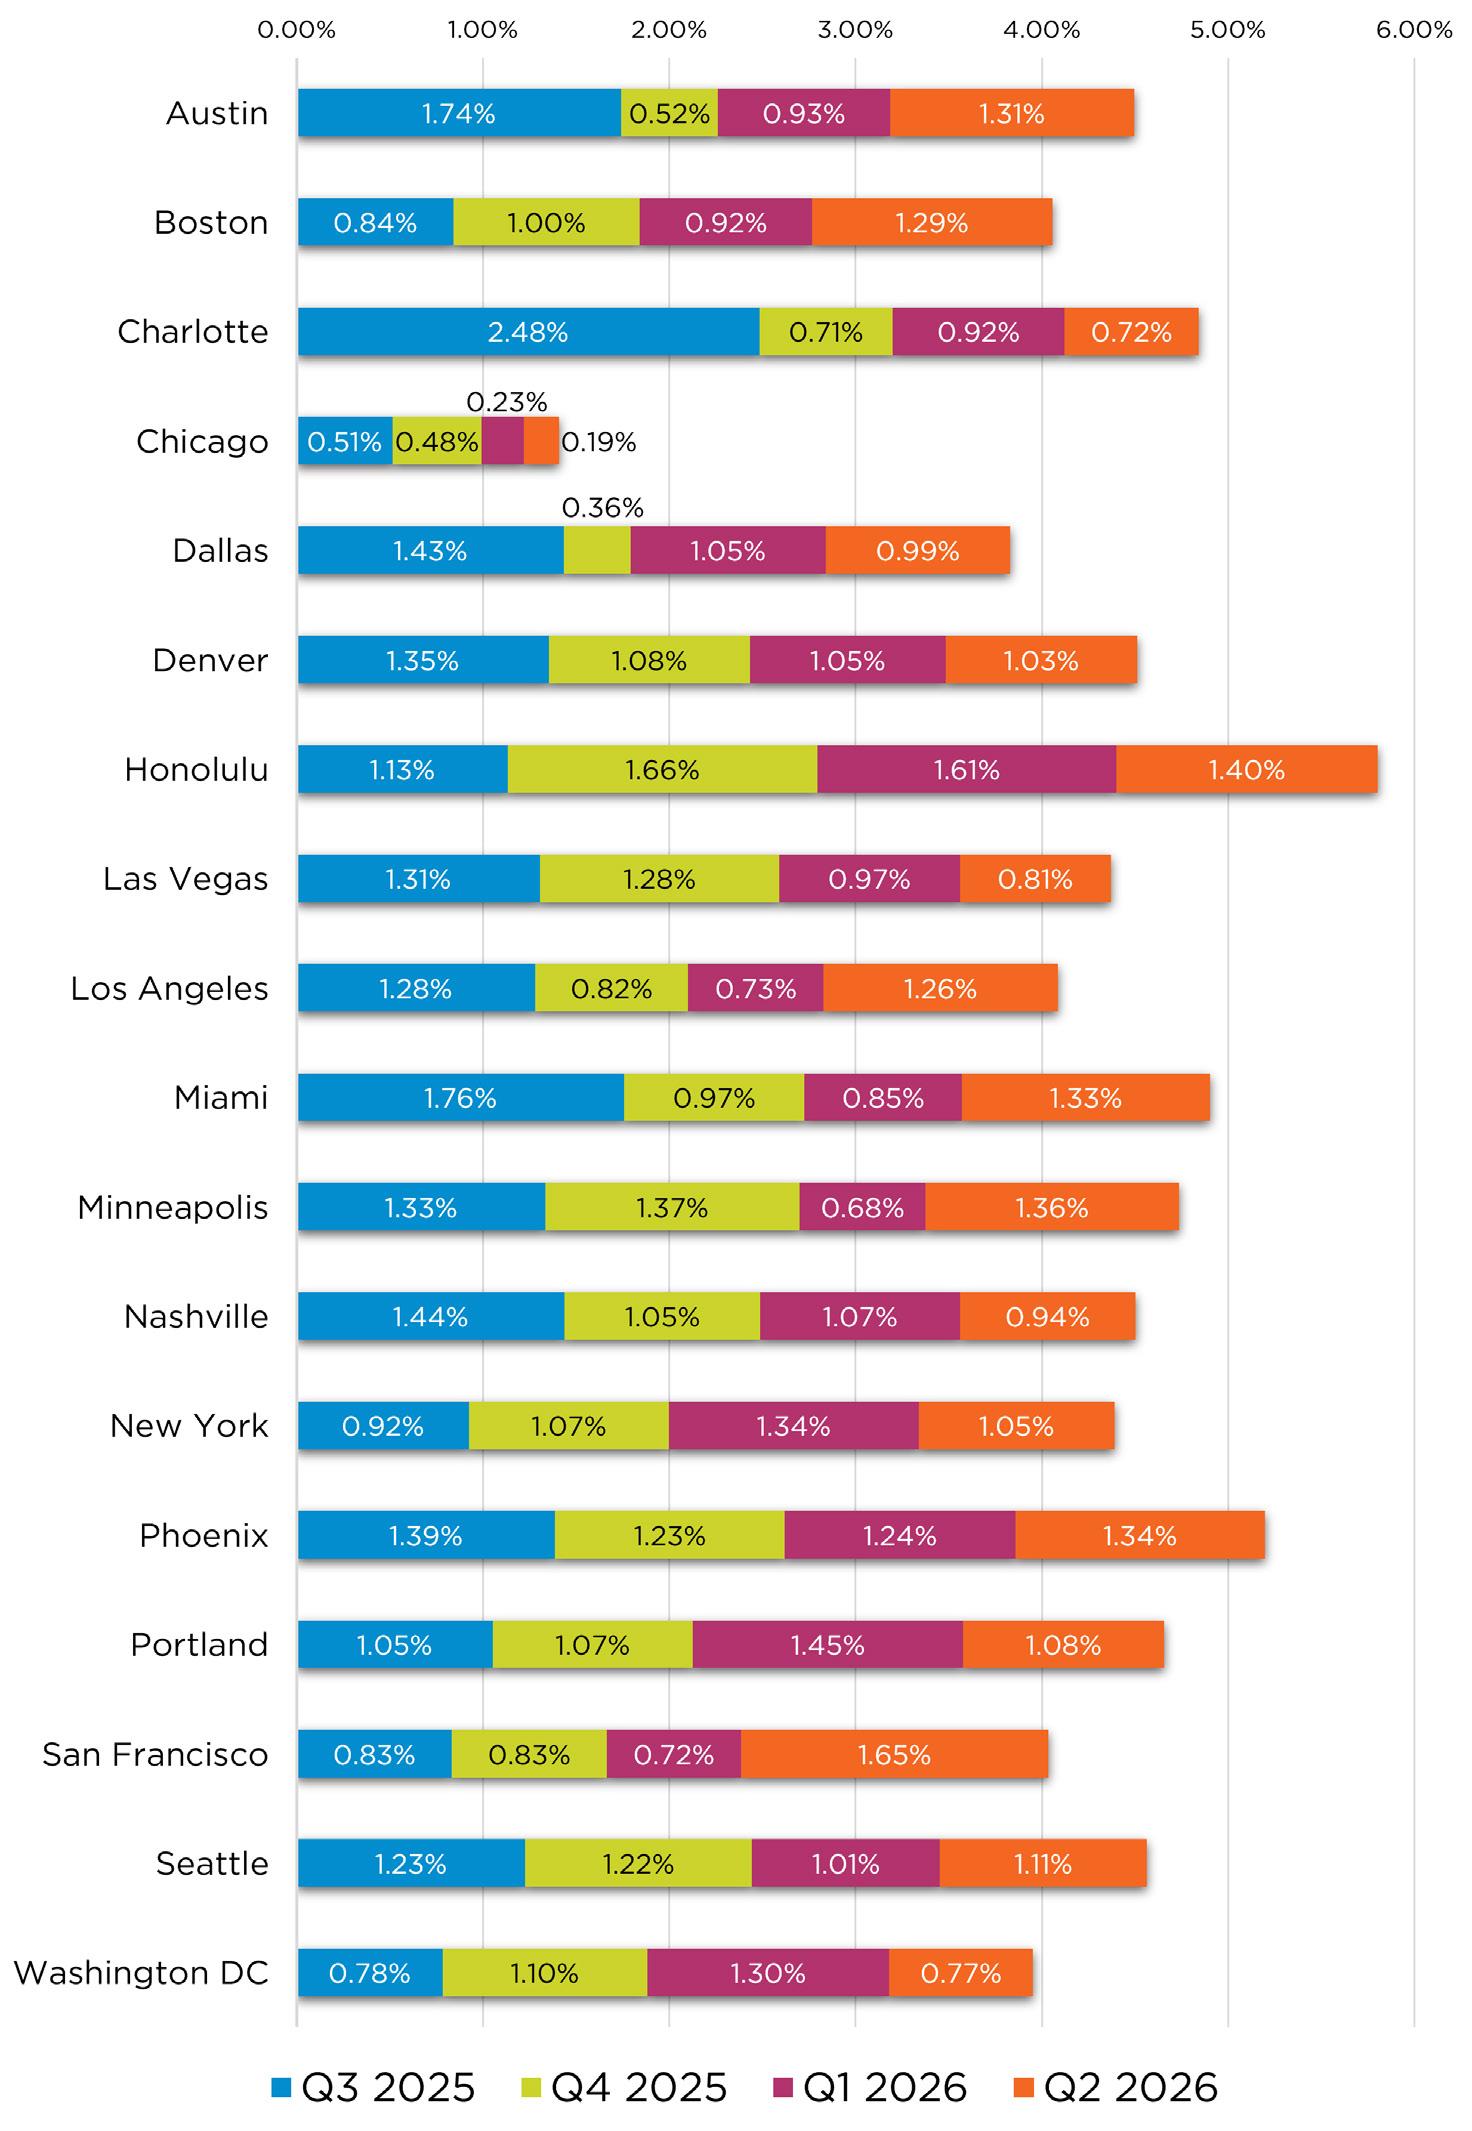
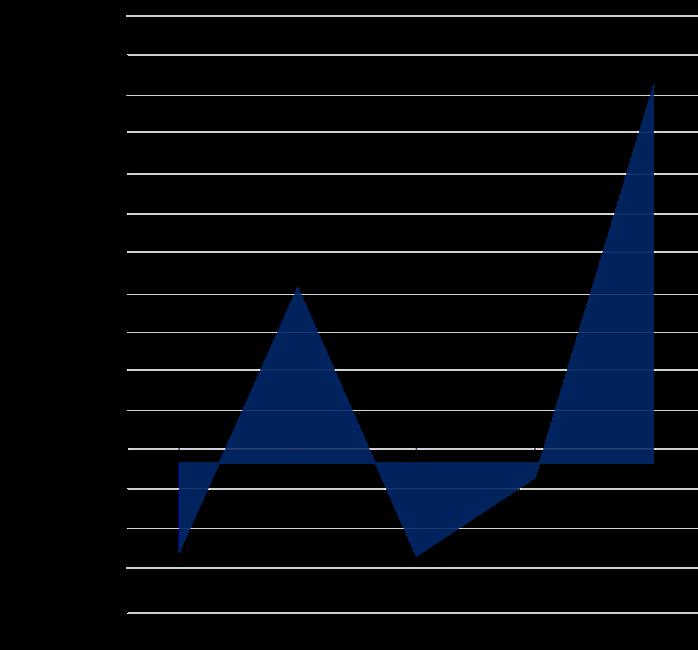
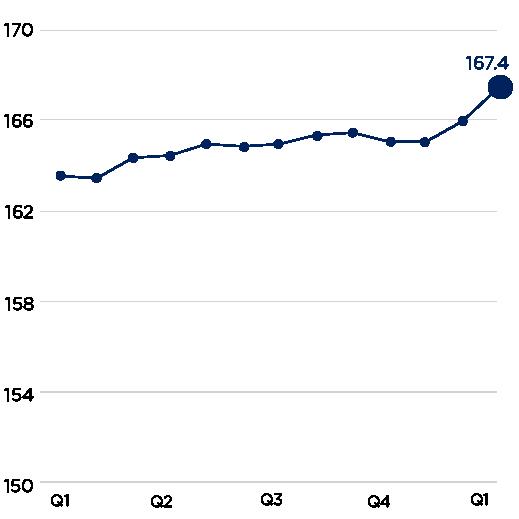
The national construction cost index rose to 288.58 this quarter, up from 285.47 in the first quarter. Escalation continues to move closer to a consistent, manageable quarterly increase of approximately 1%; a pacing that offers developers a somewhat predictable environment for budgeting and long-term capital planning compared to the volatile spikes of the past few years. However, true predictability remains relative, as nothing is completely definite given the fluid nature of current global economics, geopolitical conflicts, and shifting tariff policies.
While this consistency allows for more reliable projections, the industry continues to adapt to evolving global logistics. Current supply-side considerations are primarily centered around transportation and fuel costs rather than broader material or labor shortages. The redirection of global shipping lanes has introduced some upward pressure on energy prices and freight transit; a development that requires careful monitoring to prevent localized container delays down the road. Even with these factors, contractors across all size categories maintain an overwhelmingly positive sentiment and express high confidence in the construction industry’s outlook.
In a market defined by regional variation, project success relies on utilizing precise, hyper-local intelligence rather than broad national averages. By incorporating proactive project controls, optimizing procurement strategies early, and modeling for localized energy and transport trends, owners and developers can confidently advance their pipelines and secure budget certainty throughout the project lifecycle.
Welcome to the second quarter 2026 issue of the RLB Quarterly Cost Report! This issue contains data current to mid-Q2 2026.
$2,172.4 billion 0.4% Above 0.9% Above
According to the U.S. Department of Commerce, construction-put-in-place during April 2026 was estimated at a seasonally adjusted annual rate of $2,172.4 billion which is the March estimate of $2,164.5 billion, and the April 2025 estimate of $2,153.4 billion.
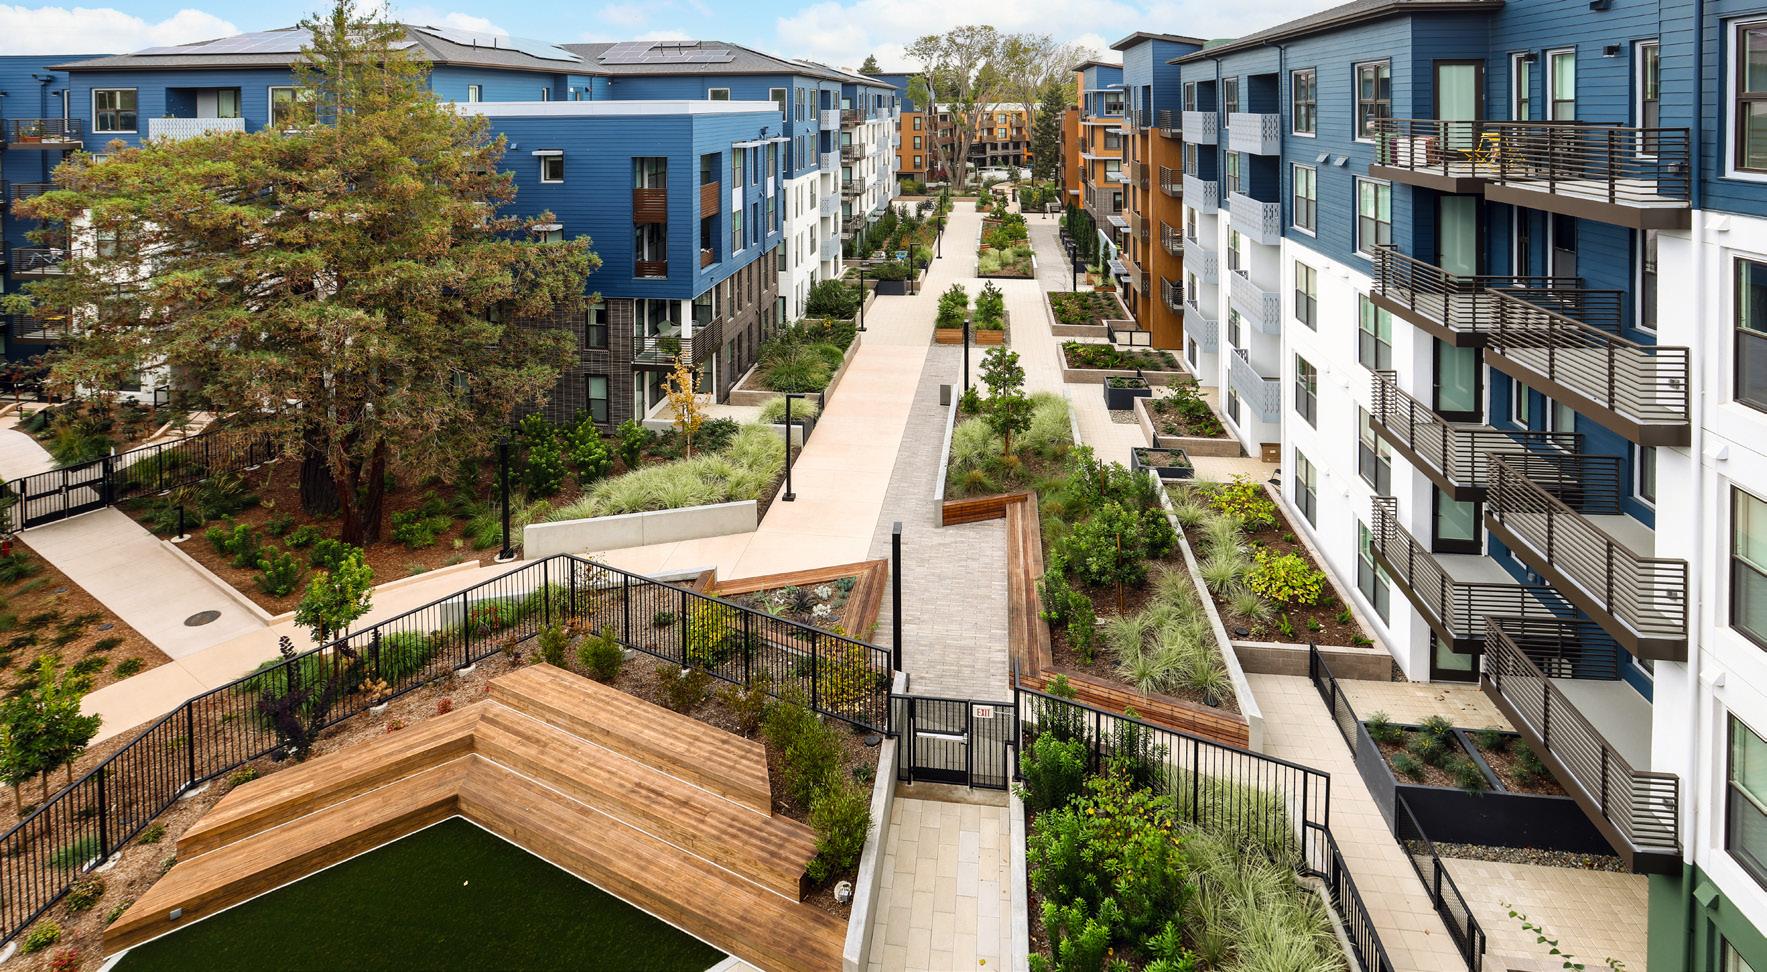
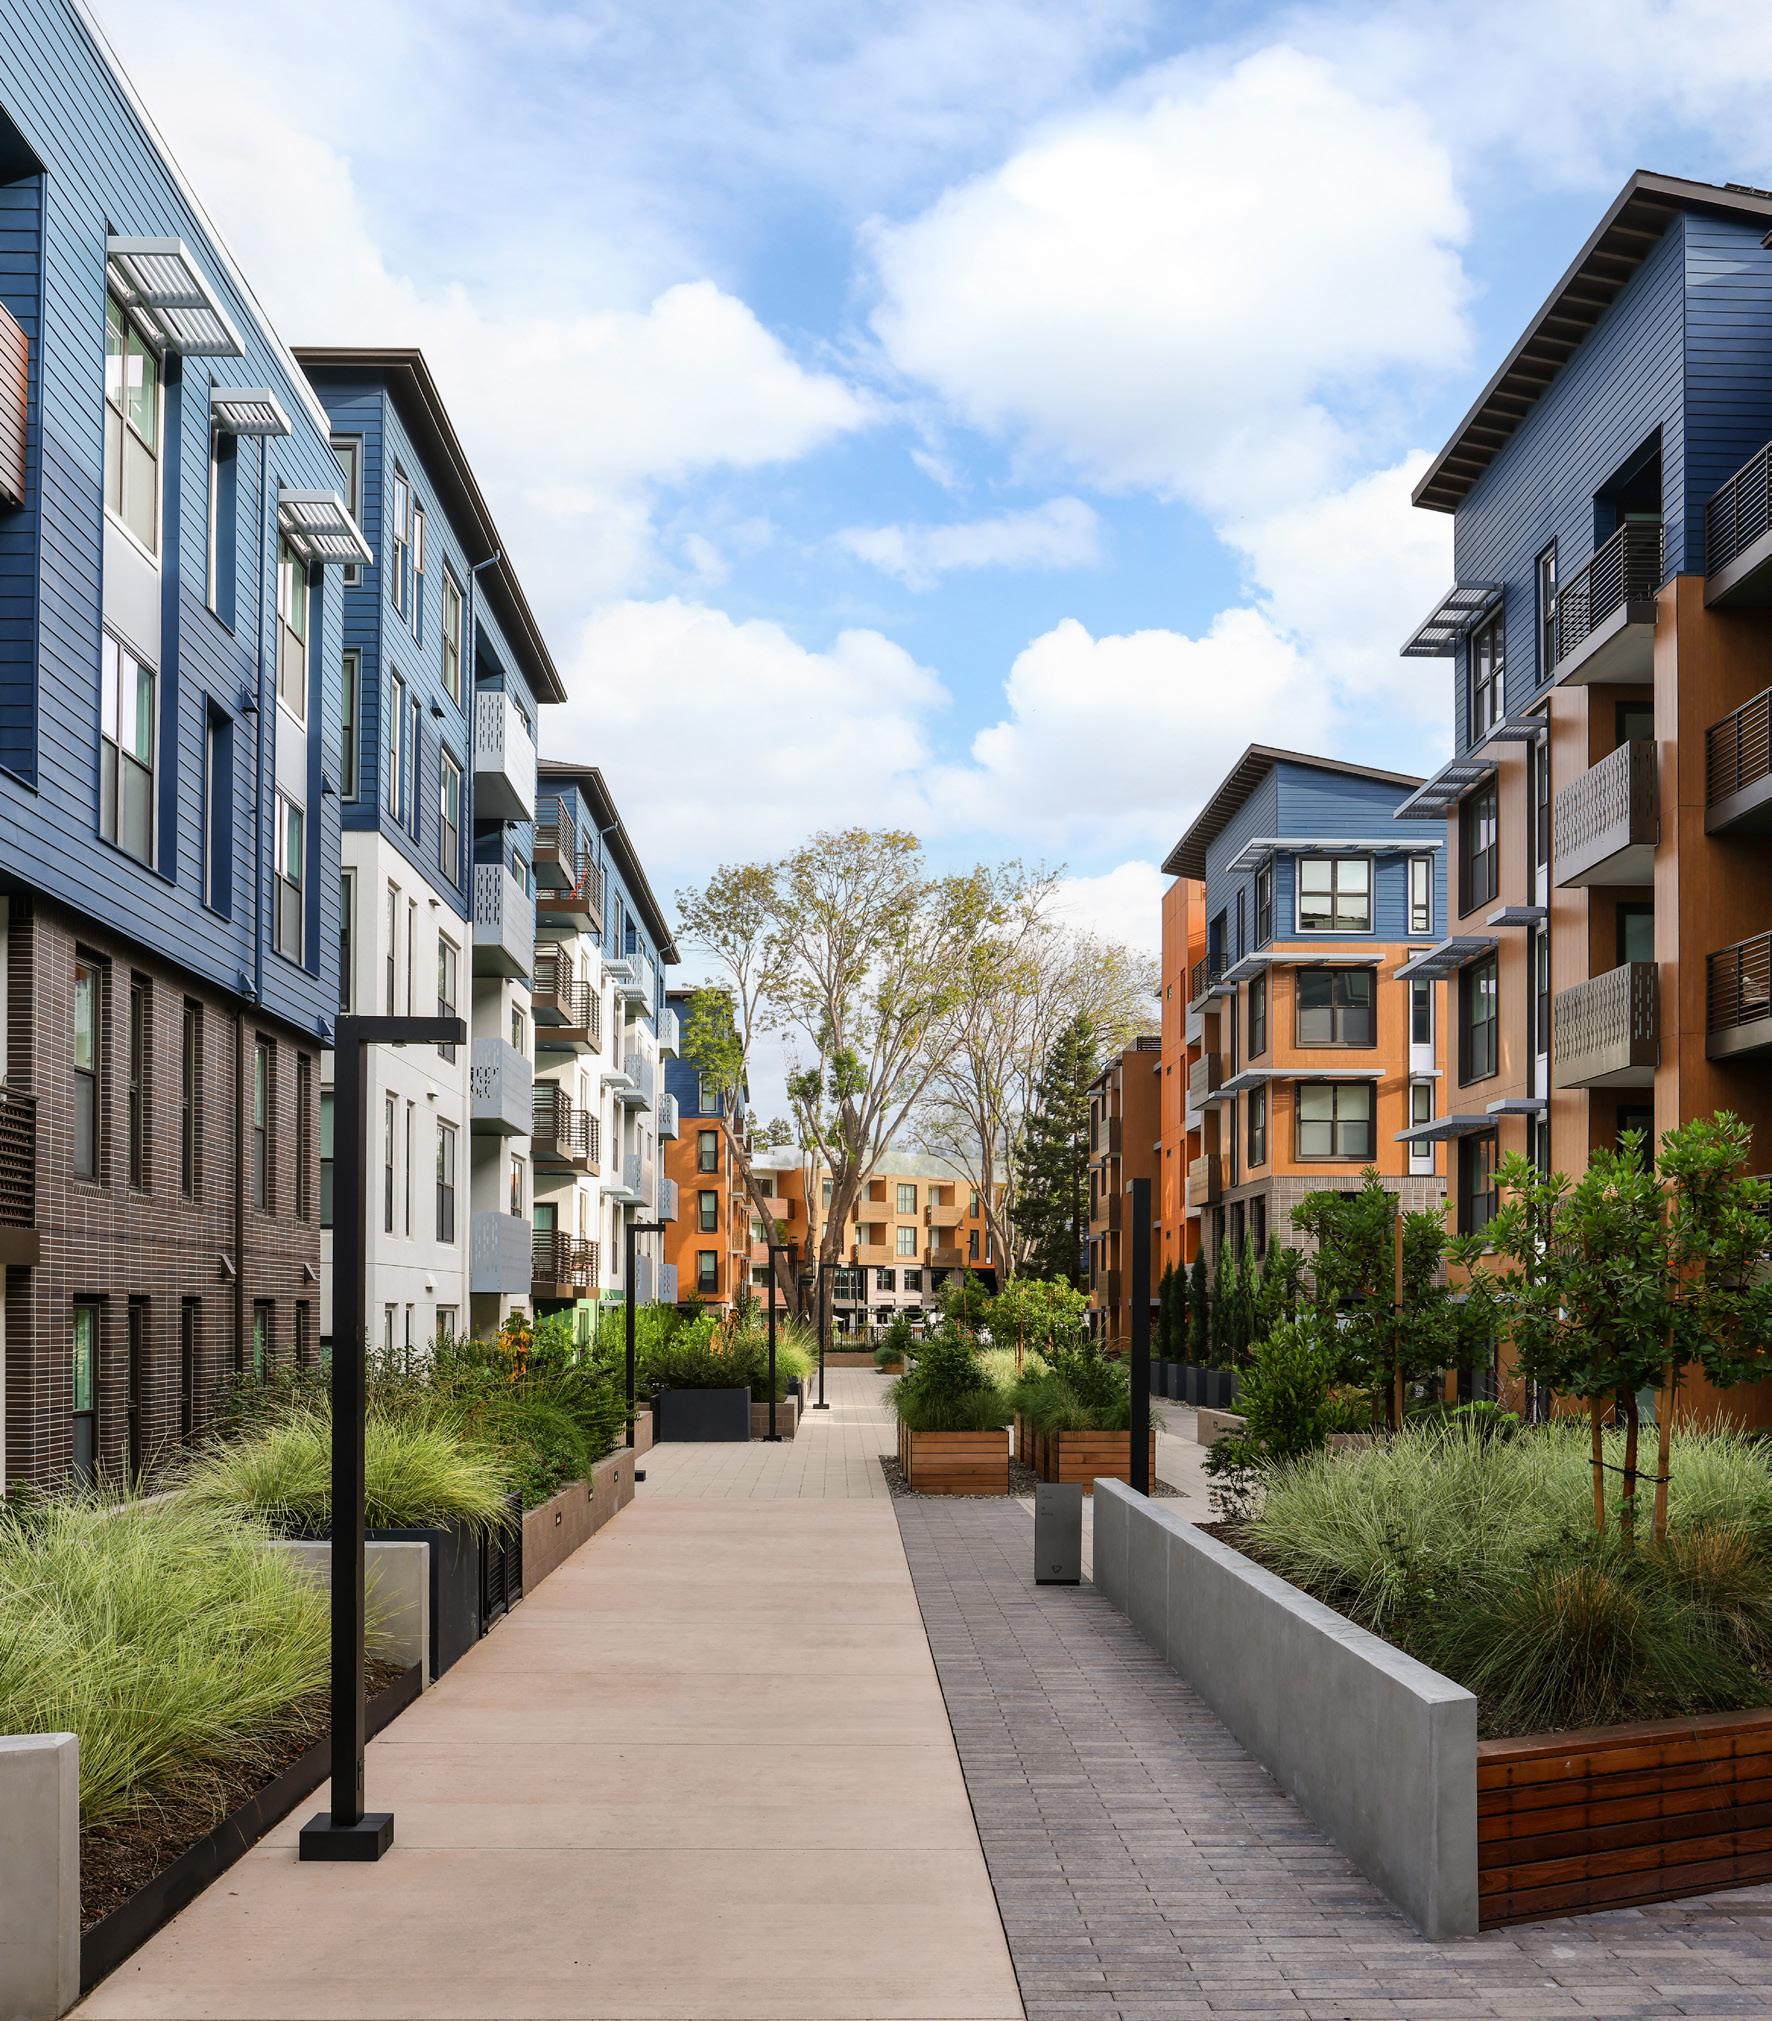
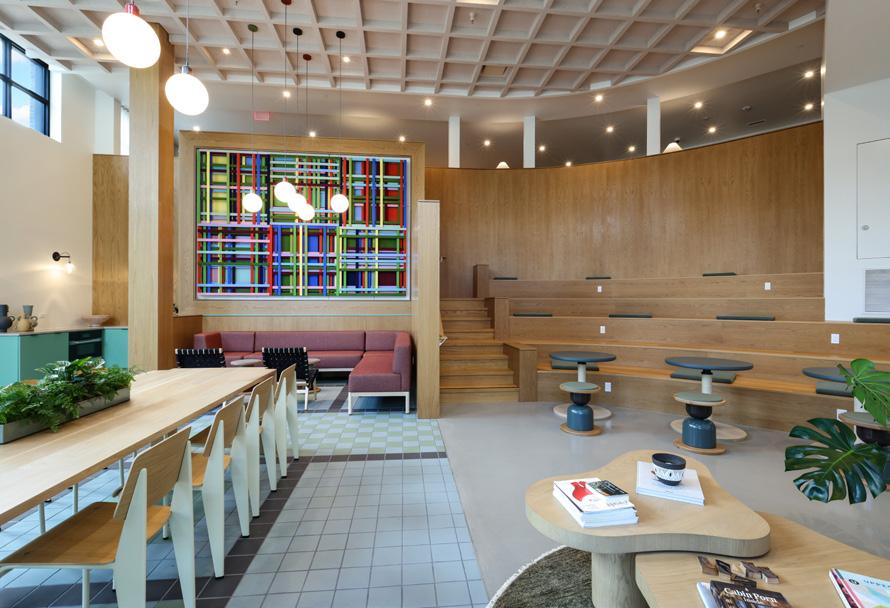
Located in the heart of Silicon Valley, The Sevens is a large-scale residential development addressing California’s housing shortage while creating a vibrant, connected community. The award-winning, nearly 10-acre project delivers 716 apartment units across three five-story buildings, integrating landscaped courtyards, open space, and pedestrian-friendly paseos. Its design carefully balances density with neighborhood context, creating a cohesive, amenity-rich environment that supports both social interaction and everyday living.
Strategically positioned near major employment hubs and transit, the development provides a mix of market-rate and affordable housing. With two levels of subterranean parking totaling approximately 878 spaces and a GreenPoint Platinum certification, the project reflects a strong commitment to sustainability through environmentally responsible design and preservation of heritage trees.
Rider Levett Bucknall provided cost estimating and management services from early preconstruction through completion, supporting an international client in their first U.S. development. RLB guided procurement, budgeting, and reporting while navigating challenges including the pandemic, inflation, and material cost volatility. Through proactive cost control and continuous performance monitoring, RLB maintained budget certainty, with a final variance of just 1.6%, while keeping the project on schedule.
RLB’s combination of global expertise and local market knowledge was key to delivering this complex development, helping set a benchmark for quality, sustainability, and community-focused design in the Bay Area.
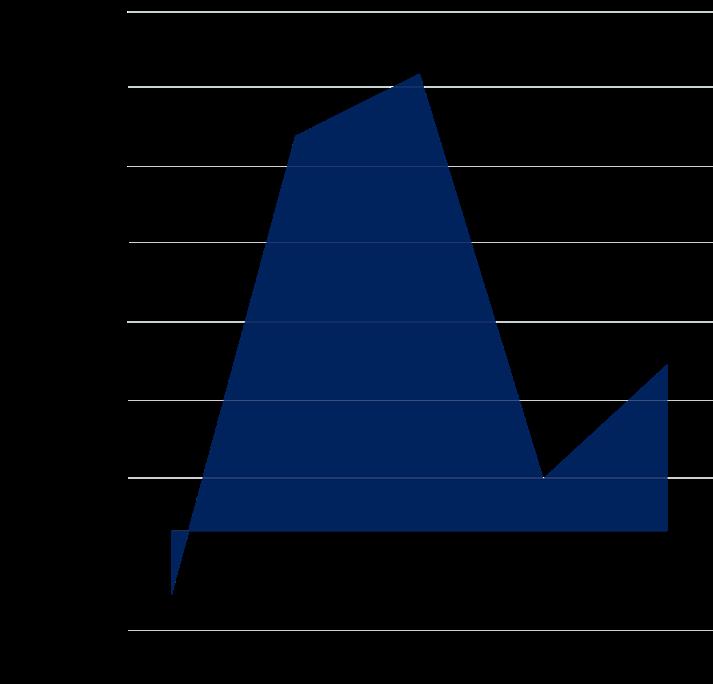
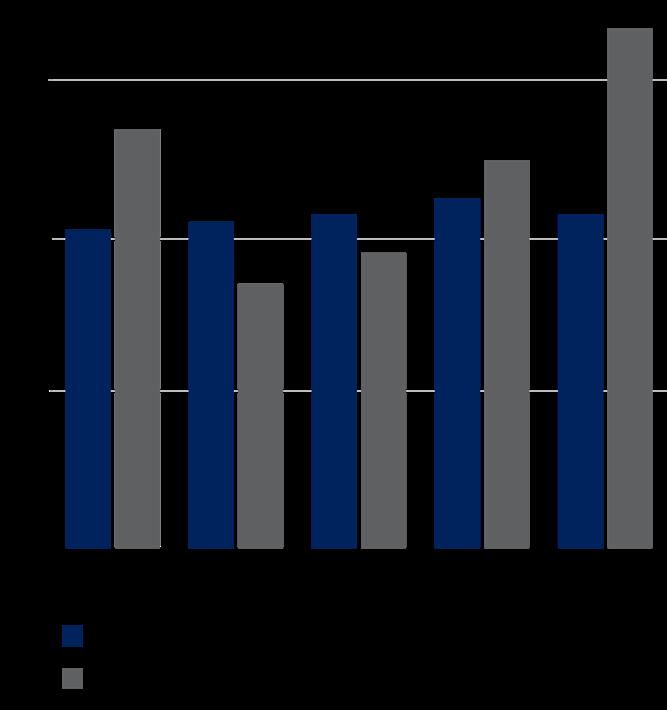
GDP represented in percent change from the preceding quarter, seasonally adjusted at annual rates. CPI figures represent the monthly value at the end of the quarter. ABI is derived from a monthly American Institute of Architects survey of architectural firms of their work on the boards, reported at the end of the period. Construction Put-in-Place figures represent total value of construction dollars in billions spent at a seasonally adjusted annual rate taken at the end of each quarter. General Unemployment rates are based on the total population 16 years and older. Construction Unemployment rates represent only the percent of experienced private wage and salary workers in the construction industry 16 years and older. National unemployment rates are seasonally adjusted, reflecting the average of a threemonth period.
* Adjustments made to GDP based on amended changes from the Bureau of Economic Analysis.
Sources: U.S. Bureau of Labor Statistics, Bureau of Economic Analysis, American Institute of Architects. Gross Domestic Product* (GDP)
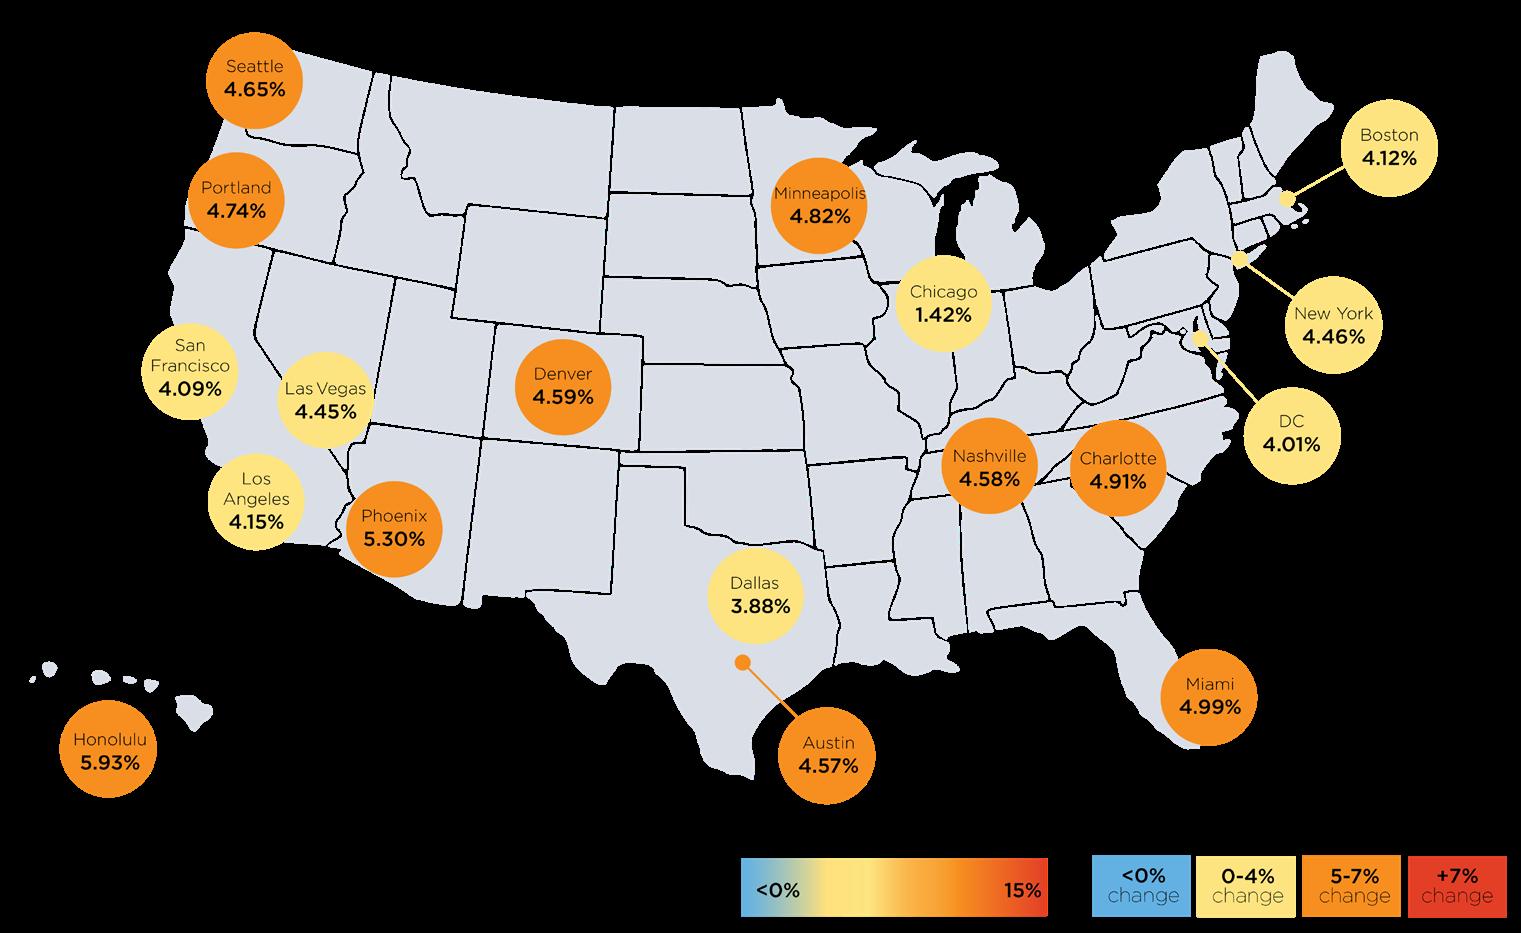
Comparative Cost Map Indicates percentage change between April 2025 to April 2026.
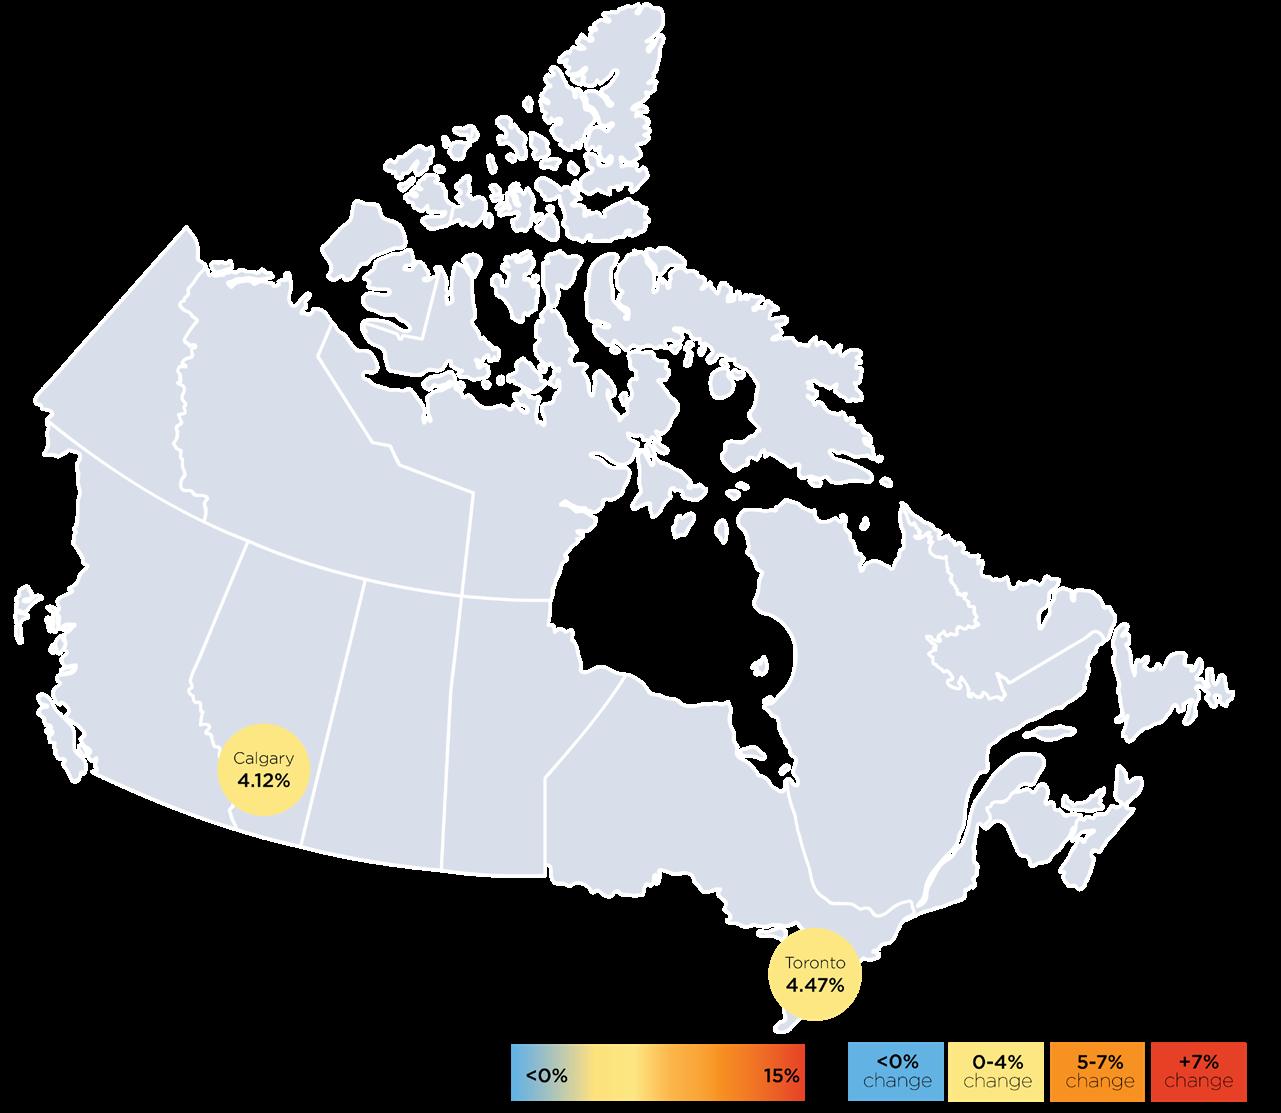
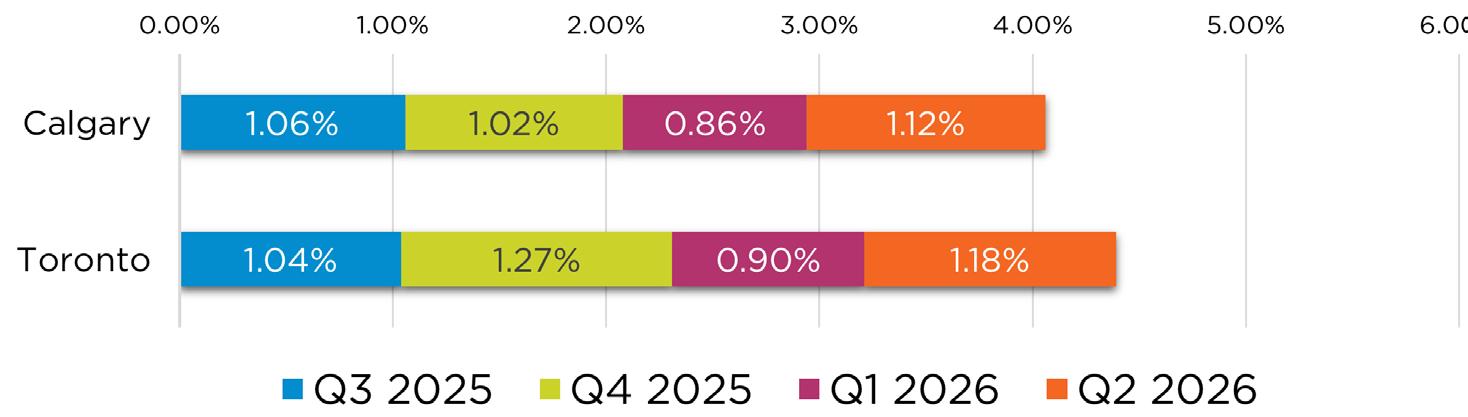
Alberta’s economy is outperforming the rest of Canada, with growth now projected at 2.7% this year, up from an earlier forecast of 2%, driven largely by higher energy prices following the Middle East conflict. Elevated oil prices have boosted energy sector confidence and production, while also strengthening the province’s fiscal position. However, benefits are unevenly distributed outside the energy sector, with housing starts declining from a peak of 55,000 to 47,000 annually. Despite this, annual figures are expected to remain well above pre-pandemic levels, particularly for single-family homes. On the nonresidential side, major project investment is surging, with non-residential construction up 22% year over year, and this momentum is expected to continue even if energy prices soften. At the end of Q1 2026, Alberta’s capital projects under construction totaled over $78.9 billion, an increase from $73.3 billion the previous year. The industrial sector led with 39.0% of projects, followed by infrastructure at 20.2%. The oil and gas and institutional sectors accounted for 8.6% each, while the residential, Tourism/Recreation, and Mixed-Use sectors contributed approximately $4.4 billion each. The growth in these projects is expected to bolster employment and real GDP in 2026 and beyond.
Ontario’s industrial, commercial, and institutional (ICI) building permits reached $2.38 billion at the end of Q1 2026, driven largely by industrial construction, with Toronto contributing about 83% of the value. Although ICI permit values decreased by 9% from Q4 2025, they exceeded Q1 2025 levels. Toronto’s values fell by 2.5%, while Hamilton saw a 118% increase to $274 million, largely due to commercial projects. Industrial construction made up around 48% of total permit value. The outlook for Ontario’s ICI market in 2026 is positive, supported by a 6% rise in project investment, despite challenges with uncertainty and labor availability, which have eased somewhat recently. Homebuilding in Ontario is anticipated to remain modest this year due to low housing demand, reflected in the GTA’s pre-construction sales reaching multiyear lows. However, non-residential investments are expected to stabilize construction in 2026, bolstered by a 16% increase in public sector spending driven by projects like the Darlington Small Modular Reactor.

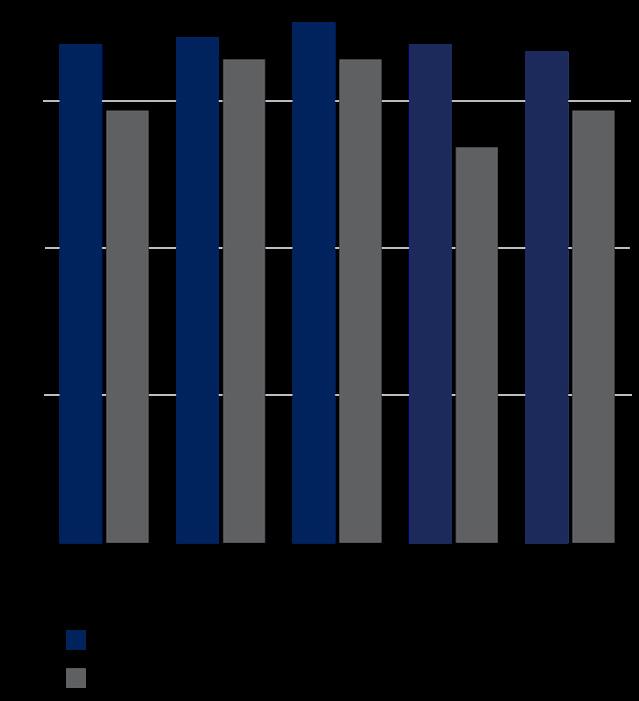
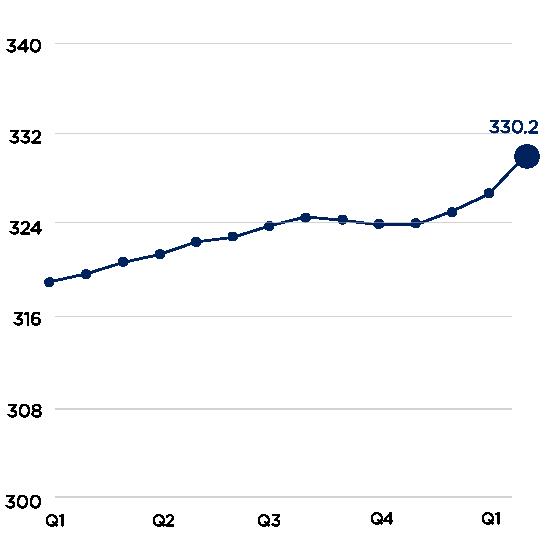
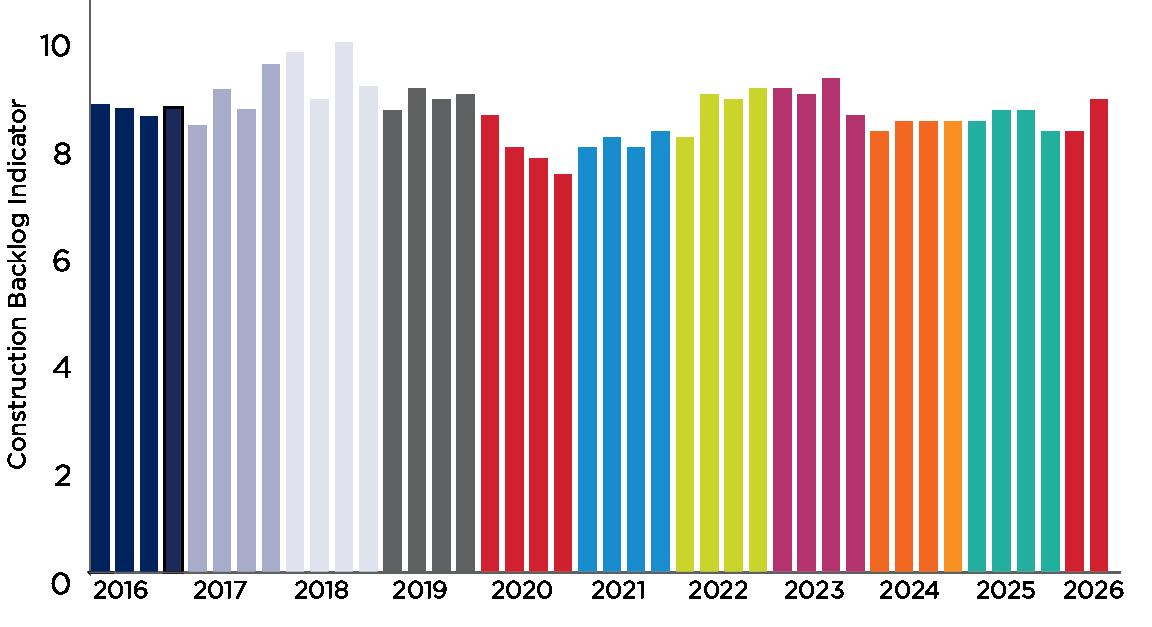
The chart on the adjacent page shows the average construction backlog in months, by quarter, as represented by the Associated Builders and Contractors, Inc. Construction Backlog Indicator (CBI).
The CBI is a national economic indicator that reflects the amount of work that will be performed by commercial and industrial contractors in the months ahead. This national economic data set offers a level of specificity focused on the U.S. commercial and institutional, industrial, and infrastructure construction industries.
The indicator rose to 8.8 months in Q2 2026, up 0.2 months from Q2 2025. The construction industry’s backlog surge is largely driven by data center projects, but the benefits are unevenly distributed. Large contractors with over $100M in annual revenue are far more likely to be involved in data center work (42%) than smaller firms (7%), and those working on data centers enjoy significantly longer backlogs (12.2 months vs. 8.3 months), highlighting a growing divide within the sector.
Contractors across all size categories continue to express confidence in the construction industry’s outlook, even in the face of several potential headwinds. Notwithstanding varying levels of project backlogs, challenges such as
rising
costs have failed to dampen the positive sentiment among contractors.
and increasing
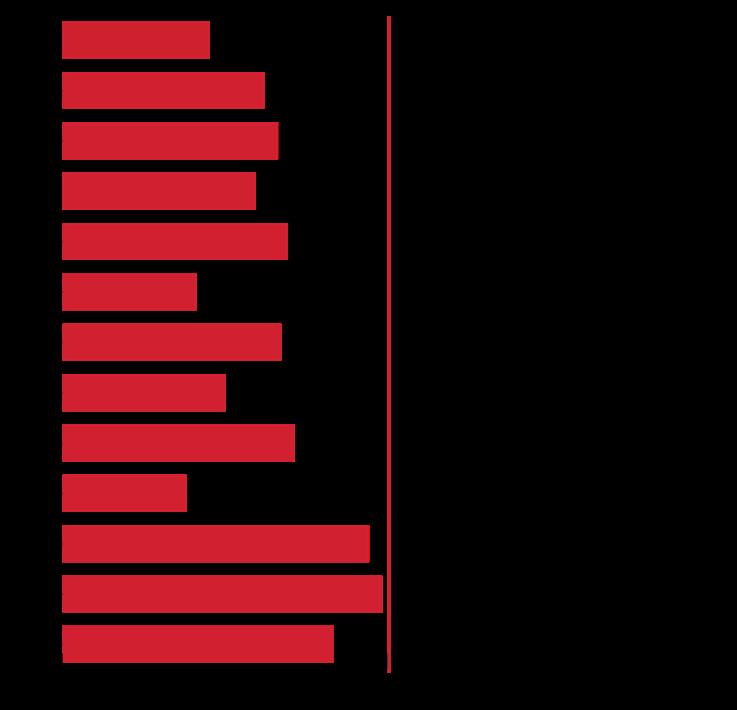
The data in the chart below represents estimates of current building costs in each respective market. Costs may vary as a consequence of factors such as site conditions, climatic conditions, standards of specification, market conditions, etc. Values of U.S. locations represent hard construction costs based on U.S. dollars per square foot of gross floor area, while values of Canadian locations represent hard construction costs based on Canadian dollars per square foot.
AUSTIN
Phone: +1 512 325 3966
E-mail: AUS@us.rlb.com
Contact: Melissa Jones
BOSTON
Phone: +1 617 737 9339
E-mail: BOS@us.rlb.com
Contact: Michael O’Reilly
CALGARY
Phone: +1 403 571 0505
E-mail: YYC@ca.rlb.com
Contact: Himanshu Bhagat
CHARLOTTE
Phone: +1 336 926 2550
E-mail: CLT@us.rlb.com
Contact: Matthew Rizzo
CHICAGO
Phone: +1 312 819 4250
E-mail: ORD@us.rlb.com
Contact: Warren Todd
DALLAS
Phone: +1 808 383 7944
E-mail: DFW@us.rlb.com
Contact: Kevin Mitchell
DENVER
Phone: +1 720 904 1480
E-mail: DEN@us.rlb.com
Contact: Jordan Miller
HILO
Phone: +1 808 934 7953
E-mail: ITO@us.rlb.com
Contact: Wrindy Damo
HONOLULU
Phone: +1 808 521 2641
E-mail: HNL@us.rlb.com
Contact: Erin Kirihara Cassie Idehara
KANSAS CITY
Phone: +1 808 383 5244
E-mail: MCI@us.rlb.com
Contact: Paul Brussow
KONA
Phone: +1 808 883 3379
E-mail: KOA@us.rlb.com
Contact: Wrindy Damo
LAS VEGAS
Phone: +1 702 227 8818
E-mail: LAS@us.rlb.com
Contact: Kevin Mitchell
LOS ANGELES
Phone: +1 213 689 1103
E-mail: LAX@us.rlb.com
Contact: TJ McNulty
MAUI
Phone: +1 808 875 1945
E-mail: OGG@us.rlb.com
Contact: Paul Belshoff
MIAMI
Phone: +1 305 924 6531
E-mail: MIA@us.rlb.com
Contact: Charles O’Loughlin
MINNEAPOLIS
Phone: +1 480 349 1280
E-mail: MSP@us.rlb.com
Contact: Jesse Zunke
NASHVILLE
Phone: +1 615 739 2254
E-mail: BNA@us.rlb.com
Contact: Chris Willis
NEW YORK
Phone: +1 646 821 4788
E-mail: NYC@us.rlb.com
Contact: David Eivers
ORLANDO
Phone: +1 602 443 4848
Email: MCO@us.rlb.com
Contact: Michael Godoy
PHOENIX
Phone: +1 602 443 4848
E-mail: PHX@us.rlb.com
Contact: Paul Brussow
Scott Macpherson
John Jozwick
Scott Sumners
Joel Brown
PORTLAND
Phone: +1 503 226 2730
E-mail: PDX@us.rlb.com
Contact: Daniel Junge
SAN FRANCISCO
Phone: +1 415 362 2613
E-mail: SFO@us.rlb.com
Contact: Brian Schroth
SEATTLE
Phone: +1 206 441 8872
E-mail: SEA@us.rlb.com
Contact: Scott Macpherson
SAINT LUCIA
Phone: +1 758 452 2125
E-mail: UVF@us.rlb.com
Contact: David Piper
TORONTO
Phone: +1 905 827 8218
E-mail: YYZ@us.rlb.com
Contact: Himanshu Bhagat
Franco Lora
TUCSON
Phone: +1 520 777 7581
E-mail: TUS@us.rlb.com
Contact: Josh Marks
WASHINGTON, DC
Phone: +1 410 740 1671
E-mail: DCA@us.rlb.com
Contact: Paraic Morrissey
AMERICAS ALLIANCE
BOGOT Á, COLOMBIA
Phone: +1 602 443 4848
E-mail: info@us.rlb.com
Contact: Paul Brussow
MEXICO CITY, MEXICO
Phone: +1 602 443 4848
E-mail: info@us.rlb.com
Contact: Paul Brussow
VITÓRIA, BRAZIL
Phone: +1 602 443 4848
E-mail: info@us.rlb.com
Contact: Paul Brussow