

"The past twelve months illustrated a luxury real estate market that has entered a more sophisticated phase.
Buyers are active but selective. Sellers are engaged but strategic. Inventory has expanded, yet pricing remains resilient."
"The past twelve months illustrated a luxury real estate market that has entered a more sophisticated phase.
Buyers are active but selective. Sellers are engaged but strategic. Inventory has expanded, yet pricing remains resilient."
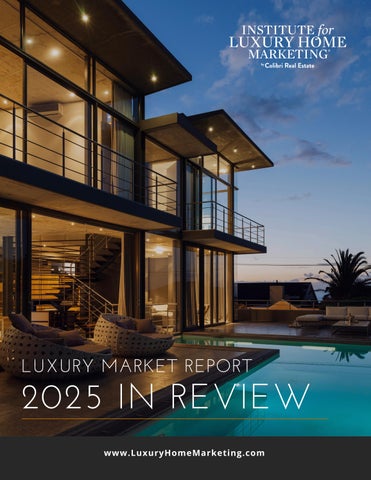
The Institute’s 2025 Luxury Market Year in Review gives insights into how the luxury market has performed during the year, along with reviewing the many opportunities that exist in this unique niche.
This resource will provide you with statistics and analysis for luxury single-family and attached homes for the past year, new preferences among the affluent, and interesting new trends, niche markets, as well as sources of potential opportunities in 2026!
Learn how to leverage data like this, along with many other successful techniques for breaking into the luxury market by registering for one of The Institute's Luxury Home Marketing training courses:
Welcome to 2026: In this review, we will break down the key events, trends, and insights from 2025, concluding with an outlook for the North American luxury real estate market in 2026.
The past year marked a clear transition for North America’s luxury real estate market, as it steadily moved away from being shaped by short-term volatility, particularly external influences, toward one grounded in mature, disciplined fundamentals.
Speculative momentum faded, replaced by a stronger emphasis on long-term value, lifestyle alignment, and strategic wealth preservation. Rather than experiencing broad-based growth or contraction, 2025 emerged as a year of balance and normalization.
Across both single-family and attached luxury properties, several defining themes took hold: expanding inventory, more deliberate behavior from buyers and sellers, modest yet durable price appreciation, and a widening performance gap between property types. These dynamics reflected a market that was recalibrating rather than correcting.
Overall, the market unfolded in phases. Early momentum gave way to mid-year caution, followed by renewed stability and an unexpectedly resilient finish. Taken together, these phases underscore a luxury sector no longer driven by urgency, but by intentional, well-informed decision-making on both sides of the transaction.
Sales activity began the year with notable strength. January immediately set a positive tone, with singlefamily luxury home sales rising 17.6% year-over-year and attached properties (condos and townhomes) up 12.7%. February and March reinforced this momentum, particularly for single-family homes, which consistently outperformed attached properties on a year-over-year basis.
As spring progressed into early summer, sales volumes moderated but did not collapse. Single-family transactions proved especially resilient, posting only minor year-over-year declines in April and May before regaining strength through June and July. Attached properties, however, showed greater sensitivity to macroeconomic uncertainty, financing conditions, and buyer hesitation, with sales softening more noticeably during the middle months of the year.
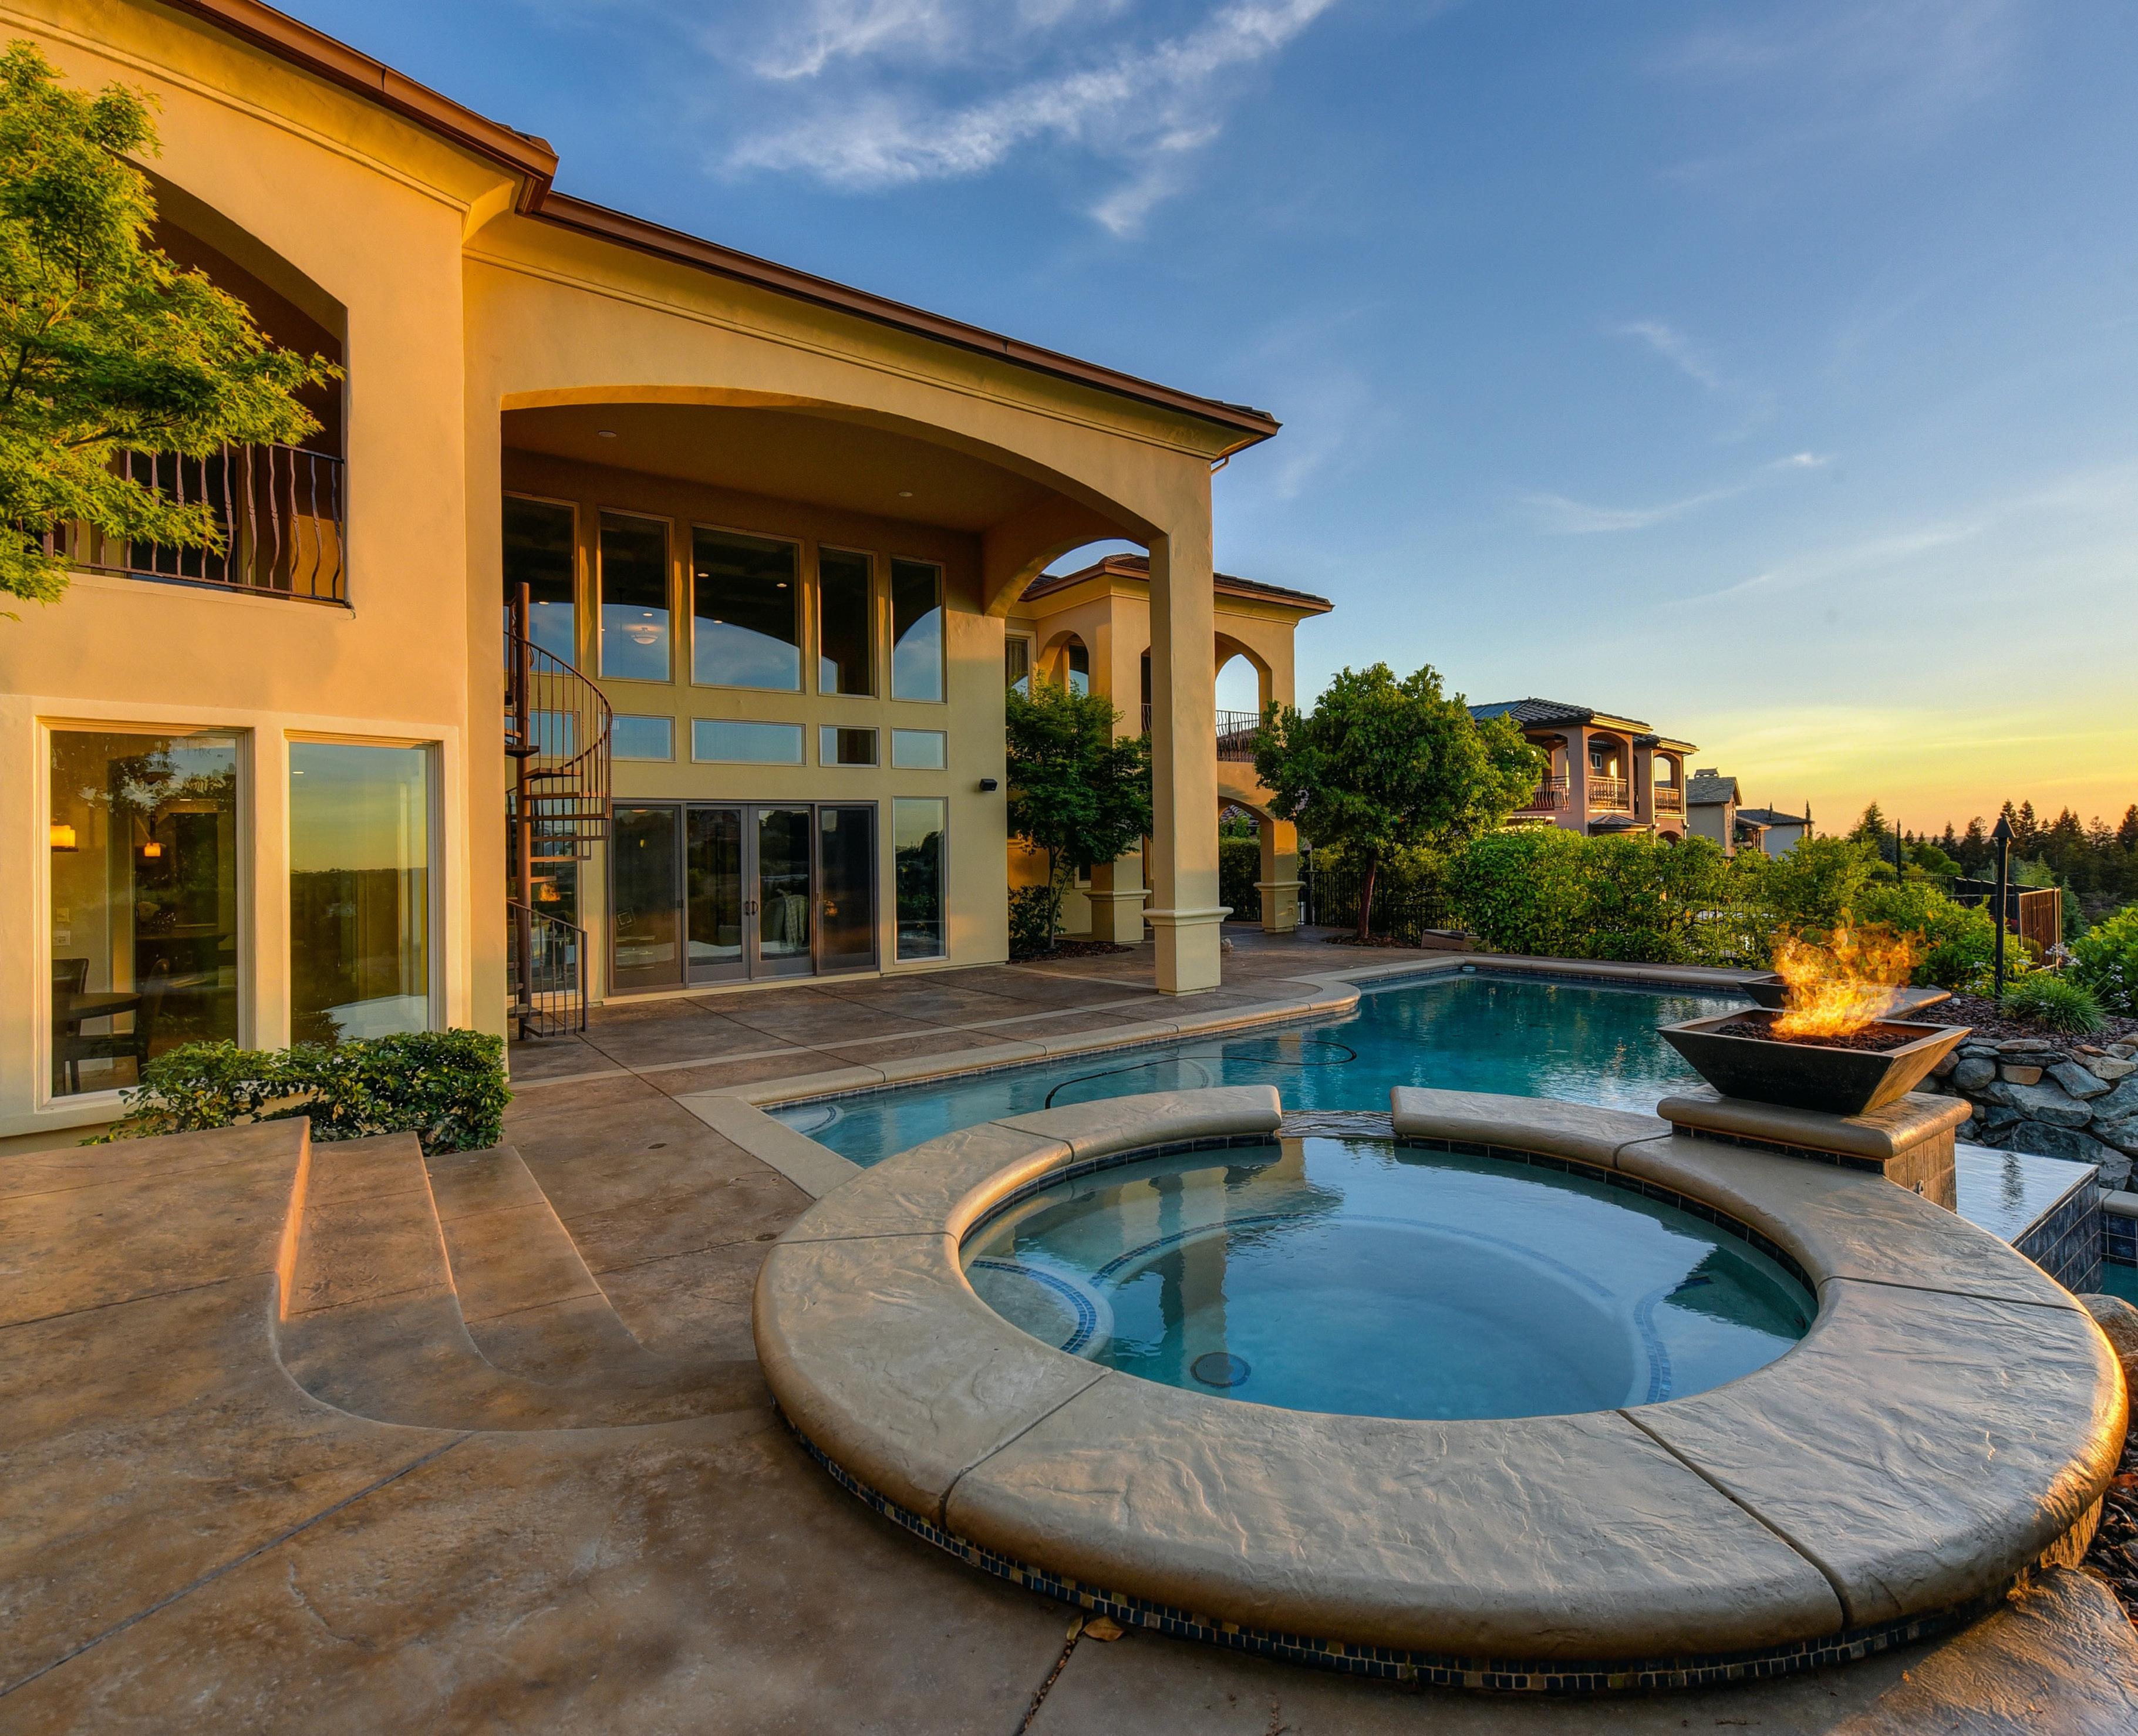
By late summer and early fall, a clearer pattern had emerged. Single-family luxury homes continued to attract demand rooted in lifestyle priorities such as privacy, space, flexibility, and long-term value, while attached properties faced a more price- and rate-sensitive buyer pool. Although the last four months of the year brought signs of an uptick in demand for attached homes, the overall sales volume for the year was not quite enough to offset earlier weakness.
The year closed with a decisive December rebound across both segments, confirming that demand remained intact. Even so, the cumulative outcome highlights the divergence: sold volume for single-family luxury homes finished the year up 5.9% yearover-year, while attached properties declined by 1.8%.
Price trends throughout the year reflected a market focused on sustainability rather than rapid appreciation. Median sold prices moved steadily higher in both segments, supported by disciplined pricing, limited distressed inventory, and buyers’ continued willingness to pay for quality.
Single-family luxury prices showed consistent strength, particularly in prime lifestyle and destination markets. Even as inventory expanded, pricing held firm, signaling that increased supply was largely absorbed without triggering downward pressure.
Attached properties followed a similar, though slightly more restrained, path. While certain months reflected sharper fluctuations, often driven by shifts in buyer composition rather than price erosion, the broader trend remained positive.
By year-end, median sold prices increased 1.5% for single-family and 1.1% for attached luxury homes, underscoring a market that continues to reward well-positioned properties.
One of the most significant developments of the year was the expansion of luxury inventory. From January onward, inventory levels rose consistently across both property types, giving buyers more choice and easing the intense competition that defined prior years.
Single-family inventory growth was particularly pronounced in the first half of the year, frequently exceeding 25% year-over-year, before tapering in late summer as seller caution re-emerged. Attached inventory followed a similar trajectory, though at slightly lower levels and with more pronounced midyear pullbacks.
Crucially, this was not a surge driven by homeowners forced to sell. Instead, it reflected confidence among homeowners who had waited for market conditions to stabilize. By December, inventory levels remained meaningfully higher than the prior year: up 21.2% for single-family homes and 17.6% for attached properties.
This expansion played a central role in rebalancing the market, lengthening time on market and shifting negotiations toward value-based decision-making rather than urgency.
While overall inventory rose, new listings told a more nuanced story. Early in the year, new inventory surged as sellers responded to pent-up demand and a decline in interest rates at the end of 2024. As the year progressed, however, new listings became increasingly uneven.
Periods of economic uncertainty, stock market volatility, and anticipation around interest rate movements led many sellers, particularly in the attached segment, to adopt a wait-and-see approach. This resulted in months where inventory continued to rise even as new listings slowed, reflecting carryover supply rather than fresh market participation.
This dynamic reinforced pricing discipline and helped prevent oversupply, especially for turnkey, highquality properties that continued to attract strong buyer interest.
One of the most consistent trends throughout 2025 was the strength of the ultra-high-end segment. Across both the United States and Canada, ultra-high-net-worth individuals remained largely insulated from interest rate volatility and macroeconomic uncertainty. Nine-figure transactions and swift action on trophy properties reinforced the enduring appeal of prime, scarce assets. Cash purchases dominated, allowing buyers to maintain liquidity and negotiating power while reinforcing luxury real estate’s role as a stable asset for wealth and legacy.
As the year progressed, a divergence within the luxury market became increasingly evident. While ultraluxury demand remained active, mid-tier luxury buyers grew more cautious, influenced by elevated borrowing costs, stock market volatility, and heightened sensitivity to opportunity cost.
This bifurcation created uneven momentum across price bands and property types, emphasizing that luxury real estate now functions as a series of distinct micro-markets. Homes aligned with modern expectations such as turnkey condition, strong location, lifestyle amenities, and long-term value, continued to transact, while properties lacking these attributes faced longer selling timelines and pricing pressure.
Regional divergence emerged as one of the defining narratives of 2025. In the U.S., tax-advantaged states such as Florida and Texas continued to attract inbound wealth, while portions of the Sun Belt and Mountain West transitioned toward more balanced conditions. Traditional gateway cities like New York and Los Angeles retained global relevance, though pricing power became increasingly location specific. Climate considerations, insurance costs, and long-term environmental risk also influenced buyer decisions, prompting renewed interest in lower-risk regions.
In Canada, luxury demand remained concentrated in Toronto, Vancouver, and Montreal, supported by immigration and chronic supply constraints. At the same time, Calgary stood out as a value-driven luxury market, drawing high-net-worth buyers seeking relative affordability without compromising lifestyle or quality.


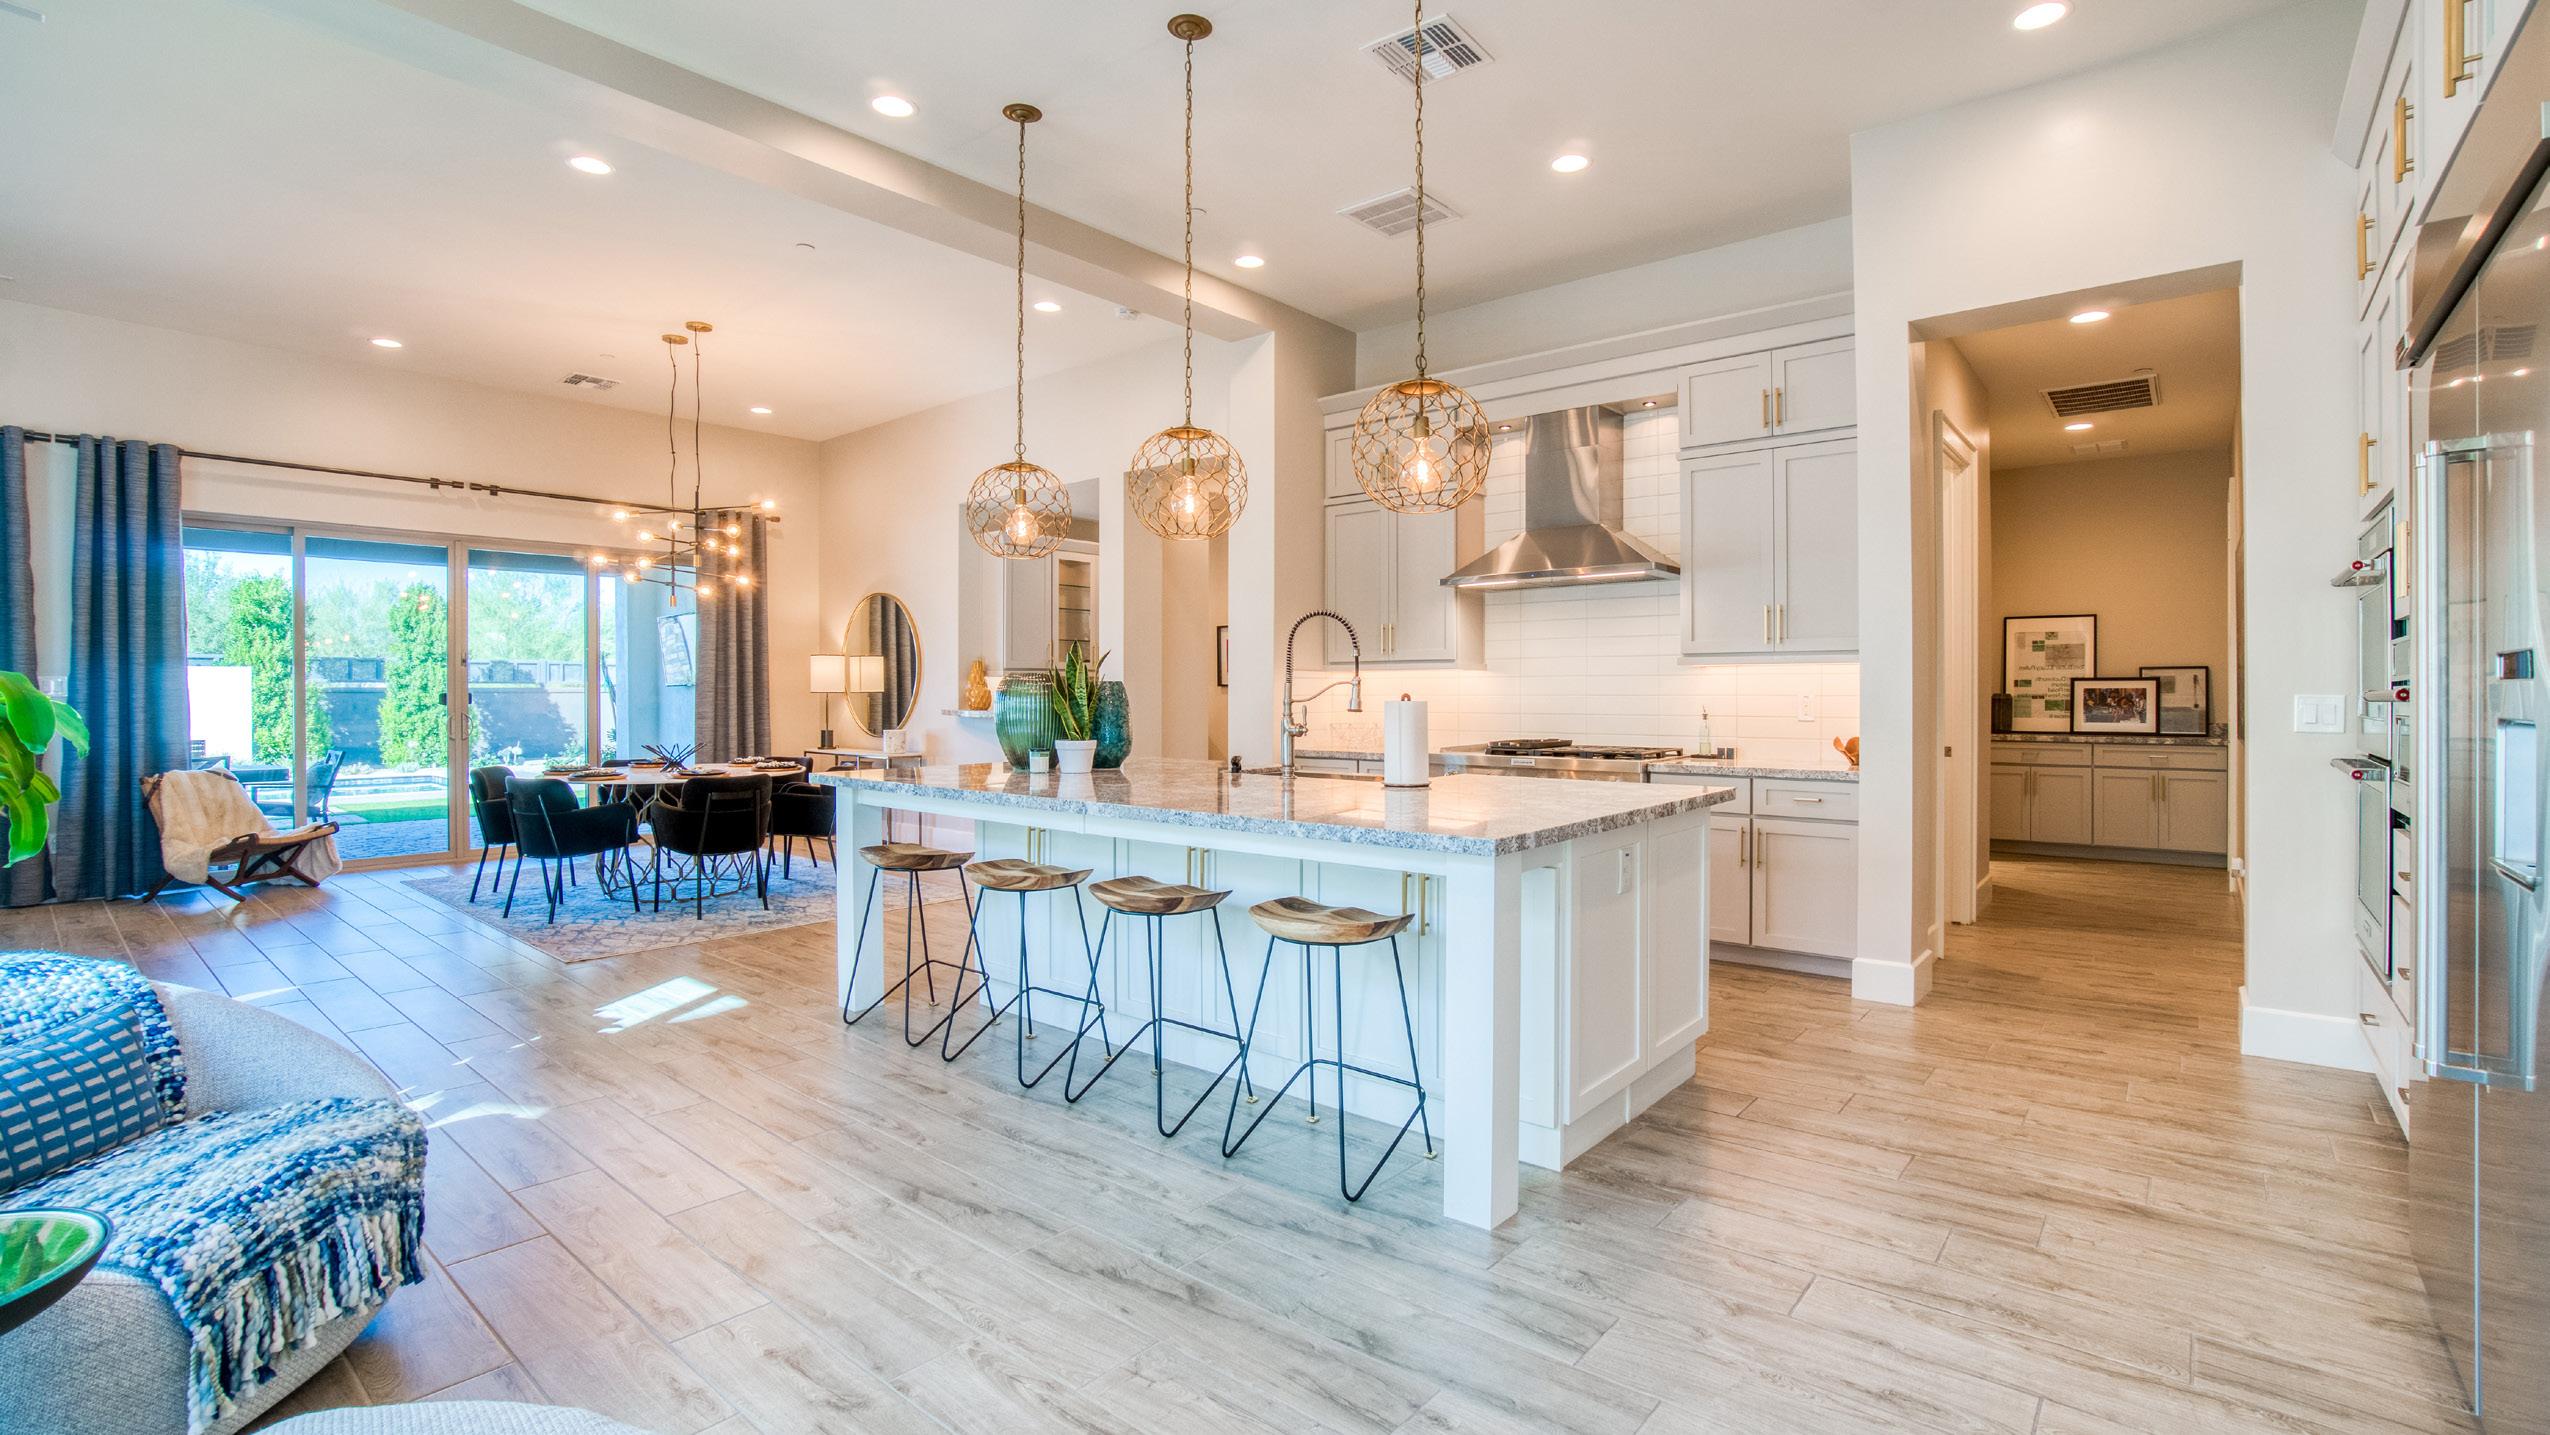
Demographic change played a central role in shaping buyer behavior throughout 2025. Affluent millennials and Gen X buyers gained influence, supported by peak earning years and the early phases of generational wealth transfer. These buyers approached luxury real estate through a dual lens of lifestyle enhancement and long-term asset strategy. Sustainability, wellness, smart-home technology, and flexibility for hybrid work and multigenerational living became baseline expectations rather than optional features.
The growing presence of affluent female buyers further reinforced demand for security, functionality, and resale resilience, adding another layer of sophistication to buyer preferences and decision-making.
Interest rates and financial markets influenced behavior more than they constrained activity. Rate cuts throughout 2025 improved confidence, even as borrowing costs remained elevated by historical standards.
For luxury buyers, rates primarily affected timing and psychology rather than purchasing power. Stock market volatility encouraged a more analytical approach to real estate, reinforcing its role as a stabilizing asset within diversified portfolios rather than a vehicle for rapid appreciation.
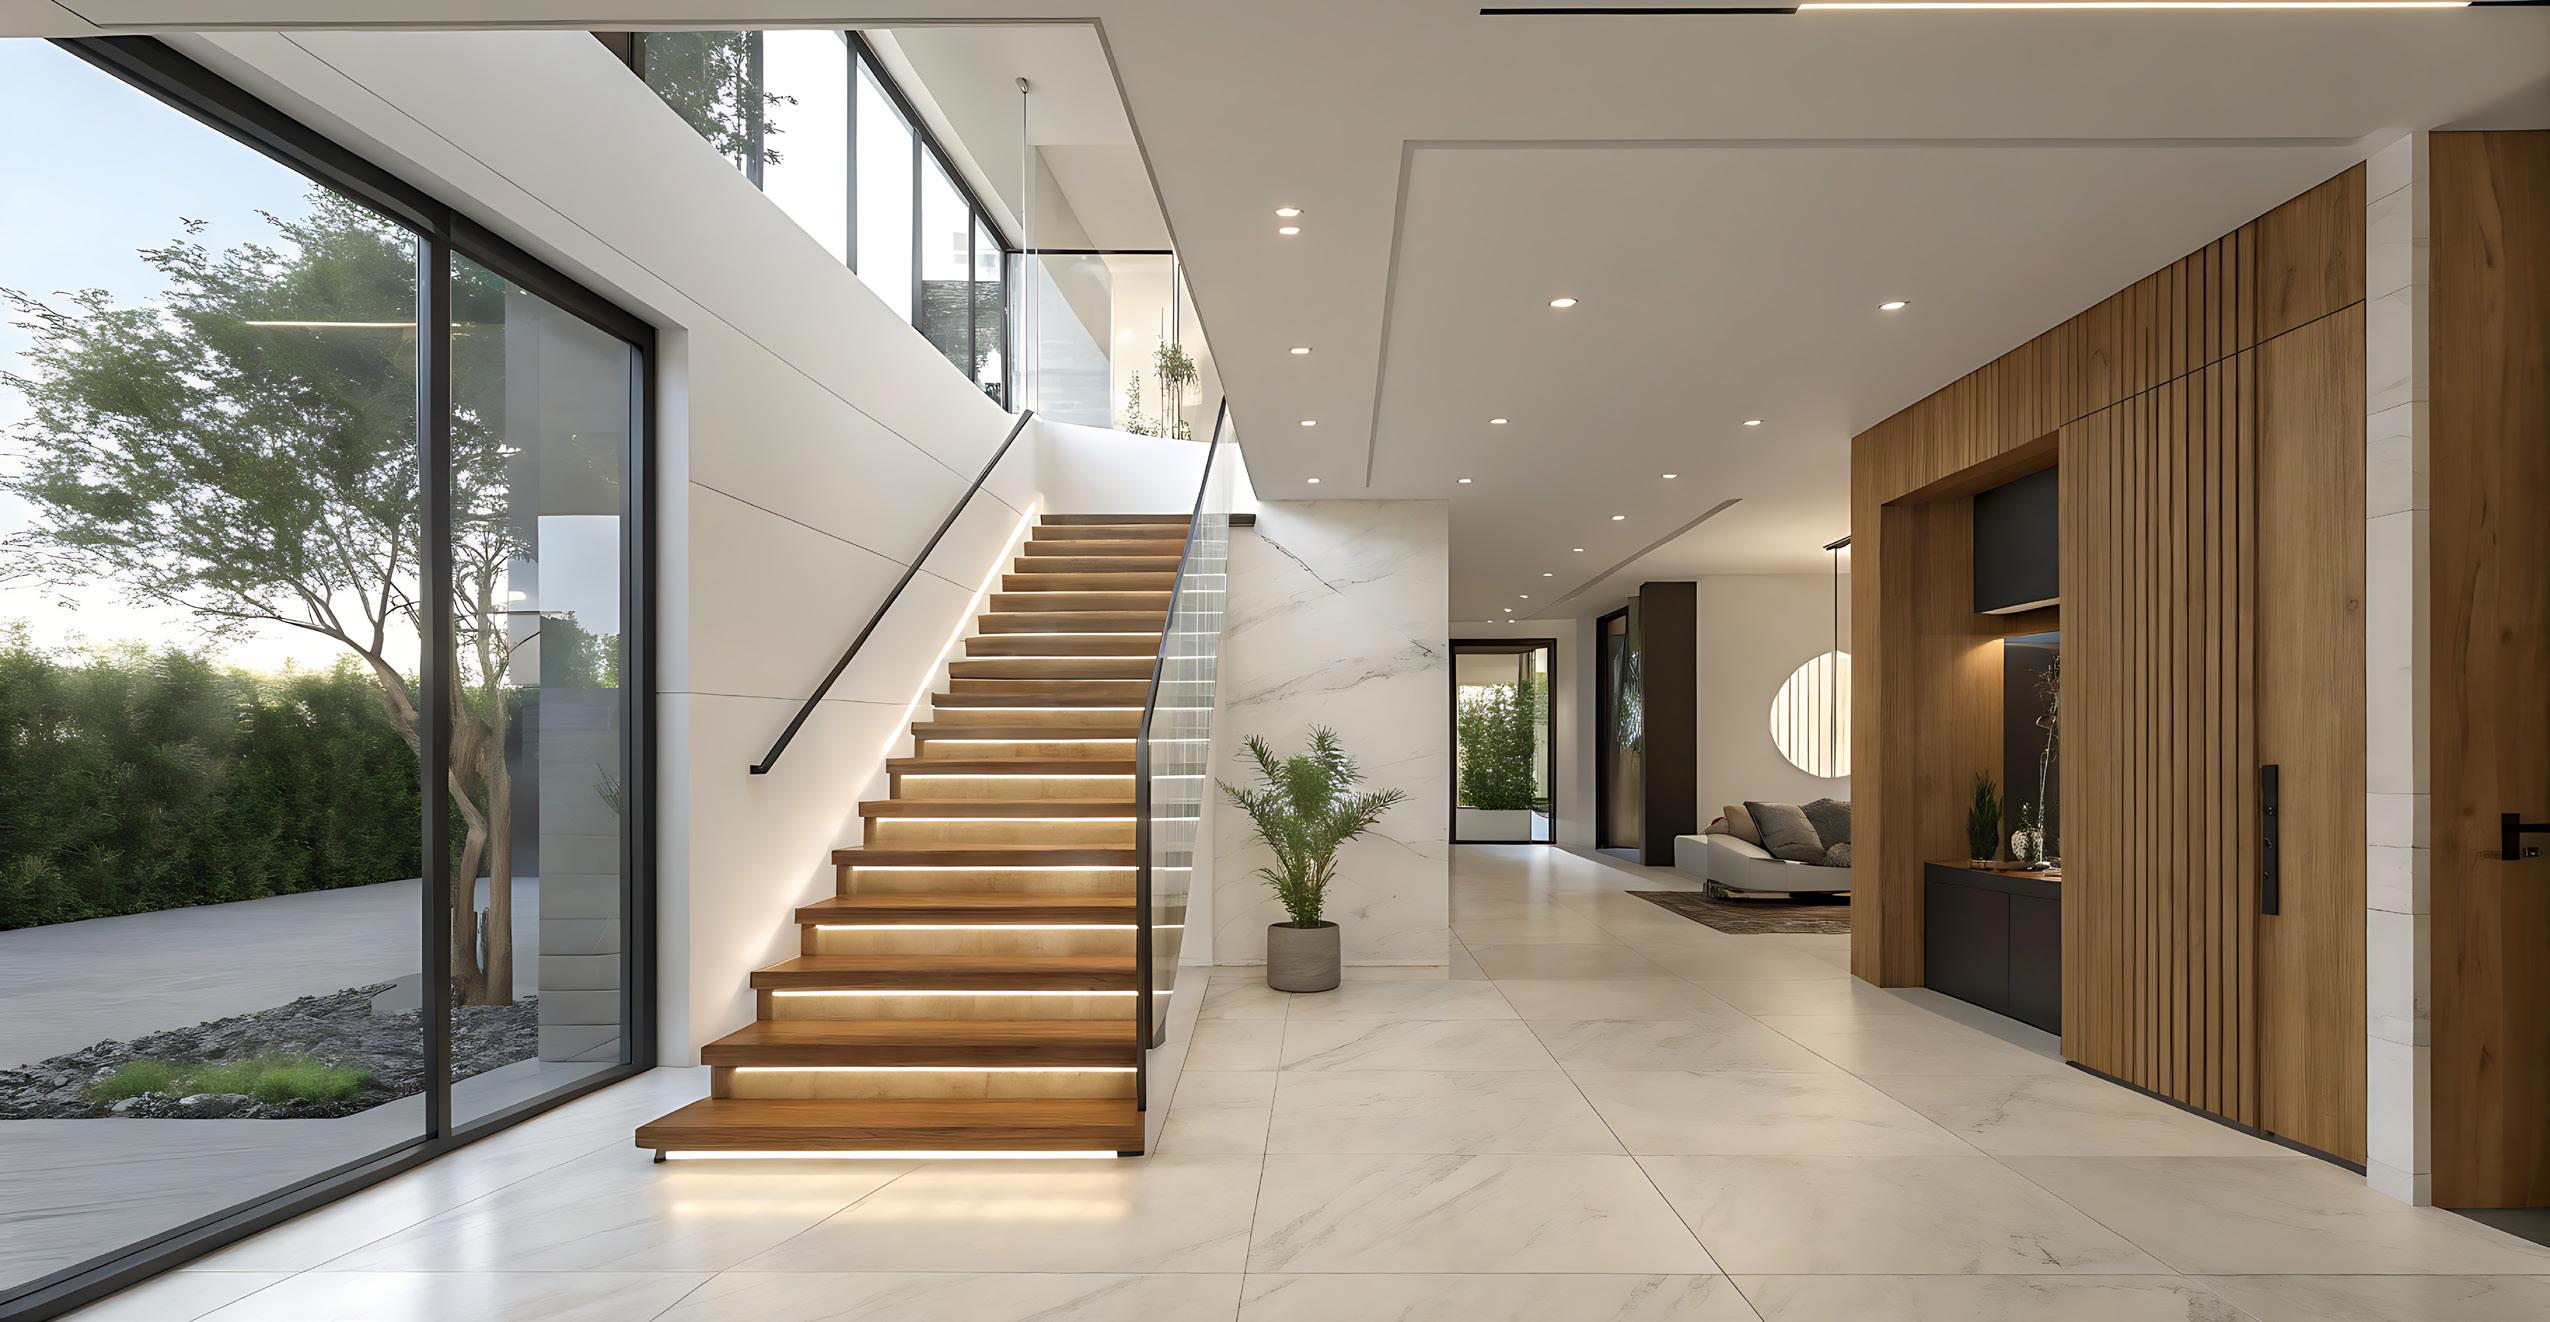
Persistent construction headwinds, including labor shortages, rising material costs, and tariffs, limited new luxury development- and home-building, redirecting focus toward renovation and reinvention. Buyers increasingly valued well-located properties with strong architectural foundations and customization potential. In many cases, the most desirable luxury homes were not new builds, but thoughtfully upgraded residences that integrated wellness, technology, and sustainability.
By year-end, buyers and sellers shared a preference for predictability and control. Buyers demonstrated patience, waiting for properties that met exacting standards, while sellers prioritized execution over urgency. Technology and data-driven insights became essential, enabling informed decision-making and an expanding global reach in an increasingly interconnected luxury market.
Taken together, the past twelve months illustrated a luxury real estate market that has entered a more sophisticated phase. Buyers are active but selective. Sellers are engaged but strategic. Inventory has expanded, yet pricing remains resilient.
The year-end numbers encapsulate this evolution: single-family luxury real estate emerged stronger, with sold volume up 5.9%, median sold prices up 1.5%, and inventory expanding 21.2%. Attached luxury properties remain stable but more sensitive to shifting conditions, finishing the year with sold volume down by 1.8%, median sold prices up 1.1%, and inventory higher by 17.6%.
This points to a market not driven by volatility but guided by fundamentals. Success in 2025 depended less on timing spikes and more on understanding nuance: property type dynamics, buyer psychology, and the growing importance of quality, positioning, and long-term value.
As the market enters 2026, luxury real estate is positioned for measured, strategic growth rather than acceleration. Ultra-luxury demand is expected to remain strong, supported by global wealth creation and capital mobility. Market polarization will persist, rewarding scarcity, quality, and lifestyle alignment. Regional divergence will continue, making hyper-local expertise indispensable. Stable interest rate expectations should support confidence without reigniting speculative excess.
Above all, luxury real estate has evolved beyond transactional dynamics. In 2026, success will hinge on how effectively properties align with long-term lifestyle aspirations, environmental resilience, technological integration, and intergenerational value. The market’s future belongs not to the fastest movers, but to those best aligned with purpose, precision, and permanence.
Homes
List Price
All data is based off median values. Median prices represent properties priced above respective city benchmark prices. Attached Homes
List Price
$1,700,000
$1,500,000
$1,300,000
$1,100,000
$900,000
$700,000
$500,000
Composite List Price, Sale Price, SP/LP Ratio, Sales Ratio, Price Per Square Foot, Days on Market, and Home Size are based on average monthly medians. Properties represented in this report are priced over the respective city benchmark price.
3.30%
• Official Market Type: Seller's Market with a 22.75% Sales Ratio.1
• Homes are selling for 98.18% of list price.
• The median luxury threshold2 price is $900,000, and the composite luxury home sales price is $1,325,022.
• Markets with the Highest Sales Price: Pitkin County ($11,146,623), Telluride ($5,308,567), Eagle County ($4,885,168), and Whistler ($4,522,902).
• Markets with the Highest Sales Ratio: Howard County (65.9%), Cleveland Suburbs (65.3%), Silicon Valley (64.4%), and East Bay (64.2%).
1
• Official Market Type: Balanced Market with a 16.98% Sales Ratio 1
• Attached homes are selling for 98.49% of list price.
• The median luxury threshold2 price is $700,000, and the composite attached luxury sale price is $891,599
• Markets with the Highest Median Sales Price: Pitkin County ($3,070,743), Park City ($2,685,066), San Francisco ($2,558,042), and Whistler ($2,392,800).
• Markets with the Highest Sales Ratio: Fairfax County (91.3%), Howard County (87.2%), Arlington & Alexandria (71.3%), and Anne Arundel County (67.3%).
Become recognized with the mark of accomplishment, the Certified Luxury Home Marketing Specialist™ (CLHMS) designation. Give your clients the assurance that you have the knowledge, experience, competence, and confidence they require.
We’ve got your blueprint for success.


REMAINING INVENTORY: The total number of homes available at the close of a month.
DAYS ON MARKET: Measures the number of days a home is available on the market before a purchase offer is accepted.
LUXURY BENCHMARK PRICE: The price point that marks the transition from traditional homes to luxury homes.
PRICE PER SQUARE FOOT: Measures the dollar amount of the home's price for an individual square foot.
SALES RATIO: Sales Ratio defines market speed and determines whether the market currently favors buyers or sellers. A Buyer's Market has a Sales Ratio of less than 12%; a Balanced Market has a ratio of 12% up to 21%; a Seller's Market has a ratio of 21% or higher. A Sales Ratio greater than 100% indicates the number of sold listings exceeds the number of listings available at the end of the month.
SP/LP RATIO: The Sales Price/List Price Ratio compares the value of the sold price to the value of the list price.
COMPOSITE STATISTICS: Are the mean average of monthly medians for the time frame represented. Medians are calculated for each city/area, for each month, these medians are averaged to create composite values. Composite statistics were used for list price, sale price, SP/LP Ratio, sales ratio, price per square foot, days on market, and home size.