20
BYERNES UDVIKLING IFT. UDFORDRINGERNE MED HAVVAND OG STORMFLOD
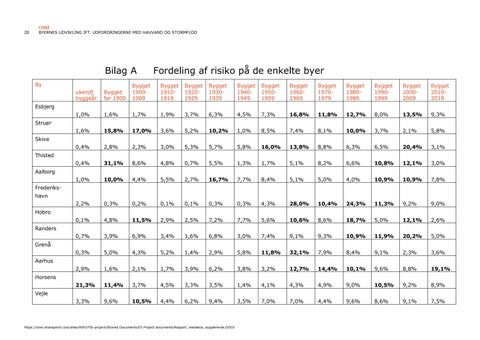
Bilag A By
Fordeling af risiko på de enkelte byer
ukendt byggeår
Bygget før 1900
Bygget 19001909
Bygget 19101919
Bygget 19201929
Bygget 19301939
Bygget 19401949
Bygget 19501959
Bygget 19601969
Bygget 19701979
Bygget 19801989
Bygget 19901999
Bygget 20002009
Bygget 20102019
1,0%
1,6%
1,7%
1,9%
3,7%
6,3%
4,5%
7,3%
16,8%
11,8%
12,7%
8,0%
13,5%
9,3%
1,6%
15,8%
17,0%
3,6%
5,2%
10,2%
1,0%
8,5%
7,4%
8,1%
10,0%
3,7%
2,1%
5,8%
0,4%
2,8%
2,3%
3,0%
5,3%
5,7%
5,8%
16,0%
13,8%
8,8%
6,3%
6,5%
20,4%
3,1%
0,4%
31,1%
8,6%
4,8%
0,7%
5,5%
1,3%
1,7%
5,1%
8,2%
6,6%
10,8%
12,1%
3,0%
1,0%
10,0%
4,4%
5,5%
2,7%
16,7%
7,7%
8,4%
5,1%
5,0%
4,0%
10,9%
10,9%
7,8%
2,2%
0,3%
0,2%
0,1%
0,1%
0,3%
0,3%
4,3%
28,0%
10,4%
24,3%
11,3%
9,2%
9,0%
0,1%
4,8%
11,5%
2,9%
2,5%
7,2%
7,7%
5,6%
10,6%
8,6%
18,7%
5,0%
12,1%
2,6%
0,7%
3,9%
6,9%
3,4%
1,6%
6,8%
3,0%
7,4%
9,1%
9,3%
10,9%
11,9%
20,2%
5,0%
0,3%
5,0%
4,3%
5,2%
1,4%
2,9%
5,8%
11,8%
32,1%
7,9%
8,4%
9,1%
2,3%
3,6%
2,9%
1,6%
2,1%
1,7%
3,9%
6,2%
3,8%
3,2%
12,7%
14,4%
10,1%
9,6%
8,8%
19,1%
21,3%
11,4%
3,7%
4,5%
3,3%
3,5%
1,4%
4,1%
4,3%
4,9%
9,0%
10,5%
9,2%
8,9%
3,3%
9,6%
10,5%
4,4%
6,2%
9,4%
3,5%
7,0%
7,0%
4,4%
9,6%
8,6%
9,1%
7,5%
Esbjerg Struer Skive Thisted Aalborg Frederikshavn Hobro Randers Grenå Aarhus Horsens Vejle
https://cowi.sharepoint.com/sites/A093756-project/Shared Documents/03 Project documents/Rapport_realdania_supplerende.DOCX

