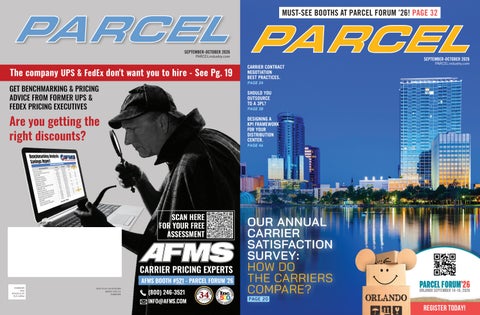
MUST-SEE BOOTHS AT PARCEL FORUM ’26! PAGE 32
SEPTEMBER-OCTOBER 2026 PARCELindustry.com
19
SEPTEMBER-OCTOBER 2026
CARRIER CONTRACT NEGOTIATION BEST PRACTICES.
PARCELindustry.com
PAGE 24
SHOULD YOU OUTSOURCE TO A 3PL? PAGE 38
DESIGNING A KPI FRAMEWORK FOR YOUR DISTRIBUTION CENTER. PAGE 46
OUR ANNUAL CARRIER SATISFACTION SURVEY: HOW DO THE CARRIERS COMPARE?
ORLANDO SEPTEMBER 14-16, 2026
PAGE 20
REGISTER TODAY!
MADMEN3
PRSRT STD US POSTAGE PAID MADMEN3
CONTENTS ///
GET OUR NEWSLETTER? SUBSCRIBE
FOR FREE
Volume 33 | Issue 5
26 06 EDITOR’S NOTE Gearing Up for the Holiday Season By Amanda Armendariz
08 PARCEL COUNSEL Incoterms and the UCC: Five Things You Need to Know By Brent Wm. Primus, J.D.
10 REVERSE LOGISTICS The Growing Importance of B2B Returns Management By Tony Sciarrotta
12 PCC CORNER Why Join a Postal Customer Council (PCC)? By Suzi Oswald
14 INDUSTRY INSIGHT Faster Isn’t Always Better: Building a Customer-Forward E-Commerce Parcel Network By Joe Wilkinson
16 SUPPLY CHAIN SUCCESS Fuel Surcharges: Hidden Profit Centers By Eric Grice
18 GUEST COLUMN Why Outbound and Loading Need as Much Peak Season Prep as Order Picking By Monica Sanchez 4 PARCELindustry.com SEPTEMBER-OCTOBER 2026
28 30 38 20 THE 2026 CARRIER SATISFACTION SURVEY: OUR READERS RATE THE CARRIERS
42 SUSTAINABLE PACKAGING IN THE PARCEL INDUSTRY: WHY LIFE-CYCLE THINKING MATTERS
24 TEN CARRIER CONTRACT NEGOTIATION BEST PRACTICES
46 THE METRICS THAT MATTER: A DISTRIBUTION KPI FRAMEWORK
By Amanda Armendariz
By Mark Taylor
26 THE STATE OF THE USPS: ONE YEAR INTO POSTMASTER GENERAL STEINER’S TENURE
By Phil Riebel
By Keith Swiednicki
50 TO SUM UP
By Jay Kent
28 PARCEL COST MODELING IS THE KEY TO UNLOCKING COST-EFFECTIVE CARRIER DIVERSIFICATION By Bob Malley
30 WHAT A PARCEL AUDIT ACTUALLY CHECKS (AND WHY MOST SHIPPERS MISS IT) By David Ladner
36 WHERE FULFILLMENT PRESSURE WILL HIT IN 2026 By Tony Polimeno
38 OUTSOURCING PARCEL FULFILLMENT: WHEN A 3PL CREATES COMPETITIVE ADVANTAGE By Jeffrey Haushalter
SPONSORED CONTENT 13 YOUR NEW AUDITOR NEVER SLEEPS 32 MUST-SEE BOOTHS AT PARCEL FORUM 49 THE FREIGHT YOUR TMS CAN'T SEE
SUBSCRIBE FOR FREE!
EDITOR’SNOTE
GEARING UP FOR THE HOLIDAY SEASON By Amanda Armendariz
I
t’s still summer as I write this, with more than a month left before school starts. It’s a season we’ll try to pack with beach outings, pool days, and vacations as much as possible. But for those of us in the small-parcel industry, we know it’s a busy season in our organizations, as well. With peak season coming up, the pressure is on to ensure that the busiest shopping season of the year doesn’t fall flat with respect to customer expectations and satisfaction. This year’s peak season promises to be an interesting one. Data from the Salesforce Shopping Index reveals that “global digital traffic grew 18% in Q2, but order volume barely moved,” going up just one percent. This means that getting customer eyes on your product online is no longer enough, and the traditional channels might
6 PARCELindustry.com SEPTEMBER-OCTOBER 2026
PRESIDENT CHAD GRIEPENTROG not be the most reliable any longer. Salesforce also found that, “consumer-reported purchases on traditional brand websites and online marketplaces remained completely flat. Meanwhile, social media purchases surged +17% year-over-year. The generational divide is sharp: 48% of Gen Z shoppers identify as social shoppers, followed by 37% of Millennials, 18% of Gen X, and 6% of Baby Boomers.” Adapting to these changing preferences is key to this peak season being a successful one. And of course, just because the sale is made doesn’t mean that the interaction is done. Delivery experiences and the returns process all influence how satisfied a customer is with your organization — and whether they’ll purchase from you again at a later date. If a package is late (especially if the customer isn’t kept abreast of the situation) or the returns process is overly complicated or expensive, you’ve likely lost a customer permanently. The organizations that are the most successful this peak season will be those that examine every segment of the parcel life cycle, from the moment the customer even considers the product all the way through to the ease of returning it if necessary. And we at PARCEL will help you do that through our magazine, enewsletters, webinars, and more, so thanks for staying connected with us.
PUBLISHER KEN WADDELL EDITOR AMANDA ARMENDARIZ [ amanda.c@rbpub.com ]
AUDIENCE DEVELOPMENT MANAGER RACHEL CHAPMAN [ rachel@rbpub.com ]
CREATIVE DIRECTOR KELLI COOKE ADVERTISING KEN WADDELL (m) 608.235.2212 [ ken.w@rbpub.com ]
JOSH VOGT [ josh@rbpub.com ]
P.O. Box 259098 Madison WI 53725-9098 p: 608.241.8777 f: 608.241.8666 PARCELindustry.com PARCEL (ISSN 1081-4035) is published 7 times a year by MadMen3. All material in this magazine is copyrighted 2026© by MadMen3. All rights reserved. Nothing may be reproduced in whole or in part without written permission from the publisher. Any correspondence sent to PARCEL, MadMen3 or its staff becomes the property of MadMen3. The articles in this magazine represent the views of the authors and not those of MadMen3 or PARCEL. MadMen3 and/or PARCEL expressly disclaim any liability for the products or services sold or otherwise endorsed by advertisers or authors included in this magazine.
SUBSCRIPTIONS: Free to qualified recipients: $12 per year to all others in the United States. Subscription rate for Canada or Mexico is $35 for one year and for elsewhere outside of the United States is $55. Back-issue rate is $5. Send subscriptions or change of address to: PARCEL, P.O. Box 259098 Madison WI 53725-9098 Allow six weeks for new subscriptions or address changes. REPRINTS: For high quality reprints, please contact Chad Griepentrog, 608.241.8777, chad.g@rbpub.com
SUBSCRIBE FOR FREE!
PARCELCOUNSEL
INCOTERMS AND THE UCC: FIVE THINGS YOU NEED TO KNOW By Brent Wm. Primus, J.D.
I
n this installment of PARCEL Counsel, we will compare a few provisions of the Uniform Commercial Code (UCC) and Incoterms 2020. They are not laws. The Uniform Commercial Code is a “Model Act.” In 1947, the National Conference of Commissioners on Uniform State Laws and the American Law Institute joined in a partnership that created the Uniform Commercial Code. In general, when one sees references to the Uniform Commercial Code, they are to the “Model Act” as adopted by the Conference as opposed to the provisions of the Code actually enacted into law by a state. The provisions of the UCC discussed here are those of the Model Act. States are not required to enact a particular provision of the UCC nor to enact the UCC at all. While the underlying purpose of the Model Act is to create uniformity of law amongst the States, individual versions of the UCC have been adopted with nuances between States. For example, Louisiana did not adopt Article 2 containing Terms of Sale. Because of the possibility of a variance, the reader should check the statutes as actually adopted by the state in which the reader is conducting business or which its contract specifies in a choice of law clause. Incoterms are the other commonly used set of rules establishing trade terms for commercial sales. They
8 PARCELindustry.com SEPTEMBER-OCTOBER 2026
have been defined by the International Chamber of Commerce (ICC) since 1936. Incoterms 2020 is the current iteration. To properly use, it is necessary to include language such as “the terms of sale herein are Incoterms® 2000” in your sale and purchase contracts. Transfer of title. Incoterms do not identify where the transfer of title will occur. Thus a separate statement regarding transfer of title should be made in the body of the contract, the quote, and so on. In contrast to this, the UCC Terms of Sale do specify when title passes. Pursuant to Section 2-401 for F.O.B. Origin shipments, title passes “at the time and place of shipment,” i.e., when the goods are placed into the hands of the carrier. For F.O.B. Destination shipments title passes when the goods are placed into the hands of the buyer. “F.O.B.” has an entirely different meaning in Incoterms and in the UCC. A source of confusion is that the Incoterm 2020 F.O.B. has an entirely different meaning than the UCC term F.O.B. In both instances, the letters stand for “Free on Board.” However, the Incoterm 2020 F.O.B. is only to be used for shipping by ocean, whereas the UCC term F.O.B. may be used for any mode. This leads to the conclusion that one has to be very careful
not to intentionally or inadvertently mix or confuse the use of Incoterms 2020 and the terms derived from the UCC. Incoterms are better suited for international transactions. Although a UCC term could be used for an international transaction, it is better to use the applicable Incoterm. This is because Incoterms cover such things as the responsibility for clearing customs and the payment of any customs duties. Conclusion. The most important consideration is that all parties involved in a transaction know which set of terms is being used, what the terms mean, and if any modifications were made to them by a party. All for now!
Brent Wm. Primus, J.D., is the CEO of Primus Law Office, P.A., the Senior Editor of transportlawtexts, inc., and Director of Virtual Education for the Transportation and Logistics Council, Inc. The information contained in this article is intended to be general background information. It does not constitute and should not be relied upon as legal advice. Readers should contact a qualified attorney should they have a specific legal question. Previous columns, including those of Andrew M. Danas, may be found in the “Content Library” on PARCELindustry.com. Your questions are welcome at brent@primuslawoffice.com
SUBSCRIBE FOR FREE!
REVERSELOGISTICS
THE GROWING IMPORTANCE OF B2B RETURNS MANAGEMENT By Tony Sciarrotta
M
any of us in the logistics industry look forward to the National Retail Federation’s (NRF) annual returns report. The report provides returns market sizing and trends that are otherwise difficult to find or quantify. However, while the NRF annual study focuses more on business-to-consumer (B2C) returns, little is known about business-to-business (B2B) returns market trends or sizing. Consider that the latest NRF returns market estimate from 2025 notes that total returns for the retail industry are forecasted to reach $849.9 billion in 2025. One can surmise that combined with B2B returns, the total reverse logistics market size exceeds $1 trillion. Indeed, while B2C returns often receive the most attention from the press and other organizations, the business-to-business (B2B) returns market is perhaps much bigger and continues to grow in both volume and strategic importance. The growth is being driven by tightening environmental regulations, the rise of circular economy practices, and the need for businesses to recover residual value from surplus or end-of-life equipment. Unlike B2C returns, which usually involve a customer returning a single product for a refund or exchange, B2B returns often include bulk shipments, specialized or configurable products, and various reasons for the return, such as warranty claims, manufacturing defects, excess inventory, or project cancellations. While B2C returns tend to have higher volumes, B2B returns are typically more operationally complex and tend to be higher-value and more expensive to process per transaction. For example, businesses regularly replace servers, networking equipment, computers, mobile devices, and industrial electronics as newer technologies become available. Returned equipment may require testing, refurbishment, secure
10 PARCELindustry.com SEPTEMBER-OCTOBER 2026
data destruction, component harvesting, recycling, or resale through secondary markets. In manufacturing industries, components that fail quality inspections, excess raw materials, production overruns, warranty claims, and defective parts all contribute to return volumes. In the healthcare sector, medical devices, diagnostic equipment, surgical instruments, pharmaceuticals, and temperature-sensitive products may be returned for various reasons. Still, these returns must comply with strict regulatory requirements while maintaining chain-of-custody documentation, product traceability, and quality standards. How to manage B2B returns, regardless of industry, is typically found in negotiated contracts between businesses. Contracts will often specify return policies, restocking fees, warranty terms, and credit arrangements. Sustainability and Circularity Companies are facing growing pressure from customers, investors, and regulators to reduce waste and support circular economy initiatives. Rather than disposing of returned products, organizations are investing in refurbishment, remanufacturing, recycling, and asset recovery programs that extend product life cycles while reducing environmental impact. During periods of component shortages or extended lead times, returned products can also provide an important source of available inventory.
Laptops and smartphones, for example, are valuable sources of critical minerals and play an important role in supporting a circular economy through the recovery of secondary raw materials. These devices contain a range of critical and precious metals, including lithium, cobalt, nickel, graphite, tantalum, rare earth elements, gold, silver, palladium, and copper, which are needed for manufacturing batteries, electronics, electric vehicles, and renewable energy technologies. Recovering these materials from end-of-life devices reduces the need for new mining. Returns: A Good Opportunity Returns represent an opportunity to recover value, strengthen sustainability initiatives, improve relationships, and build greater supply chain resilience. Whether handling industrial equipment, electronics, medical devices, or manufacturing components, businesses must develop standardized processes that ensure returned products are evaluated, routed, and processed as efficiently as possible. While technology plays an important role in both B2C and B2B returns management, partnerships with experienced reverse logistics providers can help businesses navigate regulatory requirements, maximize asset recovery, and support circular economy objectives.
Tony Sciarrotta is Executive Director of RL Solutions Group.
END-TO-END
LOGISTICS SOLUTIONS
PARCEL DELIVERY
CUSTOMS CLEARANCE
FULFILLMENT SERVICES
SCAN TO LEARN MORE
reliablelogistics.ca
905-607-1234
FREIGHT MANAGEMENT
V IS IT US AT
BOOTH 730 sales@reliablelogistics.ca
SUBSCRIBE FOR FREE!
PCCCORNER
WHY JOIN A POSTAL CUSTOMER COUNCIL (PCC)? By Suzi Oswald
W
hat are the benefits of being a member of a Postal Customer Council (PCC)? For me, the answer is both professional and personal — and it started early in my career. Someone invited me to attend a PCC event. It was there that I began meeting and connecting with people who would play a key role in helping me grow my knowledge and skills in the mailing and shipping industry. At the time, I often heard the term networking, but to be honest, it felt uncomfortable. Why would I want to introduce myself to people I didn’t know? It was outside of my comfort zone, and something I wasn’t eager to do. However, by joining a PCC and attending events, something changed. As I became more involved, I started building genuine connections with other members. Those connections opened doors — when I encountered challenges or needed guidance, I had people I could turn to for advice and support. Over time, something even more meaningful happened. As others got to know me, they began coming to me with their own questions. I was able to share my knowledge and help them in return. Giving back is incredibly rewarding. There’s a name for that feeling — it’s called
12 PARCELindustry.com SEPTEMBER-OCTOBER 2026
a “helper’s high.” When you help others, your brain releases chemicals like dopamine and endorphins, creating a real sense of happiness and fulfillment. Another powerful benefit of PCC involvement is the relationships you build. What starts as networking often turns into genuine friendship. Throughout the years, I’ve developed lasting friendships with people across the mailing and shipping industry. These relationships are one of the most valuable aspects of being part of a PCC. I continue to enjoy attending industry events because they provide opportunities to: Expand my knowledge Build new connections Reconnect with friends and colleagues The key, however, is not just joining a PCC — it’s getting involved. Attend events. Be present. Be willing to introduce yourself to someone new. It may feel uncomfortable at first, but it gets easier — and the rewards are worth it. Recently, I had the opportunity to meet a couple of young professionals at a PCC Mail Design Professional class. I was able to introduce them to Leaders Connect, a program designed to pair mentors and mentees in the mailing and shipping industry. Programs like this are excellent examples of how PCC involvement can open doors beyond your immediate network and help others grow. PCCs are more than just professional organizations —
they are gateways to growth, connection, and giving back. They provide access to resources, education, mentorship opportunities, and a supportive community that benefits everyone involved. Final Thoughts Joining a PCC is the first step — but the real value comes from participating, connecting, and contributing. Be willing to step outside your comfort zone, build relationships, and share your knowledge. Before you know it, you’ll not only grow professionally — you’ll also find yourself part of a strong and supportive mailing and shipping community.
Suzi Oswald has more than 25 years of experience in the printing and direct mail industry. Recognized for her dedication and strong work ethic, she is passionate about creating a positive, high-energy environment where individuals can learn, grow, and thrive. In her role as Postal Affairs Expert and Policy Advisor at Enpointe in Minneapolis, MN, Suzi is committed to mentoring and empowering others, fostering collaboration, and driving excellence across every aspect of her work.
APPLICATION ARTICLE
Your New Auditor Never Sleeps Somewhere in this month's carrier invoice, you are paying for a mistake. A surcharge that should not apply. A weight adjustment nobody verified. An accessorial fee for a service you never used. Most parcel operators know this, and most have made peace with it, because checking every line item on every invoice has never been practical. Carrier challenges compound. After GRI season, surcharges multiply and accessorial rules inevitably change midyear. The gap between what you agreed to pay and what you are actually billed grows wider every season. That resignation made sense when your shipping software was installed. If your parcel tech predates the iPhone (2007!), auditing means one of two things: a spreadsheet exercise someone runs when they find time, or an outside audit firm that carries at least one of these common deficiencies: it keeps a percentage of whatever it recovers, it only goes after a sampling of high-recovery items, and/or it charges you a fortune upfront to reengineer the full package history to do it better. Shipium built Always-On Audit to end that arrangement. Newly launched, Always-On Audit begins the validation process during the rating (yes, before the package leaves your building) and compares every carrier invoice, at the line-item level, against what each shipment should have cost. The approach works because of how Shipium functionality impacts workflow. As the system of record for shipping data, the platform already holds your contracts, rates and discounts. It knows the rate that was selected, the service that was purchased, and the dimensions and weight recorded when the label printed. When the invoice arrives, by API, EDI, file transfer, or PDF, Always-On Audit validates each charge against that execution data and all previous validations, including base
rates, fuel, DAS and eDAS surcharges, weight and dimension adjustments, all accessorials, and Earned discounts. Discrepancies surface automatically through alerts and in dashboards your team can act on, with the evidence attached. Legacy parcel auditing systems cannot do this because they never captured clean execution data in the first place. It’s impossible to audit against a record that does not exist, so they have to reengineer the package history. That is the quiet cost of running twenty-year-old shipping technology. For 3PLs, the stakes double. Every billing error absorbed is margin lost, and every error passed through to a customer incorrectly is trust lost. Always-On Audit validates pricing during execution and ties it to customer-specific sell rates, so buy/sell precision mitigates the need for manual reconciliation after the invoices are scrutinized. Always-On Audit elevates confidence through a platform that already reduces shipping spend for customers, typically 12% in the first year, through intelligent ML-modeled carrier selection, rating, and labeling that transportation teams control themselves through a web console. No service orders, no custom code, no waiting on IT. See Always-On Audit live at the Shipium booth at PARCEL Forum, alongside rate shopping, console configuration, and analytics. Learn more at shipium.com/aoa.
By Tim Meester, VP, Network Performance & Intelligence
shipium.com info@shipium.com 206.401.5101
2026 INDUSTRYINSIGHT
SPEAKER
FASTER ISN’T ALWAYS BETTER: BUILDING A CUSTOMER-FORWARD E-COMMERCE PARCEL NETWORK By Joe Wilkinson
F
or nearly two decades, e-commerce delivery strategy has followed a simple assumption: faster is better. Two-day delivery became next-day delivery. Next-day became same-day. Presumably, the ultimate objective is to deliver the package before the customer realizes they need it. Speed matters. Some purchases are urgent, and customers will pay for convenience. But every order does not need to move through the network as though it contains a replacement organ. A customer-forward parcel network is not necessarily the one that delivers every package as quickly as possible. It is the one that makes the right promise and keeps it consistently. What Customers Want from the E-Commerce Delivery Experience Customers want delivery to be fast, free, reliable, visible, flexible, and convenient. Unfortunately, they also expect the
14 PARCELindustry.com SEPTEMBER-OCTOBER 2026
product to be competitively priced. That creates a minor challenge for the retailer. Ryder's 2025 e-commerce consumer study found that free shipping influenced 76% of purchase decisions, while shipping in two days or less influenced only 15%. Speed is only one part of the delivery experience. Customers also value a reasonable delivery date, accurate tracking, and confidence that the retailer will deliver when promised. A package promised in four days and delivered in three creates a positive experience. A package promised in two days and delivered in three creates a service failure. Same transit time, but the first retailer did a better job. Why Faster E-Commerce Delivery Increases Parcel Shipping Costs There is no mystery behind the cost of speed. Shorter commitments reduce the fulfillment locations, carriers, and services available. They can encourage air upgrades, expensive recovery decisions, and network designs built around demanding orders that represent little volume. Then there is free shipping. Customers like it, and retailers often need to offer it. The carriers, however, remain curiously unwilling to participate in the "free" portion of the arrangement. Someone still pays, through
reduced margin or minimum-order thresholds. The objective is not to eliminate fast delivery. It is to stop buying speed where the customer does not value it. For many shippers, standard delivery can support most orders, while faster options serve customers with actual urgency. That is not reduced customer service. It is a more rational match between cost, speed, and demand. Build the E-Commerce Shipping Strategy Around the Customer Promise A customer-forward shipping strategy begins with the promise presented at checkout. That promise should reflect inventory, processing, carrier pickups, expected transit, geography, and risk, not the most optimistic interpretation of a carrier's service map. Shippers should offer a few understandable choices, such as economical standard delivery, a faster paid option, and pickup or scheduled delivery. Customers should know when the order is expected, what each option costs, and whether paying more produces a meaningful improvement. Presenting seven services with unfamiliar acronyms is not personalization. It is making the customer do the work. Checkout options are only as good as the network behind
SUBSCRIBE FOR FREE!
them. Inventory placement, ship-from location, warehouse processing, pickup schedules, and routing logic all affect the result. A ground shipment originating near the customer may arrive sooner, and at a lower cost, than an air shipment moving across the country. Routing technology should select the least-cost service capable of meeting the delivery date, using actual transit performance rather than published standards. Pure rate shopping without performance data is a very efficient way to make bad decisions. A parcel negotiation cannot compensate for inventory in the wrong locations, late processing, poor packaging, or routing rules that habitually upgrade shipments. Decisions made before rating the package often matter as much as carrier pricing. Use a Multi-Carrier Shipping Strategy Without Creating Carrier Chaos Carrier diversification can improve cost, service, resilience, capacity, and negotiating leverage. But the objective is not to accumulate carrier logos. Each carrier should have a defined role. National carriers may support broad coverage and difficult shipments. Regional, technology-forward, and postal carriers may offer better transit or economics in specific markets. Other providers may serve as tested contingency options. The word "tested" is important. Awarding a carrier one percent of the network, never evaluating its ability to scale, and then calling it a backup is not diversification. It is theater. Shippers can also diversify too far. Splitting volume among too many carriers can reduce density, weaken negotiating leverage, complicate operations, and make accountability difficult. The goal is not more carriers. It is the right carriers for the right shipment segments. Negotiate Parcel Contracts Around Cost and Customer Experience Parcel contract negotiation is generally treated as a pricing exercise. That is understandable. Every dollar a shipper saves is a dollar the carrier does not collect. This may explain why carriers rarely volunteer their best pricing out of a sense of community responsibility. But a customer-forward agreement must support more than a low theoretical rate. It should reflect the
shipper's package profile, accessorials, dimensional weight, minimum charges, fuel, rate caps, peak pricing, capacity, and flexibility to reallocate volume. A large discount applied to the wrong rate or service is not a strong agreement. Neither is attractive pricing that directs volume to a poorly performing carrier. The agreement and pricing should support the network strategy, and the network strategy should support the customer promise. Reversing that order allows carrier pricing to dictate the customer experience. Measure E-Commerce Delivery Performance Against the Promise Shippers should measure what the customer experiences, not merely what the carrier reports. Carrier-reported on-time performance is useful, but insufficient. Performance should be measured against the date communicated to the customer and segmented by carrier, service, origin, geography, facility, and shipment type. A customer-forward scorecard should include delivery against the promise, actual transit and first-attempt success, exceptions and resolution time, tracking accuracy, damage and claims, and cost per successfully delivered package.
National averages can hide significant problems. A carrier may perform well overall while failing in a specific market, lane, or service. Averages have a wonderful ability to make localized disasters look respectable. A customer whose package was late does not care that the broader network was 97% on time. The Best E-Commerce Parcel Network Keeps the Right Promise Building a customer-forward e-commerce parcel network is not a choice between service and cost containment. Shippers can control unnecessary speed, offer meaningful choices, use the right carriers, negotiate agreements that support the network, and measure performance against the customer promise. The fastest delivery will sometimes be the right delivery. Often, it will not. The best parcel network is not the one that promises the fastest transit. It is the one that makes the right promise, keeps it consistently, and does so at a sustainable cost.
Joe Wilkinson is VP, Professional Services (Transportation Consulting) at Intelligent Audit. He can be reached at joey.wilkinson@ intelligentaudit.com.
SEPTEMBER-OCTOBER 2026 PARCELindustry.com 15
SUPPLYCHAINSUCCESS
FUEL SURCHARGES: HIDDEN PROFIT CENTERS By Eric Grice
A
cross the landscape of ever-increasing charges from parcel carriers, we would typically think of the fuel surcharge as one of the most straightforward, simple pass-through fees. The planes, semi-trucks, and delivery vans needed to execute the delivery of packages all require fuel, so it makes sense. Furthermore, it is not a static price but moves directly with the posted cost of fuel. Once again, this seems straightforward. However, when we look further, we find the amount we pay for fuel, given a static national fuel cost, has increased dramatically. As a Percent of an Increasing Target We know the fuel surcharge is paid as a percentage of the transportation rate plus applicable accessorial charges. Additionally, the percentage paid for fuel will move up and down based on the posted Department of Energy Fuel Index. However, given a static cost of fuel, let’s use $3.60 — which is roughly the average across 2021, 2024, 2025 — the ground fuel surcharge percentage has more than doubled (it’s actually increased by more than 2.5X) since 2021. Historic fuel surcharge tables are impossible to find on carrier websites, but if you have copies going
16 PARCELindustry.com SEPTEMBER-OCTOBER 2026
back to 2021, you would see 10 separate increases to the fuel surcharge table. Next, we review the base transportation charge. Fuel is a percentage of this charge so when it goes up, even without a fuel increase or fuel table change, the amount you pay for fuel does as well. Posted GRIs may say 5.9% but they hit zones/services/ weights differently. Even with a four percent effective rate cap, compounded over five years, that is an almost 22% increase, and list rates will be closer to 37%.
The general takeaway is that with a combination of fuel efficiency, route and network optimization — if fuel is the same price as it was five years ago — these carriers are using less now, not more. Lastly, we have our applicable accessorial charges. These surcharges dodge posted GRIs and can have much higher increases. While savvy negotiators are able to find reductions and limit the impact, the increase in accessorial
charges as a percentage of transportation is undeniable. We estimate these to have doubled over the past five years. What Carrier Efficiencies? Sure, fuel prices go up and down, and luckily 2024 and 2025 offered quite a respite from the averages we saw in 2022 and 2023. But where fuel economy is concerned, the ground network is consistently seeing gains in efficiency. Most Class 8 trucks that support the long hauls of packages have seen fuel ratings become much more efficient over the past decade. In many cases, fuel economy is even better in the city as engines idle off, etc. Smaller delivery trucks that we see every day have also improved as carriers invest in hybrid options and alternative fuels. Likewise, carriers are continually improving their networks. Routing software to reduce total miles is continually being enhanced. For large parcel carriers, fuel is the largest variable expense and therefore reducing total miles in the network is constantly tracked. While the gains in network efficiency are externally trumpeted as strategic for improving service/transit times, the reason they are so important to carriers — and receive investment funds — is to reduce their fuel expense. The general takeaway is that with a combination of fuel efficiency, route and network optimization — if fuel is the
SUBSCRIBE FOR FREE!
same price as it was five years ago — these carriers are using less now, not more. By the Numbers If we take a mathematical approach, assume a $20M net transportation shipper in 2021.
Assumptions: Ground service level, not express Fuel consistent at $3.60 on the DOE 2021 Fuel Surcharge 9%, standard 25% discount applied 2026 Fuel Surcharge 24%, standard 25% discount applied Fuel applicable Accessorials 8% of spend in 2021 Fuel applicable Accessorials 16% of spend in 2026
Landed fuel surcharge increase is 372% or just over 3.7X the original. In Conclusion The result of the combination of increased fuel tables and base transportation charges, coupled with a significant increase on fuel-applicable accessorial charges — even at the same national fuel price — has increased the cost of fuel over 3.5 times in just five years. And this is one case where we can’t claim inflation as the cause. We know that when the fuel price is higher, we pay for even more fuel. Additionally, I would argue given fuel economy gains and
network optimizations that the amount of fuel to move a package through the network has actually decreased. So, as a shipper, what can you do? Negotiate those fuel surcharges. To match fuel costs from 2021, given a base 25% discount, you would simply need to target an 80% fuel surcharge discount. That may be out of reach, but it is clear fuel has become a major profit center for carriers and that larger fuel surcharge discounts should be on the table.
Eric Grice is Director of Transportation Intelligence, Infios.
SEPTEMBER-OCTOBER 2026 PARCELindustry.com 17
SUBSCRIBE FOR FREE!
GUESTCOLUMN
WHY OUTBOUND AND LOADING NEED AS MUCH PEAK SEASON PREP AS ORDER PICKING By Monica Sanchez
F
or most people, summertime is a period of vacations and fun in the sun, but for warehouse operators and third-party logistics companies, it means something entirely different. It’s time to get ready for the holiday season. Summer is when all systems — receiving, put-away, picking, and shipping — need stress testing to make sure they can keep pace under the double, and even triple, volume holiday delivery windows. Results from our Material Transport Voice of Market study, which surveys warehouse operations decision-makers and influencers, reveals the importance of stress testing operations ahead of peak demand periods. Over 80% of respondents reported they faced material transport reliability issues during periods of peak demand, with the most severe challenges being congestion, equipment breakdowns, and material transport bottlenecks. As facility managers assess their holiday preparedness for 2026, automation vendors can take advantage of this cycle to start conversations with clients and prospects about their future automation needs. The following are key opportunities we have observed in this market: Outbound & loading workflows have the highest automation potential and are a high priority for automation among end users. Respondents to our Voice of Market survey told us that only 16% of outbound & loading workflows are fully automated in their facilities, making them a major vulnerability during peak periods like the festive season. Warehouse operators have a strong need to resolve this vulnerability, confirming the opportunity for vendors. Of the people we surveyed, one out of three ranked this workflow at
18 PARCELindustry.com SEPTEMBER-OCTOBER 2026
the top of their list for automation, and twice that many ranked it a top two priority. What messages resonate most with potential customers? Comparing those who have fully automated outbound and loading with those who haven’t revealed three potential angles original equipment manufacturers (OEMs) can take when approaching customers. This involves explaining how solutions address the following pain points: 1. How the solution is able to flex with unexpected demand fluctuations: This was the top-ranked pain point. Customers are currently addressing spikes in demand by scaling up manual labor in times of need, but absenteeism and a lack of skilled workers may make this unachievable or unsustainable in the long run. 2. How technology can be deployed to increase system reliability: The single biggest desire in this area is to stop equipment failures, which in turn lead to downtime. Equipment monitoring technology and service level agreements aimed at reducing unplanned stoppages are increasingly viewed as a "must-have." 3. How prospects’ changing specifications and product variability can be addressed: Respondents told us the solutions they are familiar with have high variability of SKUs/ inventory and complex process flows or requirements (e.g. scanning on all six sides of
a package.) Showcasing how vendors have tackled previously "unsolvable" challenges may make buyers more open to exploring new solutions. How do buyers make decisions about automation suppliers? We asked buyers to select from 10 different criteria for selecting a technology supplier. The answers varied by group. Among respondents with a strong desire to automate, the top selection criteria was "system flexibility for changes in your business." The next most important criteria was ‘ease/speed of integration into your facility’. By understanding the above opportunities and pain points, vendors can develop a more comprehensive approach that meets buyers where they are and grows their chances of becoming automation partners.
Monica Sanchez is Senior Research Lead, Interact Analysis. The Voice of Market study features a range of deliverables, including an interactive survey analysis dashboard and a full written report. Covering the order fulfillment, material transport, and forklift and pallet handling operations of a host of different companies across industry, Voice of Market provides a deep dive into the key challenges for warehouse operations. To learn more about the organization’s material transport market research or the Voice of Market offering, contact Monica at Monica. Sanchez@InteractAnalysis.com.
THE 2026 CARRIER SATISFACTION SURVEY: OUR READERS RATE THE CARRIERS By Amanda Armendariz
Carrier Performance On a scale of 1-5, with 5 being the highest rating.
Customer Service FedEx | 3.0 UPS | 3.15 USPS | 2.72
On-time Service Performance FedEx | 3.26
Our 2026 carrier satisfaction survey is here! We take a look at how readers view the carriers with respect to a variety of factors. Check it out and see how your experience compares to that of your peers. We appreciate everyone who participated!
UPS | 3.65 USPS | 2.72
Delivery Performance
(driver courtesy, package handling)
FedEx | 3.3 UPS | 3.88 Did you use FedEx in the last 12 months for domestic parcel shipping?
Did you use UPS in the last 12 months for domestic parcel shipping? 7%
23% Yes No
Yes No
77%
93%
USPS | 3.24
Claims Processing FedEx | 2.95 UPS | 2.81 USPS | 1.88
Refunds for Late Delivery FedEx | 2.48 UPS | 2.57 USPS | 2.19
Did you use USPS in the last 12 months for domestic parcel shipping?
32% Yes No
Pricing (published rates for service levels, willingness/fairness of negotiations)
Far fewer people used USPS and FedEx for domestic shipping in the last 12 months as compared to last year, while more people used UPS than in 2025.
68%
20 PARCELindustry.com SEPTEMBER-OCTOBER 2026
FedEx | 3.05 UPS | 2.62 USPS | 2.56 Overall, scores were slightly down compared to last year.
Other Insights into Our Industry
64%
36%
YES
NO
The number of our respondents who reported reaching out to their carrier reps to discuss concerns about how to handle volume growth, supply chain disruptions, etc. was slightly lower than 2025's 70%.
11%
17%
72% Very well; they addressed all concerns and handled them to the best of their abilities Somewhat well Not at all; we experienced significant disruptions that we feel could have been handled by the carriers to at least some extent Out of those who reached out, the number who said the concerns were handled very well declined compared to last year, but so did the number of folks who said their concerns weren't handled well at all.
32% YES
68% NO
The number of respondents who believe there is enough competition in the parcel industry declined.
8%
<100,000 100,000-499,999
8%
36%
12%
31%
YES
58%
NO
UNSURE
12%
500,000-1 million
Far fewer people are a definitive yes to adding Amazon to their carrier mixes, and the amount who are unsure jumped by 21 percentage points.
1-4 million >4 million
36%
Of those subscribers who answered our survey, the majority ship fewer than 500,000 packages per year, and the number who ship more than a million packages per year held steady at 16%.
0% 8% 33% 25%
What is your biggest complaint about your primary domestic parcel carrier?
25%
8%
Accessorial Charges | 28% Claims Processing | 4%
Needed to achieve better pricing Dissatisfied with service
Customer Service Response | 12%
Changed our level of service (i.e., air to ground)
Driver Behavior | 0%
Diversified to use more carriers
Fuel Surcharges | 16%
Reduced the number of carriers used
Fuel Surcharge Reversals | 0%
Re-bid transportation and a different carrier won
Invoices | 0% Negotiating Contracts | 0% On-time Performance | 4% Pricing | 20% Refunds for Non-performance | 0% Relationships with Carrier Reps | 4% Residential Deliveries | 0% Service Failures | 12%
Once again, accessorial charges are the biggest complaint shippers have with their primary carrier. The number who listed fuel surcharges as their biggest complaint jumped from 4% to 16% compared to 2025.
Tracking | 0%
0
10
20
30
40
50
60
70
22 PARCELindustry.com SEPTEMBER-OCTOBER 2026
80
90 100
Like in 2025, needing to achieve better pricing was the popular answer when our readers were asked why they modified their primary carriers. However, this year, no one reported reducing the number of carriers used, and the number who changed because they were dissatisfied with service increased significantly.
127%, with their revenue share more than doubling from 2024 levels. More options mean more complexity — but also more leverage, if you know how to use it. Practical Application: “What Should I Do About This?” These 10 best practices apply regardless of your industry or shipping profile — whether you’re managing field service deliveries or an e-commerce program at scale. #1 Know Your Shipping Profile Before any negotiation, know your data well: surcharge spend by type, average parcel weight, average zone, minimum charge exposure, and average cost-per-shipment. Carriers track all of this about your program. Go in knowing it better than they do.
TEN CARRIER CONTRACT NEGOTIATION BEST PRACTICES
T
By Mark Taylor
he rules of carrier contract negotiation have changed — and not in your favor. The days of the annual general rate increase (GRI) as the primary pricing lever are giving way to a more dynamic — and more aggressive — revenue model. Accessorial charges, introduced with greater frequency and often with little warning, are doing more work than the GRI ever did. If your negotiation strategy was built for a simpler environment, it needs an update. The macro picture isn’t helping either. In just the past year, shippers and carriers have absorbed tariff impacts, disruptions to established trade routes, and the downstream effects on diesel and jet fuel costs — the lifeblood of the parcel industry. These are not one-time events; they are the new operating environment. The Numbers Tell the Story From 2022 through 2025, FedEx’s published GRI increased by 27%. Over that same period, accessorial charges for oversize packages increased by 116%, and address corrections by 33%. The story at UPS is similar — a 27% GRI increase, while oversize fees climbed 108% and address corrections rose 45%. Fuel surcharges, once adjusted annually, are now updated on a near-quarterly basis by both carriers. Each increment looks small — typically 0.5% to 1.0% — but they compound. Meanwhile, the competitive landscape is shifting. In 2025, year-over-year volume growth for alternative carriers exceeded
24 PARCELindustry.com SEPTEMBER-OCTOBER 2026
#2 Negotiate More Often The era of the once-a-year contract review is over. When new charges arrive on a rolling basis, shippers who wait for their annual window are routinely paying costs that could have been negotiated down. Build a cadence of regular contract reviews — not just renegotiations, but active assessments of what’s changed and what it’s costing you. #3 Make Accessorials Your Primary Focus The GRI gets the headlines; accessorials are where your program is most exposed. They’re introduced with minimal notice, they stack on top of one another, and they’re rarely capped in existing agreements. A proactive monitoring approach — increasingly powered by AI tools that flag changes as they occur — will deliver more savings than fighting over base rate discounts. #4 Pay Attention to the Details in Carrier Data Carrier comparison is nuanced. FedEx Standard Overnight and UPS Next Day Air Saver are, for most practical purposes, the same service — but they’re not presented that way. If you’re benchmarking carrier costs and performance without accounting for these service-level equivalencies, your analysis will lead you astray. The insight is in the detail. #5 Model Before You Negotiate The interplay between base rates, accessorial charges, DIM factors, minimum charges, and fuel surcharges is too complex to work through intuitively — especially when variables are updating on a rolling basis. Simulation and contract comparison tools are no longer optional. They’re a prerequisite for effective negotiation. #6 Build the Relationship — but Know the Incentives The best agreements work for both parties. A carrier that feels squeezed will find other ways to make it up — and they have plenty of levers. Approach negotiations as problem-solving, not a zero-sum exercise. That said, keep in mind that your carrier rep is compensated to generate revenue, not to minimize your costs. You can have a good relationship and still negotiate hard. #7 Follow the Money Go into every negotiation with specific, dollar-quantified targets.
SUBSCRIBE FOR FREE! What are your top three cost drivers? Where is your surcharge spend concentrated? Which lanes carry the most volume? Unfocused negotiations produce unfocused results. Know exactly where the money is, and go after those levers first. #8 It’s Not Just About Rates The lowest-cost carrier is not automatically the best carrier. Consistent transit failures, surge capacity constraints, or gaps in specialized capabilities — cold chain, oversize handling, specific geographic coverage — carry real costs that won’t appear on your carrier invoice. Factor operational performance alongside rate in every evaluation.
Take the next step. Don't miss Reveel's session at PARCEL Forum’26 Orlando on Tuesday, September 15, where you'll see how leading shippers are using package-level modeling and AI to turn parcel data into a competitive advantage. #9 Include Operational and Financial Leaders Your carrier contract should reflect where your business is heading, not just where it is today. New distribution points, significant SKU changes, volume shifts — these belong in your negotiation targets. Procurement can’t negotiate effectively without visibility into the business plans that will define future shipping profiles. #10 Consider a Multi-Carrier Approach Perhaps the most powerful negotiating position is not being dependent on a single carrier. A multi-carrier strategy — matching package profiles to the best-fit carrier for each — creates inherent leverage. It also requires more robust spend management capabilities to navigate the complexity of volume tiers, earned discount thresholds, and an expanding ecosystem of alternative carriers and 3PLs. The investment in those capabilities pays for itself at the table. The Bottom Line Carrier contract negotiation has never been more consequential. The carriers have evolved their revenue strategies considerably — shippers need to match that evolution with sharper, more frequent, and more data-driven negotiation practices. Know your numbers, stay at the table, and focus your energy where the money actually is.
Mark Taylor is Vice President of Carrier Strategy at Reveel, where he guides customers in making decisions about their carrier strategies. With more than two decades of logistics, shipping, and transportation experience, he has held roles at enVista, FedEx, Lowe’s, and Transportation Insight. SEPTEMBER-OCTOBER 2026 PARCELindustry.com 25
W
THE STATE OF THE USPS: ONE YEAR INTO POSTMASTER GENERAL STEINER’S TENURE
By Jay Kent
hen David Steiner became the 76th Postmaster General of the United States Postal Service (USPS) on July 15, 2025, he inherited an organization at a crossroads. Steiner’s predecessor, Louis DeJoy, launched the ambitious 10-year Delivering for America transformation plan to address financial losses, declining letter mail volumes, changing consumer expectations, and an increasingly competitive parcel market. Steiner's challenge is to carry on with DeJoy’s plan and to prove the investments translate into improved service and a stable financial future. DeJoy’s plan emphasized parcel deliveries despite USPS’s universal service obligation to deliver mail to every ZIP Code in America six days a week. Steiner has continued this focus on USPS becoming a stronger player in the parcel market while maintaining its public service mission. The USPS’s public service mission has turned into a benefit for the USPS in certain geographic regions. A recent emphasis by Amazon on rural deliveries has also highlighted USPS’s competitive strength in these areas, where FedEx and UPS, for example, face higher operating costs and often turn to USPS for final delivery. Indeed, rather than attempting to compete directly across every parcel segment, Steiner appears focused on strengthening USPS's position in the areas where its nationwide network provides a structural advantage. While DeJoy’s plan seemed to focus more on directly competing against carriers such as FedEx and UPS, Steiner has reinforced USPS's role as a delivery partner. The Postal Service continues to perform last-mile deliveries for major carriers such as UPS. It also signed a multi-year contract, valued at $10 billion, with DHL eCommerce for last-mile parcel delivery services in the US. Additionally, in late December, USPS announced a bid solicitation for access to its last-mile delivery network. According to the announcement, shippers who wish to access the network of destination delivery units, also known as DDUs, will be able to propose a combination of volume, pricing, and tender times at each location, with
26 PARCELindustry.com SEPTEMBER-OCTOBER 2026
deliveries for successful bidders being made by USPS that same day or the next day, at the customer’s preference. “We want to allow customers to custom-build their lastmile solution. We want to make the service as convenient, cost-effective, and efficient as possible. We have achieved impeccable service performance scores for our last mile, which reflects the simple, quick-turn processing that occurs at a local DDU,” said Steiner. Steiner is also continuing modernization efforts and positioning USPS as a stronger player in package delivery. For example, automation efforts are helping to reduce costs and optimize transportation routes. While much of this work began before Steiner's arrival, his administration has accelerated implementation and placed greater emphasis on measurable service improvements. According to USPS leadership, these investments have improved package-handling efficiency, reduced transportation costs, and increased processing capacity ahead of peak shipping periods. Last year’s peak season, for example, proved successful for the postal operator. USPS reported service improvements compared to previous years, attributed to increased package processing capacity and more effective utilization of the redesigned logistics network. Additionally, rather than adding temporary resources, USPS emphasized improved network management, enabling facilities to process higher package volumes with fewer disruptions. Technology investments have also included predictive package arrival estimates, enhanced route optimization, expanded APIs for commercial customers, improved fraud detection, and continued investment in Informed Delivery and self-service technologies. Artificial intelligence also now plays an increasingly important role in route optimization, customer service improvements, fraud detection, and operational planning. Financial Woes Continue Despite automation efforts and other improvements, financial concerns have become even more urgent during Steiner's
SUBSCRIBE FOR FREE! first year. USPS continues to report significant losses as mail volumes decline faster than operating costs can be reduced. For the first six months of USPS’s fiscal year ending March 31, 2026, total operating revenue was up slightly, 0.003%, to $42.4 billion from $42.2 billion in 2025. Total loss from operations was also slightly lower at $3.201 billion, compared with $3.276 billion in 2025. However, total volume was down 6.7% compared to the previous year, with First-Class Mail volumes down 6.1% during the first quarter (period ending December 31, 2025) and down 6.3% during the second quarter (period ending March 31, 2026). Shipping and packages volumes declined 12.1% during USPS’s first quarter and were down 1.4% for the second quarter. Steiner has warned lawmakers that the organization could exhaust available operating cash without additional reforms. USPS’s latest projections show it’s no longer on track to run out of money in early 2027. It will, however, be likely to face a cash crisis sometime between fiscal 2031 and 2035. “What we are doing right now is we’re basically borrowing money from our retirement plans to fund current operations,” Steiner told the Senate Homeland Security and Governmental Affairs Committee in June. “I’m not particularly comfortable with that. I promise you, our employees are not particularly comfortable with that. You all shouldn’t be comfortable with that. None of us should be comfortable with that.” Without Congressional help, Steiner told the committee that USPS would need to cut services to become profitable.
But instead of pursuing growth at any cost, Steiner has emphasized profitable volume growth, as FedEx and UPS do. This means focusing on package business that fits efficiently within the existing network, improves asset utilization, and generates positive contribution margins. It also means rate increases, dimensional pricing changes, and the first-ever fuel surcharge, implemented in April and remaining in effect through January 17, 2027, at which time it will be evaluated for continuation or termination. USPS leadership argues that pricing adjustments are necessary to offset inflation and support long-term financial sustainability. There remain numerous questions about the USPS’s situation: Can it successfully compete in a competitive parcel market? Should it be privatized, completely brought back into the folds of the US government, or continue as a quasi-government entity? More importantly, is the government willing to provide financial assistance to the USPS? Steiner has accomplished much in his first year, but the future of the USPS remains murky. It faces a highly competitive market, and its costs remain too high. Being a quasi-government entity has also put it in a precarious position, in which the US government can decide either to assist or to privatize the postal operator.
Jay Kent is Founder and CEO of SLB Performance.
SEPTEMBER-OCTOBER 2026 PARCELindustry.com 27
2026 SPEAKER
By Bob Malley
PARCEL COST MODELING IS THE KEY TO UNLOCKING COST-EFFECTIVE CARRIER DIVERSIFICATION
F
inal-mile delivery has never been more complex or more expensive. New carrier services, dynamic pricing models, and an ever-expanding web of surcharges are quietly eroding shipper margins. The gap between expected delivery costs and actual carrier invoices keeps widening, and for many shippers, it's becoming an existential threat to profitability. The instinct is to go out to bid and negotiate hard on rates. But in parcel shipping, competitive comparisons are rarely straightforward, and carriers have always pressed their data analytics advantage over shippers. Primary carriers build discount tier structures that actively penalize diversification. It’s an unfair game without clarity on cost and service impact. Experimenting with alternative carrier without the right tools isn't a strategy — it's a gamble. The industry needs a better answer. Parcel modeling is it.
Just as IT organizations have long used sandboxing to stress-test new technologies before committing to costly implementations, next-generation parcel TMS platforms now offer logistics leaders the ability to run "what if" simulations. The result: rigorous insight into the real impact of carrier diversification, without disrupting financial models or customer delivery commitments. The Technology Behind Meaningful Modeling Effective parcel modeling isn't simply a matter of eyeballing spreadsheets. It requires purpose-built capabilities that most legacy systems were never designed to support. Modeling incorporates key capabilities to achieve data-driven results: Rate management. Carrier pricing has grown so complex that shippers have become almost entirely dependent on carrier APIs to calculate rates accurately. Instead, modern parcel
28 PARCELindustry.com SEPTEMBER-OCTOBER 2026
modeling tools use AI to ingest rates directly from carrier contracts, enabling business users to build and control rate cards and apply markups, discounts, or adjustments by region, customer, or SKU, all without IT intervention. Routing intelligence. Carrier coverage and carrier suitability are two different things. Routing rules need to encode and apply the nuances with real-world delivery processes. A regional carrier may be able to serve a geography but lack the capacity for oversized SKUs or the reliability to meet service commitments. Leading parcel TMS platforms provide no-code configuration tools that let logistics teams define carrier qualification logic quickly and maintain it as conditions change — no hard-coded programming, no lengthy implementation cycles. In-platform rating engines. Carrier rating APIs were built for executing one shipment at a time. They were never meant to iteratively run thousands of
SUBSCRIBE FOR FREE! cost comparisons at a time. Whereas modern parcel TMS system modeling platforms were purpose-built to process rates and routing rules at high speed, without dependence on carrier APIs or legacy SQL-based rate table lookups. That performance difference is what makes large-scale simulation practical. Data import flexibility. Modeling is only as good as the data that feeds it. Historical order detail, package-level data (PLD), and invoice records are valuable inputs, but they are rarely provided in clean, consistent formats. Parcel TMS platforms with built-in data mapping tools allow business users to normalize and map data without IT support, removing a chronic bottleneck in the modeling workflow. From Insight to Action With rates configured, routing rules defined, and data loaded, logistics leaders can run a broad range of scenarios that moves analysis from observation to
decision-ready intelligence. Order optimization applies rating and routing logic to order data to identify the most cost-effective shipping method for each shipment. Carrier diversification impact analysis
Take your parcel cost strategy one step further. If you're interested in modeling parcel costs, don't miss Sendflex's session at PARCEL Forum ’26 Orlando on how leading organizations are applying decision intelligence to optimize fulfillment, automate decisions, and uncover new savings opportunities.
quantifies the real savings and risks of introducing alternative carrier services into the mix. Rate change modeling measures the true financial impact of proposed carrier increases before they take effect. And invoice rate validation closes the loop, comparing contracted rates against actual carrier invoice data to surface billing discrepancies. Together, these capabilities give logistics managers the tools to stop reacting to cost pressures and start getting ahead of them. Delivery costs will continue rising as e-commerce grows. Carrier pricing will only get more complex. The shippers who will navigate that environment successfully aren't the ones who accept the status quo — they're the ones who model their way to a better one.
Bob Malley is the CEO/Founder, Sendflex Technology.
SEPTEMBER-OCTOBER 2026 PARCELindustry.com 29
BY DAVID LADNER
WHAT A PARCEL AUDIT ACTUALLY CHECKS (AND WHY MOST SHIPPERS MISS IT)
I
’ve been in the industry for over 40 years, and in that time, I've looked at more UPS and FedEx invoices than I can count. I can tell you the same four things go wrong on almost every one of them. Not because anyone at the carrier is trying to cheat anyone — they're not — but because the systems that generate these bills are enormous, automated, and built to bill first and let someone else catch the mistakes later. Usually, no one does. Here's what I mean, specifically.
carrier's belt, not a person with a tape measure, and those systems get it wrong more often than most shippers assume. A box that's slightly overpacked, an irregular shape that doesn't cube cleanly, a flap sticking up that throws off the scan — any of it can push your dimensional weight higher than it should be. And the formula itself gets adjusted periodically by the carriers. A rate that was accurate for your packaging last year may not be accurate today, and nobody proactively tells you it changed.
#1. Dimensional weight errors. Carriers bill you based on whichever is greater: the actual weight of your package or its "dimensional weight," calculated from length, width, and height. That sounds simple until you realize the measurement is almost always done by an automated scanning system on the
#2 Address correction surcharges. This is the one that frustrates shippers the most once they understand it, because half the time the address wasn't actually wrong. Carriers apply this surcharge when the address on your label doesn't match their internal database exactly — not "close enough," but exactly. A
30 PARCELindustry.com SEPTEMBER-OCTOBER 2026
missing suite number, an abbreviated street type, a ZIP+4 the system didn't recognize, and you get charged, even if the package delivered to the correct address without a hitch. I've seen shippers get hit with this surcharge on addresses they've shipped to a hundred times before, simply because a carrier updated its database and nobody told them. #3. Billed-but-not-shipped charges. This one is exactly what it sounds like: you get billed for a package that was manifested but never actually picked up, scanned, or entered into the carrier's network. It happens more than you'd think — a shipment gets voided after the shipping label is created, a driver misses a scan, a pickup gets cancelled — and unless someone is checking your invoice against actual tracking and scan data, not just
SUBSCRIBE FOR FREE!
your own shipping manifest, you will never know you paid for a package that never left your building. #4. Guaranteed service refunds. UPS, FedEx, and most other carriers guarantee on-time delivery for their premium, time-definite services. If the package is late, you're owed a refund. But that refund is not automatic. You have to catch the late delivery, confirm it against the guaranteed delivery window for that specific service level, and file the claim before the window closes — which for most carriers is a matter of days, not weeks. Carriers are not in a hurry to remind you of money they owe you. These are just some of the service errors and the rate errors are just as significant. Why Your Accounts Payable Team Can't Catch This I get asked constantly why a company's own AP or logistics team, reviewing
invoices every week, doesn't catch these errors themselves. The honest answer is that it's not a review problem, it's a math problem. To catch any of the four things above, you don't review the invoice — you have to recalculate it. You need the original shipment data, the actual carrier contract terms for that customer (not the published rate card), the actual scan and tracking history, and the guaranteed service terms for that specific service level. Then you rebuild what the charge should have been, shipment by shipment, and compare it against what was actually billed. That's not something a person glancing down a spreadsheet of totals can do. It's not something most transportation management systems do either; they're built to help you pick a carrier before you ship, not to reconcile the bill after the fact. It's a different discipline entirely, and it takes the kind of dedicated,
contract-specific auditing that most internal teams, understandably, don't have the bandwidth to run every week, on every invoice, forever. Most of the shippers I talk to have never run a formal audit and have no real sense of how much of their shipping spend is quietly being overbilled. Given the categories above, and given how automated and unforgiving these billing systems are, that number is almost always higher than people expect.
David Ladner is the founder and CEO of Transportation Cost Recovery, Inc. (TCR), which audits parcel and freight invoices for shippers on a contingency basis, recovering an average of two to five percent of clients' shipping spend with no upfront cost. He spent 20 years in corporate America before founding TCR, where he has now worked as an entrepreneur for 25 years. Learn more at tcrecovery.com.
SEPTEMBER-OCTOBER 2026 PARCELindustry.com 31
MUST-SEE BOOTHS AT SPONSORED CONTENT
Each of the PARCEL Forum exhibitors will help you with specific shipping and supply chain challenges. On the following three pages is a select group that you should definitely make sure you stop by and see during your time in Orlando. After visiting their booths, you may come away with a new appreciation for all the stellar solutions there are for small-package shippers!
BOOTH #
521
Stop by the AFMS booth to find out what your carrier agreement may be costing you. AFMS turns shipping data into leverage — helping shippers benchmark market pricing, uncover hidden cost drivers, and negotiate stronger parcel and LTL contracts. With 34+ years of experience and more than 500 years of combined carrier-side expertise from UPS, FedEx, DHL, USPS, and major LTL carriers, AFMS delivers insights that drive results. Bring a recent invoice or carrier agreement and ask about your complimentary shipping report card. Clients typically achieve a 10–25% savings on shipping rates. www.afms.com
BOOTH #
611
What is hiding inside your parcel data? For more than a century, CT Logistics has helped shippers gain greater visibility and control over transportation spend. Today, that experience is supported by leading technologies in parcel audit and payment, business intelligence, workflow automation, and transportation management. Stop by CT Logistics booth #611 to discuss how detailed parcel audit can identify billing errors, missed credits, service failures, lost packages, and other costs that may go unnoticed — and how better data can support more informed parcel decisions. www.ctlogistics.com • sales@ctlogistics.com • 216.267.2000 ext. 2190 32 PARCELindustry.com SEPTEMBER-OCTOBER 2026
BOOTH #
624
Step into the extraordinary speed of our fulfillment hub and experience the comprehensive advantages of our all-in-one parcel industry solutions. At Damon, we don’t just move packages; we optimize the entire logistics journey. Discover how our cutting-edge automation, intelligent conveying & sorting systems, and data-driven software integrate seamlessly to slash operating costs and boost throughput. Whether you are scaling up or fine-tuning efficiency, our experts are ready to demonstrate tailored strategies that deliver measurable ROI. Don’t let your competitors get ahead. Visit us at Booth #624 to discuss your parcel flow and capacity challenges. Sortation | Conveyors | Parcel Handling | System Integration www.damon-group.com
BOOTH #
304
More than a carrier. A partner invested in your success. Visit Booth 304 to discover how DHL eCommerce helps brands and high-volume shippers build smarter delivery strategies. From predictable performance and industry-leading visibility to dedicated support and tailored solutions, we help you deliver on your customer promise. Whether you're shipping across the country or around the globe, our nationwide network and international expertise provide the confidence to control costs, delight customers, and scale successfully. dhl.com/ecommerce-us
MUST-SEE BOOTHS AT BOOTH #
425
Stop by DMW&H's booth at PARCEL Forum to discover how the right automation strategy can improve parcel fulfillment, increase throughput, and create more efficient operations. Explore our intelligent material handling solutions, including indaGO™, our advanced Warehouse Execution System (WES), and connect with our team of experts to discuss your unique challenges. Whether you're planning a new automation project, expanding an existing facility, or looking to optimize current processes, we'll share practical insights and proven solutions that help operations perform at their best. www.dmwandh.com • 201.933.7840 • info@dmwandh.com
BOOTH #
309
Come see what's new at Engineering Innovation! We're celebrating 20 years of helping mail and parcel operations grow with practical automation, and we'd love to celebrate with you. Stop by for a first look at our new Prism Dimensioning System, experience our interactive minifigure Pick-to-Light demonstration, and chat with our team about the challenges you're facing. Whether you're looking to improve accuracy, boost throughput, or simply explore what's possible, we're ready to share ideas, answer questions, and help you find the right fit for your operation. www.eii-online.com • sales@eii-online.com • 765.807.0699
BOOTH #
208
If unpredictable carriers, surprise fees, or missed SLAs are costing you customers, we should talk. ePost Global routes across 100+ carriers in real-time, delivering 95%-99% on-time performance to 220+ countries worldwide. Backed by a team with 30+ years of experience per person, we help retailers eliminate SLA failures and turn shipping volatility into a competitive advantage. Stop by to see how smarter routing keeps your packages moving. epostglobalshipping.com • Inquiries@epostglobalshipping.com • 866.784.8444
BOOTH #
205
Stop by booth 205 to see how finance and supply chain teams take command of parcel, freight, and 3PL spend. FreightOptics brings carrier, mode, contract, and cost data into one AI-powered system, showing where spend is changing, why it changed, and where to focus next. Ask questions in plain language and get clear answers without waiting on another report. Use that intelligence to compare rates, strengthen carrier negotiations, recover overcharges, and protect margin. More than $1.7 billion in verified savings over 25 years. SOC 2 Type II certified and GDPR compliant. info@freightoptics.com • freightoptics.com • 954.753.7006
BOOTH #
405
Visit Green Mountain Technology’s booth (#405) for a hands-on conversation about your parcel network. Our experts go beyond high-level trends to discuss real opportunities to reduce costs, improve carrier performance, and strengthen operations. Bring your toughest parcel challenges and leave with actionable insights tailored to your business. greenmt.com • marketing@greenmt.com • 877.397.2834
BOOTH #
525
Turn Supply Chain Complexity into Competitive Advantage. Rising freight costs, labor challenges and operational inefficiencies don't have to slow you down. Visit Infios at Booth #525 to see how our connected Transportation Management, Warehouse Management, and Freight Audit & Payment solutions help reduce costs, increase throughput, and improve visibility across your supply chain operations. Discover how Infios AI enables Intelligent Supply Chain Execution, empowering your team to work smarter, scale faster, and deliver measurable results to create the future you need. Stop by Booth #525 and let's solve your next supply chain challenge. Infios.com • 800.328.3271 BOOTH #
516
Visit Intelligent Audit at PARCEL Forum to see what happens when 30 years of transportation expertise meets practical, award-winning AI. Discover how the platform trusted by CVS Health, Lululemon, Nordstrom, Wayfair, and H&M helps shippers uncover billing errors, unusual charges, fraud and emerging cost trends; automate lost and damaged claims; and turn complex parcel data into confident action. Meet Yosi™, the AI guide that brings trusted answers directly to your team, and learn how Intelligent Audit can help you find what others miss, recover more, reduce costs, and improve performance across your transportation network. intelligentaudit.com • info@intelligentaudit.com • 201.880.1110 BOOTH #
730
Reliable Logistics is a Canadian supply chain provider specializing in parcel delivery, customs brokerage, fulfillment, and freight management solutions. As a licensed Canadian Customs Broker, we help e-commerce businesses simplify cross-border shipping and successfully grow within the Canadian market. Through our proprietary TMS, ShipEzee, our customers benefit from real-time visibility and streamlined transportation management, while our experienced team delivers flexible solutions tailored to evolving business needs. Backed by reliability, transparency, and proactive customer support, our logistics solutions are designed to help growing businesses scale confidently across North America. www.reliablelogistics.ca SEPTEMBER-OCTOBER 2026 PARCELindustry.com 33
MUST-SEE BOOTHS AT BOOTH #
635
Shipping complexity is accelerating and has outgrown the operating model it was built for. Surcharges change continuously and actual package costs exceed headline rates. Legacy audit tools only explain what already happened, leaving shippers unable to anticipate changes or model future decisions. Reveel’s platform changes that. The AI-driven decisioning layer provides continuous visibility into spend and performance across carriers, delivering real-time insights, recommended actions, and modeling capabilities. Shippers can identify anomalies sooner, evaluate complex carrier proposals, and make faster, more confident decisions. Visit Reveel at booth 635 during PARCEL Forum to see the future of shipping intelligence. https://reveelgroup.com • support@reveelgroup.com • 877.421.4994 BOOTH #
308
Come by Sendflex Booth 308 and see why Ludicrous Speed matters. Sendflex's high-speed optimization engine processes millions of carrier rates and routing rules per second, enabling faster, more accurate multicarrier decisions across digital storefronts, order allocation, fulfillment, shipping, and returns. Discover how our agentic AI analytics, cartonization, and simulation modeling helps you optimize transportation strategies, anticipate the impact of carrier surcharges, and protect your margins before they affect your business. Stop by the booth to sign up for a complimentary 30-day rate modeling trial and measure the projected impact of the 2027 General Rate Increases (GRIs) on your parcel network. Sendflex.com
BOOTH #
409
If your parcel operation still runs on shipping software older than the iPhone, stop by the Shipium booth. Shipium is the platform that gives transportation teams total control over carrier selection, rating, and labeling — no service orders, no custom code, no waiting on IT. Customers typically cut shipping spend 12% in year one. At the show, we're demoing Always-On Audit, our newest product, which continuously audits every shipping decision and carrier invoice so overcharges never slip through. Come see why we are the only promise-to-payment shipping platform built for modern times. shipium.com • info@shipium.com • 206.401.5101
BOOTH #
201
Visit Sifted at booth #201. For more than 20 years, Sifted has helped parcel shippers control cost across complex, multi-carrier operations, now with AI-native logistics intelligence that runs continuously. Between surcharges, accessorials, and mid-year adjustments, the cost is already on the books by the time you're managing spend. SiftedAI closes the gap: it connects to 18+ carriers, baselines what you actually pay per package, watches for pricing changes in the background, and models the cost impact while you can still act on it. Come see it live. sifted.com • info@sifted.com
34 PARCELindustry.com SEPTEMBER-OCTOBER 2026
BOOTH #
401
TransImpact delivers Intelligent Transportation & Supply Chain Solutions that drive measurable savings and total cost clarity across the two most expensive aspects of your operations—logistics and inventory. Our platform and services help companies plan smarter, move faster, and make every dollar work harder through data-driven analysis, AI-driven technology, and automation. From parcel and freight to demand planning and inventory optimization, we help transportation teams turn complex data into confident decisions. Whether you're negotiating carrier contracts or forecasting demand, our experts and technology work together to reduce your costs and keep operations running with speed and precision. transimpact.com • sales-info@transimpact.com • 252.424.8410 BOOTH #
105
Transportation Insight helps organizations build smarter parcel networks through contract optimization, audit & financial visibility, proactive shipment tracking, analytics, and AI-powered intelligence. From label manifest through billing, we help shippers detect issues earlier, improve carrier accountability, and protect margin. Visit us at Booth #105 to learn more, then join us at the Margaritaville Margarita Tasting just across the aisle during exhibit hall hours on Tuesday and Wednesday. www.transportationinsight.com • mrktevents@t-insight.com • 205.568.0648
BOOTH #
716
Stop by our booth to discover how United Delivery Service is revolutionizing Midwest shipping. We offer unparalleled reliability, speed, and exceptional customer service. Learn how our commitment to quality can streamline your operations and boost your bottom line. Let us show you why we’re the preferred choice for businesses demanding excellence in delivery. www.uniteddeliveryservice.com
BOOTH #
523
Stop by Booth 523 to see how U.S. Bank Freight Payment helps shippers bring greater clarity, control, and confidence to their transportation spend. We help organizations move beyond invoices and transactions to gain actionable visibility into parcel and freight costs, uncover savings opportunities, and make informed decisions. We work with some of the world's most complex transportation networks, delivering the data, analytics, and expertise needed to simplify operations and strengthen financial performance. Whether you're looking to improve spend management, enhance reporting, or turn transportation data into strategic advantages, we welcome the opportunity to discuss your goals and share what's possible. usbank.com/transportation-solutions/small-parcel • CPSFreightPayment@usbank.com
BY TONY POLIMENO
WHERE FULFILLMENT PRESSURE WILL HIT IN 2026
E
-commerce demand is still growing, but the cost story has moved downstream. The next fulfillment challenge is not simply more orders. It is more orders with harder parcel profiles, tighter return expectations, more marketplace rules, and less margin for operational error. That is the practical warning inside the Prep Partners Group 2026 Ecommerce Fulfillment Pressure Index. For parcel and fulfillment teams, the takeaway is straightforward: average cost per shipment is becoming less useful when it is viewed alone. Two brands can ship the same number of parcels and experience very different pressures depending on return rates, cube, item value, storage dwell time, pick complexity, packaging requirements, and the mix of marketplace versus direct-to-consumer orders. The Pressure Is Operational, not Abstract The index compares product categories using public e-commerce, returns, carrier, warehousing, and marketplace fee signals, then weighs those signals against common fulfillment friction points. It is a directional index, not a financial forecast, but it helps identify where the hidden costs of e-commerce are most likely to surface.
Apparel and accessories ranked highest in the index with a score of 91. That should not surprise anyone who has managed size variation, seasonal SKU expansion, high return rates, and restocking workflows. The outbound parcel may look simple, but the reverse logistics path often decides whether the order was profitable. Amazon FBA and FBM sellers followed closely with a score of 89. Their pressure is different. It comes from fee changes, surcharge exposure, inbound prep, compliance requirements, and inventory placement decisions. A seller may be operationally strong and still lose margin if it treats FBA, FBM, and third-party fulfillment as interchangeable instead of modeling where each SKU belongs. Electronics and consumer goods scored 86 because higher product value changes the risk profile. Damage prevention, serial tracking, return fraud exposure, and packaging discipline become more important than a simple pick-pack benchmark. Health, wellness, and beauty; corporate gifts; pet products; food and beverage; and home goods also showed elevated pressure for reasons ranging from lot control and bundle complexity to bulky cartons, breakage, and storage burden.
36 PARCELindustry.com SEPTEMBER-OCTOBER 2026
Where the Pressure Shows Up First Fulfillment pressure usually appears before it shows up clearly in a profit-and-loss statement. It appears in customer service tickets tied to returns. It appears in warehouse touches that were not included in the original fulfillment quote. It appears in dimensional weight adjustments, late inbound shipments, exception handling, packaging changes, and slow-moving inventory that crowds the pick path. That is why operators should pressure-test five areas before peak season. First, review cost per order by SKU family, not only by account. Teams that have not recently modeled the full order economics can use a fulfillment cost calculator or a 3PL cost calculator as a starting point, then refine the assumptions with actual parcel, labor, packaging, and return data. Second, isolate return-heavy categories. In many e-commerce operations, returns are treated as a customer policy issue, but they are also a parcel and warehouse planning issue. The real cost includes inspection, repackaging, restocking, replacement shipments, refund timing, lost inventory value, and customer support time. Third, revisit cartonization and dimensional weight. A lightweight product with poor cube efficiency can create more
SUBSCRIBE FOR FREE! parcel pressure than a heavier product with predictable packaging. This matters especially for home goods, pet products, promotional kits, and mixed-cart orders where packaging design and inventory layout directly affect shipping cost. Fourth, separate marketplace fulfillment decisions from brand preference. Amazon sellers should not ask only whether an SKU can go through FBA. They should ask whether the SKU's prep requirements, fee exposure, sales velocity, storage profile, and return behavior make it better suited for FBA/ FBM prep, merchant fulfillment, or a blended model. Fifth, examine value-added work as a cost center and a quality control point. Kitting, bundling, branded pack-outs, lot control, and custom packaging can improve customer experience, but they also introduce labor steps and error risk. If those steps are not documented and measured, they become invisible margin leaks.
Planning Is Key to Taking the Pressure Off The most useful fulfillment conversations in 2026 will not be limited to carrier rates or pick fees. They will connect merchandising, parcel strategy, inventory placement, returns, and warehouse workflow. A category that looks profitable in paid media or marketplace reporting may be much less attractive after fulfillment pressure is included. That does not mean brands should retreat from high-pressure categories. It means they should plan them differently. Apparel brands may need more disciplined return disposition rules. Electronics brands may need stronger packaging and serial-control processes. Beauty brands may need tighter lot tracking and small-item pick accuracy. Corporate gift programs may need earlier kit planning and better recipient data controls. The brands that respond best will be the ones that treat fulfillment as a strategic margin function rather than a back-office expense. They will model
cost per order before volume spikes. They will use inventory management data to reduce storage drag. They will choose fulfillment and distribution partners based on category fit, not only rate sheets. And they will look at returns, packaging, and marketplace requirements as connected parts of the same parcel economics problem. The index's key message is that e-commerce growth does not create equal fulfillment pressure across categories. In 2026 and beyond, the operators who understand those differences earliest will have the best chance to protect margin while still meeting customer expectations.
Tony Polimeno is CEO at Prep Partners Group, an e-commerce fulfillment and 3PL partner helping brands manage inventory, kitting, FBA/FBM prep, and order fulfillment. Learn more at preppartnersgroup.com.
By Jeffrey Haushalter
OUTSOURCING PARCEL FULFILLMENT: WHEN A 3PL CREATES COMPETITIVE ADVANTAGE
M
ost discussions about outsourcing begin with freight rates and warehouse costs. That approach often leads companies to the wrong conclusion. The better question is whether your organization should be operating a warehouse at all. For sophisticated parcel shippers, fulfillment has become a strategic capability that demands continual investment in facilities, technology, labor, transportation, and process improvement. Every dollar invested in logistics is a dollar that cannot be invested in product development, sales, manufacturing, or customer innovation. Over the past several years, we have evaluated parcel fulfillment operations ranging from single-site manufacturers to national distribution networks.
While every engagement has unique challenges, the underlying reasons companies consider outsourcing remain remarkably consistent. Our research (see Figure 1) found that the most successful organizations pursue improvements in customer service, network reach, delivery speed, and operational flexibility. Reducing operating costs is almost always at the bottom of the list. One of the strongest arguments for a 3PL is geographic expansion. A company operating from a single distribution center can serve nearby customers efficiently but often struggles to meet delivery expectations in distant markets. Opening another company-operated facility requires time, capital, engineering resources, technology, recruiting, and management attention. 3PLs often have
38 PARCELindustry.com SEPTEMBER-OCTOBER 2026
Figure 1
established facilities, systems, labor, and transportation relationships in new markets. This means inventory can often be deployed within weeks instead of the many months required to build a new operation.
SUBSCRIBE FOR FREE!
Geographic positioning also shortens parcel zones. That improvement produces benefits far beyond transportation savings. Average transit time decreases. Damage claims decline. Expedited shipments become less common. Customer satisfaction improves. Returns cycle faster. Inventory spends less time in transit. These improvements create structural value versus negotiating another percentage point off carrier rates. Technology provides another compelling reason to evaluate outsourcing. Modern fulfillment requires warehouse management systems, transportation management systems, parcel manifesting, business intelligence, labor management, application programming interfaces, cybersecurity, and continuous software upgrades. A mature 3PL spreads these investments across many customers, allowing each client to benefit from capabilities that would be expensive to develop independently. Customer expectations continue to raise the standard for fulfillment performance. Many organizations compete on same-day shipping and next-day
delivery. Regional fulfillment allows later order cutoffs because inventory sits closer to the customer. Extending the shipping window from noon until early evening often creates more customer value than reducing handling costs by a few cents per order. Post-Covid labor has also become a strategic challenge. Recruiting, training, retaining, and managing warehouse associates require specialized expertise. Seasonal businesses face an even greater challenge because staffing levels fluctuate dramatically throughout the year. Large logistics providers recruit continuously, maintain established labor pipelines, and balance personnel across multiple operations. That flexibility can significantly reduce operational bottlenecks during peak periods. Many companies also seek greater financial flexibility. Distribution centers require substantial fixed investments in buildings, equipment, software, supervision, and maintenance. A well-structured outsourcing agreement converts much of that expense into transaction-based pricing. Organizations
pay for activity rather than idle capacity. During periods of uncertain demand, a variable cost structure often provides greater financial resilience than owning excess warehouse capacity. Micro-fulfillment has expanded the outsourcing discussion even further. Rather than committing immediately to a large regional distribution center, companies can position fast-moving inventory closer to concentrated customer populations through smaller outsourced facilities. This approach improves delivery speed while allowing management to validate market demand and test the water before committing significant capital. Not every operation belongs inside a 3PL. Companies operating in highly regulated industries, supporting customers with exacting service requirements, or managing products where a fulfillment error carries substantial financial, legal, or reputational risk should think carefully before outsourcing. In these environments, direct operational control often creates more value than the potential savings or flexibility offered by a third-party provider. SEPTEMBER-OCTOBER 2026 PARCELindustry.com 39
gy roadmaps, and contingency planning should remain collaborative activities rather than contractual obligations. The strongest 3PL relationships function as long-term partnerships rather than vendor arrangements. Both organizations invest in improving customer performance. Both organizations share operational data. Both organizations solve problems before customers experience them. Parcel networks continue to evolve as customer expectations, technology, labor markets, and transportation economics change. The right answer five years ago may not be the right answer today. Every shipper should periodically challenge existing assumptions and ask whether each component of its fulfillment network is still creating competitive advantage. Figure 2 is a practical framework for evaluating whether outsourcing aligns with your business objectives. Few companies fall entirely into one column. The more conditions that align with the third column, the stronger the strategic case for evaluating a 3PL. Most organizations discover that different product lines, customer segments, or geographic markets justify different operating models. Hybrid networks continue to gain popularity because they combine the strengths of internal operations with the flexibility of specialized logistics providers. One final point deserves emphasis. Outsourcing does not eliminate operational risk. It changes who performs the work while leaving accountability with the shipper.
Companies that outsource and disengage often become disappointed. Companies that outsource and actively manage the 3PL relationship frequently discover that their logistics network becomes more responsive, more scalable, and better aligned with long-term business strategy. Successful outsourcing requires disciplined supplier management. Here are some tips: Service level agreements must define expectations clearly Performance metrics should measure customer outcomes rather than warehouse activity Executive business reviews should identify opportunities for continuous improvement. Forecasts, capacity planning, technolo-
Outsourcing does not eliminate operational risk. It changes who performs the work while leaving accountability with the shipper. If your organization has not conducted a strategic review of its fulfillment network within the past several years, now is the time. Evaluate your current operation and determine whether your network supports the business you plan to become rather than the business you have today. Finally, remember the objective is not simply to outsource. The objective is to build a parcel network that delivers superior service, scales with growth, and creates lasting competitive advantage. '
Jeffrey Haushalter is the Managing Partner at Chicago Consulting. The firm specializes in reducing supply chain costs, improving delivery speed, and delivering exceptional customer experiences. He can be reached at jeff@chicago-consulting.com. 40 PARCELindustry.com SEPTEMBER-OCTOBER 2026
By Phil Riebel
SUSTAINABLE PACKAGING IN THE PARCEL INDUSTRY: WHY LIFE-CYCLE THINKING MATTERS
S
ustainability has become a major priority for retailers, e-commerce companies, manufacturers, and parcel carriers. Customers increasingly expect packaging that is recyclable, responsibly sourced, and designed to minimize waste. At the same time, companies are facing growing pressure from regulators, investors, and major retailers to reduce carbon emissions and improve environmental performance throughout their supply chains. Most parcel packaging used in e-commerce is paperbased, consisting primarily of corrugated fiberboard boxes supplemented with paper or plastic protective materials. Consequently, the environmental footprint of a typical parcel is largely driven by the production, transportation, and end-of-life management of corrugated packaging. Many discussions focus on a single attribute such as recycled content, recyclability, compostability, or plastic reduction. While these characteristics are important, they provide only a partial picture. Truly sustainable packaging requires a life-cycle perspective that considers the environmental impacts of a package from raw material extraction through manufacturing, transportation, use, recycling, and disposal. Organizations that want to improve packaging sustainability must first understand the complete environmental footprint of their packaging systems and then redesign products, packaging, and supply chains to reduce those
42 PARCELindustry.com SEPTEMBER-OCTOBER 2026
impacts. Companies that adopt this approach often discover opportunities to lower costs, improve operational efficiency, enhance customer satisfaction, strengthen brand reputation, and reduce risk. Understanding the Packaging Life Cycle Every package has environmental impacts at multiple stages of its life cycle (Figure 1). These stages collectively determine the environmental footprint of a package and highlight why sustainability decisions should be evaluated across the entire life cycle rather than focusing on a single attribute. Life-cycle assessment (LCA) is widely recognized as one of the most comprehensive methods for evaluating environmental impacts because it avoids shifting environmental burdens from one stage of the life cycle to another. For example, replacing a plastic package with paper may improve recyclability, but it may also increase package weight, transportation impacts, or manufacturing energy requirements. Similarly, increasing recycled content may appear beneficial, but the overall environmental footprint depends on factors such as raw material sourcing, manufacturing efficiency, package performance, transportation distance, and end-of-life management. The goal should not be to optimize one attribute, but rather to reduce the overall environmental footprint of the package.
SUBSCRIBE FOR FREE!
Measuring What Matters The first step toward sustainable packaging is measurement. Organizations cannot improve what they do not measure. Life-cycle assessment (LCA) helps quantify impacts such as: Greenhouse gas emissions Energy consumption Water use Air emissions Waste generation Resource depletion The results often reveal surprising opportunities for improvement. Many life-cycle studies have shown that the largest contributors to packaging-related greenhouse gas emissions are often manufacturing processes, material production, and end-of-life disposal rather than transportation, which is frequently assumed to be the primary contributor. There are several tools which are increasingly used to communicate environmental performance of a product or a manufacturer based on a life-cycle approach: Environmental Product Declarations (EPDs) provide transparent and independently verified environmental information that allows buyers to compare products using consistent methodologies. Sustainability scorecards such as the Environmental Paper Assessment Tool (EPAT) and Paper Profile, which are widely used in the paper sector. The EcoVadis ranking system. These tools can help evaluate the sustainability of packaging products or suppliers across multiple environmental and social performance indicators.
What Does an Ideal Sustainable Package Look Like? One of the most useful questions packaging professionals can ask is: What would an ideal package look like from a sustainability perspective? The answer requires balancing environmental performance, functionality, customer experience, and cost. It should perform well across the entire product life cycle. An ideal package would: Use the minimum amount of material necessary to protect the product. Be right-sized, avoiding oversized boxes and excessive void fill. Have a low carbon footprint across its life cycle. Use responsibly sourced renewable or recycled materials where appropriate. Be manufactured using energy-efficient processes and low-emission production technologies. Protect the product effectively and minimize damage, returns, and replacement shipments. Be designed for reuse, recycling, composting, or recovery at the end of its useful life. Avoid unnecessary coatings, laminates, inks, or components that interfere with recycling. Include clear disposal or recycling instructions for consumers. Be supported by credible environmental claims and certifications. These characteristics closely align with the principles promoted by the Sustainable Packaging Coalition (SPC) and the Ellen MacArthur Foundation. Both organizations advocate packaging systems that minimize material use, optimize resource efficiency, reduce waste, improve recyclability, and keep materials in productive use for as long as possible. From a practical perspective, sustainable packaging is not simply about selecting a different material. It is about redesigning systems to eliminate unnecessary packaging, improve recovery and recycling, reduce dependence on virgin resources, and optimize performance throughout the supply chain. Where Does the Carbon Footprint of a Box Come From? One of the most common misconceptions is that transportation is the dominant contributor to packaging-related carbon emissions. Life-cycle studies conducted by organizations such as the Forest Products Association of Canada (FPAC), the American SEPTEMBER-OCTOBER 2026 PARCELindustry.com 43
Forest & Paper Association (AF&PA), and the European Federation of Corrugated Board Manufacturers (FEFCO) consistently demonstrate that raw material production (25-40%) and manufacturing (35-55%) often represent the largest share of the carbon footprint of corrugated packaging.
performance. These labels can help purchasers identify products that meet specific environmental, sourcing, climate, or circular economy criteria. • Forest Certification Systems o Forest Stewardship Council (FSC) o Program for the Endorsement of Forest Certification (PEFC) o Sustainable Forestry Initiative (SFI) • Environmental and Life-Cycle-Based Labels o EU Ecolabel o Nordic Swan Ecolabel o UL ECOLOGO o Green Seal • Carbon and Climate Labels o Climate Neutral Certified o Carbon Trust Carbon Footprint Certification o Carbon Balanced Packaging • Circular Economy and Product Sustainability Labels o Cradle to Cradle Certified • BPI Compostable Certification No single label captures the complete sustainability profile of a package. Organizations should use certifications alongside life-cycle assessment, supplier engagement, and continuous improvement programs.
As a result, reducing package weight, improving manufacturing efficiency, increasing recycled fiber utilization where appropriate, and maximizing recovery rates often produce greater environmental benefits than focusing solely on transportation impacts. Examples from the Parcel Industry Several major companies have demonstrated how life-cycle thinking can improve packaging performance. Amazon's Ships in Product Packaging Program — Amazon works with manufacturers to ship products in their original packaging without additional Amazon boxes when possible. This reduces material use, improves transportation efficiency, and lowers waste generation. Amazon's Transition Away from Plastic Air Pillows — Amazon has replaced billions of plastic air pillows with recyclable paper-based alternatives across much of its North American fulfillment network. Walmart Project Gigaton — Project Gigaton encourages suppliers to reduce greenhouse gas emissions through packaging optimization, transportation efficiency, waste reduction, and supply chain improvements. These initiatives illustrate an important principle: sustainable packaging is often achieved through system redesign rather than simple material substitution. Sustainability Labels and Certifications Packaging may display a variety of environmental labels and certifications designed to communicate sustainability 44 PARCELindustry.com SEPTEMBER-OCTOBER 2026
The Path Forward For companies operating in the small-package sector, sustainability should begin with measurement. Organizations should: 1. Inventory packaging materials and suppliers. 2. Measure environmental impacts using LCAs, EPDs, supplier scorecards, and data. 3. Use sustainability reporting tools and supplier assessments to support purchasing decisions. 4. Identify the largest contributors to environmental impacts. 5. Redesign packaging systems to reduce material use, carbon emissions, and waste. 6. Communicate performance using credible eco-labels and science-based metrics. The companies that will lead the next generation of sustainable packaging will not be those making the loudest environmental claims. They will be the organizations that understand the complete life-cycle footprint of their packaging, measure performance rigorously, engage suppliers, and continuously improve their packaging systems based on data, science, and innovation.
Phil Riebel is President of Sustainable Paper Group Inc. and has more than 35 years of sustainability experience in paper, packaging, and environmental management. Sustainable Paper Group also operates and manages the Environmental Paper Assessment Tool (EPAT) and Carbon Balanced Paper in North America.
SUBSCRIBE FOR FREE!
2026 SPEAKER
BY KEITH SWIEDNICKI
THE METRICS THAT MATTER: A DISTRIBUTION KPI FRAMEWORK
E
very distribution center drowns in numbers, yet a handful of KPIs explain most of the performance story. The difficulty is that the metric executives watch most — total cost per case — is a lagging indicator that can become a black box. We’re going to explore a compact framework across five domains — cost, productivity, service, inventory, and transportation — separating the outcome metrics that report the result from the operational drivers that move it, with reference points drawn from our 40 years in business, historical benchmarking, and live executive dashboards. Cost: The Bottom Line, and Why It Deceives Total warehouse cost per case is the pulse of an operation — but it's a lagging indicator. It's the net result of labor rates, productivity, and operating volumes, along with countless daily decisions, which is precisely why it can become a black box: the number moves, but it doesn't tell you why. Benchmarking cost per case is also harder than it looks, since wage rates vary widely across the country and with
46 PARCELindustry.com SEPTEMBER-OCTOBER 2026
automation in the mix, the variable cost per case becomes more sensitive to volume than to headcount — so any decline or increase in volume shipped moves the number, independent of how well the operation is running. The upside: if capacity permits, automation can lower cost per case as volume ramps up- delivering better service and lower cost at the same time. This is especially important for 3PL operators, as service and cost drive their business. A useful dashboard decomposes it. One operator's executive view, for example, shows a total cost per case of about $0.42 — split into roughly $0.04 of fixed and $0.38 of variable cost, with direct cost per case near $0.22 alongside distribution cost at 4.26% of sales, warehouse cost at 2.32%, and labor at 1.23%. Expressing cost both per case and as a percentage of sales matters: the per-case view exposes operating efficiency, while the percentage-of-sales view shows the burden the business carries. Benchmark ranges vary widely with scale and scope — distribution cost commonly lands in the low-to-mid teens as
a share of sales — so the point is never the absolute figure but the trend and the gap to comparable operators. Productivity: The Lever Behind the Cost If cost per case is the result, productivity is the cause you can control. The core measures are cases per worked and paid hour at three levels: selection rate, direct-labor rate, and total throughput. Selection deserves the closest watch because it consumes roughly 56% of all direct-labor hours — and within selection, travel can account for a third of the time. Every productivity KPI should carry its cost twin: dead time and delay have a dollar figure attached, not just a percentage, and that figure is what earns the KPI a seat on the executive dashboard. The prize is large: Best-of-breed operators run nearly twice the productivity of the average, and gaps of 3.5 to four times persist across departments, meaning laggards could cut labor hours by up to 60% by matching top performers. A live dashboard showing, say, 159 direct cases per hour and 113 throughput cases per hour is only meaningful against that best-of-breed reference and the operation's own history. Service, inventory & transportation: Three more domains round out the picture. Service and quality protect the revenue line: service level — the sharper read, since it ties directly to lost sales rather than just what shipped — alongside fill rate (top operators sustain 97–99%), out-of-stocks, damage and scratches, and order accuracy. SEPTEMBER-OCTOBER 2026 PARCELindustry.com 47
A slipping service level is an early warning that productivity gains are being bought at the customer's expense. Inventory measures both capital efficiency and freshness — inventory accuracy (near 99% in well-run operations), inventory turns (into the low teens), shrink stated in dollars so its financial weight stays visible, and days or weeks of supply, where even a one-day reduction frees meaningful working capital. Transportation is the other half of distribution cost: cost per mile and per case, cases per stop, and stops per route. Because outbound freight can rival warehouse labor as a cost center, these belong on the same executive dashboard rather than in a separate silo.
The KPIs That Matter Most
Reading KPIs well A number alone is not a KPI; it earns the title only when paired with a target and a trend. Five practices separate operators who manage by metric from those who merely report them. First, pair lagging with leading indicators. Never look at cost per case without the productivity, service, and inventory drivers behind it. And know your fixed-versus-variable distribution cost split — variable costs typically runs around 60%. Second, segment by department or area; a consolidated rate hides in the different shipping units, pallet, case or eaches and this is where the real opportunities live. 48 PARCELindustry.com SEPTEMBER-OCTOBER 2026
Third, benchmark on two axes. Internally, against the operation's own best results — total cost per case, cases per worked hour, productivity with its dead-time and delay costs, and transportation cost per case or per kilometer (with or without a fuel index) — which strips out regional and operational noise and keeps the comparison honest. Externally, against best-in-class industry performers — distribution cost as a percentage of sales, service level, and total supply chain shrink including inventory accuracy and turns — because the gap to top performers, wherever it's measured from, is the size of the prize. Fourth, refresh continuously, because volumes, assortment, and wage rates shift constantly, and a dashboard that updates once a year is a rearview mirror. Fifth, link each KPI to an organizational cost wherever possible — a metric tied to a dollar figure earns ownership and gets watched; one that floats on its own gets reported once and forgotten. Conclusion The right KPI framework is small, balanced, and benchmarked. A dozen well-chosen metrics — read together, segmented, and refreshed often — turn a warehouse from a black box into a managed system. And it must be noted that there may be other KPIs not mentioned here, such as safety and associate satisfaction, that are also critical to the organization, so it’s important to tailor your framework accordingly. The operators who treat their dashboard as a decision tool rather than a report card are the ones who close the gap to best-of-breed.
Keith Swiednicki is President and CEO of Keith Swiednicki International Inc. (aka KSi), whose expertise and innovation have set new benchmarks in the industry. In the KSi 2025 benchmarking survey, leaders were asked where AI will help their distribution center most over the next 3–5 years. Slotting & storage optimization ranked near the top of the list. Come see how KSI’s DLM agent, which uses a data-driven predictive algorithm to continuously optimize slotting configurations, works at this year’s PARCEL Forum in Orlando.
APPLICATION ARTICLE
The Freight Your TMS Can't See Most transportation management systems were built to do one thing well: move freight out of the distribution center. Outbound, well planned. That's where most TMSs live and where their reach stops. A large share of what companies ship never touches a DC. Samples moving from a factory in Vietnam. Store transfers. Ship-to-customer from a brick-and-mortar store. Those shipments run on static routing guides and manual data entry, not purpose-built software. It's where cost hides, and it's where most TMS platforms have nothing to say. Acuitive was built to address that gap. Acuitive started 25 years ago in heavy air freight with a rate calculator. The market wasn't ready for dynamically managed air freight, and the industry's technology couldn't support it, so the company followed demand into ocean, small parcel, and freight audits. The audit grew. It became two thirds of the business and consumed most of the company's resources. Last year Acuitive rebuilt the audit platform, partitioned it, and divested it, so it could refocus on small parcel originating outside the DC. That answer is OptiPost, re-platformed and released this year. The company calls it a first step, not the last. The problem starts at origin. When a supplier generates an international shipment, they often work through eight to twelve screens on a carrier's proprietary manifesting system, with no prompts, no guardrails, and no confirmation that they entered the data correctly, or at all. Every client has a set of routing rules, often several guides, based on the divisions within the company. The supplier is left to guess what to enter, usually inside systems no one ever trained them to use. The errors they create at origin don't surface until later, as customs holds, delivery delays, address corrections, and duty and tax exposure the shipper never needed to take on. Logistics get blamed for all of it. But logistics didn't create the problem and often doesn't own it. The pain is felt in design, production, and finance. Logistics just cleans up after the fact. Acuitive's answer is to attack the problem at the source. OptiPost digitizes the routing instructions, so suppliers stop working through layers of client-specific decisions by hand. The software leads each supplier through the correct process,
with guardrails that build the shipment per the company's guide and pass the right information to carriers. Downstream failures can be virtually eliminated. Top global fashion brands have seen a 90% to 95% reduction in unforced customs and delivery delays. OptiPost’s sister product, Ensemble, is built for sample shipping. Ensemble integrates with product lifecycle management systems (PLM) to give design teams origin-through-receipt visibility inside PLM, so designers work in the system they already know instead of toggling between several. On cost, Acuitive reports OptiPost and Ensemble have each delivered 25% to 30% reductions in transportation spend. A third product, AcuRoute, focuses on integrating a static PDF routing guide into configurable system guardrails. The difference is that AcuRoute optimizes air, ocean, & parcel. All of Acuitive's solutions provide downgrade-to-save logic and cost visibility to empower your users while maintaining centralized control. Fashion is where Acuitive cuts its teeth, and there's a reason. Schedules are tight, urgency is constant, and margins are thin, so the operational discipline runs high. Carriers have told Acuitive that medical devices and aerospace teams look at what's been built for fashion and ask why nothing like it exists for them. Acuitive has the answer. Tariff and regulatory changes hit customers hard. Duties and taxes depend on how a shipment is generated, and origin is where Acuitive's customers want control. Correcting bad data after the fact is expensive and slow. Preventing the error is the only place the problem can be solved. The industry has spent two decades optimizing the freight that leaves a distribution center. The freight that never touches the DC is still waiting. Acuitive is betting that's where the next decade of work is.
www.acuitivesolutions.com
SUBSCRIBE FOR FREE!
TO SUM UP While B2C returns tend to have higher volumes, B2B returns are typically more operationally complex and tend to be highervalue and more expensive to process per transaction. — TONY SCIARROTTA
The era of the once-a-year contract review is over. When new charges arrive on a rolling basis, shippers who wait for their annual window are routinely paying costs that could have been negotiated down. Build a cadence of regular contract reviews — not just renegotiations, but active assessments of what’s changed and what it’s costing you. — MARK TAYLOR
Fulfillment pressure usually appears before it shows up clearly in a profit-andloss statement. It appears in customer service tickets tied to returns. It appears in warehouse touches that were not included in the original fulfillment quote. It appears in dimensional weight adjustments, late inbound shipments, exception handling, packaging changes, and slowmoving inventory that crowds the pick path.
Not every operation belongs inside a 3PL. Companies operating in highly regulated industries, supporting customers with exacting service requirements, or managing products where a fulfillment error carries substantial financial, legal, or reputational risk should think carefully before outsourcing. In these environments, direct operational control often creates more value than the potential savings or flexibility offered by a third-party provider.
— TONY POLIMENO
— JEFFREY HAUSHALTER
50 PARCELindustry.com SEPTEMBER-OCTOBER 2026
From a practical perspective, sustainable packaging is not simply about selecting a different material. It is about redesigning systems to eliminate unnecessary packaging, improve recovery and recycling, reduce dependence on virgin resources, and optimize performance throughout the supply chain. — PHIL RIEBEL
UPS, FedEx, and most other carriers guarantee on-time delivery for their premium, time-definite services. If the package is late, you're owed a refund. But that refund is not automatic. You have to catch the late delivery, confirm it against the guaranteed delivery window for that specific service level, and file the claim before the window closes — which for most carriers is a matter of days, not weeks. Carriers are not in a hurry to remind you of money they owe you. — DAVID LADNER
Shipping Has Outgrown Its Operating Model 92% of shippers lack visibility into real-time shipping costs. 86% cannot model the financial impact of a carrier decision in real time. Reveel gives shippers a more strategic, connected way to plan, manage, and govern their carrier networks. With real-time modeling, simulation, audit, analytics, and automation, teams can reduce costs, improve performance, and make more confident decisions. Visit the Reveel team at Parcel Forum in booth 635 to see how Reveel’s Shipping Intelligence Platform will help you:
Plan for your carrier network strategy
Manage your shipping and carrier spend with analytics and insights
Learn more about what Reveel is showcasing at Parcel Forum 2026
www.reveelgroup.com
© 2026 Reveel
Govern your data through auditing, monitoring and reporting