


Ray White Tugun Commercial: Burleigh Heads Market Insights
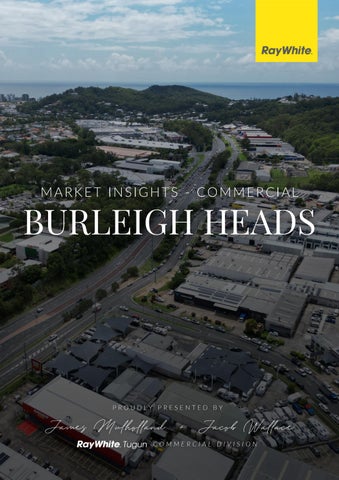
Ray White Tugun Commercial: Burleigh Heads Market Insights
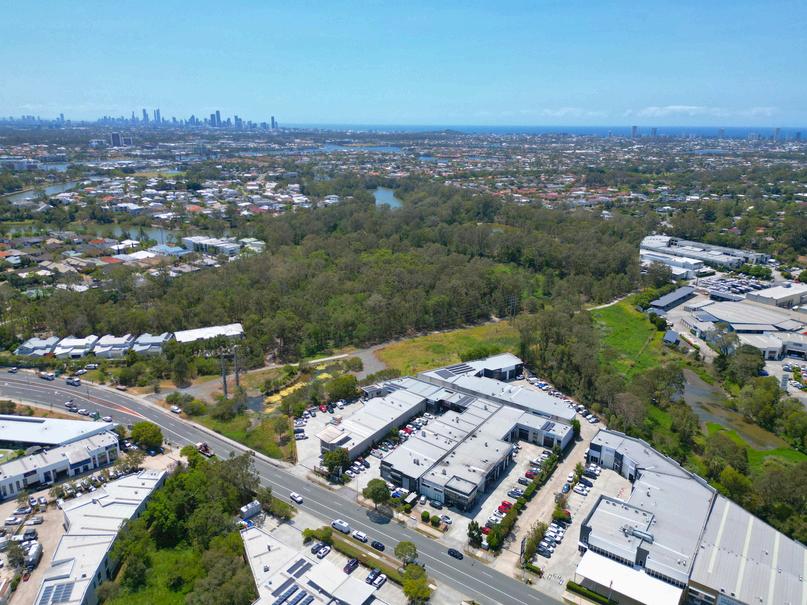
As we progress through the first half of 2026, the Burleigh Heads commercial property market continues to demonstrate its strength, resilience, and long-term appeal The momentum seen early this year has firmly validated the optimism from late 2025, marked by consistent demand across key sectors and sustained confidence from both owneroccupiers and investors Burleigh Heads is proving, once again, to be one of the Gold Coast’s most tightly held and sought-after commercial precincts.
Retail and industrial assets have remained standout performers so far in 2026, underpinned by historically low vacancy rates and strong leasing enquiry.
Retail Space: Continues to benefit from Burleigh’s evolving demographic profile, premium lifestyle appeal, and sustained tourism activity. These factors are actively supporting established operators while drawing in high-quality new entrants
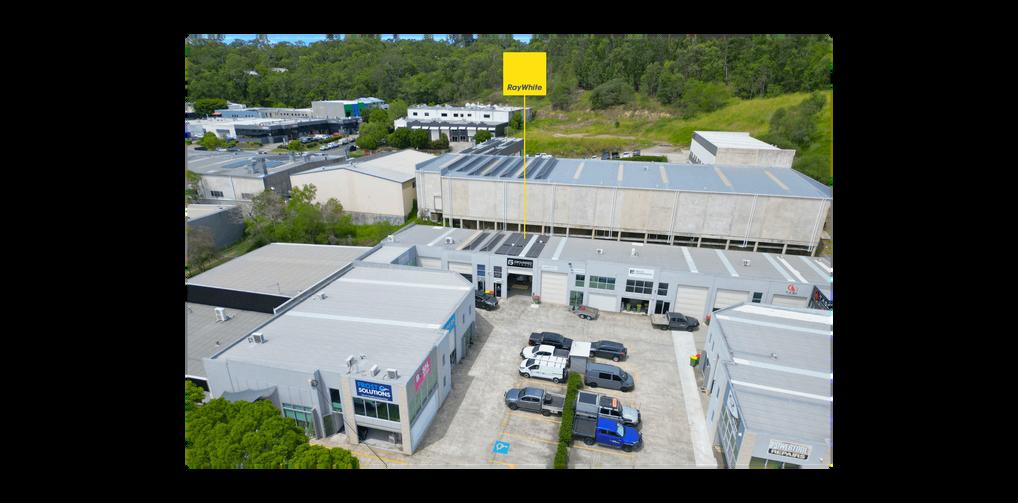
Industrial Stock: The industrial sector remains fiercely competitive With minimal new land releases and highly constrained supply across the central Gold Coast, we are seeing firm rental and capital growth.
Whether you are a business owner seeking to secure a long-term base in a high-demand area, an investor targeting resilient income streams, or a developer assessing tightly held future opportunities, Burleigh Heads presents a compelling commercial proposition
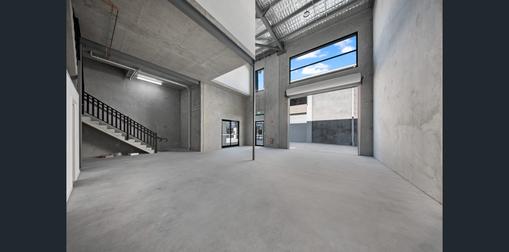
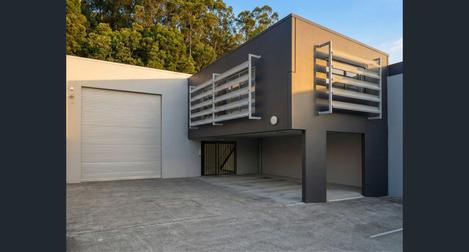
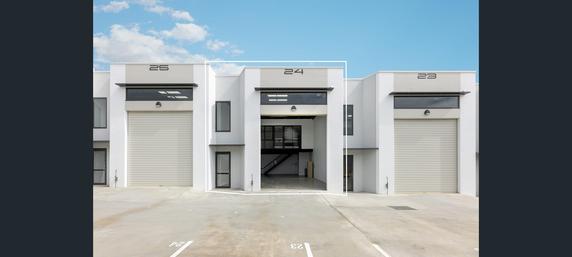
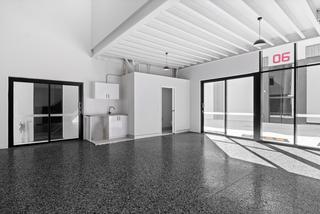
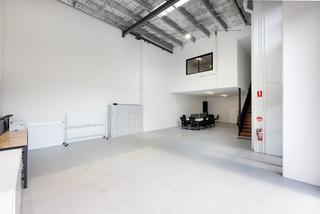
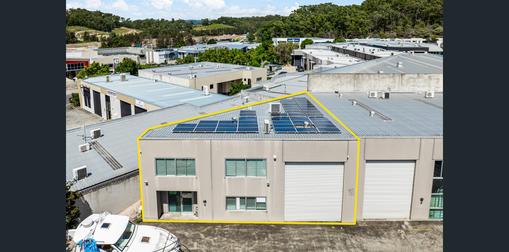
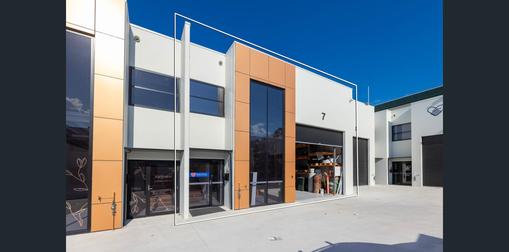
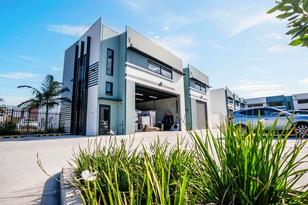
Ray White Tugun Commercial: Burleigh Heads Market Insights
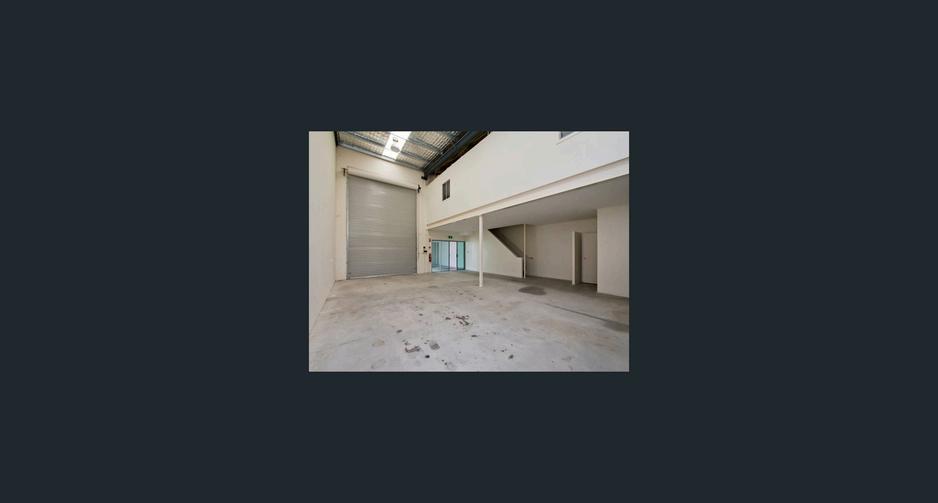
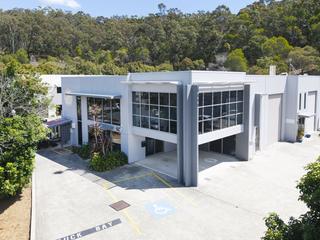
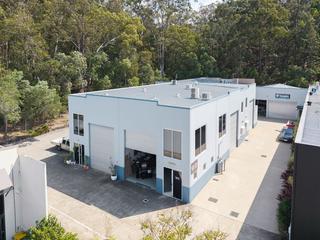
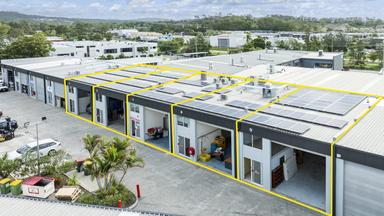
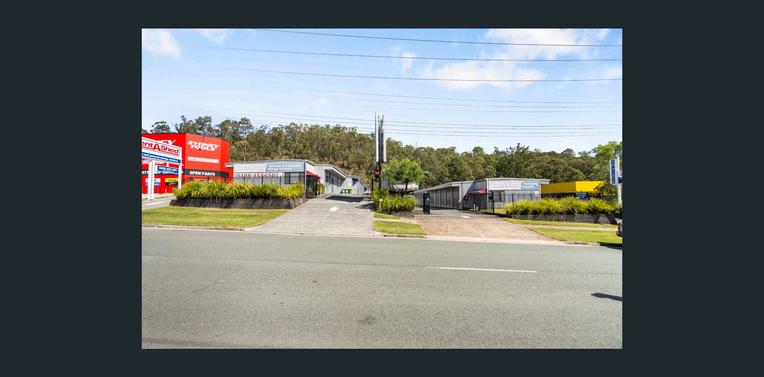
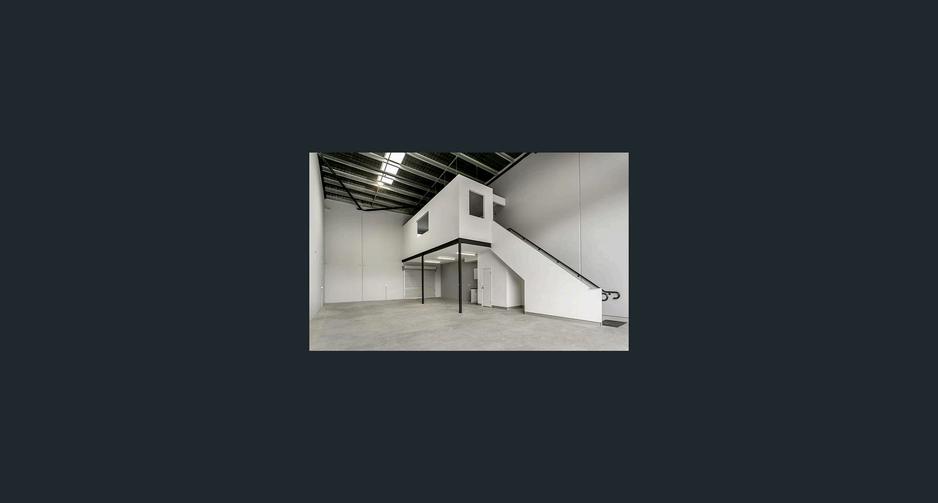
LEASED by Ray White Tugun
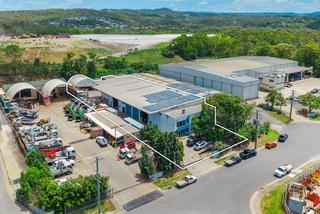
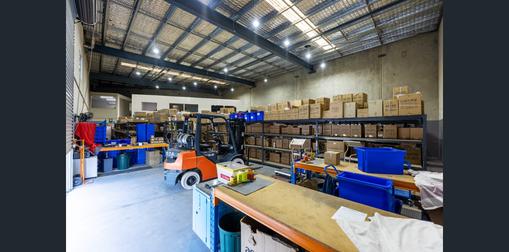
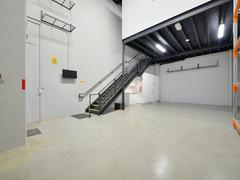
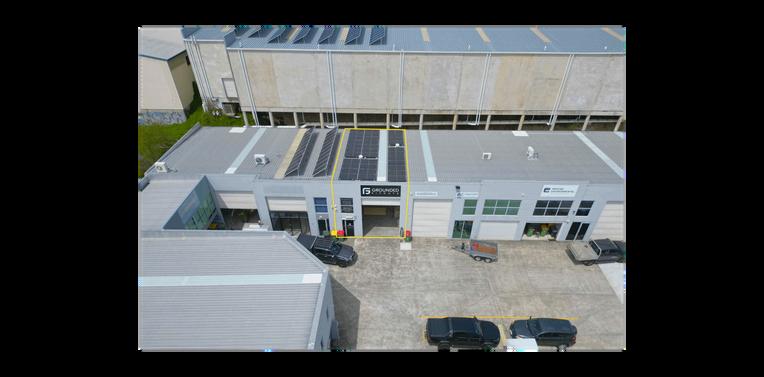
INDUSTRIAL

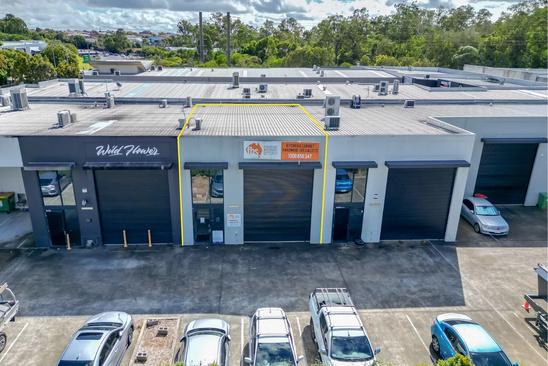
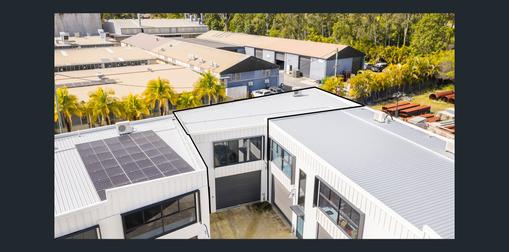
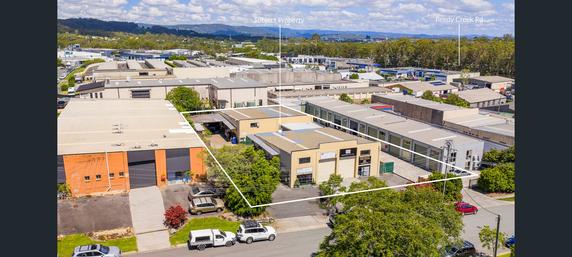
LEASED by Ray White Tugun

Ray White Tugun Commercial: Burleigh Heads Market Insights

Industrial continues to be the region's most competitive commercialsector.

Increase
Prime sub-5,000 m2 stock has moved from an average of $125/m2 in previous years, to an average of $175/m2 in 2025 (See Figure 1)
Sub-2% in key precincts such as Burleigh Heads, Currumbin Waters, Miami, and Tweed Heads South
Most new vacant listings lease within 12-28 days if priced correctly
Yields
Prime yield range: 5.5% - 6.5% (See Figure 2).
Rents have increased ~45% across the cycle, driven by structural undersupply
Ray White Tugun Commercial: Burleigh Heads Market Insights

An overview of retail, rent, and investment expectations for 2026, considering2025'sreview.
Rents likely to have modest increases but remain high
Vacancy to stay very tight
Construction costs limit new supply → ongoing landlord advantage
Modest rent growth expected
Suburban office to outperform CBD-style formats
Essential-service retail remains strong
Tourism-lead retial to recover significatnly in second half of 2026
Investment
Yield stabilisation now largely complete
Expect Higher deal volume in 2026
Sub-$2M assets to remain most liquid
Increased interest in development sites if infrastructure timelines progress
Ray White Tugun Commercial: Burleigh Heads Market Insights
Build-to-rent will enter the institutional mainstream in 2026 as investors seek residential exposure with defensive, inflation-linked income Student accommodation, co-living and modern boarding houses will gain traction amid housing undersupply, while government support accelerates capital deployment. As commercial and residential lines blur, major super funds and offshore investors will validate the sector’s maturity.
Retail is set to sustain its recovery through 2026, supported by limited new supply and stabilising consumer spending. Neighbourhood, supermarket-anchored, and experience-led centres will outperform, benefiting from essential retail demand and experiential trends. Improving foot traffic, rental growth, and renewed investor confidence are expected to drive increased transactions and yield compression, positioning retail as a strong performer in 2026
After an extended construction slowdown driven by high costs and funding constraints, development activity is expected to cautiously resume in 2026 as feasibility conditions improve. Stabilising construction costs, easing labour pressures and stronger occupier pre-commitments will support selective projects across industrial, premium office and retail sectors While not a boom, this signals a disciplined normalisation of development activity, underpinned by renewed lender confidence
From 2026, the Sustainable Finance Taxonomy will reshape commercial property finance and valuation. Access to capital will increasingly depend on NABERS ratings, net zero pathways, or proven sustainability improvements Assets with weak ESG credentials will face higher borrowing costs, reduced investor demand, and widening value gaps. Sustainability will become a core pricing driver, with properties that fail to meet evolving standards facing structural devaluation.
In 2026, the gap between premium and secondary office assets will widen Premium buildings with strong ESG credentials, modern amenities, and prime locations will continue to attract tenants and maintain low vacancies. Well-located, high-quality B-grade assets may benefit from affordability-driven demand, while lower-quality secondary stock risks obsolescence. Vacancy and capital value gaps will grow, amplified by rising sustainability requirements and tenant demand for NABERS-rated spaces, creating a nuanced market beyond a simple A-grade versus secondary divide.
RWT ONLINE AUCTION SUMMARY - 25/26 FY SO FAR...
87
1,500+ 448 $102,079,000 $3,191,000
45 OVERALL PERFORMANCE- WITHIN THE LOCAL MARKET



ScantheQRcodetovisitourcommercialhub&for moreinformation

ScantheQRcodeforanobligationfreeappraisal