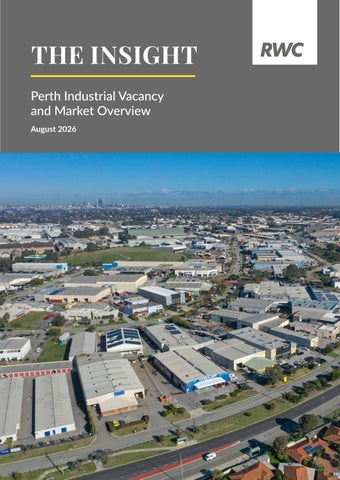
THE INSIGHT Perth Industrial Vacancy and Market Overview August 2026
Introduction The Perth industrial property sector has entered the second half of 2026 on considerably firmer footing, with total metropolitan vacancy falling sharply to 604,392m², down 15.6% from the 715,709m² recorded in January. This marks a clear turning point after eighteen months of steady expansion, with the East precinct driving the bulk of the improvement as tenant demand firmed across key nodes including Canning Vale, Jandakot and Welshpool. The South precinct held broadly steady while the North recorded a moderate rise in available space, a reversal of the stability that had defined that precinct through much of 2025. Rents across all three precincts remain unchanged from January, with the North at $150/m², the East at $150/m² and the South at $150/m², extending a pause now running since December 2023 for the North precinct. Despite softer leasing activity, the fundamentals underpinning this floor remain firmly in place: scarce serviced industrial land, high construction costs and a constrained development pipeline continue to limit new supply, even as landlords lean more on incentives to secure tenants. Transaction volumes eased to $1.2 billion for the 2025/26 financial year, down 9.1% on the prior year, though industrial remained by some margin WA’s largest commercial property sector by turnover. The asset class continues to hold its position as the preferred choice among both private investors and owner-occupiers, supported by yields that remain attractive relative to other commercial sectors and WA’s ongoing price advantage over the east coast. Recent Federal Budget changes, including the removal of negative gearing on established residential property and the closure of SMSF borrowing for residential purchases, add a new structural tailwind, with private capital and self-managed super funds increasingly likely to look to commercial property, and industrial in particular, as an alternative.
Available vacancy industrial The Perth industrial market has recorded a welcome pullback in available space, with total metropolitan vacancy easing to 604,392m², down 15.6% from the 715,709m² recorded in January 2026. This meaningful contraction points to solid take up across the market over the first half of 2026, reversing the plateau that had characterised the second half of last year. The East precinct remains home to the largest share of available stock at 270,578m², though this now represents 44.8% of total metropolitan vacancy, down from 56.5% in January. The reduction reflects a 33.1% fall in East precinct vacancy from 404,331m², the strongest absorption of any region and a clear signal that tenant demand has firmed in key East precinct nodes. The South precinct has held broadly steady, easing slightly from 206,228m² to 202,069m², a decline of 2.0%, and now accounts for 33.4% of metropolitan vacancy. The North precinct bucked the wider trend, rising 25.3% from 105,150m² to 131,745m² and now representing 21.8% of total vacancy, consistent with its smaller stock profile but a notable shift after a period of relative stability. Canning Vale remains the standout suburb by volume, though available space there has eased to 80,732m² from 97,256m² in January. Jandakot (50,039m²) and Welshpool (49,912m²) round out the largest pockets of vacancy. Kenwick has recorded a sharp turnaround, falling to 17,295m² from 58,910m² previously, while Hazelmere shows no vacant stock currently listed, down from 62,658m² in January, one of the more striking examples of absorption this period.
North North (85,974)
Perth, by region (m²) 202,069
Total vacant stock: 604,392m²
131,745 East
270,578
Source: RWC WA
South
Vacancies industrial property by size range The composition of available industrial listings has shifted further toward smaller assets, with sub500m² properties now representing 55.2% of all available stock, up from 51.9% recorded in January 2026. This increase to 285 listings, from 216 previously, continues the trend of smaller businesses reconsidering their accommodation needs, though the scale of the shift also reflects the broader contraction in larger format vacancy pulling more of the market’s attention toward the smaller end. The 501-1,000m² category has expanded modestly to 14.7% of total listings, up from 13.2%, while the 1,001-1,500m² range has eased to 10.1%, down from 12.3% previously. Taken together, the larger size ranges above 1,500m² now account for 20.0% of all listings, down from 22.6% in January, with the 2,501-5,000m² segment at 6.4% and the 5,001m²-plus range representing just 4.1% of stock. This continued reduction in larger format availability reinforces the pattern seen in the vacancy data, with quality assets in these size categories continuing to find tenants. The North precinct remains the dominant market for smaller assets, accounting for 124 of the 285 sub-500m² listings, again concentrated in areas such as Malaga and Wangara. The South and East precincts hold 104 and 57 of the sub-500m² listings respectively, underlining the North’s ongoing role as the natural home for Perth’s smaller industrial tenants. This evolving size distribution, alongside the broader fall in metropolitan vacancy, points to a market where absorption has been strongest in the mid to larger size ranges, leaving smaller assets to represent a growing share of what remains available.
6.4%
4.1%
Vacant industrial property by size range 5,001 + m²
9.5%
2,501 - 5,000m² No. listings: 516
10.1%
55.2%
1,501 - 2,500m² 1,001 - 1,500m² 501 - 1,000m²
14.7%
0 - 500m² Source: RWC WA
Perth industrial net face rents By region ($/m²) 160 150 140 130 120 110 100 90 80 70 60 50 2006 Source: RWC WA
2008
2010
2012
2014
2016
2018
2020
EAST
2022 NORTH
2024
2026
SOUTH
Perth industrial rents have now been steady for six months, with rates across all three precincts unchanged since the January 2026 update and, for the North precinct, since December 2023. The North continues to lead at $150/m², the East sits at $150/m² and the South at $150/m², extending a pause that stands in sharp contrast to the double digit growth recorded through 2021 to 2024. This flat headline result reflects a market that remains fundamentally undersupplied even as leasing activity has slowed. Serviced industrial land able to be brought to market quickly remains scarce, and elevated construction costs continue to make new development difficult to stack up, keeping a firm floor under rents even as vacancy has stayed tight. At the same time, tenants have become more selective, prompting landlords to lean more heavily on incentives such as rent free periods and fit out contributions rather than compete on face rates. The result is a market where headline figures look settled but effective rents tell a softer story. Development economics remain the key constraint on new supply, with purpose built facilities still needing rates above $170/m² to justify construction. The secondary market continues to show more flexibility, with landlords willing to negotiate on incentives and lease terms to secure tenants.
Industrial sales volume FINANCIAL YEAR($) 3B
2B
2025/26
2024/25
2023/24
2022/23
2021/22
2020/21
2019/20
2018/19
2017/18
2016/17
2015/16
2014/15
2013/14
2012/13
2011/12
2010/11
2009/10
2008/09
2007/08
1B
Source: Real Capital Analytics, RWC WA
Industrial recorded $1.2 billion in transactions during 2025/26, down 9.1% on the previous year, though it remained by a wide margin the largest single contributor to WA’s commercial transaction volume. Demand fundamentals continue to hold up well, with yields still attractive to private investors and owner-occupiers continuing to be active participants alongside private groups. Western Australia’s pricing advantage relative to the east coast is becoming an increasingly important part of the industrial story. With Sydney and Melbourne industrial assets trading at a premium, WA’s comparatively affordable entry points are drawing renewed attention from interstate buyers, even as deal timeframes have stretched and negotiations take longer to conclude. The Budget’s changes to negative gearing on established residential property, combined with the removal of SMSF borrowing capacity for residential purchases, are expected to redirect some private capital toward commercial property, and industrial stands to be a primary beneficiary given its relative affordability and straightforward income proposition. Self-managed super funds in particular may increasingly look to commercial property, including industrial, as an alternative structure now that the residential borrowing pathway has closed. This shift will take time to materialise given the deliberative mood among buyers, but the structural incentive is now clearly in place.
Outlook The sharp contraction in metropolitan vacancy through the first half of 2026 marks a genuine inflection point, though whether this represents sustained tightening or a temporary pause will become clearer over the second half of the year. Much depends on whether the East precinct’s 33.1% fall in available space, and Hazelmere’s move to effectively nil vacancy, can be sustained. Canning Vale, Jandakot and Welshpool remain the largest pockets of stock, but as tenant alternatives narrow, landlords in these locations may find improved leverage, and upward pressure on the East’s $150/m² rate could emerge sooner than the market has anticipated. The North precinct tells a different story, with available space rising 25.3% after a period of stability. Given the North’s concentration of smaller businesses, this increase warrants attention as a potential early indicator of softening sentiment among small to medium enterprises, a cohort traditionally sensitive to financing costs. The South precinct, by contrast, has settled after last year’s sharp expansion, with vacancy easing marginally and rents holding at $150/m². The broader rental pause, now running well beyond twelve months for the North, remains underpinned by scarce serviced land and elevated construction costs, with purpose built facilities still needing rates above $170/m² to stack up. This should limit how far improving vacancy translates into renewed growth in the near term, though the East’s absorption trend bears watching as an early signal of change. On the investment side, the softer $1.2 billion result for 2025/26 reflects the same deliberative buyer mood that has extended deal timeframes across the market, even as industrial holds firm as WA’s largest commercial property sector by turnover. Looking ahead, the Federal Budget’s removal of negative gearing on established residential property and the closure of SMSF residential borrowing represent a meaningful structural shift, with private capital and self-managed super funds likely to look increasingly toward commercial alternatives and an expectation to see more competition in the sub $2 million market. Industrial, given its affordability and straightforward income structure, is well placed to capture a share of this redirected demand, even if the shift takes time to materialise. WA’s pricing advantage over Sydney and Melbourne continues to draw eastern states interest, while owner-occupier appetite will hinge on how financing costs evolve. Iron ore pricing and the broader state economy will remain key to occupier confidence and the states continuation of its ongoing performance. Overall, 2026 looks set to be a year of cautious rebalancing, with improving vacancy in key locations, a persistent rental floor, a flight to quality and a new source of Budget driven investment demand all pointing to industrial retaining its status as WA’s preferred commercial asset class.
RWC WA Level 7, 30 The Esplanade, Perth WA 6000 raywhitecommercialwa.com
EAST PRECINCT
NORTH PRECINCT
SOUTH PRECINCT
Chris Matthews Joint Managing Director 0413 359 315 chris.matthews@raywhite.com
Tom Jones Licensee | Sales & Leasing Executive 0478 771 117 tom.jones@raywhite.com
Michael Danagher Sales & Leasing Executive 0403 049 989 michael.danagher@raywhite.com
Liam Pittaway Sales & Leasing Executive 0439 555 439 liam.pittaway@raywhite.com
Lachlan Burrows Sales & Leasing Executive 0499 552 296 lachlan.burrows@raywhite.com
Kyle Spinks Sales & Leasing Executive 0484 571 188 kyle.spinks@raywhite.com