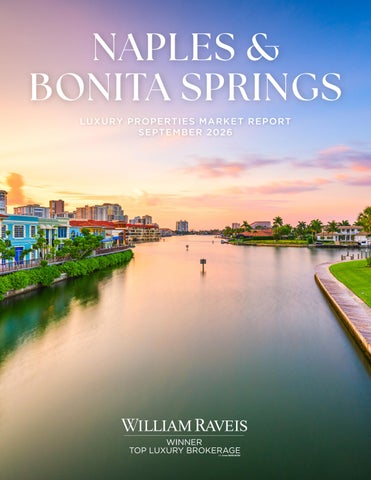
NAPLES & BONITA SPRINGS LUXURY PROPERTIES MARKET REPORT SEPTEMBER 2026
WINNER TOP LUXURY BROKERAGE
NAPLES & BONITA SPRI NG S Single-Family Properties
CLOSED SALES •
The number of closed sales in the 12 months ending September 30th, 2026 for the Naples and Bonita Springs Area increased 12% year-over-year (6,606 vs 5,895).
•
There were 55 closed sales priced above two million in September 2026 compared to 42 in September 2025; a 31% increase. During the 12 months ending September 30th, 2026, sales in this category increased 30% over the same time period in 2025 (957 vs 734 units).
NEW LISTINGS / INVENTORY •
During the 12 months ending September 30th, 2026, a total of 9,978 new listings were added to the market, this is an 8% decrease vs the same time period 12 months ending September 30th, 2025.
•
Available inventory as of September 30th, 2026 consisted of 3,316 units, a decrease of 14% vs the same time period in 2025. Current inventory represents 6 months of supply based on current absorption rates.
AVERAGE & MEDIAN SALES PRICE •
The year-over-year average sales price for the area was $1,357,299, a 6% increase vs the same time period in 2025.
•
The median sales price for the area in September 2026 increased 8% to $700,000 vs September 2025.
*Source of this market data: Southwest Florida MLS © 2026. Accuracy of this information is reliable but not guaranteed. Anyone who chooses to use this information to make market decisions should have this data independently verified.
NAPLES & BONITA SPRI NG S Condominiums
CLOSED SALES •
The number of closed sales in the 12 months ending September 30th, 2026 for the Naples and Bonita Springs Area increased 23% year-over-year (4,773 vs 3,881).
•
There were 14 closed sales priced above two million in September 2026 compared to 17 in September 2025; an 18% decrease. During the 12 months ending September 30th, 2026, sales in this category increased 44% over the same time period in 2025 (391 vs 271 units).
NEW LISTINGS / INVENTORY •
During the 12 months ending September 30th, 2026, a total of 7,989 new listings were added to the market, a 5% decrease vs the same time period 12 months ending September 30th, 2025.
•
Available inventory as of September 30th, 2026 consisted of 2,729 units, a decrease of 17% vs the same time period in 2025. Current inventory represents 7 months of supply based on current absorption rates.
AVERAGE & MEDIAN SALES PRICE •
The year-over-year average sales price for the area was $788,511, a 6% increase vs the same time period in 2025.
•
The median sales price for the area in September 2026 decreased 2% to $371,250 vs September 2025.
*Source of this market data: Southwest Florida MLS © 2026. Accuracy of this information is reliable but not guaranteed. Anyone who chooses to use this information to make market decisions should have this data independently verified.
P O R T ROYA L t o B O N I TA B E A C H R OA D A R E A Single-Family Properties LUXURY MARKET $1M+ (WEST OF 41)
CLOSED SALES •
The number of closed sales in the 12 months ending September 30th, 2026 for the luxury market from Port Royal to Bonita Beach Road Area increased 20% year-over-year (442 vs 368).
NEW LISTINGS / INVENTORY •
During the 12 months ending September 30th, 2026, a total of 767 new listings were added to the market, a decrease of 14% compared to the same time period 12 months ending September 30th, 2025.
•
Available inventory as of September 30th, 2026 consisted of 321 units, a 12% decrease vs the same time period in 2025 (321 vs 365). Current inventory represents 9 months of supply based on current absorption rates.
AVERAGE & MEDIAN SALES PRICE •
The year-over-year average sales price for the area was $6,282,801, an increase of 5% vs the same time period in 2025.
•
The median sales price for the area in September 2026 increased 60% to $4,015,000 vs September 2025.
*Source of this market data: Southwest Florida MLS © 2026. Accuracy of this information is reliable but not guaranteed. Anyone who chooses to use this information to make market decisions should have this data independently verified.
P O R T R OYA L t o B O N I TA B E A C H R OA D A R E A Condominiums LUXURY MARKET $1M+ (WEST OF 41)
CLOSED SALES •
The number of closed sales in the 12 months ending September 30th, 2026 for the luxury market from Port Royal to Bonita Beach Road Area increased 28% year-over-year (576 vs 449).
NEW LISTINGS / INVENTORY •
During the 12 months ending September 30th, 2026, a total of 1,039 new listings were added to the market, a decrease of 6% vs the same time period 12 months ending September 30th, 2025.
•
Available inventory as of September 30th, 2026 consisted of 377 units, a 15% decrease vs the same time period in 2025 (377 vs 441). Current inventory represents 8 months of supply based on current absorption rates.
AVERAGE & MEDIAN SALES PRICE •
The year-over-year average sales price for the area was $2,773,249, an increase of 2.6% vs the same time period in 2025.
•
The median sales price for the area in September 2026 decreased 2% to $1,672,500 vs September 2025.
*Source of this market data: Southwest Florida MLS © 2026. Accuracy of this information is reliable but not guaranteed. Anyone who chooses to use this information to make market decisions should have this data independently verified.
NAPLES & BONITA SPRI NG S YEAR-OVER-YEAR MARKET TRENDS Single-Family Properties Average Sales Price
$1,116,189
9,914 7,790
New Listings
$1,281,937
$1,188,212
$1,170,752
10,797
10,254
9,041 6,532
2022
Closed Units
9,978
5,945
2023
$1,357,299
6,606
5,895
2024
2025
2026
YEAR-OVER-YEAR MARKET TRENDS Condominium Properties Average Sales Price
$809,527
New Listings
$851,444 $745,380
$694,216
7,112
8,394
8,011 6,097
$788,511
7,989
6,581 4,883
2022
Closed Units
2023
4,326
2024
3,881
2025
4,773
2026
*Source of this market data: Southwest Florida MLS © 2026. Accuracy of this information is reliable but not guaranteed. Anyone who chooses to use this information to make market decisions should have this data independently verified.
P O R T R OYA L t o B O N I TA B E A C H R OA D A R E A YEAR-OVER-YEAR MARKET TRENDS Single-Family Properties Average Sales Price
New Listings
Closed Units
$5,980,999 $5,359,673
$6,282,801
$4,977,265
$4,657,258
894
839
773
767
667 433
388 293
2022
2023
442
368
2024
2025
2026
YEAR-OVER-YEAR MARKET TRENDS Condominium Properties Average Sales Price
$2,510,106
$2,453,287
New Listings
$2,607,038
1,133
Closed Units
$2,702,875
1,100
1,039
952 745
642
$2,773,249
637
623
576
449
2022
2023
2024
2025
2026
*Source of this market data: Southwest Florida MLS © 2026. Accuracy of this information is reliable but not guaranteed. Anyone who chooses to use this information to make market decisions should have this data independently verified.
COMMUNITY S N A P S H OT R E P O R T Single-Family Properties 12 MONTHS ENDING SEPTEMBER, 2026 Inventory
% Change
Closed Sales
% Change
Months Of Supply
% Change
Average Sales Price
% Change
Aqualane Shores
30
-17%
26
-10%
13.8
-7%
$10,544,423
6%
Bonita Bay
24
-44%
79
0%
3.6
-44%
$1,675,778
-11%
Collier’s Reserve
10
0%
14
27%
8.6
-21%
$2,450,357
-13%
Fiddler's Creek
47
-18%
94
34%
6.0
-39%
$1,514,574
-4%
Grey Oaks
17
-6%
39
8%
5.2
-13%
$5,246,513
16%
Isles of Collier Preserve
55
-8%
118
24%
5.6
-26%
$1,529,705
6%
Kensington
4
-20%
19
12%
2.5
-28%
$1,766,316
-4%
Lely Resort
54
-30%
129
37%
5.0
-49%
$1,185,345
6%
Marco Island
192
-29%
393
0%
5.9
-34%
$2,002,293
4%
Mediterra
18
-25%
36
20%
6.0
-38%
$3,599,722
-11%
Monterey
7
0%
20
18%
4.2
-15%
$1,571,218
-11%
Naples Park
98
-24%
128
27%
9.2
-40%
$1,003,289
5%
Naples Reserve
32
-29%
64
-11%
6.0
-20%
$1,176,217
18%
Olde Naples
61
24%
62
17%
11.8
-35%
$8,220,605
35%
Park Shore/Moorings/ Seagate/Coquina Sands Non-Waterfront
98
-14%
127
34%
9.3
-36%
$5,347,413
7%
Park Shore/Moorings/ Seagate/Coquina Sands Waterfront
26
-16%
35
53%
8.9
-45%
$7,704,871
-5%
Pelican Bay
30
-40%
72
0%
5.0
-40%
$3,432,500
-7%
Pelican Landing
13
-50%
54
4%
2.9
-52%
$1,168,803
-9%
Pelican Marsh
22
47%
56
124%
4.7
-35%
$1,901,987
-2%
Pine Ridge
33
-3%
30
30%
13.2
-26%
$5,608,704
-24%
Port Royal
25
-24%
28
4%
10.7
-27%
$21,346,607
-12%
Quail Creek
10
-17%
21
17%
5.7
-29%
$2,545,440
5%
Quail West
19
-24%
43
27%
5.3
-40%
$4,668,551
7%
Royal Harbor
26
-10%
22
29%
14.2
-31%
$4,058,682
-16%
Talis Park
11
57%
14
133%
9.4
-33%
$4,812,857
-11%
The Colony At Pelican Landing
7
40%
9
200%
9.3
-53%
$1,936,111
-9%
Tiburon
4
33%
8
14%
6.0
17%
$3,177,500
-13%
Vanderbilt Beach
37
-16%
25
4%
17.8
-19%
$4,012,000
3%
Vineyards
24
9%
61
11%
4.7
-2%
$1,324,451
-2%
Neighborhood
*Source of this market data: Southwest Florida MLS © 2026. Accuracy of this information is reliable but not guaranteed. Anyone who chooses to use this information to make market decisions should have this data independently verified.
COMMUNITY S N A P S H OT R E P O RT Condominiums 12 MONTHS ENDING SEPTEMBER, 2026 Neighborhood
Inventory
% Change
Closed Sales
% Change
Months Of Supply
% Change
Average Sales Price
% Change
Bonita Bay
75
-25%
143
59%
6.3
-53%
$970,185
-23%
Fiddler's Creek
60
5%
87
190%
8.3
-64%
$587,011
-12%
Grey Oaks
1
-50%
10
67%
1.2
-70%
$2,062,500
3%
Isles of Collier Preserve
9
29%
11
22%
9.8
5%
$851,864
-2%
Kensington
3
-57%
21
5%
1.7
-59%
$821,905
9%
Lely Resort
91
-7%
106
6%
10.3
-12%
$501,280
-3%
Marco Island
318
-17%
480
26%
8.0
-22%
$891,156
0%
Mediterra
10
-23%
21
62%
5.7
-52%
$1,365,000
-3%
Olde Naples
107
15%
84
2%
15.3
12%
$1,480,273
-11%
Park Shore/Moorings/ Seagate/Coquina Sands Non-Waterfront
299
-6%
353
44%
10.2
-35%
$1,718,436
-2%
Park Shore/Moorings/ Seagate/Coquina Sands Waterfront
243
-3%
277
55%
10.5
-37%
$1,911,570
-13%
Pelican Bay
161
-12%
261
28%
7.4
-31%
$1,851,249
-17%
Pelican Landing
29
-22%
63
47%
5.5
-47%
$471,587
-8%
Pelican Marsh
26
-7%
58
14%
5.4
-18%
$767,878
-1%
The Dunes of Naples
21
-34%
30
36%
8.4
-52%
$1,689,212
13%
Talis Park
21
17%
20
5%
12.6
11%
$1,583,500
11%
Tiburon
23
15%
23
35%
12.0
-15%
$1,593,696
17%
Vanderbilt Beach
78
-7%
88
57%
10.6
-41%
$1,388,722
-17%
Vineyards
61
9%
90
30%
8.1
-17%
$617,560
-6%
*Source of this market data: Southwest Florida MLS © 2026. Accuracy of this information is reliable but not guaranteed. Anyone who chooses to use this information to make market decisions should have this data independently verified.
KEY
SO UT HW E S T F LO R I DA C O MMU N I T Y G U I D E
GOLF COURSE 18 holes 27 holes 36 holes
- City of Naples - North Naples (North of Pine Ridge Road) - South Naples (South of Pine Ridge Road) - Bonita Springs
Neighborhood
Single-Family
Condominium
54 holes 90 holes PRICE RANGE
Golf Course
AQUALANE SHORES City of Naples
Dominant price less than $1M
$
Dominant price $1M to $2M
$$
Dominant price over $2M
$$$
Boating*
Clubhouse
Tennis
Gated** Price Range
$$$
BONITA BAY Bonita Springs
90
$$
COLLIER’S RESERVE North Naples
18
$$$
GREY OAKS South Naples & City of Naples
54
$$$
ISLE OF COLLIER PRESERVE South Naples
$$
KENSINGTON South Naples
18
$$
LELY RESORT South Naples
54
$
MEDITERRA North Naples
36
$$$
MONTEREY North Naples MOORINGS & COQUINA SANDS City of Naples
$$ 18
$$$
*Many properties are boating oriented (have a dock or has a community dock/marina). **May or may not be manned by a security guard.
*Source of this market data: Southwest Florida MLS © 2026. Accuracy of this information is reliable but not guaranteed. Anyone who chooses to use this information to make market decisions should have this data independently verified.
Neighborhood
Single-Family
Condominium
Golf Course
Boating*
Clubhouse
Tennis
Gated** Price Range
NAPLES PARK North Naples
$$
NAPLES RESERVE South Naples
$
OLD NAPLES City of Naples
$$$
PARK SHORE City of Naples
$$$
PELICAN BAY North Naples
27
$$$
PELICAN LANDING Bonita Springs
36
$
PELICAN MARSH North Naples
18
$$
PINE RIDGE North Naples
$$$
PORT ROYAL City of Naples
$$$
QUAIL CREEK North Naples
36
$$$
QUAIL WEST North Naples
36
$$$
ROYAL HARBOR City of Naples THE COLONY AT PELICAN LANDING Bonita Springs
$$$ 18
THE DUNES OF NAPLES North Naples TIBURON GOLF CLUB North Naples
$$$ 36
VANDERBILT BEACH AREA North Naples VINEYARDS North Naples
$$
$$ $$$
36
$
*Many properties are boating oriented (have a dock or has a community dock/marina). **May or may not be manned by a security guard.
*Source of this market data: Southwest Florida MLS © 2024. Accuracy of this information is reliable but not guaranteed. Anyone who chooses to use this information to make market decisions should have this data independently verified.
WINNER TOP LUXURY BROKERAGE
Hi g h e s t Ho n o r i n L u x u r y Rea l E s t a te
*
List and buy your house with the Top Luxury Brokerage in the U.S.
NNER Y BROKERAGE