PSI CHI JOURNAL OF PSYCHOLOGICAL RESEARCH SUMMER 2026 | VOLUME 31, NUMBER 2
EDITOR
ROBERT R. WRIGHT, PHD
Brigham Young University-Idaho
Email: wrightro@byui.edu
ASSOCIATE EDITORS
TIFANI FLETCHER, PHD West Liberty University
STELLA LOPEZ, PhD University of Texas at San Antonio
TAMMY LOWERY ZACCHILLI, PhD Saint Leo University
ALBEE MENDOZA, PhD
Delaware State University
JULEE POOLE, PhD Purdue University Global
KIMBERLI R. H. TREADWELL, PhD University of Connecticut
EDITOR EMERITUS
DEBI BRANNAN, PhD Western Oregon University
MANAGING EDITOR BRADLEY CANNON
DESIGNER
JANET REISS
EDITORIAL ASSISTANT EMMA SULLIVAN
ADVISORY EDITORIAL BOARD
GLENA ANDREWS, PhD RAF Lakenheath USAF Medical Center
AZENETT A. GARZA CABALLERO, PhD Weber State University
MARTIN DOWNING, PhD Lehman College
HEATHER HAAS, PhD University of Montana Western
ALLEN H. KENISTON, PhD University of Wisconsin–Eau Claire
MARIANNE E. LLOYD, PhD Seton Hall University
DONELLE C. POSEY, PhD Washington State University
LISA ROSEN, PhD Texas Women's University
CHRISTINA SINISI, PhD Charleston Southern University
ABOUT PSI CHI
Psi Chi is the International Honor Society in Psychology, founded in 1929. Its mission: "recognizing and promoting excellence in the science and application of psychology." Membership is open to undergraduates, graduate students, faculty, and alumni making the study of psychology one of their major interests and who meet Psi Chi’s minimum qualifications. Psi Chi is a member of the Association of College Honor Societies (ACHS), and is an affiliate of the American Psychological Association (APA) and the Association for Psychological Science (APS). Psi Chi’s sister honor society is Psi Beta, the national honor society in psychology for community and junior colleges.
Psi Chi functions as a federation of chapters located at senior colleges and universities around the world. The Psi Chi Headquarters is located in Chattanooga, Tennessee. A Board of Directors, composed of psychology faculty who are Psi Chi members and who are elected by the chapters, guides the affairs of the Organization and sets policy with the approval of the chapters.
Psi Chi membership provides two major opportunities. The first of these is academic recognition to all inductees by the mere fact of membership. The second is the opportunity of each of the Society’s local chapters to nourish and stimulate the professional growth of all members through fellowship and activities designed to augment and enhance the regular curriculum. In addition, the Organization provides programs to help achieve these goals including conventions, research awards and grants competitions, and publication opportunities.
JOURNAL PURPOSE STATEMENT
The twofold purpose of the Psi Chi Journal of Psychological Research is to foster and reward the scholarly efforts of Psi Chi members, whether students or faculty, as well as to provide them with a valuable learning experience. The articles published in the Journal represent the work of undergraduates, graduate students, and faculty; the Journal is dedicated to increasing its scope and relevance by accepting and involving diverse people of varied racial, ethnic, gender identity, sexual orientation, religious, and social class backgrounds, among many others. To further support authors and enhance Journal visibility, articles are now available in PsycInfo, EBSCO, Clarivate Emerging Sources Citation Index, Crossref, and Google Scholar databases. In 2016, the Journal also became open access (i.e., free online to all readers and authors) to broaden the dissemination of research across the psychological science community.
JOURNAL INFORMATION
The Psi Chi Journal of Psychological Research (ISSN 23257342) is published quarterly in one volume per year by Psi Chi, Inc., The International Honor Society in Psychology. For more information, contact Psi Chi Headquarters, Publication and Subscriptions, 651 East 4th Street, Suite 600, Chattanooga, TN 37403, (423) 7562044. https://www.psichi.org; psichijournal@psichi.org
Statements of fact or opinion are the responsibility of the authors alone and do not imply an opinion on the part of the officers or members of Psi Chi.
Advertisements that appear in Psi Chi Journal do not represent endorsement by Psi Chi of the advertiser or the product. Psi Chi neither endorses nor is responsible for the content of thirdparty promotions. Learn about advertising with Psi Chi at https://www.psichi.org/Advertise
COPYRIGHT
Permission must be obtained from Psi Chi to reprint or adapt a table or figure; to reprint quotations exceeding the limits of fair use from one source, and/or to reprint any portion of poetry, prose, or song lyrics. All persons wishing to utilize any of the above materials must write to the publisher to request nonexclusive world rights in all languages to use copyrighted material in the present article and in future print and nonprint editions. All persons wishing to utilize any of the above materials are responsible for obtaining proper permission from copyright owners and are liable for any and all licensing fees required. All persons wishing to utilize any of the above materials must include copies of all permissions and credit lines with the article submission.
81 Steve Rouse Is in the House: A Festschrift for Steve From Friends, Colleagues, Students, and Loved Ones
Juan Carlos Hugues1* (They/all), Ashley Burton2 (She/they), Danica Christy3, Heather Haas4, Cindy Miller-Perrin2, Isabella Moreno2, Donna Nofziger2, Jan Obenhaus, dominic VAY Rouse, Stacy Rouse, Robert E. Williams, Jr.2, Robert R. Wright5, and Bradley Cannon6
1Department of Psychology, University of Zurich
2Social Science Division, Pepperdine University
3Department of Psychology, University of Nevada, Las Vegas
4Department of History, Philosophy, & Social Sciences, University of Montana Western
5Department of Psychology, Brigham Young University–Idaho
6Communications Department, Psi Chi Headquarters
95 The Five Domains of Mindful Parenting and Parenting Stress in Mothers of Toddlers
Adriana Janssen,1 Olivia Silke*1, Sanjana Pantsachiv2, Ilona S. Yim*1, and Jenna L. Riis*3,4
1Department of Psychological Science, University of California, Irvine
2Department of Cognitive Sciences, University of California, Irvine
3Institute for Interdisciplinary Salivary Bioscience Research, University of California, Irvine
4Department of Health and Kinesiology, University of Illinois Urbana Champaign
106 Parental Support and Athlete Burnout: A Correlational Study of Collegiate Student Athletes
Emily Brogan and Ronald Deluga* Department of Psychology, Bryant University
115 A Revised Academic Stress Scale Addressing Technology, Socioeconomic Status, and Classroom Dynamics
Gianna M. Hough1, Nancy L. Campuzano1, Robert M. Hallock1, 2, and Catarina L. Birkenfeld Department of Psychology, Purdue Northwest University
122 Personality and Political Orientation: Big Five Aspect-Level Associations Among Students at a Southeastern U.S. University
Savannah G. Diggett1 and Ben F. Cotterill*2
1Department of Methodology, London School of Economics and Political Science
2Department of Psychology, Clemson University
135 Perception and Recognition of Computer-Altered Face Images
April M. Drumm-Hewitt*1 and Addison F. Angstadt2
1Department of Psychology, Lycoming College
2Department of Psychology, Binghamton University
146 Role Strain in Professional Women With Children
Tammy Lowery Zacchilli*, Lara K. Ault*, and O’Shea Williams Department of Social Sciences, Saint Leo University
157 When Love Hurts: Exploring the Links Between Narcissism, Attachment Issues, and Infidelity Intentions
Helen Huynh and Tammy Lowery Zacchilli* Department of Social Sciences, Saint Leo University
165 Evolutionary Theory and Mating Preferences: A Partial Replication of Kenrick et al.’s (1993) Study
Helen Huynh, Tammy Lowery Zacchilli*, Jillian Falvo, and Emma Pillsbury Department of Social Sciences, Saint Leo University
173 Exploring the Impact of Supplemental Education During the Pandemic on Subsequent Academic Performance
Jordan M. Robinette and Nancy J. Karlin* College of Education and Behavioral Sciences, University of Northern Colorado
181 Cultivating Belonging Through Identity-Expression: Normalizing Pronoun Use in Introductions Affects Pronoun Comfort and Usage
Jasmine H. Borland and Tonya M. Buchanan* Department of Psychology, Central Washington University
191 Grit, Resilience, and Thinking About Dropping Out of College
Abigail Lockridge1, Frank Hammonds*2, Gina Mariano*1, Fred Figliano*2, and Kirk Davi*3 1Department of Psychology, Troy University 2College of Education and Behavioral Sciences, Troy University 3Troy University
198 Correction to Fedak and Langlais (2024)
Steve Rouse Is in the House: A Festschrift for Steve From Friends, Colleagues, Students, and Loved Ones
Juan Carlos Hugues1* (They/all), Ashley Burton2 (She/they), Danica Christy3, Heather Haas4, Cindy Miller-Perrin2, Isabella Moreno2, Donna Nofziger2, Jan Obenhaus, dominic VAY Rouse, Stacy Rouse, Robert E. Williams, Jr.2, Robert R. Wright5, and Bradley Cannon6
1Department of Psychology, University of Zurich
2Social Science Division, Pepperdine University
3Department of Psychology, University of Nevada, Las Vegas
4Department of History, Philosophy, & Social Sciences, University of Montana Western
5Department of Psychology, Brigham Young University–Idaho
6Communications Department, Psi Chi Headquarters
ABSTRACT. Given that there is a need to foster a stronger culture of belonging within higher education and that the festschrift, as a genre, is a “survivor of a more collegial academic age” (Richetti, 2012, p. 237), we dedicate this festschrift to Dr. Steven Vay Rouse or “Steve,” a psychology professor whose life mission was to ensure that everyone he met felt like they belonged, especially those from historically marginalized communities. Steve was a psychology professor who did not conform to the culture of rugged individualism widespread within academia but who instead believed in cultivating the collective good. Therefore, in this article, students, friends, colleagues, and loved ones share their memories of and thoughts about the impact of Steve’s vibrant life. Our aim is to keep Steve’s legacy alive through these words by showing how small acts of care can make a big difference, and to inspire the reader to care for others in their own lives, classrooms, and universities. The need to cooperate and to value each other is important, now more than ever, when authoritarian policies are being instituted to divide those inside and outside of U.S. academia. Steve knew the importance of these principles better than anyone; he was able to accomplish the true mission of higher education, which is to live life as a whole person and to foster the flourishing of students, friends, colleagues, and loved ones, leading a life of joy and fulfillment until the very end.
William James, the Father of American Psychology, once said: “The deepest principle in human nature is the craving to be appreciated” (Wallace, 2026, p. 24), and he was right. Appreciation or the feeling of being valued by others has played a crucial role in the survival of humans, who evolved to live in communities and who needed to be able to depend on each other to survive (Wallace, 2026). While researchers have given this phenomenon a variety of different names—the need to feel appreciated, to belong, to matter, to feel included—every year social scientists demonstrate how belonging, or the lack thereof, impacts physical and mental health outcomes
(Allen et al., 2022; Haslam et al., 2018; for information on the new Belonging journal, see Almarode et al. 2024). In fact, the U.S. Surgeon General in 2023 declared a national “loneliness epidemic” (Weill Cornell Medicine, 2024). Everyone needs to feel valued, so there is an urgent need to foster stronger bonds between people to improve our collective health and wellbeing.
The need to feel included and appreciated applies in academic and work contexts as well, and yet this need is often overlooked. At the facultylevel, research has shown that university professors desire collegiality within their departments, in a time when rugged individualism is eroding meaningful cooperation
A Festschrift for Steve | Hugues, Burton, Christy, Haas, Miller-Perrin, Moreno, Nofziger, Obenhaus, D.V. Rouse, S. Rouse, Williams, Jr., Wright, Cannon
within academia (Macfarlane, 2016). In fact, collegiality within university departments was the most cited issue by professors in a study of workplace (dis)satisfaction (Dawson et al., 2022). Professors are typically hired and promoted based on their research, teaching, and service, but it is meaningful collegiality that allows faculty to “work collaboratively in order to achieve common purposes and assume equitable responsibilities for the good of the unit as a whole” (Dawson et al., 2022, p. 2). Therefore, the growing movement to bring meaningful collegiality to academia is likely rooted in professors’ needs to feel adequately valued and supported within their departments to confront the growing pressures of academic life, such as job insecurity, publishing pressures, and sociopolitical threats to higher education.
At the studentlevel, several articles are published each year attesting to the stress and burnout of psychology undergraduate and graduate students (Kourea et al., 2023; Pereira et al., 2025; Rico & Bunge, 2021). This is, in part, due to a lack of appreciation by those in power, such as psychology professors. Historically, our field has not always emphasized horizontal relationships between students and professors. Wilhelm Wundt, the Father of Psychology, was described by his students as “humorless, indefatigable, and aggressive” (Hunt, 2007, 147). His disregard for the nearly two hundred psychology PhD students whom he supervised over the course of his life was so blatant that in the beginning of each academic year, Wundt would line up his students randomly. He would read from his list of pet projects, and he would assign the first item to the first student in the row, the second item to the second student, and so on. “No one dared to question these assignments,” said one student, lest their careers in this budding new discipline would end (Hunt, 2007, 147). Because Wundt is the father of psychology, he may also inadvertently have become the Father of the (Stereotype of a) Psychology Professor, influencing people's perceptions of what it means to be a psychology professor today, the perception of a research psychologist as a hard nosed empiricist "who cares more about p values than people" (H. Haas, personal communication, March 7, 2026).
Not all psychology professors fit that mold, though, and it is possible to be a good researcher and a supportive mentor and teacher too. This festschrift honors one of those people, in part because of his longterm service as an editor for the Psi Chi Journal of Psychological Research Steven Vay Rouse, was known as “Steve” to his students, friends, colleagues, and loved ones. He was born on December 18, 1966, and passed away due to pancreatic cancer on February 5, 2026. Steve was committed to his students, to his discipline, to mentorship, and to the communities in which he lived and worked.
Steve maintained high levels of meaningful collegiality within his department, and he was a caring, humorous, empathic, and appreciative psychology professor. He cared for everyone in his life, human and nonhuman, and made many feel like they mattered, inside and outside of his classroom. This empowered those he fellowshipped with to realize their fullest potential and to also cultivate belonging in others. Thus, given the need to promote a stronger culture of belonging within higher education, and in society more broadly, in this festschrift we celebrate Steven Vay Rouse and recount the many ways that Steve made his students, friends, colleagues, and loved ones to feel like they mattered throughout his life.
Our hope is that by presenting diverse glimpses into Steve’s life and work, from his classroom to his neighborhood to his living room, we can remind the reader of the importance of using one’s privilege for the common good to foster stronger communities of trust, appreciation, and support. While we know that these words fall short of truly capturing the exemplary human being that Steve was, we hope that at the very least, they bear witness to the life of a psychology professor who knew as well as anyone that cooperation and valuing each other is the only way that psychology can truly be a force for good in the world, and most importantly, that a life in service of others and in pursuit of knowledge is a life of joy and fulfillment.
FIGURE 1
Picture of Dr. Steven Vay Rouse
A
Festschrift for Steve | Hugues, Burton, Christy, Haas, Miller-Perrin, Moreno, Nofziger, Obenhaus, D.V. Rouse, S. Rouse, Williams, Jr., Wright, Cannon
In the following sections, we introduce Steve’s life in loose chronological order. First, we present words that Steve himself penned before his passing on February 5, 2026. Second, we offer early accounts of Steve’s life from his loved ones, friends, and colleagues. Thereafter, students offer insights into Steve’s life as a teacher and mentor, inside and outside of the classroom. Finally, we shed light into Steve’s role as the Editor of the Psi Chi Journal of Psychological Research, and finish with a conclusion.
A Word From Steve
By Steven Vay Rouse
(Printed with permission by Stacy
Rouse)
Twentyfive years ago, on Dominic’s first birthday, I learned that I had lymphoma. Now, there were two primary types it could be. One type had a survival rate of zero. The other one, Hodgkin’s, used to have a survival rate of zero, but now has an amazing survival rate of 80%. And I had to wait to find out which one I had. Keep in mind that Dom was just 1, and Ian wasn’t even born.
I’m not saying I made a deal with God—I’m not sure he does that kind of thing. But I told God, “I really want to live long enough to see Dominic become an adult.” And then, I got good news; I had the one we knew how to beat. Because of that, I have had 25 years of watching Dom and Ian become people I am so proud of and inspired by. And I have had 25 amazing years with my favorite person, Stacy. 25 years of great friendships. 25 years of making a difference. I have had a great life.
There’s a simple prayer that is really meaningful to me from an unusual source; it reflects two important values for me. In the Tom Hanks movie Joe vs. the Volcano, the main character is confident that he’s about to die, and there is nothing he can do. As he feels himself slipping into death, the full moon rises over the calm ocean, and he has a moment of complete transcendence. He whispers, “Oh God, whose name I do not know, thank you for my life. I forgot how big.” Two beautiful values there: Gratitude (thank you for my life) and Awe (I forgot how big).
I have tried to keep those two values in mind—even getting a tattoo to remind myself of them every day—and I believe that those values guided how I treated others (at least on my best days).
Words From Stacy Rouse About Jan’s Artwork
By Stacy Rouse
Long story short, we got to see Jan in October 2025 when she was here visiting family and Steve showed her his tattoo and shared what he would change about it if he could. Unbeknownst to us, she decided to paint what he
shared, and sent it in December 2025. She didn’t know it, but it arrived right around his birthday and when he was in the hospital. It was amazing timing and Steve loved the painting (see Figure 2). We had it in the hospital room for almost his entire stay (it arrived just days after he went in) and then up in our room once we got home.
Who Is Jan the Artist?
By Jan Obenhaus
I have been creating Art in many forms for over 40 years: from Sculpture, Jewelry, Portraits and Nature Paintings. My favorite works are the personal ones inspired by the spirit of a person or place that I have known. I connect with them, I think about them, and that transfers to the finished artwork. In essence allowing others to see what I see, truly inspired work. These things I have described are all very much true
FIGURE 2
Picture of the Painting Titled “Steve vs. the C” Reprinted with permission from the artist, Jan Obenhaus, a lifelong friend of the Rouse family
of the painting “Steve vs. the C.” I was admiring Steve’s tattoo as he told me the meaning behind it. He started explaining what he would change about it if he could. I could picture all the changes he was describing. I thought to myself, “That would make a beautiful painting, and what a cool tattoo!” So I painted “Steve vs the C” with great meaning behind it.
For myself, working on the painting was a very moving experience. I thought about Steve and Stacy while I painted. I rewatched Joe vs the Volcano. I painted the figure holding up the moon thinking about Steve fighting his cancer.
As I painted the stained glass, I thought of the back wall of the campus chapel and the church community that would be there to support the Rouse family over the coming months.
The “C” felt like the ocean, the cancer looming large. The glow of the moon on the water and covering Steve and ocean around him saying, “something bigger than you!,” saying, “I’m here with you!”
The stained glass on the water feels like the recognition of others on a similar journey. And as a whole, it feels like a sense of hope, and beauty, and peace.
I knew Steve since the late 70s in Golden Colorado where we were in Youth Group together. He was like a big brother, with a car!, and I was the little sister in the back seat rolling my eyes because he made us listen to country music.
Steve went to Abilene Christian University (ACU) for college in Texas, and I ended up there a few years later. This is where Steve met and fell in love with my roommate and best friend Stacy. So, you’re welcome!
One thing I have always know to be true about Steve: No matter what fear or anxiety was put before him, nothing ever stopped him from moving forward and seeing the positive side of things.
Who Was Herbert Jinx?
By dominic VAY Rouse
Herbert Jinx was a Colotexaminnefornian trickster, inventor, and allaround fliberdigibbit most famous for his contributions to language and the genre of Car Games. A Christian psychologist by trade, Jinx walked a fine line between deconstruction and antidisestablishmentarianism: a tightrope which he balanced on with the assistance of his often overwhelming selfdoubt and infectious sense of fun and humour. Raised in a neglectful household, Herbert Jinx was expected to be a caretaker and peacemaker from a young age. As such, he became very adept at identifying secret rules, so adept that he often ended up imagining them where they didn’t exist.
A common misconception about Herbert Jinx is that he was himself the creator of the Car Game “Jinx,”
a misconception that Jinx himself allowed to fester in the minds of people. Ever the lover of calming peace, Jinx abhorred backseat arguments, especially those that spawned from games. Games, Jinx believed, were supposed to be fun and not cause strife in relationships.
On one afternoon, after the 5th or 6th argument between his kids over the finer rules of the game, which can only be discovered by two brothers trying to hurt each other with a children’s game, Herbert Jinx had an idea. Using his last name as leverage, Herbert claimed to be the man who invented Jinx, and with his newly gained ethos, was able to settle every single argument that came up.
There was a drawback to this newfound power however: and that was that his children fully believed the lie, and began coming to him for insights into all of their Car Games with full faith in their father as the creator of Jinx. Although Herbert loved the power trip, it worried him at how deep his children’s faith in Herbert Jinx ran, so finally he told them the truth: Herbert Jinx was Steven Vay Rouse. It was worse than learning there was no Santa Claus, but the wound healed and trust remained over time and the Car Game arguments became less and less.
Herbert Jinx was stubborn, stubborn, stubborn, stubborn, stubborn.
Herbert Jinx loved people, people, people: stupid people.
Herbert Jinx was such a loving, caring, sweet man that it would cause problems for himself and others.
Herbert Jinx did not invent the game of Jinx, but he was one of the primary inventors of myself and I am so thankful to be one of the things he was most proud of creating.
Steve as a Thought Partner
By Heather Haas
Steve and I met as PhD students at the University of Minnesota in the 1990s; we shared an academic “parent,” and we shared an office for our first year. We never worked together on any research during our time in Minnesota, though, seldom took the same classes, and I can’t even say that we knew each other all that well. I can’t really explain, then, how Steve and I came to be collaborators, coauthors, and friends.
Perhaps it happened because I have always worked on very small campuses with few colleagues in psychology. If I had a question or wanted feedback on a manuscript, I sent a quick email to Steve. I relied on Steve when I needed a memory check, a fact check, or a reality check. That was the pattern that saw us through job searches, careerrelated drama, promotion, publication, and rejection letters. In that sense, Steve has been my faculty colleague for more than 25 years, even though our offices have always been at least a thousand miles apart.
I have only seen Steve a time or two since we graduated, but Steve was so much a part of my teaching, of my research, and of my personal Board of Directors that losing him from my inbox will leave a thousand little holes because reminders of Steve are everywhere in my world. I think of Steve when I use Track Changes, because Steve introduced me to Track Changes, and I think of Steve when I use semicolons, because Steve loved semicolons. Copies of emails telling stories about his kids are taped into the margins of my class notes. My students and I often segue into discussions of Steve’s concept of “Universal Worth” when we discuss Carl Rogers. I think of Steve when I receive notices from ResearchGate that someone has cited one of our papers, and I think of Steve when I eat edamame, because Steve introduced me to edamame at the SPSP Conference in Las Vegas in 2015.
Steve was a part of my past and present, but he was also supposed to be a part of my future. We had so many plans for research projects we were going to do—eventually, when we both had time. Some of those ideas were probably what Steve called B&SOs (“bright and shiny objects”), but others would have become realities. I can still do those projects, of course, but Steve would have made the work better because he was unfailingly insightful, honest, and encouraging, and that is a powerful combination.
What I had never really realized was just how intentional our relationship was. Our entire relationship postPhD was conducted on email, so when Steve and I communicated, it was always because one of us reached out—intentionally and individually—to the other. For more than 25 years we both just kept reaching out and reaching back; in some ways, that doesn’t seem like much, but in other ways, it is everything.
“Steve Rouse Is in the House”
By Cindy Miller-Perrin
I met Steve Rouse in January of 1998 when he was interviewing for a position in psychology at Pepperdine University. I recall going to dinner at a local seafood restaurant with he and his wife, Stacy. What a delightful couple and a promising teacher/scholar. I knew then and there that this guy was special and that we had to hire him. Though it took me months to remember how to pronounce his name—was it “rowz” or “rooz”—I finally got it down after a colleague helped me out with a mnemonic device. Rouse is in the house! Indeed, Dr. Steve Rouse was in the house for 28 years and impacted my life, along with so many others, as well as the Pepperdine and psychology communities, through the unique person he was as a teacher, researcher, and friend. I think it’s safe to say that Steve was one of the best
teachers in our Social Science Division at Pepperdine. I saw him teach on many occasions, and I conducted many promotional reviews for him. So, I witnessed firsthand his teaching giftedness. In one class I heard him selfproclaim to be a “nerd.” And that’s true if your definition includes someone who LOVES psychology and its intricacies—Steve did—more than anyone I know and, in my humble opinion, more than any person should love an academic discipline! But this, I believe, is what made Steve such a good teacher. He was dedicated to his subject matter and knew it comprehensively. He was passionate and engaging. Steve taught several courses that were popular among students but he also taught many that might not be considered inherently interesting to undergraduates. Regardless, his students were inspired by his knowledge and creativity. His teaching was so exceptional that, in 2007, he was the recipient of the Howard A. White Award for Teaching Excellence. But, above all, Steve was committed to his students, both inside and outside the classroom. He served as the faculty advisor to Eta Theta Tau Musical Theater Club, the Neurodiversity Student Organization, and the Crossroads Gender Sexuality Alliance. His service in these areas, no doubt, led to his recognition in 2021 as the recipient of the Impact Award for Outstanding Service to Seaver College Students and in 2023 the Distinction in Diversity and Inclusive Excellence Faculty Award. As more evidence of his impact, when Steve was diagnosed with cancer, many, many of his students sent cards and letters of support. Most of these students designated Steve as their favorite professor and also shared a story about how Steve impacted them personally. Through his teaching, Steve changed lives
In addition to being an outstanding teacher, Steve was an accomplished scholar within the field of psychology. Early in his career, he was twice recognized for his scholarship as a finalist for the Samuel J. and Anne G. Beck Award for Outstanding Early Career Research in the Field of Personality Research. Steve was not one to publish simply to rack up publications in order to achieve promotions. He generally chose research projects for one of three reasons: because he felt passionate about the topic (e.g., his personality research), because it provided an opportunity to mentor students (e.g., he worked with dozens of students on research projects), or because the research was in the service of a broader goal such as contributing to his community (e.g., his research documenting the effectiveness of a water purification program to improve attitudes about drinking purified recycled water). In total, he produced over 50 academic publications throughout his career and presented much of that work to the psychological and broader academic communities.
But my memories of Steve transcend the academic,
as they do for most people who worked with him. Steve was a good friend and neighbor. And, as it turns out, Steve was not the only nerd to inhabit the Pepperdine community. My husband and I have been huge fans of the show Survivor for many years and have been celebrating the show by hosting a dinner and watch party, called Survivor Night, since nearly the show’s inception. Imagine my delight to find out that Steve and Stacy were also fans! They became a part of our Survivor Night in 2017 and faithfully attended until this past fall. Part of our routine was to rotate dinner responsibilities among members of the group. Steve was often the cook contributing to the meal, and it was always a treat to enjoy his main dishes and desserts. And Steve didn’t just whip something up— his contributions were an event! My favorite was his Tres Leches cake. He also made a pretty mean Margherita and Mojito! We also often had a competition to guess which contestant would be voted out each night. Steve was a pretty competitive guy, but also almost always right, and his memory for episodes and past seasons was remarkable. This should come as no surprise to those who knew him given his sharp and analytical mind. He also had a playful sense of humor. But my best memories of Steve, as a friend and longtime neighbor, have to do with his generosity and joyful disposition. He was always the person to chip in and help out, no matter what the request. He never did anything begrudgingly, but instead, always with a spirit of giving. One thing I always appreciated about Steve was his joyful disposition, which I think stemmed in large part from his steadfast Christian faith. He was the kind of guy who always had a smile on his face. I know this to be true because every time I saw him at church or in the office or even driving down the street in front of my home (even when driving by himself!), he was smiling. Even while facing death, Steve was always thinking of how others were doing and feeling and continued to dazzle with his smile. I will always miss him and will never forget him. Steve Rouse will always be in the house!
A Luminary: Thoughts on the Legacy of Steven Vay Rouse
By Robert E. Williams, Jr.
Steve loved light and he loved the idea of light, especially light as a metaphor for truth, for love, for justice, for knowledge. What I most want to convey about Steve is that he was a luminary. He was a brilliant teacher, researcher, and administrator—a luminary in that sense, certainly—but he was also a luminary in the more literal sense of being a lightgiver.
Let me begin with some of the obvious ways Steve shined:
Pepperdine University recognized Steve with the
Howard A. White Award for Teaching Excellence, the Impact Award for Outstanding Service to Seaver College Students, and the Distinction in Diversity and Inclusive Excellence Faculty Award. Psi Chi, the International Honor Society in Psychology, made Steve the editor of its flagship journal four years ago and, last month, named Steve a Distinguished Member. In an organization that has had 900,000 members in its 97 years of existence, only 53 have been named Distinguished Members. At Pepperdine, our highly ranked undergraduate Psychology program bears Steve’s imprint on the curriculum and, more importantly, on the outstanding faculty. As divisional dean and as a member of numerous search committees over the years, Steve had a role in hiring and mentoring most of Pepperdine’s Psychology faculty.
Personally, I learned a lot about Steve (and a lot from him) over the 28 years we knew each other. Much of what I learned came from sticking my head in his office to ask for advice, especially after I followed him in the divisional dean role.
Steve was a friend from the beginning of our association—it was impossible not to like him—but the longer I knew him, the more my appreciation for him grew. He was an upstander, not a bystander. He elevated those around him, especially those who had been marginalized. He brought the light of science, which he pursued rigorously, to questions of gender prejudice and he affirmed—in person and in public, insistently—that gay, lesbian, bisexual, transgender, and other persons persecuted for their identity were made in the image of God.
While serving as divisional dean, I had the opportunity to sit in on Steve’s classes, read his annual reflections on his work, and study his course evaluations. It was quite common to see students, in their anonymous comments about his classes, struggle to find the right superlatives to express their appreciation. Perhaps no one did it better than the student in a class on Personality who said the course was “freakin’ lit.”
Steve . . . loved . . . teaching, and he was one of the best. He loved teaching so much—and I swear this is true—that he chose not to apply for sabbaticals. He routinely asked to have more students added to closed classes. He taught virtually every summer without worrying about what he was getting paid. I’m convinced that Steve, if given a choice between getting paid without teaching and teaching without getting paid, would gladly have chosen the latter.
When I first walked around campus after Steve passed from us, the weight of his absence was palpable. What I heard often from colleagues was something I was already saying to myself: No one can replace Steve.
We can’t replace Steve, but, like him, we can dedicate ourselves to truth, be passionate about our work, and stand with those who are marginalized. We can, together, do what Steve did.
We, too, can be luminaries and know that “the light shines in the darkness, and the darkness has not overcome it.”
Steve Brought Action to Theory at Pepperdine
By Donna Nofziger
Writing in honor of a colleague is always a humbling task; writing in honor of Steve Rouse, whose life so fully integrated intellect, faith, and action, is especially so. No single account can contain the scope of his influence but what is offered here is not meant to be comprehensive but instead is an example of one of the ways that Steve lived his vocation at Pepperdine with integrity.
Academic life often emphasizes reflection over action. Ideas are debated and refined with care, yet they can often remain largely confined to the ivory tower of scholarly discourse. Steve was a respected and prolific scholar, but his intellectual pursuits were not limited to just academic dialogue and publications. Instead, they were woven into the way he lived his life. For Steve, knowledge carried ethical responsibilities that called him to action in ways deeply informed by his Christian faith. In doing so, Steve made Pepperdine a better and more loving place by openly sharing his authentic self, advocating tirelessly for others, and bringing important conversations out into the open.
This integration of inquiry and compassionate action was especially evident in Steve’s involvement in Pepperdine’s Bridges Program (formerly SEED). The program gathers faculty and staff in sustained dialogue around questions of equity and belonging through the lens of higher education. Participants share experiences, listen across difference, and reflect on how institutional life shapes the flourishing of all members of the community. Steve embraced this work as an expression of his deepest commitments. He believed that Christian and academic ideals alike require intentional effort to ensure that every member of the community is seen, valued, heard, and enabled to thrive.
Over the many years Steve participated in Bridges both as a participant and as a panelist where he shared openly with courage and humility about his own experience as a bisexual man at Pepperdine. He also organized panels of students who identify as LGBTQ+ to share their own journeys. Such open discussions involve vulnerability, particularly in light of the power dynamic between students and faculty. Their willingness to do so is a testament to the credibility and trust he fostered through leading by example and his consistent care for others. These sessions were among the most impactful of the program in a large part due to Steve as he inspired us to reflect on the testimonies of these
community members and how they call us to action to do our part in making Pepperdine an example of an inclusive, welcoming institution grounded in Christ.
Steve’s influence extended throughout the university. He cultivated environments—classrooms, offices, informal gatherings—where individuals felt safe to speak honestly and to be received with dignity. He practiced a quiet boldness: a willingness to name difficult realities, to accompany those who felt marginalized, and to invite others into deeper understanding. His credibility as a scholar, teacher, and faithful member of the Church of Christ gave weight to his witness. If he possessed forms of privilege, he employed them not for selfprotection but for the benefit of others, enabling many to live and learn more fully.
To remember Steve is to recall a life in which theory and action played out in beautiful ways. He demonstrated that scholarship can be an instrument of care, that faith can fuel intellectual hospitality, and that institutions can be shaped by those who live their convictions with heart, soul, and mind. His example continues to call this community toward deeper faithfulness, wider compassion, and more generous understanding so all can live more abundantly.
Steve’s Classroom Was Like No Other
By Juan Carlos Hugues
Black Tshirt, jeans, a tumbler in hand, and a gentle smile. This was Steve. This is how I remember him during my first day in his Psychology of Personality class. When the clock struck 8:15 a.m., Steve introduced himself and started class by going over his syllabus. I will say, Steve’s syllabus was unlike any syllabus I had ever seen until that point. And after almost eight years since this class, I have yet to see a more caring and thoughtful syllabus than his. What made this syllabus unique to me was the section titled: “Learning environment values.” In this section, Steve recounted how he valued a, “Diverse, inclusive, accepting, welcoming, safe space, for everyone.” These words were stacked on top of each other like building blocks and shaded with the colors of the Pride flag. As a queer person attending a Christianaffiliated university, Steve’s use of the rainbow was a gentle reminder that I belonged in his classroom and that I was welcomed for exactly who I was.
Another element that I have yet to see in another syllabus was his “In memorium” section. I remember him saying that “All of my courses are dedicated to the memory of Larry Kimmons.” He then explained that Larry Kimmons was a Black teenager who was murdered on March 12, 1969, by a white Pepperdine security guard, for the simple reason of trying to use the basketball courts at Pepperdine’s former South Los Angeles campus. Steve was acutely aware of Pepperdine
A Festschrift for Steve | Hugues, Burton, Christy, Haas, Miller-Perrin, Moreno, Nofziger, Obenhaus, D.V. Rouse, S. Rouse, Williams, Jr., Wright, Cannon
University’s history of police brutality and actively used his white privilege to call out Pepperdine’s past and present institutional racism. We went on like this until 10 a.m., and Steve stayed after class to answer any questions.
The following day in his class, I learned about Janet Hyde’s gender similarity hypothesis, or the idea that women and men are more similar than different on most psychological variables. On the third day, I learned that “Our modern skulls house a stoneage brain.” On the fourth day, that collectivist cues are important in making Latinx students feel welcomed in higher education. On the fifth day, that gender and sexual orientation are continuums (and that being an LGBTIQ+ Christian is possible). On the sixth day, about OCEAN or the Big Five personality traits. On the seventh day, about how snobbish 20th century scholars used tea to create the p value (for the story of Fisher and the Lady Tasting Tea, see Brereton, 2020). During every class, I dreaded when the clock inched closer to 10 a.m. I didn’t want Steve’s classes to end. His teachings were like seeing new colors. I’d plant every word he offered in class inside my heart.
Outside of the classroom, Steve was just as caring. He always wrote feedback and emails in green, since “green was calming and red can be intimidating for students,” he’d say. He’d throw out exam questions where 50% of students got the question wrong (to him this meant he wrote a bad test question). He always encouraged students to attend his office hours, “to talk about class or life.” I’d visit his office every chance that I could, and I’d ask him many questions about psychology. He’d tell me about how psychology came from philosophy, and how psychology was cooler since we could actually test things (This was lighthearted interdisciplinary jousting, of course). That the big debate in the 1950s on whether a person’s personality or social context was more important was stupid. “It’s both,” he’d say. As a bisexual Christian, Steve recommended I read David Gushee’s book Changing Our Mind. Even in his office, I dreaded the moments when our conversations would end, when I’d see another student from the corner of my eye standing by the door also wanting to talk with him. Everyone loved talking to Steve. Steve was a great conversationalist.
Later that same semester, Steve chaperoned a university field trip to San Francisco that introduced students to the different social justice movements born there. Steve led the tour of the LGBTIQ+ movement, and we visited the Castro district with him. It was my first time in San Francisco; my first time seeing men wear stilettos and strutting down the sidewalk with joy and Pride. On the tour, we passed in front of a school named after Harvey Milk. The school prided themselves in promoting a “social justice curriculum,” and that was when I got the words to describe Steve’s class. I remember turning to Steve and
telling him that this school did exactly what he did in his classes. He smiled and thanked me. We also went to the Most Holy Redeemer Catholic Church, the only church in the area that helped LGBTIQ+ people during the AIDS epidemic. Thanks to Steve’s commitment to introducing his students to new ideas, this was another moment that solidified my conviction that I could be queer and Christian.
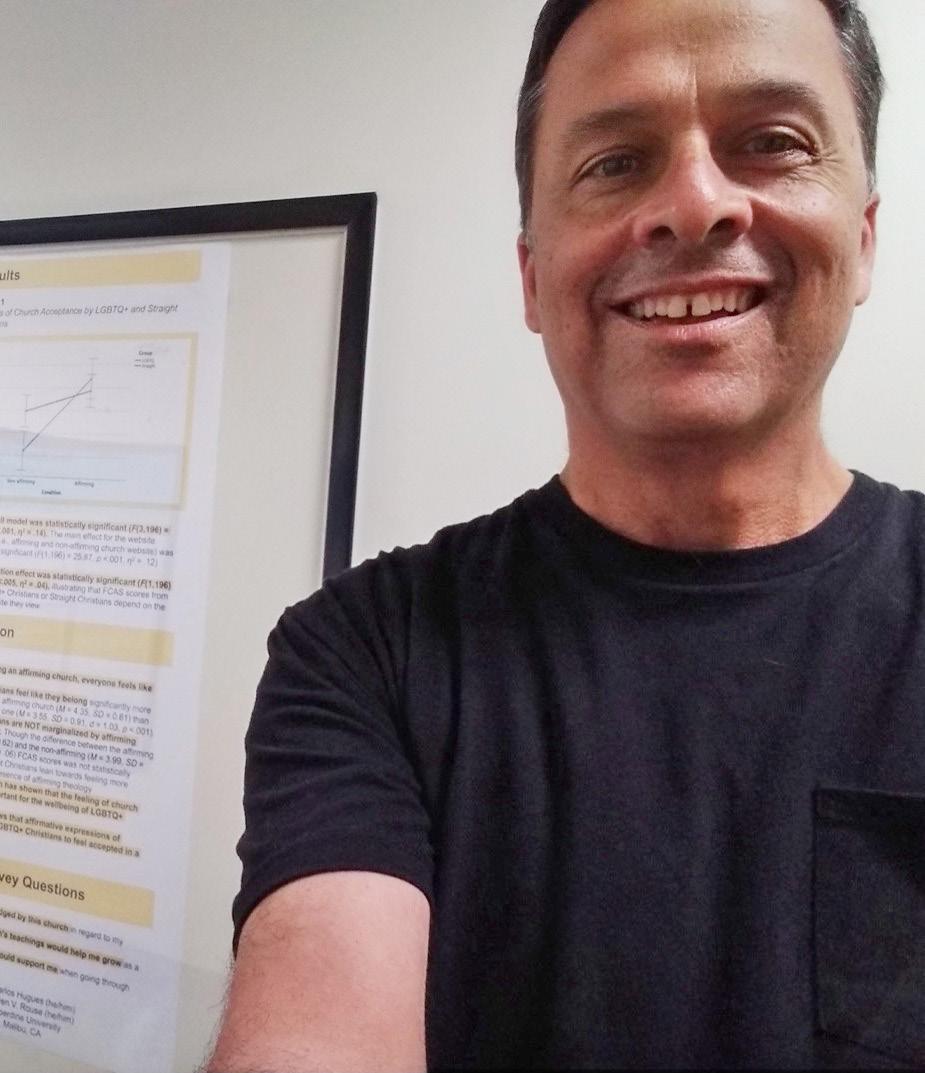
During the rest of my time at Pepperdine, I took as many courses as I could with Steve. I even signed up to do independent research with him to better understand the Identity Safety Cues (ISC) that help LGBTIQ+ Christians to better belong within churches (see Figure 3; Hugues & Rouse, 2023). Doing research with Steve was like flying. He gave me complete liberty on the paper. “You should write a paper that you’re proud of,” he told me, and I now know that he was pushing me to be an independent thinker. Steve was the best research teammate until the end. In fact, my email exchanges with Steve were a bit like playing tennis. Steve responded promptly; gave feedback promptly; read the drafts promptly—the ball was always in my court.
FIGURE 3
Steve in the Appleby Center (AC) at Pepperdine University in Front of a Student Poster Presented at SPSP 2022
Steve stopped teaching midsemester in the fall of 2025. By this point I had completed my master’s in psychology and had my eye toward a PhD in psychology. The news of his battle with cancer crushed me. Like many who also loved him, I asked repeatedly: “Why Steve?” To cope with the grief, I sent him an email inquiring about something he had mentioned a long time ago when I first took his Psychology of Personality class:
Juanca: “You know, one time in class you told us about your psych genealogy, and that has always stuck with me, since I consider you my first mentor. So, I was wondering, when you had a chance, if you could tell me your psych genealogy again” (see Figure 4).
It’s now been a few weeks since Steve’s passing, and I am still heartbroken. Heartbroken that with Steve’s death, his classes have also come to an end. One truth that brings me peace is that Steve’s teachings continue to live in the hearts of every single student he taught during his academic tenure. It is now up to us, his students, to continue nurturing the good that he planted in every single one of us.
The Professor He Wished He Had in College
By Ashley Burton
I first met Steve at church, which I was attending for a class project. After leaving the service that day, I did not expect to see him around. However, about a week later, Crossroads GSA (Gender and Sexuality Alliance) had a game night. I hadn’t realized this, but it was hosted at Steve’s house. When he opened the door, we instantly recognized each other and were able to talk more casually. That year, I would see Steve around at several GSA events, including sexual education events he would personally lead.
The next academic year, I became GSA’s financial officer. While I didn’t always interact with Steve directly, I saw his role in helping our club’s leadership. He helped give us direction on what to do or who to talk to next if we were struggling, and he always had great ideas for events. That year, Pepperdine started to cause some problems for the club. The situation involved most of the spring semester, and it was incredibly emotionally and mentally draining to deal with. Through all of it, Steve was there for us. He gave us encouragement and helped us move forward.
This academic year, I rejoined GSA as the president. This was when I truly saw Steve’s advising role for the club. He and I met individually so that we could plan
FIGURE 4
Steve’s Email Response to Juan Carlos Hugues
Steve: "I'm so honored to have been your first mentor. Here's my lineage. Wilhelm Wundt is considered the first empirical psychologist, and one of his mentees was Hugo Munsterberg (who was a character!). With Munsterberg, my lineage splits into two lines because two of Munsterberg's mentees were Richard Elliot and Gordon Allport.
My lineage from Richard Elliot was more scientific and statistical. He had a mentee named Starke Hathaway, the primary author of the MMPI. Hathaway mentored Grant Dahlstrom, who mentored my major advisor, James Butcher. I really love Jim —he was a very kind and generous graduate advisor.
My lineage from Gordon Allport was more theorectical. He mentored Gardner Lindsey (who co-authored what used to be considered THE definitive personality textbook), who mentored Auke Tellegen, who wa my dissertation advisor."
Steve | Hugues, Burton, Christy, Haas, Miller-Perrin, Moreno, Nofziger, Obenhaus, D.V. Rouse, S. Rouse, Williams, Jr., Wright, Cannon
out the year for the club, potential challenges, and how to make sure that we could be as successful as possible. During the year, we planned to do office hours to support queer students. When I told Steve we were planning this, he immediately requested us to include his office hours information on our posts. Even after his diagnosis in the fall, Steve continued to lend his assistance through Zoom meetings and asked us to keep his contact information publicly available in lieu of his inability to do office hours in person.
Through all of this, I was also personally dealing with a lot, including homelessness, struggles with my sexuality, and coming out as transgender right around Steve’s diagnosis. He was always there for me individually. I went to my first Pride parade with Steve and Stacy, and he offered a backup option for item storage if I needed it during the summer. Most of all, I’m glad to know that he was able to finally see me fully realize who I truly am.
In fall semester, after hearing of his diagnosis, I led the GSA to organize a series of videos for Steve from GSA members and alumni to express our appreciation for everything he’s done for us, both in our personal lives and for GSA. When we finally sent that over to him, something that he said that I’ll never forget was that he wanted to be the person he wished he had when he was in college. I think for all of us and GSA, Steve was that professor he always wanted, and I’m happy that he knew that.
Steve as a Student Mentor
By Isabella Moreno
I was never fortunate enough to take a class with Dr. Rouse, yet his influence on my academic life was still foundational at Pepperdine. Our conversations never took place in classrooms, but in his office for advising meetings, where they became discussions about class schedules and graduation requirements, and about direction, passions, and possibilities for the future.
One of the things I’ll remember the most about Dr. Rouse was his patience. Academic advising always felt procedural and became a todo list of credits and deadlines, but every time I met with him for academic advising and rambled on and on about my worries about the future or whether or not I’ll be able to take all the classes I want to take and still graduate on time, Dr. Rouse always met my worries with patience. He listened to my problems and made my worries feel worthy of time. He never imposed answers on me, but instead helped me to think through my problems and gave me choices so that I could figure out what I needed. He had this amazing ability to break down my complicated problems into a manageable plan, and I always, always felt better after every meeting. Even though I never had a class with Dr. Rouse, I still could see his passion for teaching and for
students through our conversations, which were refreshing to see, and I always felt so inspired after our meetings.
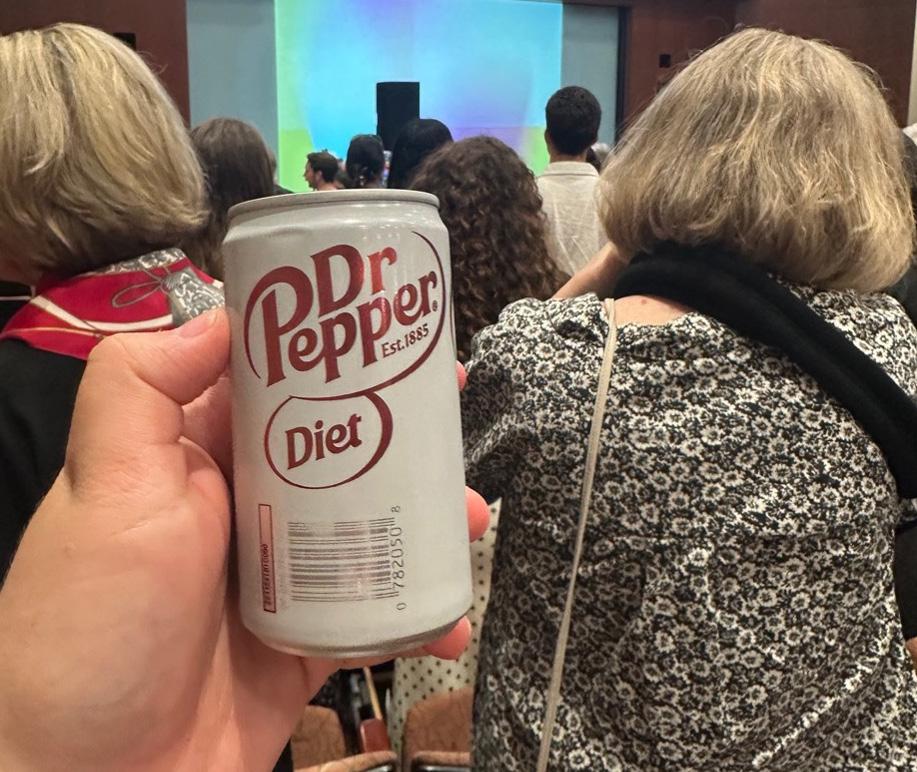
I remember one of the first things I noticed about Dr. Rouse was that we had the same favorite soda: Diet Dr. Pepper (see Figure 5). Every time I walked into his office, there was always a can of Diet Dr. Pepper on his desk, and I remember the first time I saw it I thought, “Wow. This guy gets it.” And I wish I would’ve told him that.
Dr. Rouse was also the advisor for Pepperdine’s GSA Crossroads, and he had such an impact on queer students at Pepperdine, especially queer students who are of the Christian faith. He always provided a safe space for anyone and everyone to come talk to him, and I wish I had used that space sooner. He never made me feel ashamed to be who I am, especially within my faith, and I know he did the same for so many other students like me. I am so grateful for that community he was able to create, and I want to be able to be at least half as kind and understanding as Dr. Rouse was.
While I wasn’t his student in a traditional sense, I felt guided in a deeper way. He was a true model of God’s love, and he has inspired so many people in so many different ways. I realize now that mentorship doesn’t come from just the front of a classroom or from across a desk—it comes from game nights, club meetings, and from people who understand your uncertainties and help you navigate through said uncertainties. His impact didn’t
FIGURE 5
During Steve’s Celebration of Life on February 28, 2026, Family, Friends, and Loved Ones Toasted to Steve With a Diet Dr. Pepper in the Elkins Auditorium at Pepperdine University
come from a syllabus or a grade, but from conversations and from the confidence he gave so many people. I think and hope he knows how many people he has helped, and I can only hope to be half the person Dr. Rouse was.
Steve’s Legacy
By Danica Christy
Steve was, without a doubt, the best professor I’ve ever had. I took his classes every chance I got. He was passionate about teaching, and it was evident how deeply he cared about both psychology and his students.
I took Steve’s intermediate statistics class from 6 to 10 p.m. at the end of twelvehour days. With any other professor, that class would have been miserable. Steve somehow made it fun. He designed the course like a cooperative game where we earned points throughout the semester as we prepared for what he called the “boss fight” (the final exam). He even printed each of us a 95 page “statistics bible,” which I still use today. Although I’ve taken many statistics classes since then, I find myself returning to his notes when I’m confused.
Steve consistently went out of his way for his students. At the start of my senior year, I told him I was interested in sexuality research and frustrated by the lack of opportunities to explore it at Pepperdine. A week later, he emailed me and said, “You know what? It’s about time Pepperdine offers a Psychology of Human Sexuality course. What do you think of this syllabus?” He had already designed what felt like the most thoughtful, forwardthinking course I had ever seen. In true Steve fashion, he got it approved for the following semester. I was able to take the class, and it remains my favorite class of all time.
As my research mentor, Steve met with me weekly to discuss my progress. I often arrived scatterbrained and overwhelmed, but within thirty minutes he would calmly untangle everything. He had an incredible ability to make complex problems feel manageable. More importantly, he could make you feel capable of solving them.
I know I am far from the only student that Steve helped. He was endlessly generous with his time and guidance. He made it clear that he was always available as a professor, mentor, or simply a listening ear. No matter how busy he was, Steve would make time for you. Steve was also a staunch advocate for queer students at Pepperdine. He made us feel safe, seen, and supported. That meant more to me as a queer student than I can fully express. As the Crossroads GSA advisor, Steve supported our ideas, activism, and growth without hesitation. Whether we wanted to join a nationwide protest against Title IX exemptions or organize a sex education workshop, he was always in our corner.
When I spoke with Steve after his diagnosis, he told me he’d been thinking about his legacy. He said, “I want my legacy to be that people who otherwise would have felt marginalized were able to feel like they belong and are valued.” That is exactly what he did for me and countless others. Steve helped me grow into the researcher, advocate, and mentor I am today. I will forever be grateful to have had him in my life. Steve’s legacy will live on through the many lives he’s touched.
Dr.
Steven Rouse:
Researcher, Colleague, Friend
By Robert R. Wright
As a researcher, Dr. Steven Rouse had an impressive track record. Following completion of a rigorous doctoral program at the University of Minnesota in 1997, he authored nearly 60 publications, gave numerous academic presentations to students and scholarly colleagues, taught higher education courses for more than 25 years at Pepperdine University, and was an editor of the Psi Chi Journal of Psychological Research for nearly 5 years. He has mentored hundreds of students (many of whom learned to love research, and even statistics, under his tutelage), influenced his colleagues and peers through his research and editing services, and impacted many prospective authors in his efforts to further the mission of the Psi Chi International Honor Society by leading their flagship journal. He was especially noted for his attention to detail in methodological rigor and statistical accuracy in both psychological and personality assessment. Yes, Steve had an impressive academic career.
Yet, as a person, friend, and my colleague, Steve was even more impressive. I joined the Psi Chi Journal Editorial Board back in 2016 and then later became an Associate Editor in 2019. I was immediately welcomed by Steve, who helped socialize me to the new role by embracing and encouraging my contributions. I was very impressed at how personable, warm, and likeable he was. Then, when he became Editor in 2021, I was further amazed as he demonstrated his love not only for the field of psychology (that he loved greatly), but also for the people in it. There was no demeaning attitude or belittling behavior from Editor Rouse as he handled my reviews and recommendations for the journal. He was always encouraging, uplifting and providing edifying experiences. I saw him exemplify this with everyone he interacted with, whether a hopeful student author or colleague. For instance, during our regular editorial meetings, Steve would always ask us to check in and provide personal updates from our lives in recognition that we were more than employees, but that we were humans with personal lives. This allowed us to
acknowledge events occurring behind our professional persona. I witnessed several disheartening and difficult circumstances that were shared in those meetings and Steve’s unwavering ability to encourage and support those who were struggling whether it be personal or professional. I loved that about Steve—he treated people with respect and dignity not simply out of scientific curiosity, institutional obligation or personal agenda, but because he recognized we were all like him, we were all human.
In short, Steve left an impact wherever he went: from his academic achievements in the field of psychology to the colleagues and students he interacted with. Steve’s legacy is one that will live on with us, as he has profoundly and positively impacted so many as he journeyed through this life, both professionally and personally. We will miss him. Yet, we will press forward by honoring his memory both with this collection of essays and with a commitment to follow Steve’s example. The Psi Chi Journal of Psychological Research will forever be grateful for his devoted service and will continue to further the values and ideals that characterized Steve’s own professional and personal life—even the high ideals of academic excellence and personal connection.
A Tribute to Steve
By Bradley Cannon
I had the privilege of knowing Steve for more than ten years through our work on the Psi Chi Journal of Psychological Research —not just as a colleague, but truly as a friend.
Steve was deeply passionate about psychological science and about helping students grow into confident, capable researchers. Paired with his extraordinary knowledge and productivity, he was the perfect person to step into the role of Associate Editor in 2014 and then Editor in 2021.
Steve didn’t necessarily make the research or publishing process fun. Instead, through his seemingly limitless energy and ideas, he made it meaningful to all those around him—which I’ve come to believe is far more important.
This may come as a surprise to some of you… but certain parts of the research process can be a bit tedious. And yet, no matter how painstaking the task—whether reviewing a 100page issue for small errors or navigating the long road to inclusion in an academic database— Steve inspired every person around him to always give their best, to work with intention, and to approach every project with care. Through his own passion for whatever we were working on, he fueled us with certainty that we were making a difference in the world.
Working with Steve was an incredible gift. He was
always prepared, thoughtful, and two steps ahead. No one could write more eloquent emails or keep more plates spinning—and yet he was endlessly patient and encouraging too. He often thoroughly reviewed papers within mere minutes after I passed them to him, and because of the great detail in his decision letters, I suspect that he was actually looking ahead in our online portal so that he could examine papers before they were even assigned to him. I could never quite keep up with Steve’s remarkable pace, and I doubt that anyone could! And yet, he never pressed me harder or made any criticisms on those days when projects piled up around me. He always seemed to know when people were trying their hardest and instead sought ways to be supportive and make the best of every situation.
Because I live more than 2,000 miles from Pepperdine, most of our collaboration happened over biweekly Zoom calls and (quite literally) thousands of emails (always in that green font of his). But one time, shortly after he became Editor, Steve traveled to Chattanooga after an SPSP conference so we could spend a few days planning for the journal’s future. I remember that visit well. The future felt tremendously bright. And when he left for the airport, I hugged him and felt deeply grateful for the work we were doing—and for the person he was.
I’m grateful still. And I miss his cheerful, steady presence more than I can say. Steve often encouraged others to speak first in our meetings. He even did this on the day that he told us about his diagnosis—letting me first rattle on for several minutes about trivial matters like how to respond to a reviewer about an unusual question and our edits in the latest layout proof.
Of course, no one would have blamed Steve if he had resigned immediately that day. But instead, he insisted that he keep at it for as long as his health would allow. According to Steve, he enjoyed his role and wanted to stay busy and maintain some sort of normalcy in his life. But more than this, it was at this time that I came to really understand just how important the journal was to him. Supporting early career psychologists meant so much to him, and through the journal, he had found a conduit with which to nurture their skills and reach across the psychological community and society as a whole.
Steve believed in doing excellent work, but he believed even more in the people doing it.
Rest in peace, Steve. You made an impact on us all.
Conclusion
Our aim with this festschrift was to express our appreciation not only for Steve, but for all those professors and students who are working to cultivate a stronger culture
of belonging in higher education generally and in the field of psychology specifically. We hope that these pieces will also serve as evidence that even small acts can make a big difference. Even those of us who knew Steve personally were inspired by the stories others shared, and we hope that other readers too will be encouraged to do the work of being “an upstander, not a bystander,” as Robert E. Williams wrote. As Donna Nofziger stated, Steve “fully integrated intellect, faith, and action” in ways that deserve to be emulated.
Part of the reason why we decided to do a festschrift for Steve was because the festschrift, as a genre, is fading. According to Richetti (2012), in an academic culture of rugged individualism and a lack of time, celebrating colleagues is becoming a tradition of the past, a “charming survivor of a more collegial academic age” (p. 237). In a way, then, the festschrift, as a genre, is the perfect medium through which to revive the spirit of cooperation within academia. And Steve Rouse is the perfect person to honor in this way, in part because of his longterm service to Psi Chi, and in part because–as Danica Christy recounted–Steve lived his life in a way that ensured that his legacy will be “that people who otherwise would have felt marginalized were able to feel like they belong and are valued.”
This festschrift represents much of what Steve stood for and worked to accomplish during his life. Ashley Burton wrote that Steve tried to be “the professor he wished he had in college,” and he was indeed able to be that person for many of his students. Like dominic VAY Rouse wrote, “Jinx [or Steve] walked a fine line between deconstruction and antidisestablishmentarianism,” yet managed to be someone who appreciated everyone around him and embodied meaningful collegiality. Whether he was divisional dean at Pepperdine or the Editor of the Psi Chi Journal of Psychological Research, Robert R. Wright said it best that Steve treated everyone as, “more than employees, but [as humans] with personal lives.” This way of being intentional in relationships, of reaching out "intentionally and individually” as Heather Haas wrote, characterized Steve’s interactions with others. In “treating people as ends in themselves” (Marshall & BokhorstHeng, 2025, p.12) and incorporating a “social justice curriculum” in his classroom, as Juan Carlos Hugues wrote, Steve fulfilled the true mission of higher education, which is to form the whole person and to foster the flourishing of students, friends, colleagues, and loved ones (Marshall, 2024).
In addition to easily being, “one of the best teachers in [the] Social Science Division at Pepperdine,” as Cindy MillerPerrin wrote, Steve’s kindness and his nature of, “seeing the positive side of things,” as Jan Obenhaus wrote, is what made him truly special. Steve’s two guiding values—gratitude and awe, as Steve himself and Stacy Rouse wrote—are great reminders about what truly matters in life. In the end, Isabella Moreno speaks for all of us in writing
that, “[We] can only hope to be half the person Dr. Rouse was.” Of course, while Steve would have never wanted anyone to be exactly like him, we use this festschrift to remind people that relationships matter, and they make life joyful and worthwhile. Steve knew this better than anyone, and he inspires us, “[to believe] in doing excellent work, but [to believe] even more in the people doing it,” as Bradley Cannon wrote. We hope that Steve’s legacy will continue to live on through these words, like a seed planted inside the hearts and minds of the reader, blossoming under the warmth and care of a new kind and gentle steward.
References
Allen, K. A., Gray, D. L., Baumeister, R. F., & Leary, M. R. (2022). The need to belong: A deep dive into the origins, implications, and future of a foundational construct. Educational Psychology Review, 34(2), 1133–1156. https://doi.org/10.1007/s10648-021-09633-6
Almarode, J., Saltus, R., & Strayhorn, T. L. (2025). Introducing belonging: A space for connection, identity, and inclusion. Belonging, 1(1–2), 3–7. https://doi.org/10.1177/30290805241282374
Brereton, R. G. (2020). P values and Ronald Fisher. Journal of Chemometrics, 34(9), e3239. https://doi.org/10.1002/cem.3239
Dawson, D., Morales, E., McKiernan, E. C., Schimanski, L. A., Niles, M. T., & Alperin, J. P. (2022). The role of collegiality in academic review, promotion, and tenure. PloS One, 17(4), e0265506. https://doi.org/10.1371/journal.pone.0265506
Haslam, C., Jetten, J., Cruwys, T., Dingle, G., & Haslam, S. A. (2018). The new psychology of health: Unlocking the social cure. Routledge.
Hugues, J. C., & Rouse, S. V. (2023). Everyone belongs here: How affirming and non-affirming church messages and imagery cause different feelings of acceptance in LGBTQ+ Christians. Journal of Psychology and Theology, 51(4), 523–536. https://doi.org/10.1177/00916471231185811
Hunt, M. (2007). The story of psychology. Anchor. Kourea, L., Papanastasiou, E. C., Diaconescu, L. V., & Popa-Velea, O. (2023). Academic burnout in psychology and health-allied sciences: The BENDiTEU program for students and staff in higher education. Frontiers in Psychology, 14, 1239001. https://doi.org/10.3389/fpsyg.2023.1239001
Macfarlane, B. (2016). Collegiality and performativity in a competitive academic culture. Higher Education Review, 48(2).
Marshall, K. L., & Bokhorst-Heng, W. D. (2025). Pedagogy of care in intercultural approaches to languages education. Cahiers de l’ILOB, 14, 37–58. https://doi.org/10.18192/olbij.v14i1.6763
Marshall, K. L. (2024). Caring pedagogy and supervision in times of crisis and tragedy. Second Language Research & Practice, 5(1), 101–111. https://hdl.handle.net/10125/69893
McCormack, H. M., MacIntyre, T. E., O’shea, D., Herring, M. P., & Campbell, M. J. (2018). The prevalence and cause (s) of burnout among applied psychologists: A systematic review. Frontiers in Psychology, 9, 1897. https://doi.org/10.3389/fpsyg.2018.01897
Nature Editorial. (2025, October 22). What makes PhD students happy? Good supervision Nature, 646, 775. https://doi.org/10.1038/d41586-025-03416-7
Pereira, M. G., Santos, M., Magalhães, R., Rodrigues, C., Araújo, O., & Durães, D. (2025). Burnout risk profiles in psychology students: An exploratory study with machine learning. Behavioral Sciences, 15(4), 505. https://doi.org/10.3390/bs15040505
Richetti, J. (2012). The value of the Festschrift: A dying genre? The Eighteenth Century, 53(2), 237–242. https://doi.org/10.1353/ECY.2012.0021
Rico, Y., & Bunge, E. L. (2021). Stress and burnout in psychology doctoral students. Psychology, Health & Medicine, 26(2), 177–183. https://doi.org/10.1080/13548506.2020.1842471
Wallace, J. B. (2026). Mattering: The secret to a life of deep connection and purpose Portfolio.
Weill Cornell Medicine. (2024, April 4). America’s loneliness epidemic: What is to be done? Weill Cornell Medicine. https://weillcornell.org/news/america’s-loneliness-epidemic-what-is-to-be-done
Woolston, C. (2019). A message for mentors from dissatisfied graduate students. Nature, 575(7783), 551–553.
for Steve | Hugues, Burton, Christy, Haas, Miller-Perrin, Moreno, Nofziger, Obenhaus, D.V. Rouse, S. Rouse, Williams, Jr., Wright, Cannon
Author Note.
Juan Carlos Hugues (They/all); https://orcid.org/0000-0003-4585-7481
This festschrift, or collection of celebratory essays, honors the life of Dr. Steven V. Rouse, after his premature passing on Thursday, February 5, 2026.
Author contribution statement: The first author conceptualized the festschrift and wrote the introduction and conclusion. The rest of the authors contributed to the writing, editing, and publishing of the essays within this article.
Acknowledgements: We would like to thank Kelle Marshall at Pepperdine University for the idea of writing a festschrift for
Steve and her academic literature on the “pedagogy of care.” We also extend our gratitude to Sofia Batziou at the University of Lausanne and Livia Sacchi at the Geneva School of Health Sciences for reading the first draft of this manuscript. We would also like to thank Robert R. Wright and Bradley Cannon, as well as the entire Editorial Board at the Psi Chi Journal of Psychological Research, for welcoming this project to honor Steve. Most importantly, we would like to thank Stacy, dominic, and Ian Rouse for giving us permission to write about Steve and to keep his legacy alive through these words. May Steve’s life and legacy never be forgotten.
Corresponding author: Correspondence regarding this article should be addressed to Juan Carlos Hugues. Email: jcmh1017@gmail.com
The Five Domains of Mindful Parenting and Parenting Stress in Mothers of Toddlers
Adriana
Janssen,1 Olivia Silke*1, Sanjana Pantsachiv2, Ilona S. Yim*1, and Jenna L. Riis*3,4
1Department of Psychological Science, University of California, Irvine
2Department of Cognitive Sciences, University of California, Irvine
3Institute for Interdisciplinary Salivary Bioscience Research, University of California, Irvine
4Department of Health and Kinesiology, University of Illinois Urbana Champaign
ABSTRACT. Parenting stress is related to negative health outcomes and may be high during toddlerhood due to unique challenges. Understanding factors associated with lower parenting stress could inform intervention design. Mindful parenting, presentcentered nonjudgmental attention to the parent–child context, is one factor that has been associated with lower parenting stress. Knowledge about the unique associations between each mindful parenting domain and parenting stress is limited. This study examined associations between the 5 domains of mindful parenting (Listening With Full Attention, Nonjudgmental Acceptance, Emotional Awareness, SelfRegulation, and Compassion for Self and Child) and parenting stress. Sociodemographic and psychosocial factors were selected as covariates because these have been associated with parenting stress levels in previous research. We hypothesized that all mindful parenting domains would be negatively associated with parenting stress and the association between parenting stress and Nonjudgmental Acceptance would be the strongest, in line with previous research. Mothers of toddlers ( N = 182; M age = 32.33, SD = 5.26) were recruited online and selfreported their mindful parenting and parenting stress levels. Separate multiple regression models indicated that each mindful parenting domain was negatively associated with parenting stress, after adjusting for covariates (range: bs = 6.68 to 9.33; SEs = 1.75 to 1.04; βs = .27 to .51; ts[177] = 4.06 to 8.42; ps < .001). When scores for all mindful parenting domains were modeled simultaneously, only Listening With Full Attention and Compassion for Self and Child remained associated with parenting stress, after adjusting for covariates (Listening With Full Attention: b = 6.48, SE = 1.20, β = .38, t[173] = 5.40, p < .001, 95% CI [8.85, 4.11]; Compassion for Self and Child: b = 4.84, SE = 1.64, β = .23, t[173] = 2.94, p = .004, 95% CI [8.08, 1.59]). The results suggest that active listening and compassion could be investigated as targets of stress management interventions for parents.
Parents of toddlers face unique but common parenting difficulties related to toddlerhood, like stubborn behaviors, tantrums, hitting, or biting (Andreadakis et al., 2020; Calkins, 2002), which may be related to experiences of stress (Luthar & Ciciolla, 2016). Daytoday demands that parents experience have been defined as parenting stress (Belsky, 1984;
Crnic & Booth, 1991), which has been associated with parental depressive symptoms, worsened child adjustment, and child behavioral problems (e.g., Jiang et al., 2023; Khalsa et al., 2022; Neece et al., 2012; Woodman et al., 2015). Stressful parenting experiences during early childhood may lead to greater “role overload”—when parenting demands exceed one’s
resources, such as juggling working outside the home with childcare needs (Goode, 1960). Given the unique challenges that parents of toddlers face, there is a need to study factors in the early parenting context that may be protective.
Not all parents of toddlers experience high levels of stress in the parenting context, and this may be because of protective factors, such as social support and maternal education level, which are known to buffer the impact of stress (Fang et al., 2024). One potential protective factor that is relevant to the present study is mindfulness, which has been described as purposeful “awareness of and attention to the present moment” (KabatZinn, 1990). Although general mindfulness relates to one’s internal experiences (i.e., intrapersonal mindfulness), interpersonal mindfulness relates to experiences between people (Duncan, 2023; Pratscher et al., 2018). Interpersonal mindfulness may be particularly important in the parent–child context, termed “mindful parenting.”
Mindful parenting—defined as presentcentered, compassionate, nonjudgmental attention in the parenting context—was first introduced by KabatZinn (1997). This original definition was later expanded by Duncan et al. (2009) to encapsulate five theorized domains: (a) “Listening With Full Attention,” defined as giving one’s entire attention to the child, including integrating nonverbal cues into parent–child communications; (b) “Nonjudgmental Acceptance of Self and Child,” defined as unconditional acceptance of good and bad experiences; (c) “Emotional Awareness of Self and Child,” defined as recognizing emotions as they arise without assigning good or bad labels; (d) “SelfRegulation in the Parenting Relationship,” defined as adaptive regulation of emotional reactivity; and (e) “Compassion for Self and Child,” defined as having empathy and kindness towards the child, even when parent–child experiences are frustrating, and holding a gentleness towards oneself when mistakes in parenting are made (Duncan et al., 2009).
The domains of mindful parenting are theorized to support positive parenting practices (Duncan et al., 2009), which can influence levels of parenting stress. For example, parents who report more emotional awareness and listening with full attention tend to be more in tune with their child’s needs (Duncan et al., 2009), and are less emotionally reactive when parenting challenges arise, which could reduce the intensity of parent–child conflict (Duncan et al., 2009). Having selfcompassion and compassion towards one’s child may promote internal processes that allow parents to appreciate their parenting efforts and avoid selfblame when mistakes are made (Duncan et al., 2009). With nonjudgmental acceptance, a parent may better understand the motivations behind their child’s behavior, and, as a result, be
more accepting of their mistakes (Duncan et al., 2009). Selfregulation involves maintaining balance in parenting situations so that parents can align their behaviors with their parenting values and goals, allowing parents to feel authentic in their parenting experience (Duncan et al., 2009). These internal and external components of mindful parenting domains may separately and jointly strengthen parent–child relationships and reduce the likelihood of parentingrelated stress.
The effects of mindful parenting on lowering parenting stress have been reported by mindful parenting intervention studies (Bögels et al., 2014; Burgdorf et al., 2019; PerezBlasco et al., 2013). Crosssectional correlational studies have also found associations between higher mindful parenting and lower parenting stress (e.g., Burgdorf & Szabó, 2021; Corthorn & Milicic, 2015). Most studies were conducted outside of the United States, including studies in Chile (Corthorn & Milicic, 2015), China (Lo et al., 2018), the Netherlands (Bögels et al., 2014), Spain (PerezBlasco et al., 2013), Australia (Beer et al., 2013; Burgdorf & Szabó, 2021), and Portugal (Gouveia et al., 2016). This is likely because the most commonly used scale for measuring mindful parenting was not validated in an Englishspeaking sample until 2021 (Burgdorf & Szabó, 2021). Mindful parenting and parenting stress have also been investigated among parents with neurodivergent children, as these parents are at risk for experiencing high levels of stress (e.g., Beer et al., 2013). Therefore, research on parents with healthy children and who live in the United States will help to progress this literature.
Furthermore, interpretations of most of this previous work are limited due to the use of simple bivariate correlations, which lack an adjustment for potentially meaningful covariates. For example, more depressive symptoms and less social support have been shown to be associated with more parenting stress (Cornish et al., 2006; Park & Lee, 2022). Studies which address this previous statistical limitation by including relevant covariates are needed because both contextual and sociodemographic factors, including socioeconomic (e.g., number of children, education level) and mental health status, are covariates of parenting stress (DeaterDeckard & Scarr, 1996; Nomaguchi & House, 2013; Östberg & Hagekull, 2013).
There is also a limited body of research that investigates the unique contributions of each mindful parenting domain on parenting stress, as most of the mindful parenting research has assessed mindful parenting using a total score (e.g., Gouveia et al., 2016). Of the studies that have looked at the individual domains of mindful parenting on parenting stress, some have examined individual mindful parenting domains
separately (e.g., Lo et al., 2018) and found each domain was negatively associated with parenting stress. Only a few studies have assessed a model which included all five of the mindful parenting domains together (e.g., Burgdorf & Szabó, 2021; Corthorn & Milicic, 2015). These studies were conducted outside of the United States (e.g., Australia and Chile) and with parents of typically developing children. Findings from these investigations suggest that, when modeled together, the subscale representing Nonjudgmental Acceptance has the strongest association with parenting stress (e.g., Burgdorf & Szabó, 2021; Corthorn & Milicic, 2015). These studies were conducted using translated versions of the Interpersonal Mindfulness in Parenting (IMP) scale (Duncan, 2023), and these translated versions have slight differences in how items are assigned to each mindful parenting subscale Therefore, more research is needed to address the statistical limitations of prior work by assessing the associations between and unique contributions of the individual domains of mindful parenting on parenting stress, using the original English language version of the IMP.
This study aimed to address current gaps in the literature, including a lack of research on parenting stress and mindful parenting among parents of toddlers in the United States. Moreover, we aimed to address previous modeling limitations found in most previous research studies (i.e., only two studies examined the individual domains of mindful parenting on parenting stress, adjusting for some covariates). These research efforts are important because they will progress this body of work, and findings could inform future intervention work. As such, we examined relations between scores on each mindful parenting subscale (taken from the IMP) and parenting stress, adjusting for maternal age, depressive symptoms, and social support. We hypothesized that all domains of mindful parenting would be negatively correlated with parenting stress in simple bivariate comparisons. In a model which included all mindful parenting subscales simultaneously, we predicted that Nonjudgmental Acceptance would be most strongly associated with parenting stress, based on previous findings (e.g., Corthorn & Milicic, 2015).
Method
Design and Procedures
This study was a crosssectional, online, surveybased study that used secondary data. Recruitment was conducted using Prolific, an online platform. Prolific is generally considered superior to other online recruiting platforms (e.g., Mechanical Turk) for academic research due to its higher data quality (Douglas et al., 2023). The study was advertised on Prolific from August 2022 to
January 2023 to likely eligible participants by setting qualifier filters that identified users who matched study eligibility criteria. Interested individuals first completed an online eligibility survey. Those who were eligible were provided with detailed information about the study, and then opted into the study by clicking “I consent, begin the study.” Those who agreed to continue with the study completed several online, selfreport surveys on Qualtrics (a survey hosting platform) assessing sociodemographic, health, and psychosocial factors. The study took, on average, approximately 24 minutes to complete, and participants received a $10 incentive. An administrative record (self determined exempt status) was filed with the Institutional Review Board of the University of California, Irvine, for this study, per university policy.
Data Quality Procedures and Assessments
As an attention check, CAPTCHA’s (Completely Automated Public Turing test to tell Computers and Humans Apart) were embedded throughout the survey. Participants with short survey completion times (1 SD below the mean), and/or extreme straightlining were flagged and removed in sensitivity analyses. No substantive changes to the main results were noted when these participants (n = 2) were removed; as such, they were included in all analyses.
Participants
The sample was comprised of healthy adult mothers (N = 182; Mage = 32.33, SD = 5.26) of healthy toddlers (12–36 months; n = 14 had a child 37–42 months due to an error in data collection). There were no missing data; therefore, the final analytic sample was 182. Mothers of toddlers were eligible if they were at least 18 years old, fluent in English, living in the United States, and the biological mother of a toddler. Nonbiological mothers, such as adoptive mothers, were ineligible because they may experience unique parenting stressors that could potentially confound the relations of interest. Mothers were excluded if they reported any major health problems (e.g., multiple sclerosis, heart failure) or serious mental health disorders that affected daily functioning, or if their toddler had any major health or developmental problems. Most participants identified as White (78.57%, n = 143) and nearly all (93.41%, n = 170) identified as NonHispanic/Latina. On average, mothers were 32.33 (SD = 5.26) years old, and 30.37% of mothers (n = 56) had a family income below $50,000. Most mothers had a college degree (61.54%, n = 112). Mothers’ average number of living children was 2.08 (SD = 1.26), with an average toddler age of 23.42 months. Most mothers (40.11%, n = 73) indicated they worked full time, followed by 33.52% (n = 61) who indicated their occupation was keeping the
house/raising children full time. Among participants with a weekly meditation practice (n = 23), the median meditation time was 70 minutes per week (SD = 144.49).
Power
Given that secondary data were used for the present study, a power analysis was not conducted for these analyses. However, the sample size was previously determined by an a priori power analysis, which was conducted prior to recruitment for the primary study aims (Silke, 2024), which are outside the scope of this paper.
Measures
Mindful Parenting
The English version of the Interpersonal Mindfulness in Parenting scale (IM P; Duncan, 2023) was used to assess mindful parenting. The IM P is a 31 item scale that was revised from the original 10 item scale (Duncan, 2007). The IM P measures daily interpersonal interactions among parents and their children (e.g., “I am aware of how my moods affect the way I treat my child”). Five subscales of mindful parenting, using Duncan et al.’s (2009) theoretical organization, were rated on a scale of 1 (never true) to 5 (always true). These five subscales were: Listening With Full Attention, Nonjudgmental Acceptance of Self and Child, Emotional Awareness of Self and Child, SelfRegulation in the Parenting Relationship, and Compassion for Self and Child. Total scores can be computed from the IMP but were not used in the present study. Fourteen items were reversecoded, and subscale scores were calculated as means, with higher scores indicating higher of that mindful parenting domain. The IMP and its subscales have demonstrated adequate reliability among female Englishspeaking samples, in previous research (i.e., internal consistency measured by Cronbach’s α = .77–.87; Burgdorf & Szabó, 2021). The subscale reliability (measured by Cronbach’s alpha) in the present study ranged from .52 to .86. The convergent and discriminant validity of the 31 item Englishversion of IMP has not been established in a sample of mothers. However, the 10item IMP scale showed good construct validity across interpersonal and parenting measures (Duncan, 2007) and translated versions have also showed good construct validity (see Duncan, 2023).
General Mindfulness
The Mindful Attention and Awareness Scale (MAAS; Brown & Ryan, 2003) is the standard measure of general mindful disposition (Brown & Ryan, 2003). The MAAS is a 15item assessment which rates items on a 6point scale ranging from 1 (almost always) to 6 (almost never).
The MAAS total score was computed by finding the mean of all items, with higher scores reflecting higher levels of general mindfulness. The MAAS has previously demonstrated good reliability (i.e., internal consistency measured by Cronbach’s alpha) in previous research (α = .80–.87; Brown & Ryan, 2003) and in the current sample (α = .92). The MAAS has also shown good convergent and discriminant validity (Brown & Ryan, 2003).
Parenting Stress
The Parental Stress Scale (PSS; Berry & Jones, 1995) is an 18item scale that measures parent’s perceptions of challenging parenting experiences (e.g., “I feel overwhelmed by the responsibility of being a parent”). Participants answered the degree to which they agreed or disagreed with each item on a scale from 1 (strongly disagree) to 5 (strongly agree). Eight items were reversecoded, and scores were summed to create a total score indexing parenting stress. Higher scores on the PSS indicate higher parental stress. The PSS has demonstrated good reliability (i.e., internal consistency measured by Cronbach’s alpha) in previous research (α = .83; (Berry & Jones, 1995) and the current sample (α = .91). The PSS has also shown good convergent and discriminant validity (Berry & Jones, 1995).
Covariates
Sociodemographic factors were examined as potential covariates of parenting stress and mindful parenting, as previous research has indicated these covariates may be related to parenting stress or may vary by parenting stress levels (e.g., DeaterDeckard & Scarr, 1996; Nomaguchi & House, 2013; Östberg & Hagekull, 2013). The covariates considered were the number of children, education level, marital status, employment, race and ethnicity, annual household income, and age. All responses—except for the response relating to the number of children, which was entered manually by participants—were presented as a dropdown menu with different answer options. Categories for covariate measures are listed in Table 1. Contemplative practice may influence one’s level of mindfulness and subsequently their selfreported ratings of mindful parenting (Burgdorf & Szabó, 2021; Pratscher et al., 2019). Hence, contemplative experience, including experience with yoga, martial arts, prayer, and/or meditation (coded as 0 = none to 3 = quite a bit), and current minutes of meditation practiced per week were examined as possible covariates.
Psychosocial factors, such as depressive symptoms and social support, have been previously associated with parenting stress (Cornish et al., 2006; Park & Lee, 2022) and were therefore, assessed as covariates. Depressive symptoms (measured as a continuous variable) were
measured using the 20item Center for Epidemiologic Studies Depression Scale (CESD; Radloff, 1997). Items were scored on a 4point scale ranging from 0 (rarely or none of the time) to 3 (most or all of the time). Item responses were summed into a total score, with higher scores representing more depressive symptoms. A continuous score for the CESD was used in all analyses. A score of >16 indicated likely depression (range: 0–60; Lewinsohn et al., 1997), but this binary score was only used for descriptive purposes. The CESD scale has demonstrated good reliability (i.e., internal consistency measured by Cronbach’s alpha) in previous research (α = .85–.90; Radloff, 1997) and in the current sample (α = .94). The CESD has also shown excellent concurrent validity and good discriminant validity (Radloff, 1997). Social support was measured using the 8item Functional Social Support Questionnaire (FSSQ; Broadhead et al., 1988). Items were scored on a 5point scale ranging from 1 ( much less than I would like ) to 5 ( as much as I would like ). Item responses were summed into a total score, with higher scores indicating greater social support. FSSQ has demonstrated good reliability (i.e., internal consistency measured by Cronbach’s alpha) in previous research (α = .91; Epino et al., 2012) and the current sample (α = .92). The FSSQ has also shown good concurrent and discriminant validity (Broadhead et al., 1988).
Analytic Plan
Preliminary Analyses
All statistical analyses were conducted using SPSS (Version: 29.0.0.0) and Stata/SE 15.1 (StataCorp LP). Descriptive statistics, normality statistics (skewness and kurtosis), and histograms were examined for all study variables. Variables were considered not normally distributed by using cutoffs of |1| for skewness and |4| for kurtosis, or if their histogram appeared to not follow a normal curve. Z scores were generated from the IMP subscales to determine whether there were any extreme values (i.e., ≥ 3 SD from the mean).
Using an alphalevel of .05, covariates of parenting stress were examined using parametric and nonparametric bivariate tests (Pearson’s and Spearman’s correlations, Kendall’s taub, and oneway ANOVAs) depending on whether scores were normally distributed. Variables showing statistically significant associations with parenting stress were included in adjusted regression models. Spearman’s rho correlational tests were conducted between MAAS total scores and the five mindful parenting subscales with the expectation that the mindful parenting subscale scores would be positively associated with MAAS scores. These correlational tests were conducted as a measure of internal validity to demonstrate
that the IMP subscale scores were conceptually and statistically related to a known measure of mindfulness.
Hypothesis Testing
Five simple linear regression models were conducted
Race (N [%])
White/European American 143 (78.57)
Black/African American 20 (10.99)
Asian/Pacific Islander 8 (4.40)
Native American/Alaskan Native 2 (1.10)
Other/More than one 9 (4.95)
Ethnicity (N [%])
Hispanic/Latina 12 (6.59)
Non-Hispanic/non-Latina 170 (93.41)
Annual family income (N [%]) ≤ $24,999 16 (8.79)
$25,000–$49,999 40 (21.98)
$50,000–$74,999
$75,000
Education level (N [%]) ≤ High school degree 25 (13.74)
Functional Social Support (FSSQ; M [SD])D 26.4 (8.32)
Note AN = 12 had more than one child (not limited to toddlers), for which a mean age was used. BMeditation practice is reported only for those with a weekly meditation practice (N = 23). CCES-D cut-off: >16 cutoff for likely depression. The CES-D binary variable is shown only for demonstrative purposes. DMean FSSQ sum score presented; range = 8-40; higher score indicates higher social support.
Mindful Parenting and Parenting Stress in Mothers of Toddlers | Janssen, Silke, Pantsachiv, Yim, and Riis
to assess associations between scores on each of the five mindful parenting subscale scores (explanatory variables) and parenting stress (outcome variable) separately. Then, covariates were added to these five models to clarify the relations between each mindful parenting domain and parenting stress levels. Next, a final multivariable linear regression model was conducted with parenting stress levels as the outcome variable and all five mindful parenting subscale scores, included simultaneously as explanatory variables, along with relevant covariates. This final model assessed the unique contributions and strength of each mindful parenting subscale score on parenting stress, after adjusting for covariates. Assumption checks (e.g., variance inflation factor, global and local influence [≥ |1| DFFITTS DFBETA], normality of residuals [QQ plots and ≥ |3| standardized residuals], etc.) were conducted for all models to assess whether statistical assumptions were met, and the results were robust to the removal of influential participants.
TABLE 2
Descriptive Statistics for Responses on the Interpersonal Mindfulness in Parenting (IM-P) Scale Among a Sample of Healthy Mothers of Toddlers (N = 182)
Results
Preliminary Analyses
Participant characteristics are reported in Table 1. IMP subscale scores, measures of central tendency, and internal consistency statistics are presented in Table 2. General mindful disposition scores (assessed with the MAAS) were significantly positively associated with each IMP subscale scores (see Table 3).
Model Assumptions and Diagnostics
Assumptions and diagnostics assessments for all adjusted models revealed that three participants had high standardized residuals, and no other assumptions were
TABLE 4
Adjusted Relations Between Scores From Listening With Full Attention and Parenting Stress Measures Among a Sample of
Note. Depressive symptoms were measured as a continuous variable using the
TABLE 3
Spearman’s Rho Correlations Between Interpersonal Mindfulness in Parenting (IM-P) Subscale Scores and General Mindfulness Scores Assessed via the Mindful Attention Awareness Scale Among a Sample of Healthy Mothers of Toddlers (N
4.
5.
6.
Note * p < .01.
TABLE 5
Adjusted Relations Between Scores From Nonjudgmental Acceptance and Parenting Stress Measures Among a Sample of Healthy Mothers of Toddlers (N = 182)
R2 = .36 RADJ2 = .34 F(4, 177) = 24.73
Note. Depressive symptoms were measured as a continuous variable using the Center for Epidemiologic Studies Depression Scale and social support was measured using the Functional Social Support Questionnaire. Model results were derived from a multiple linear regression.
* p < .01. ** p < .001.
Mindful Parenting and Parenting Stress in Mothers of Toddlers | Janssen, Silke, Pantsachiv, Yim, and Riis
violated. The level of statistical significance of the effect of IMP subscale scores on parenting stress remained when excluding these participants from the models. Therefore, they were included in the analyses reported here.
Covariates
Greater depressive symptoms (τb = .33, p < .001) and lower social support, r(180) = .30, p < .001, were associated with higher parenting stress levels. Higher maternal age was associated with higher scores on the Compassion for Self and Child subscale, r(180) = .17, p = .03, and marginally higher scores on the Listening With Full Attention subscale, r(180) = .13, p = .08. No other statistically significant associations were found between the potential covariates and parenting stress or mindful parenting subscale scores. As a result, maternal age, depressive symptoms, and social support were included as covariates in adjusted models.
Hypothesis Testing
The results from the five unadjusted regression models showed that scores on all subscales of mindful parenting were negatively associated with parenting stress levels, with mindful parenting subscales scores accounting for 10% to 35% of the variation in parenting stress levels (Listening With Full Attention: R2 = .35, F[1, 180] = 97.58, p < .001; Nonjudgmental Acceptance: R2 = .27, F[1, 180] = 66.06, p < .001; Emotional Awareness: R2 = .10, F[1, 180] = 20.52, p < .001; SelfRegulation: R2 = .22, F[1, 180] = 50.26, p < .001; Compassion for Self and Child: R2 = .30, F[1, 180] = 77.96, p < .001). These five subscale scores remained associated with parenting stress after adjusting for maternal age, depressive symptoms, and social support, with each accounting for between 26% to 43% of the overall variation in parenting stress levels (all ps < .001; see Tables 4–8).
When all five mindful parenting subscale scores were included as explanatory variables in a single adjusted linear regression model with covariates, only the Listening With Full Attention and Compassion for Self and Child subscale scores remained associated with parenting stress (see Table 9). Specifically, for every one standardized unit increase in either Listening With Full Attention or Compassion for Self and Child scores, there was a predicted 6.29 and 5.01 standardized unit decrease in parenting stress, respectively (see Table 9). The Listening With Full Attention subscale was most strongly related to parenting stress compared to the other mindful parenting subscale scores (Listening With Full Attention: ηp2 = .14; range of ηp2 for all other subscales: .00 to .05).
Discussion
This study examined associations between the five subscales of mindful parenting (Listening With Full Attention, Nonjudgmental Acceptance, Emotional Awareness, SelfRegulation, and Compassion for Self and Child) and parenting stress. As hypothesized, higher scores on each of the five subscales of mindful parenting were associated with less parenting stress when modeled individually. However, contrary to the hypotheses, when associations between all mindful parenting subscale scores and parenting stress were modeled simultaneously, only Listening With Full Attention and Compassion for Self and Child remained
TABLE 6
Adjusted Relations Between Scores From Emotional
and Parenting Stress Measures Among
Note. Depressive symptoms were measured as a continuous variable using the Center for Epidemiologic Studies Depression Scale and
results were derived from a multiple linear regression.
p < .001.
TABLE 7
Adjusted Relations Between Scores From Self-Regulation and Parenting Stress Measures Among a Sample of Healthy Mothers of Toddlers (N = 182)
R2 = .33 RADJ2 = .31
F(4, 177) = 21.42
Note. Depressive symptoms were measured as a continuous variable using the Center for Epidemiologic Studies Depression Scale and social support was measured using the Functional Social Support Questionnaire. Model results were derived from a multiple linear regression.
* p < .01. ** p < .001.
Mindful Parenting and Parenting Stress in Mothers of Toddlers | Janssen, Silke, Pantsachiv, Yim, and Riis
negatively associated with parenting stress levels, and the Listening With Full Attention subscale was most strongly related to parenting stress. This is one of few studies to investigate the unique contributions of each of the mindful parenting domains on parenting stress and is, to the best of our knowledge, the only one to do so with a sample of mothers from the United States.
The present findings, which showed negative associations between the mindful parenting domains and parenting stress, are consistent with previous research on mindful parenting interventions, which have reported negative associations between total scores of mindful parenting and parenting stress levels (e.g., Beer et al., 2013; Corthorn & Milicic, 2015). Our findings also corroborate research that has reported separate negative associations between each individual domain of mindful parenting and parenting stress (e.g., Burgdorf & Szabó, 2021; Corthorn & Milicic, 2015). The similarities between our findings and what has previously been reported is important because the negative associations between the individual mindful parenting domains and parenting stress have been found even among studies using translated versions of the IMP scale and various IMP subscale organizations (e.g., Corthorn & Milicic, 2015; Kim et al., 2019). To advance this research, we also investigated a regression model where all mindful parenting domains were entered into the model simultaneously.
We found that Listening With Full Attention and Compassion for Self and Child were the only mindful parenting domains that were negatively associated with parenting stress levels when all domains were modeled together, with the strongest association found for the Listening With Full Attention domain. Unlike our findings, other studies have reported that only subscales related to nonjudgmental acceptance and/or compassion were negatively associated with parenting stress (e.g., Burgdorf & Szabó, 2021; Corthorn & Milicic, 2015). Some possible explanations for these discrepancies may be due to differences in: the scales used to measure parenting stress, the cultural context across studies, and the organization of items that were assigned to each subscale as a result of factor analyses (Burgdorf & Szabó, 2021; Corthorn & Milicic, 2015). Specifically, some studies have suggested that parentrelated and childrelated items load onto different subscales (see summary in Duncan, 2023), and this differs from the theoretical organization that was used in this study.
Empirical and theoretical work may provide insight into why listening with one’s full attention may be related to lower parenting stress levels. One aspect of listening with full attention is a parent’s momenttomoment ability to notice and discern verbal/nonverbal cues from their children (Duncan et al., 2009). Parents who engage in active listening may have an enhanced ability to conceptualize
their child as an individual with independent viewpoints and may likely have fewer misinterpretations of their child’s behavioral cues (i.e., attuned mindmindedness), as was noted in Potharst et al. (2021). Having attuned mindmindedness could facilitate maternalchild attachment (Zeegers et al., 2017), which may reduce perceptions of parenting stress (Dai et al., 2019).
Additionally, findings from Potharst et al. (2021)
TABLE 8
Adjusted Relations Between Scores From Compassion and Parenting Stress Measures Among a Sample of Healthy Mothers of Toddlers (
Note. Depressive symptoms were measured as a continuous variable using the Center for Epidemiologic Studies Depression Scale and social support was measured using the Functional Social Support Questionnaire. Model results were derived from a multiple linear regression.
* p < .001.
TABLE 9
Adjusted Relations Between Scores From All Five Domains of Mindful Parenting and Parenting Stress Among Healthy Mothers of Toddlers (
Note. Depressive symptoms were measured as a continuous variable using the Center for Epidemiologic Studies Depression Scale and social support was measured using the Functional Social Support Questionnaire. Model results were derived from a multiple linear regression.
* p < .05. ** p < .01. *** p < .001.
Mindful Parenting and Parenting Stress in Mothers of Toddlers | Janssen, Silke, Pantsachiv, Yim, and Riis
indicated that the Compassion for Child subscale (which excluded items about compassion for self), but not the Listening With Full Attention subscale, was positively associated with maternal sensitivity (Potharst et al., 2021). Cultivating compassion in the parent–child relationship could indicate that parents have a greater propensity for feeling less guilt when parenting mistakes are made (Duncan et al., 2009). In fact, greater selfcompassion has been related to lower perceptions of guilt and shame towards difficult parenting events and lower guilt about parenting has been associated with lower stress (Sirois et al., 2019). This reduction in guilt and stress may be because selfcompassion helps parents accept their parenting approaches while leaning away from expectations of “perfect” parenting. Having compassion for one’s child may also have implications for parenting styles. In one study, “compassionate love” towards the child was associated with less harsh parenting and even buffered against harsh parenting, especially among mothers who experienced challenging interactions with their child, as measured by indicators of stress physiology (Miller et al., 2015).
This study is not without limitations. First, the sample was primarily comprised of mothers who were White, with higher income, who had a college degree, and who were recruited from Prolific (see details in Silke et al. [under review]). As such, results may not be generalizable to more diverse populations who may experience limited resources and higher levels of parenting stress (e.g., Cassells & Evans, 2017; Nam et al., 2015). Second, causality and directionality cannot be inferred because this study used a crosssectional design. Third, some IMP subscales had low internal consistency, and this could impact the study’s internal validity. A fourth limitation is that our measure of mindful parenting was selfreported which could lend itself to social desirability bias, as parents may underreport undesirable parenting behaviors (Morsbach & Prinz, 2006; Waylen et al., 2008). Fifth, some participants (12.6%; n = 23) indicated they had a regular meditation practice, and this could be a confound. Although we found no association between parenting stress and meditation practice status, it is possible that we did not have the power to detect such an effect. Lastly, we limited our recruitment to mothers with biological toddlers which also decreases our ability to generalize the findings to stepmothers, adoptive mothers, and mothers with nonbiological children.
The study also includes some strengths. Mothers were recruited from across the United States, as opposed to only sampling in a single community or among university students, which better represents the general characteristics of the population. Another strength was the inclusion of a parentingspecific measure of stress, instead of general stress, which has been shown
to be more strongly associated with mindful parenting (e.g., Corthorn & Milicic, 2015; Fernandes et al., 2021). Additional strengths have been described in Silke et al. (under review).
Future Directions
Our findings lend themselves to several promising future directions. First, this research would benefit from expanding sampling efforts to include fathers, as this would allow for the examination of possible differences in the association between mindful parenting and parenting stress by gender. Second, it would be important to assess the implications of the associations found in the present study on child developmental outcomes (e.g., Mera et al., 2023). Finally, studies that investigate longitudinal parental outcomes or specifically sample highly stressed parents, such as those caring for children with disabilities (Theule et al., 2013), would meaningfully progress the current literature.
Implications
Understanding the unique domains of mindful parenting that are associated with lower levels of parenting stress advances the current research by providing a more nuanced look at the specific mindfulness skills that may help with lowering parenting stress. Additionally, investigating the specific subscales of mindful parenting as opposed to a total score may be informative for intervention development for parents of young children. Such interventions could be tailored to have a specific focus on teaching parents active listening skills and how to cultivate compassion in the parenting context. More research is needed to uncover whether specific domains of mindful parenting serve as “active ingredients” in interventions that aim to lower parenting stress.
Conclusion
The meaningfulness of these results, such as the potential longterm impacts of mindful parenting, the differences between mothers and fathers, and the implications for child health and development, cannot be ascertained in the present analysis but provide several avenues for the future of this work. In closing, examining the specific domains of mindful parenting, as opposed to a total score, may provide a more nuanced understanding of the specific interpersonal factors that may be associated with lower levels of parentingrelated stress.
References
Andreadakis, E., Laurin, J. C., Joussemet, M., & Mageau, G. A. (2020). Toddler temperament, parent stress, and autonomy support. Journal of Child and Family Studies, 29(11), 3029–3043. https://doi.org/10.1007/s10826-020-01793-3
Beer, M., Ward, L., & Moar, K. (2013). The relationship between mindful parenting and distress in parents of children with an autism spectrum disorder. Mindfulness, 4(2), 102–112. https://doi.org/10.1007/s12671-012-0192-4
SUMMER 2026
PSI CHI JOURNAL OF PSYCHOLOGICAL RESEARCH
Mindful Parenting and Parenting Stress in Mothers of Toddlers | Janssen, Silke, Pantsachiv, Yim, and Riis
Belsky, J. (1984). The determinants of parenting: A process model. Child Development, 55(1), 83–96. https://doi.org/10.2307/1129836
Berry, J. O., & Jones, W. H. (1995). The Parental Stress Scale: Initial psychometric evidence. Journal of Social and Personal Relationships, 12(3), 463–472. https://doi.org/10.1177/0265407595123009
Bögels, S. M., Hellemans, J., van Deursen, S., Römer, M., & van der Meulen, R. (2014). Mindful parenting in mental health care: Effects on parental and child psychopathology, parental stress, parenting, co-parenting, and marital functioning. Mindfulness, 5(5), 536–551. https://doi.org/10.1007/s12671-013-0209-7
Broadhead, W. E., Gehlbach, S. H., De Gruy, F. V., & Kaplan, B. H. (1988). The Duke-UNC Functional Social Support Questionnaire measurement of social support in family medicine patients. Medical Care, 26(7), 709–723. https://doi.org/10.1097/00005650-198807000-00006
Brown, K. W., & Ryan, R. M. (2003). The benefits of being present: Mindfulness and its role in psychological well-being. Journal of Personality and Social Psychology, 84(4), 822–848. https://doi.org/10.1037/0022-3514.84.4.822
Burgdorf, V., Szabó, M., & Abbott, M. J. (2019). The effect of mindfulness interventions for parents on parenting stress and youth psychological outcomes: A systematic review and meta-analysis. Frontiers in Psychology, 10. https://doi.org/10.3389/fpsyg.2019.01336
Burgdorf, V., & Szabó, M. (2021). The Interpersonal Mindfulness in Parenting scale in mothers of children and infants: Factor structure and associations with child internalizing problems. Frontiers in Psychology, 11. https://doi.org/10.3389/fpsyg.2020.633709
Calkins, S. D. (2002). Does aversive behavior during toddlerhood matter? The effects of difficult temperament on maternal perceptions and behavior. Infant Mental Health Journal, 23(4), 381–402. https://doi.org/10.1002/imhj.10024
Cassells, R. C., & Evans, G. W. (2017). Ethnic variation in poverty and parenting stress. In K. Deater-Deckard & R. Panneton (Eds.), Parental stress and early child development: Adaptive and maladaptive outcomes (pp. 15–45). https://doi.org/10.1007/978-3-319-55376-4_2
Cornish, A. M., McMahon, C., Ungerer, J. A., Barnett, B., Kowalenko, N., & Tennant, C. (2006). Maternal depression and the experience of parenting in the second postnatal year. Journal of Reproductive and Infant Psychology, 24(2), 121–132. https://doi.org/10.1080/02646830600644021
Corthorn, C., & Milicic, N. (2015). Mindfulness and parenting: A correlational study of non-meditating mothers of preschool children. Journal of Child and Family Studies, 25(5), 1672–1683. https://doi.org/10.1007/s10826-015-0319-z
Crnic, K. A., & Booth, C. L. (1991). Mothers’ and fathers’ perceptions of daily hassles of parenting across early childhood. Journal of Marriage and Family, 53(4), 1042–1050. https://www.jstor.org/stable/353007
Dai, Q., Lim, A. K., & Xu, Q. J. (2019). The relations between maternal mindmindedness, parenting stress and obstetric history among Chinese mothers. Early Child Development and Care, 189(9), 1411–1424. https://doi.org/10.1080/03004430.2017.1385608
Deater-Deckard, K., & Scarr, S. (1996). Parenting stress among dual-earner mothers and fathers: Are there gender differences? Journal of Family Psychology, 10(1), 45–59. https://doi.org/10.1037//0893-3200.10.1.45
Douglas, B. D., Ewell, P. J., & Brauer, M. (2023). Data quality in online human-subjects research: Comparisons between MTurk, Prolific, CloudResearch, Qualtrics, and SONA. PLOS ONE, 18(3). https://doi.org/10.1371/journal.pone.0279720
Duncan, L. G. (2023). Interpersonal Mindfulness in Parenting (IM-P) scale. In O. N. Medvedev, C. U. Krägeloh, R. J. Siegert, & N. N. Singh (Eds.), Handbook of assessment in mindfulness research (pp. 1–25). https://doi.org/10.1007/978-3-030-77644-2_30-1
Duncan, L. G. (2007). Assessment of mindful parenting among families of early adolescents: Development and validation of the Interpersonal Mindfulness in Parenting scale. Unpublished Dissertation, Pennsylvania State University, University Park, PA.
Duncan, L. G., Coatsworth, J. D., & Greenberg, M. T. (2009). A model of mindful parenting: Implications for parent–child relationships and prevention research. Clinical Child and Family Psychology Review, 12(3), 255–270. https://doi.org/10.1007/s10567-009-0046-3
Epino, H. M., Rich, M. L., Kaigamba, F., Hakizamungu, M., Socci, A. R., Bagiruwigize, E., & Franke, M. F. (2012). Reliability and construct validity of three health-related selfreport scales in HIV-positive adults in rural Rwanda. AIDS Care, 24(12), 1576–1583. https://doi.org/10.1080/09540121.2012.661840
Fang, Y., Luo, J., Boele, M., Windhorst, D., van Grieken, A., & Raat, H. (2024). Parent, child, and situational factors associated with parenting stress: A systematic review. European Child & Adolescent Psychiatry Child, 33, 1687–1705. https://doi.org/10.1007/s00787-022-02027-1
Fernandes, D. V., Canavarro, M. C., & Moreira, H. (2021). The mediating role of parenting stress in the relationship between anxious and depressive symptomatology, mothers’ perception of infant temperament, and mindful parenting during the postpartum period. Mindfulness, 12(2), 275–290. https://doi.org/10.1007/s12671-020-01327-4
Goode, W. J. (1960). A theory of role strain. American Sociological Review, 25(4), 483. https://doi.org/10.2307/2092933
Gouveia, M. J., Carona, C., Canavarro, M. C., & Moreira, H. (2016). Self-compassion and dispositional mindfulness are associated with parenting styles and parenting stress: The mediating role of mindful parenting. Mindfulness, 7(3), 700–712. https://doi.org/10.1007/s12671-016-0507-y
Jiang, Q., Wang, D., Yang, Z., & Choi, K. (2023). Bidirectional relationships between parenting stress and child behavior problems in multi-stressed, single-mother families: A cross-lagged panel model. Family Process, 62(2), 671. https://doi.org/10.1111/famp.12796
Khalsa, A. S., Weber, Z. A., Zvara, B. J., Keim, S. A., Andridge, R., & Anderson, S. E. (2022). Factors associated with parenting stress in parents of 18-monthold children: Parenting stress in parents of toddlers. Child: Care, Health and Development, 48(4), 521–530. https://doi.org/10.1111/cch.12954
Kim, E., Krägeloh, C. U., Medvedev, O. N., Duncan, L. G., & Singh, N. N. (2019). Interpersonal Mindfulness in Parenting scale: Testing the psychometric properties of a Korean version. Mindfulness, 10(3), 516–528. https://doi.org/10.1007/s12671-018-0993-1
Kabat-Zinn, J. (1990). Full catastrophe living: Using the wisdom of your mind to face stress, pain and illness. Dell Publishing.
Kabat-Zinn, M., & Kabat-Zinn, J. (1997). Everyday blessings: The inner work of mindful parenting. Hyperion.
Lo, H. H. M., Yeung, J. W. K., Duncan, L. G., Ma, Y., Siu, A. F. Y., Chan, S. K. C., Choi, C. W., Szeto, M. P., Chow, K. K. W., & Ng, S. M. (2018). Validating of the Interpersonal Mindfulness in Parenting scale in Hong Kong Chinese. Mindfulness, 9(5), 1390–1401. https://doi.org/10.1007/s12671-017-0879-7
Lewinsohn, P. M., Seeley, J. R., Roberts, R. E., & Allen, N. B. (1997). Center for Epidemiologic Studies Depression Scale (CES-D) as a screening instrument for depression among community-residing older adults. Psychology and Aging, 12(2), 277–287. https://doi.org/10.1037/0882-7974.12.2.277
Luthar, S. S., & Ciciolla, L. (2016). What it feels like to be a mother: Variations by children’s developmental stages. Developmental Psychology, 52(1), 143–154. https://doi.org/10.1037/dev0000062
Mera, S., Zimmer-Gembeck, M. J., & Conlon, E. G. (2023). Emerging adults’ experience of mindful parenting: Distinct associations with their dispositional and interpersonal mindfulness, self-compassion, and adjustment. Emerging Adulthood, 11(5), 1180–1195. https://doi.org/10.1177/21676968231185888
Miller, J. G., Kahle, S., Lopez, M., & Hastings, P. D. (2015). Compassionate love buffers stress-reactive mothers from fight-or-flight parenting. Developmental Psychology, 51(1), 36–43. https://doi.org/10.1037/a0038236
Morsbach, S. K., & Prinz, R. J. (2006). Understanding and improving the validity of self-report of parenting. Clinical Child and Family Psychology Review, 9(1), 1–21. https://doi.org/10.1007/s10567-006-0001-5
Nam, Y., Wikoff, N., & Sherraden, M. (2015). Racial and ethnic differences in parenting stress: Evidence from a statewide sample of new mothers. Journal of Child and Family Studies, 24(2), 278–288. https://doi.org/10.1007/s10826-013-9833-z
Neece, C. L., Green, S. A., & Baker, B. L. (2012). Parenting stress and child behavior problems: A transactional relationship across time. American Journal on Intellectual and Developmental Disabilities, 117(1), 48–66. https://doi.org/10.1352/1944-7558-117.1.48
Nomaguchi, K., & House, A. N. (2013). Racial-ethnic disparities in maternal parenting stress: The role of structural disadvantages and parenting values. Journal of Health and Social Behavior, 54(3), 386–404. https://doi.org/10.1177/0022146513498511
Östberg, M., & Hagekull, B. (2013). Parenting stress and external stressors as predictors of maternal ratings of child adjustment. Scandinavian Journal of Psychology, 54(3), 213–221. https://doi.org/10.1111/sjop.12045
Park, G. A., & Lee, O. N. (2022). The moderating effect of social support on parental stress and depression in mothers of children with disabilities. Occupational Therapy International, 2022(1). https://doi.org/10.1155/2022/5162954
Perez-Blasco, J., Viguer, P., & Rodrigo, M. F. (2013). Effects of a mindfulness-based intervention on psychological distress, well-being, and maternal self-efficacy in breast-feeding mothers: Results of a pilot study. Archives of Women’s Mental Health, 16(3), 227–236. https://doi.org/10.1007/s00737-013-0337-z
SUMMER 2026
PSI CHI JOURNAL OF PSYCHOLOGICAL RESEARCH
Potharst, E. S., Leyland, A., Colonnesi, C., Veringa, I. K., Salvadori, E. A., Jakschik, M., Bögels, S. M., & Zeegers, M. A. J. (2021). Does mothers’ self-reported mindful parenting relate to the observed quality of parenting behavior and mother-child interaction? Mindfulness, 12(2), 344–356. https://doi.org/10.1007/S12671-020-01533-0/TABLES/3?
Pratscher, S. D., Rose, A. J., Markovitz, L., & Bettencourt, A. (2018). Interpersonal mindfulness: Investigating mindfulness in interpersonal interactions, co-rumination, and friendship quality. Mindfulness, 9(4), 1206–1215. https://doi.org/10.1007/s12671-017-0859-y
Pratscher, S. D., Wood, P. K., King, L. A., & Bettencourt, B. A. (2019). Interpersonal Mindfulness: Scale development and initial construct validation. Mindfulness, 10(6), 1044–1061. https://doi.org/10.1007/s12671-018-1057-2
Radloff, L. S. (1977). The CES-D scale: A self-report depression scale for research in the general population. Applied psychological measurement, 1(3), 385–401. https://doi.org/10.1177/01466216770100306
Silke, O. (2024). Interpersonal factors in parenting: Implications for parental well-being and parent–child synchrony [Doctoral dissertation, University of California, Irvine]. UC Irvine Electronic Theses and Dissertations. https://escholarship.org/uc/item/88x487m7
Sirois, F. M., Bögels, S., & Emerson, L.M. (2019). Self-compassion improves parental well-being in response to challenging parenting events. Journal of Psychology, 153(3), 327–341. https://doi.org/10.1080/00223980.2018.1523123
Theule, J., Wiener, J., Tannock, R., & Jenkins, J. M. (2013). Parenting stress in families of children with ADHD: A meta-analysis. Journal of emotional and behavioral disorders, 21(1), 3–17.
Waylen, A., Stallard, N., & Stewart-Brown, S. (2008). Parenting and health in mid-childhood: A longitudinal study. European Journal of Public Health, 18(3), 300–305. https://doi.org/10.1093/EURPUB/CKM131
Woodman, A. C., Mawdsley, H. P., & Hauser-Cram, P. (2015). Parenting stress and child behavior problems within families of children with developmental
disabilities: Transactional relations across 15 years. Research in Developmental Disabilities, 36, 264–276. https://doi.org/10.1016/j.ridd.2014.10.011
Zeegers, M. A. J., Colonnesi, C., Stams, G.-J. J. M., & Meins, E. (2017). Mind matters: A meta-analysis on parental mentalization and sensitivity as predictors of infant–parent attachment. Psychological Bulletin, 143(12), 1245–1272. https://doi.org/10.1037/bul0000114
We have no known conflicts of interest to disclose. The authors would like to thank the mothers who participated in this study. Financial support was provided by Psi Chi’s Summer 2022 Graduate Research Grant, through internal faculty research funds of the Psychological Science Department at the University of California, Irvine, and research funds from the Department of Education’s Graduate Assistance in Areas of National Need (GAANN) Fellowship program. Graduate student support for Olivia Silke was provided by the United States’ National Science Foundation’s Graduate Research Fellowship Program and the Department of Education’s GAANN fellowship.
Olivia Silke played a lead role in research design and data collection. Olivia and Adriana Janssen played a lead role in conceptualization, and together with Sanjana Pantsachiv, played a lead role in data analysis and interpretation, original writing, and editorial assistance. Ilona S. Yim and Jenna L. Riis each played a supporting role in original writing.
Correspondence for this article should be directed to Olivia Silke, University of California, Irvine, 4201 Social and Behavioral Sciences Gateway, Irvine, CA 926977085, USA. Email: osilke@uci.edu
Parental Support and Athlete Burnout: A Correlational Study of Collegiate Student Athletes
Emily Brogan and Ronald Deluga* Department of Psychology, Bryant University
ABSTRACT. Athlete burnout is a pervasive issue in today’s competitive collegiate sport environment. Burnout is associated with negative mental health and performance outcomes. Alongside the increasing prevalence of mental health difficulties in sport, collegiate student athletes are at a greater risk of suffering from burnout. Relationships can play a critical role when cultivating resilience to prevent burnout. Parents are typically viewed as key motivators in athletes’ lives and careers, providing emotional, physical, and financial support. This study examined the relation between parental support and burnout symptoms in collegiate student athletes. Using validated psychometric scales, parental support was assessed through the Youth Sport Parental Support Questionnaire (YSPSQ), measuring autonomy, emotional, instrumental, and informational support. Burnout symptoms, including emotional/physical exhaustion, a reduced sense of accomplishment, and sport devaluation, were measured using the Athlete Burnout Questionnaire (ABQ). Results revealed a significant negative correlation between parental support and burnout symptoms (ρ = .343, p = .002), indicating that higher levels of parental support were associated with lower burnout. Athlete burnout levels differed by biological sex, with female athletes exhibiting significantly higher levels than male athletes; devaluation produced the largest difference between groups, t(78) = 2.607, p = .009. However, neither the division level nor the type of sport had a significant impact on burnout or parental support levels. Parental support could serve as a potential protective factor against burnout in collegiate athletes. Future research should further examine the role of parental support in promoting athlete resilience.
Keywords: athlete burnout, parental support, collegiate student athlete, mental health
Student athletes may benefit from third party assistance as they transition into college and navigate their dual identities as both students and athletes (Parietti et al., 2017). Collegiate student athletes have a different experience than their nonathlete counterparts and may be more at risk for experiencing aversive emotions (Kaye et al., 2018). Athletes tend to have their own social networks, including their parents, which can create an environment with varying motivational climates that impact the athlete’s wellbeing (Habeeb et al., 2023). Developing a better understanding of parental support in the lives of student athletes can increase awareness of the unique issues they face, particularly athlete burnout (Parietti et al., 2017). According to a metaanalysis by Madigan et al. (2022), student athletes are at greater risk of
experiencing burnout than in previous decades. Student athletes’ academic and athletic expectations, combined with parental expectations, have been examined as predictors of athlete burnout (Sorkkila et al., 2017). Burnout can occur in any ordinary individual or athlete; it is not exclusive to individuals with predisposed psychological disorders (Heidari, 2013). Athlete burnout is positively associated with markers of stress, anxiety, and depression, as well as negatively associated with overall wellbeing and life satisfaction (Eklund & DeFreese, 2015; Giusti et al., 2022; Habeeb et al., 2023).
Athlete
An athlete is an individual who competes in a sport. This study targeted a specific group of athletes: current or former collegiate student athletes competing at any
NCAA level in a team or individual sport. Due to the athletic demands expected, collegiate student athletes have a unique experience compared to their nonathlete counterparts (Parietti et al., 2017). Student athletes may face conflicting roles due to their dual identities as students and athletes. Collegiate athletes, specifically, are emerging adults who are expected to balance athletics and academics, in addition to the developmental changes that occur during this stage (Kaye et al., 2018). The uniqueness of individuals in their emerging adulthood years, as well as their identification as student athletes, makes this population important to study (Parietti et al., 2017).
Team and Individual Sports
Collegiate student athletes compete in a variety of highperformance environments that require collaboration or individuality. Individual and team, or “collective,” sports have distinct characteristics in terms of psychosocial, technical, and tactical aspects (Dos Santos et al., 2020). Individual sports, such as swimming and track and field, focus on training and competition where each individual athlete has only themselves to count on. Individual sports may also be team sports in some regards, such as track and field or swimming relay races. Team sports, such as basketball and soccer, work collaboratively towards a common goal of winning through managing the strengths and weaknesses of all athletes (Dos Santos et al., 2020). In individual sports, athletes may perceive their own teammates as competition, and team sport athletes perceive others as allies.
Athlete Burnout
Burnout is not limited to any particular type of sport; athletes across all sports can experience this form of distress. When athlete burnout occurs, a previously enjoyed sport participation becomes a source of stress, with individuals experiencing lower levels of energy as well as higher levels of chronic fatigue and susceptibility to illness (Smith, 1986). Athlete burnout occurs on a continuum, ranging from presenting no symptoms to being unable to function fully (Giusti et al., 2022). Two types of athlete burnout have been identified, one in which an athlete abandons their sport altogether, and another in which an athlete remains involved in the sport at a decreased level of involvement (Gould et al., 1996).
According to Smith’s (1986) CognitiveAffective Model of Athletic Burnout, burnout is a response to chronic stress heavily influenced by how athletes perceive and cope with stressors. Athletic burnout occurs when athletes perceive excessive situational demands (e.g., intense training, external pressures) as unmanageable, leading to negative cognitive appraisals. Stress triggers physiological responses (e.g., fatigue, tension), resulting
in behavioral changes such as withdrawal and decreased motivation (Smith, 1986).
Athlete burnout is a multidimensional construct that consists of three dimensions: emotional/physical exhaustion, a reduced sense of accomplishment, and sport devaluation (Raedeke & Smith, 2001). The operational definition of burnout (Raedeke & Smith, 2001) is critical to the analysis of this construct (Eklund & DeFreese, 2015). Physical and emotional exhaustion is the reduction in perceived resources due to training and competition. A reduced sense of accomplishment is considered a negative evaluation of an individual’s sporting ability. Sport devaluation is a loss of interest in sport and a lack of care for participation (Madigan et al., 2022). These three dimensions serve as markers to assess the severity of burnout experienced by athletes.
Athletes may be at greater risk of burnout, as it has become an increasingly recognized and prevalent issue in sport (Giusti et al., 2022). A larger number of athletes may be susceptible to athlete burnout and its negative impacts. As athletes continue to evaluate their sporting abilities more negatively, they have simultaneously felt the need to distance themselves from sport; the average levels of sport devaluation has increased over the past few decades (Madigan et al., 2022). Sport, especially at a highly competitive level, is taxing on athletes in a physical, emotional, and mental manner.
Previous research found that female athletes are at a greater risk of experiencing athlete burnout symptoms comparatively to their male athlete counterparts (Giusti et al., 2022; Heidari, 2013; Shipherd et al., 2024). Female athletes may be more susceptible to athlete burnout than male athletes; female athletes may not cope as effectively when facing physical and mental stresses (Heidari, 2013). Pathology can also play a factor in the higher levels of athlete burnout susceptibility for female athletes. Female athletes are more likely to experience a syndrome termed “Relative Energy Deficiency in Sport” (REDS) than their counterparts (Giusti et al., 2022); this can be attributed to higher rates of eating disorders as well as menstruation. In addition to women, individual sport athletes are at a higher risk of experiencing athlete burnout than team sport athletes. The frequency of burnout in team sports is less frequent than in individual sports (Dos Santos et al., 2020). Individual sport athletes do not tend to have the same social support network immediately available as their team sport counterparts (Dos Santos et al., 2020; Giusti et al., 2022; Heidari, 2013).
Perceived Parental Support
In addition to internal factors, external factors, such as a lack of control and support, influence burnout. Athletes often find themselves in social environments
that their parents have initiated, resulting in a perceived lack of control by the athletes (Gustafsson et al., 2016). Parental support, a subcategory of parental involvement, is both a source of positive influence and outcomes as well as negative consequences (Ahmad Tajri et al., 2024). Parental support has been identified as a critical component of an athlete’s participation, experience, and success in sport. However, overinvolvement or an athlete’s negative perception of their parents’ support can cause decreased enjoyment, increased anxiety, and ultimately lead to higher levels of burnout (Coles et al., 2020). Parents have been identified as a potential source of athlete burnout for three main reasons: parents play an important role in the athlete experience, serve as a source of pressure or support, and can influence perfectionism in athletes (Gustafsson et al., 2016; Strandbu et al., 2019).
Parents typically assume the roles of motivator and supporter in their athlete’s life (Hoyle & Leff, 1997). Alongside this belief, parents and athletes tend to have an “interdependent dyadic relationship,” in which two individuals have a close emotional connection and influence each other’s well being (Rouquette et al., 2020). Parental support is significantly associated with sport enjoyment, performance, and the importance attributed to sport (Hoyle & Leff, 1997; Rouquette et al., 2020). Parental support in sport is defined as a “young athlete’s perception of his or her parents’ behavior aimed at facilitating his or her involvement and participation in sport” (Burke et. al., 2023, p. 2085). Parents play a large role in their child’s sportrelated motivational beliefs, which also includes athlete burnout and sport discontinuation (Jaf et al., 2023). Parental support is associated with higher levels of sport enjoyment as well as more positive assessments of selfworth and performance evaluations (Hoyle & Leff, 1997; Rouquette et al., 2020).
The theory of parental support suggests that parents provide different types of support to their athletes: autonomy support, emotional support, informational support, and instrumental support (Burke et al., 2023). Autonomy support is the extent to which parents respect their child’s independence in decisionmaking regarding their sport. Emotional support focuses on parents’ reactions to their child’s performance in sports. Informational support refers to the useful advice and guidance that parents provide about sports. Instrumental support is the tangible assistance parents provide to their child in sports (Burke et al., 2023). Parental support encompasses these dimensions to nurture an athlete’s confidence, development, and well being in sport. Recent research has shown that parents continue to have some influence on their child’s athletic behaviors that continues into college and emerging adulthood (Parietti et al., 2017).
Current Considerations
Athlete burnout is a critical issue in sport psychology, often leading to decreased performance, possible withdrawal from sport, and both shortterm and longterm psychological distress (Eklund & DeFreese, 2015; Giusti et al., 2022; Raedeke & Smith, 2001; Smith, 1986). Although various factors may contribute to athlete burnout, parental support plays a significant role in shaping an athlete’s overall experience (Burke et. al., 2023; Hoyle & Leff, 1997; Rouquette et al., 2020). Positive parental support is linked to increased motivation, resilience, and overall well being, whereas a lack of support or excessive pressure may contribute to stress and exhaustion (Gustafsson et al., 2016; Strandbu et al., 2019). Given the influential role of parents in an athlete’s development and continuation in sport, it is essential to examine the association between perceived parental support and burnout levels. Additionally, understanding whether these experiences vary based on biological sex, sport type (individual or team), and level of competition can reveal the multifaceted relation between parental support and athlete wellbeing. As such, we sought to answer the following question:
1. What is the relationship between perceived parental support and athlete burnout?
2. Does perceived parental support or athlete burnout levels differ based on the athlete’s biological sex, type of sport competed in, or level of competition?
In line with previous research, we hypothesized that a negative correlation would be found between perceived levels of parental support and athlete burnout; as the perceived level of parental support increases, burnout symptoms would decrease. The level of athlete burnout is hypothesized to differ based on the athlete’s biological sex and the type of sport (individual or team) but not based on the division of competition.
Method
Participants
The participants included 80 individuals between the ages of 18 and 25, who were identified as current or former collegiate student athletes. Of the total 80 participants, 39 individuals identified as male (48.8%), 41 individuals identified as female (51.2%), and no individuals identified as intersex (0%). Participants were also asked to share the NCAA division level of competition at which they competed and whether they participated in a team or individual sport. Fiftyone participants competed at the NCAA Division I level (63.7%), 4 participants competed at the NCAA Division II level (5.0%), and 25 participants competed at the NCAA Division III level (31.3%). Sixty student athletes
identified as participating in a team sport (75.0%), and 20 participants identified as participating in an individual sport (25.0%; see Table 1).
Measures
The Athlete Burnout Questionnaire (ABQ; Raedeke & Smith, 2001) is a 15item measure designed to assess athlete burnout. Participants indicate the frequency of which they have had thoughts or feelings regarding their sport on a 5point scale ranging from 1 (almost never) to 5 (almost always). The three subscales include emotional/physical exhaustion (e.g., “I feel so tired from my training that I have trouble finding energy to do other things”), a reduced sense of accomplishment (e.g., “I am not performing up to my ability in my sport”), and sport devaluation (e.g., “I don’t care as much about my sport performance as I used to”). Two statements are positively worded and are therefore reverse scored, so that overall higher scores represent an increase in burnout symptoms. A mean of approximately three is classified as a high burnout score (ABQ; Raedeke & Smith, 2001). The ABQ scale (α = .85) demonstrated strong internal consistency, indicating that the scales reliably measured the constructs of interest.
The Youth Sport Parental SupportQuestionnaire (Burke et al., 2023) is an 18item measure designed to assess parental support in youth sports. The questionnaire consists of multiple items that evaluate the frequency and types of support parents provide to their athletes, using a fivepoint scale ranging from 1 (strongly disagree) to 5 (strongly agree). The YSPSQ includes subscales that capture different dimensions of parental support, such as emotional support (e.g., “My parent(s) make negative comments when I play poorly”), instrumental support (e.g., “My parent(s) spend money to support my development in sport”), autonomy support (e.g., “My parent(s) respect my decisions in sport”), and informational support (e.g., “My parent(s) give me technical advice when appropriate”). The emotional support subscale items are reverse scored to ensure that higher scores reflect greater perceived parental support. The questionnaire demonstrated strong psychometric properties (α = .90), indicating high internal consistency across subscales and the total score, supporting its reliability and validity in assessing parental support in youth sports. This finding aligns with prior evidence of reliability, indicating that the 18item YSPSQ (α = .90) exhibits acceptable internal reliability (Burke et al., 2023).
Design
This study utilized a correlational withinsubjects design to investigate the relationship between athlete burnout
and perceived parental support. A within subjects approach allowed for the assessment of individual variations in perceived parental support and burnout levels, minimizing the influence of external factors that may differ between participants. The data were filtered before statistical analyses; correlation and regression coefficients are presented to examine the possible links between athlete burnout and perceived parental support.
Procedures
Following approval from the Bryant University Institutional Review Board, participants were recruited using nonprobability sampling techniques in February and March of 2025. Nonprobability sampling techniques were used to identify and recruit any possibly interested individuals. Purposive sampling was employed, as the research targeted a specific population: current or former collegiate student athletes. This method was appropriate given the focus on athlete burnout and perceived parental support, which is most relevant to individuals with firsthand experience in collegiate athletics. By intentionally selecting participants who met these criteria, it ensured that the sample reflected the characteristics necessary to explore the research questions in depth. The research intended to involve these individuals from various local New England universities. Information on the study and the corresponding Qualtrics link to the survey were shared via email, fliers posted around the Bryant University campus, and through social media. Participants accessed the Qualtrics link through QR code postings or by clicking on the link itself to participate in the study. Participation in this study was entirely voluntary. Participants were informed about the study and asked to provide their
TABLE 1
Sociodemographic Characteristics of Participants
informed consent to participate. Participants were guaranteed confidentiality throughout our research, and measures were taken to ensure this protection.
Once consent was given, participants answered demographic questions regarding biological sex, age, NCAA division of competition, and type of sport. The research aimed to provide a diverse representation by considering participants from various socioeconomic statuses, sexes, and racial backgrounds. The Athlete Burnout Questionnaire was administered first, followed by the Youth Sport Parental Support Questionnaire. Participants were briefed on the study and thanked for their participation.
The Athlete Burnout Questionnaire (ABQ) was administered before the Youth Sport Parental Support Questionnaire (YSPSQ) to reduce potential response bias and ensure a more accurate reporting of burnout symptoms. By assessing burnout first, participants were able to reflect on their internal experiences without being influenced by thoughts or emotions related to their parents’ level of support. This order also follows a logical progression, measuring the potential outcome (burnout) before exploring a contributing factor (parental support). Administering the YSPSQ after the ABQ helped prevent priming effects that could arise if participants were first reminded of their parents’ behaviors, which might unintentionally shape how they report their own psychological state.
Preliminary Analysis
Prior to conducting primary analyses, the data were screened and managed for accuracy and completeness. Responses were examined for missing data, outliers, and violations of statistical assumptions. Cases with any missing data were excluded from the final dataset. In cases where no clear error was identified, outliers were retained due to their theoretical relevance. A p value of .05 was used as the conventional threshold for determining statistical significance. Comparisons or correlations yielding pvalues greater than .05 were considered statistically insignificant, suggesting that any differences, if present, were likely due to chance rather than a true effect.
Results
Correlational analyses, using Pearson’s correlation, revealed significant relations between the study variables. As shown in Table 2, scores on the Athlete Burnout Questionnaire (ABQ) were significantly negatively correlated with scores on the Youth Sport Parental Support Questionnaire (YSPSQ; ρ = .34, p = .002).
Table 2 presents the Pearson correlations among the athlete burnout dimensions and parental support
subscales. As shown in Table 2, Reduced Sense of Accomplishment was significantly positively correlated with Emotional/Physical Exhaustion and Devaluation, showing a consistent relationship among the core dimensions of athlete burnout. In terms of associations with parental support, Emotional/Physical Exhaustion was significantly negatively correlated with Emotional Support and Autonomy Support, suggesting that athletes who perceived more support from parents were less emotionally and physically drained. Devaluation was also negatively correlated with Autonomy Support, Emotional Support, and Informational Support. Reduced Sense of Accomplishment was not significantly correlated with any of the parental support subscales. Among the YSPSQ
Correlations for Study Variables: ABQ and YSPS-Q Subscales
Note N = 80; * p < .05; ** p < .01; EPE = Emotional/Physical Exhaustion; RSA = Reduced Sense of Accomplishment; D = Devaluation; AS = Autonomy Support; ES = Emotional Support; IS = Instrumental Support; INS = Informational Support; ABQ = Athlete Burnout Questionnaire; YSPS-Q = Youth Sport Parental Support Questionnaire
TABLE 3
Means, Standard Deviations, and Independent Samples t-Test Results by Biological Sex
Subscales Female Male
Note. N = 80; EPE = Emotional/Physical Exhaustion; RSA = Reduced Sense of Accomplishment; D = Devaluation; AS = Autonomy Support; ES = Emotional Support; IS = Instrumental Support; INS = Informational Support; ABQ = Athlete Burnout Questionnaire; YSPS-Q = Youth Sport Parental Support Questionnaire
parental support subscales, several strong positive associations emerged. Autonomy Support was significantly positively correlated with Emotional Support, Instrumental Support, and Informational Support. Additionally, Instrumental Support was significantly positively correlated with Informational Support. These correlational patterns remained largely consistent when controlling for biological sex, athletic division, and sport type.
To assess differences in biological sex, independent samples t tests were conducted on all burnout and parental support variables. Table 3 presents the results, which indicate significant differences in all three dimensions of athlete burnout between men and women. Specifically, female athletes reported significantly higher levels of Reduced Sense of Accomplishment, Emotional/Physical Exhaustion, and Devaluation. All three differences were statistically significant and the associated effect sizes were moderate. In contrast, no significant differences were observed between biological sex in terms of parental support. These results suggest that perceived parental support was relatively consistent across biological sexes.
To explore whether burnout or parental support differed by division level (Division I, II, or III) or sport type (e.g., team vs. individual sports), additional independent samples t tests and ANOVAs were conducted. Table 4 displays the results of t tests comparing individual and team sport athletes across all subscales. Table 5 summarizes ANOVA results assessing differences by NCAA division level. No statistically significant differences were found. All p values exceeded the conventional .05 threshold, and calculated effect sizes were negligible.
Discussion
The present study examined the possible relation between perceived parental support and athlete burnout in collegiate student athletes. Additionally, it explored whether burnout and parental support levels differed based on biological sex, sport type (individual vs. team), and division level. Consistent with our hypothesis, findings revealed a significant negative correlation between parental support and burnout, suggesting that higher levels of parental support are associated with lower burnout symptoms. These results align with previous research indicating that strong parent support can possibly serve as a protective factor against burnout in athletes (Gustafsson et al., 2016; Raedeke & Smith, 2001; Strandbu et al., 2019). The significant negative correlations between specific parental support dimensions and burnout symptoms (emotional support being negatively correlated with emotional and physical exhaustion, and autonomy support being negatively correlated with devaluation) show the potential role of different types of parental support in mitigating burnout.
Differences between men and women emerged in burnout symptoms as hypothesized, with women experiencing higher levels of athlete burnout compared to their male counterparts. Female athletes reported significantly higher levels of emotional/physical exhaustion, reduced sense of accomplishment, and devaluation compared to male athletes. These differences were statistically significant with moderate effect sizes, suggesting that female athletes may experience greater levels of burnout. These findings are consistent with previous research suggesting that female athletes may experience greater emotional and psychological strain in competitive sports
Means, Standard Deviations, and Independent Samples t-test Results by Sport Type Subscales
Note. N = 80; EPE = Emotional/Physical Exhaustion; RSA = Reduced Sense of Accomplishment; D = Devaluation; AS = Autonomy Support; ES = Emotional Support; IS = Instrumental Support; INS = Informational Support; ABQ = Athlete Burnout Questionnaire; YSPS-Q = Youth Sport Parental Support Questionnaire
TABLE 5
Means, Standard Deviations, and One-Way Analyses of Variance by Division
Note. N = 80; EPE = Emotional/Physical Exhaustion; RSA = Reduced Sense of Accomplishment; D = Devaluation; AS = Autonomy Support; ES = Emotional Support; IS = Instrumental Support; INS = Informational Support; ABQ = Athlete Burnout Questionnaire; YSPS-Q = Youth Sport Parental Support Questionnaire
TABLE 4
(Giusti et al., 2022; Gustafsson et al., 2016; Heidari, 2013). However, no significant differences were found within biological sex in parental support dimensions. This indicates that although both male and female athletes perceive similar levels of parental support, female athletes may still be more vulnerable to burnout due to other stressors. Such stressors include societal expectations, performance pressure, or psychological coping differences (Giusti et al., 2022; Heidari, 2013; Shipherd et al., 2024).
Contrary to our hypothesis, burnout symptoms and perceived parental support did not significantly differ based on sport type (individual vs. team) or competition level (Division I, II, or III). The current research methodologies might not be sensitive enough to detect subtle differences in burnout across sport types or division levels. All comparisons yielded p values exceeding the conventional .05 threshold, and effect sizes remained negligible, suggesting that neither of these factors played a meaningful role in athlete burnout within this study. These results contrast with some prior research that found higher burnout levels in individual sport athletes (Dos Santos et al., 2020; Giusti et al., 2022) and greater psychological strain in Division I athletes (Giusti et al., 2022). One possible explanation for this discrepancy is that other variables, such as coaching style and training demands, may have a larger impact on burnout than sport type or division level alone.
These findings emphasize the important role of parental support in potentially reducing levels of athlete burnout and contribute to the growing body of literature on athlete wellbeing. A considerable amount of research has examined the influence of parents in competitive sport settings, creating a need to study parents’ behaviors more closely (Coles et al., 2020). By demonstrating a negative correlation between perceived parental support and burnout, this study brings attention to how supportive parenting can possibly assist with lowering levels of athlete burnout. Given that burnout can lead to decreased performance, withdrawal from sport, and mental health challenges, understanding how parental support influences this process is critical for developing effective prevention and intervention strategies. Developing prevention and intervention strategies can allow coaches, parents, and athletic organizations at any level of play to educate themselves on the adverse effects of burnout. Ultimately, education on the signs and effects of athlete burnout can lead to a more supportive environment that enhances athlete experience and wellbeing while minimizing pressureinduced stress.
The role of parents in competitive sports has garnered increasing attention in recent years, prompting the need for further exploration of how different parental
behaviors impact athlete development and burnout (Coles et al., 2020). Prior research has primarily focused on extreme cases, such as overinvolved or controlling parenting styles. However, less is known about the specific ways in which varying levels of parental support affect burnout across different athlete populations. This study adds to the literature by providing empirical evidence on the importance of perceived parental support rather than solely focusing on direct parental involvement. Moreover, by considering factors such as biological sex and sport type, this research contributes to a more comprehensive understanding of how parental support interacts with other variables in shaping an athlete’s experience.
This study presents a significant association between perceived parental support and athlete burnout among collegiate athletes. Although differences between men and women in burnout symptoms were evident, parental support levels did not vary significantly across groups, suggesting that supportive parenting is associated with lower burnout symptoms, regardless of athlete demographics or sport type. The absence of differences by sport type and division level indicates that other factors, such as coaching style or training demands, may play a more substantial role in burnout. Understanding these relationships is essential for developing holistic approaches to athlete care.
Clinical Implications
The findings of this study reinforce the ideology that parental support could serve as a potential protective factor against burnout in collegiate athletes. Supportive parenting may act as a buffer for athletes against the harmful effects of burnout. Sport psychology professionals may assess and enhance family dynamics as part of a comprehensive approach to athlete care and support. Clinicians can engage parents in psychoeducational interventions that emphasize the specific types of support shown in the data to be most beneficial, such as emotional and autonomy support. These forms of parental support were negatively correlated with key burnout dimensions in this study, indicating that parents who encourage open communication, provide emotional reassurance, and encourage individual independence may help reduce burnout symptoms. Empowering parents with strategies to maintain this balance can enable more resilient and equipped athletes to handle the stressors inherent in competitive sports.
Sport psychologists, coaches, and athletic programs can actively seek ways to involve parents in a respectful and collaborative manner throughout an athlete’s journey, especially during key transitions, such as moving from high school to college. Coaches and athletic staff also
play an important role in facilitating positive parental support and involvement. Given that parental support levels remained consistent across biological sex, sport type, and division level in this study, promoting healthy family relationships can be a universally applicable strategy. Offering workshops, providing helpful resources, and creating opportunities for parents to understand the kind of support that truly benefits their athlete can empower families to contribute positively without overstepping boundaries. When athletes, families, and coaching staff collaborate while also following the athletes’ lead, it builds a stronger support system that can help reduce burnout and create a positive sport experience over time. Recognizing parental support as part of the bigger picture makes prevention and intervention efforts more holistic and practical.
Limitations
This study has significant implications and offers valuable suggestions for intervention; however, it is essential to consider the study’s limitations. One key limitation of this study is the reliance on selfreport measures, which may introduce response bias. Athletes might overestimate or underestimate their levels of burnout or perceived parental support due to challenges with accurately recalling past experiences. This subjectivity can affect the reliability of the data, particularly in emotionally sensitive areas such as burnout and familial relationships. Additionally, the correlational design of the study restricts the ability to make causal inferences. Although findings suggest an association between parental support and athlete burnout, it remains unclear whether low parental support contributes to increased burnout or if athletes experiencing higher levels of burnout perceive less support from their parents.
Another limitation involves the use of nonprobability sampling techniques, specifically purposive sampling. This may limit the representativeness of the sample, as participants who chose to participate may differ significantly from those who did not. Consequently, the findings may not be generalizable to the broader population of collegiate athletes. Within the method, the order of questionnaire administration may have affected participant responses. Administering the Athlete Burnout Questionnaire (ABQ) before the Youth Sport Parental Support Questionnaire (YSPSQ) may have influenced how participants interpreted and responded to questions about their parents, particularly if reflecting on burnout shifted their frame of reference. Furthermore, demographic data collection did not include information on participants’ race or ethnicity, which limits the ability to explore cultural or racial differences in experiences of burnout or perceptions of
parental support. The sample’s variability in terms of biological sex, division level, and sport type also introduces potential limitations to generalizability. Though these factors were analyzed, the sample size may not have been large or diverse enough to detect meaningful subgroup differences.
Future Direction
Future research should build upon the present study, especially addressing said limitations. In addition to selfreport data, objective and multimethod approaches can be implemented to avoid response bias. These methodologies may include physiological measures of stress or systematic observations of parentathlete interactions during training or competition. These methods can help validate selfreported perceptions and provide more insight into the dynamics of parental support and athlete burnout. Longitudinal designs also aid in the clarification of direction and causality of the relation between parental support and burnout. Tracking athletes during critical developmental periods, such as the transition from high school to collegiate sports, can reveal how changes in parental support influence burnout and whether early supportive behaviors have lasting protective effects.
To facilitate greater generalizability, future studies should aim to recruit larger, more diverse samples that represent a range of biological sex, sport types, competition levels, and cultural backgrounds. Other demographic variables, such as ethnicity and socioeconomic status, allow for a specific understanding of how parental support operates across different populations. In addition to demographic information, the potential influence of questionnaire order may also affect the generalizability of the results. Future studies could randomize or counterbalance the administration of burnout and parental support measures to control for order effects. By pursuing these further directions, future research can contribute to more effective, evidencebased strategies that promote athlete wellbeing and deter burnout, which can aid in athletes’ sustained involvement and success in sport.
References
Ahmad Tajri, A., Sazali, R., Masri, H., Bakri, N., & Mokhtar, U. (2024). Parental involvement in sport: Does it help? Assessing the role of parental support in shaping athletic motivation and success from an athlete’s point of view. International Journal of Academic Research in Business and Social Sciences, 14. https://doi.org/10.6007/IJARBSS/v14-i10/23396
Burke, S., Sharp, L. A., Woods, D., & Paradis, K. F. (2023). The development and validation of the Youth Sport Parental Support-Questionnaire (YSPS-Q). International Journal of Sport and Exercise Psychology, 22(8), 2085–2110. https://doi.org/10.1080/1612197X.2023.2255605
Coles, J., Wright, E., & Mignano, M. (2020). The balancing of parental involvement in fostering collegiate athletes. Journal of Sport Behavior, 43(2), 176–197. https://journalofsportbehavior.org/index.php/JSB/article/view/19
Dos Santos, A. C. A., Pires, D. A., Vorkapic, C. M. F., & de Andrade Bastos, A. (2020). Differences in perception of burnout syndrome among young athletes from individual and team sports. Motricidade, 16(1), 39–46. https://doi.org/10.6063/motricidade.15939
Eklund, R., & DeFreese, J. D. (2015). Athlete burnout: What we know, what we could know, and how we can find out more. International Journal of Applied Sports Sciences, 27(2), 63–75. https://doi.org/10.24985/ijass.2015.27.2.63
Giusti, N., Carder, S., Wolf, M., Vopat, L., Baker, J., Tarakemeh, A., Bal, K., Randall, J., & Vopat, B. (2022). A measure of burnout in current NCAA student-athletes. Kansas Journal of Medicine, 15, 325–330. https://doi.org/10.17161/kjm.vol15.17784
Gould, D., Udry, E., Tuffey, S., & Loehr, J. (1996). Burnout in competitive junior tennis players: I. A quantitative psychological assessment. The Sport Psychologist, 10(4), 322–340. https://doi.org/10.1123/tsp.10.4.322
Gustafsson, H., Hill, A. P., Stenling, A., & Wagnsson, S. (2016). Profiles of perfectionism, parental climate, and burnout among competitive junior athletes. Scandinavian Journal of Medicine & Science in Sports, 26(10), 1256–1264. https://doi.org/10.1111/sms.12553
Habeeb, C. M., Barbee, J., & Raedeke, T. D. (2023). Association of parent, coach, and peer motivational climate with high school athlete burnout and engagement: Comparing mediation and moderation models. Psychology of Sport and Exercise, 68, Article 102471. https://doi.org/10.1016/j.psychsport.2023.102471
Heidari, S. (2013). Gender differences in burnout in individual athletes. European Journal of Experimental Biology, 3(3), 583-588. https://www.primescholars. com/articles /gender-differences-in-burnout-in-individual-athletes.pdf
Hoyle, R. H., & Leff, S. S. (1997). The role of parental involvement in youth sport participation and performance. Adolescence, 32(125), 233.
Jaf, D., Wagnsson, S., Skoog, T., Glatz, T., & Özdemir, M. (2023). The interplay between parental behaviors and adolescents’ sports-related values in understanding adolescents’ dropout of organized sports activities. Psychology of Sport and Exercise, 68, Article 102448. https://doi.org/10.1016/j.psychsport.2023.102448
Kaye, M., Lowe, K., & Dorsch, T. (2018). Dyadic examination of parental support, basic needs satisfaction, and student–athlete development during emerging adulthood. Journal of Family Issues, 40 https://doi.org/10.1177/0192513X18806557
Madigan, D. J., Olsson, L. F., Hill, A. P., & Curran, T. (2022). Athlete burnout symptoms are increasing: A cross-temporal meta-analysis of average levels from 1997
to 2019. Journal of Sport and Exercise Psychology, 44(3), 153–168. https://doi.org/10.1123/jsep.2020-0291
Parietti, M. L., Sutherland, S., & Pastore, D. L. (2017). Parental involvement in the lives of intercollegiate athletes. Journal of Amateur Sport, 3(3), 106-134. https://doi.org/10.17161/jas.v3i3.6510
Raedeke, T. D., & Smith, A. L. (2001). Development and preliminary validation of an athlete burnout measure. Journal of Sport and Exercise Psychology, 23(4), 281–306.
Rouquette, O., Knight, J., Lovett, V., & Heuzé, J. (2020). Parent-athlete relationships: A central but underexamined consideration within sport psychology. Sport and Exercise Psychology Review, 16(2). https://doi.org/10.53841/bpssepr.2020.16.2.5
Shipherd, A. M., Avery, C., Gomez, S., & Renner, K. B. (2024). The relationship between stress mindset and burnout in college athletes. Journal of Athlete Development and Experience, 6(1), Article 2. https://doi.org/10.25035/jade.06.01.02
Smith, R. E. (1986). Toward a cognitive-affective model of athletic burnout. Journal of Sport Psychology, 8(1), 36–50. https://doi.org/10.1123/jsp.8.1.36
Sorkkila, M., Aunola, K., & Ryba, T. V. (2017). A person-oriented approach to sport and school burnout in adolescent student-athletes: The role of individual and parental expectations. Psychology of Sport and Exercise, 28, 58–67. https://doi.org/10.1016/j.psychsport.2016.1 0.004
Strandbu, Å., Stefansen, K., Smette, I., & Sandvik, M. R. (2019). Young people’s experiences of parental involvement in youth sport. Sport, Education and Society, 24(1), 66–77. https://doi.org/10.1080/13573322.2017.1323200
We have no known conflict of interest to disclose. Bryant University’s Psychology and Sports Studies departments supported this study.
Emily Brogan played a lead role in conceptualization, research design, data collection, data analysis and interpretation, and substantive original writing. Ronald Deluga played a supporting role in conceptualization, research design, data collection, data analysis and interpretation, and substantive original writing. Correspondence concerning this article may be addressed to Emily Brogan. Email: emilybrogan2022@gmail.com
A Revised Academic Stress Scale Addressing Technology, Socioeconomic Status, and Classroom Dynamics
Gianna M. Hough1, Nancy L. Campuzano1, Robert M. Hallock1, 2 , and Catarina L. Birkenfeld Department of Psychology, Purdue Northwest University
ABSTRACT . Academic stress is a prevalent issue today. A previous academic stress scale was developed to measure domains of personal inadequacy, difficulties with teachers, and inadequate study facilities. The scale consisted of 40 questions and is the basis for this study. Classrooms today are vastly different from when the scale was created; as such, our goal was to modernize the scale. We believe updating the scale to include technology, socioeconomic status, and classroom dynamics will improve validity and reliability in measuring academic stress. We removed obsolete questions, revised and added questions about the three new domains. There were 2 sample groups. Group A included 17 undergraduate students who completed our updated scale twice, 16 days apart. A Pearson correlation found a significant positive correlation between the 2 measures, r (15) = .622, n = 17, p = .008, thus establishing reliability. Group B included 172 undergraduate students who completed the updated scale along with a standardized stress scale to measure generalized stress, through an online platform. The Pearson correlation between these 2 tests revealed they were significantly correlated, r (170) = .49, n = 172, p < .001, thus establishing validity of our updated scale. Finally, exploratory factor analysis was performed on the updated scale, and 7 factors were identified. These factors accounted for 63% of the variance in students’ responses. In sum, the original scale was updated to meet today’s educational demands; it is reliable and valid, and can be broadly used to assess academic stress in today’s classrooms.
Academic stress is a widespread issue among college students and can cause a variety of apprehensions (Reddy et al., 2018). The Scale of Academic Stress (SAS) was originally created by Kim in 1970, as cited and modified by Rajendran and Kaliappan (1990), and further examined in Rao’s (2012) doctoral dissertation. The scale consists of 40
Diversity badge earned for conducting research focusing on aspects of diversity. Open Materials badge earned for transparent research practices. Materials can be accessed at https://osf.io/zfxwg/
questions addressing personal inadequacy, fear of failure, interpersonal difficulties with teachers, teacherpupil relationship/teaching methods, and inadequate study facilities. Personal inadequacy deals with students having selfdoubt about their academic capabilities. A study on how selfefficacy or personal inadequacy affects academic stress levels found a significant negative
correlation between stress levels and selfefficacy. This shows that as selfefficacy becomes lower, there will be a higher level of stress (Kristensen et al., 2023). Fear of failure can cause anxiety about academic performance on exams or meeting expectations. A survey found most students have a fear of failure. Furthermore, it was found that having a fear of failure was associated with lower social and emotional wellbeing and higher levels of stress (Cashman et al., 2023). Interpersonal difficulties with teachers focus on conflicts between the student and teachers’ relationship and possible perceived biases. One study found that students who had conflicts with their teachers were less capable of downregulating their stress levels (Ahnert et al., 2012). Teacherpupil relationship deals with teaching styles that the student does not find helpful. Students who have a teacher with a controlling teaching style are more likely to experience academic stress (Trigueros et al., 2020). Finally, inadequate study facilities reflect difficulties with students having access to academic resources and places to study. Tiruneh et al. (2020) found that crowded study facilities and inadequate classroom facilities contribute to lower academic performance and higher levels of stress. The original scale has strong reliability, r = .82, and at the time was said to have high construct and concurrent validity (Ogunsola & Oluwafemi Ogundokun, 2017). Classrooms have immensely changed since the creation of the scale, and it fails to include any questions regarding technology, socioeconomic status (SES), or classroom dynamics. Including questions about these topics will likely modernize the scale to better measure academic stress in modern classrooms.
The SAS lacks any questions regarding technology. Today, laptops, WiFi, and program systems (Microsoft Office, Microsoft Teams, SPSS, AutoCAD) are essential for most students to excel academically. Students of lower SES are more likely to be unable to afford these forms of technology. One university went as far as having its students sign an agreement that they are required to have their own personal laptop, and it had to be able to connect to the internet (Reisdorf & Rhinesmith, 2020). Furthermore, the researchers found that each grade had a handful of students who did not have access to a laptop, which led these students to perform worse than students who owned a personal laptop. Although many universities have programs to provide laptops for their students, it was still reported in 2020 that 16%–19% of students across the U.S. had technology barriers (Jaggars et al., 2021). Not only do students in lower SES have limited access to technology, but they may also have fewer skills and confidence in using technology. This can lead to higher levels of anxiety and a decrease in selfefficacy in their technological usage for educational
needs (Njeri & Taym, 2024). Together, these can cause higher levels of stress and lower academic performance. The Scale of Academic Stress does not have questions about having limited access to technology.
SES can affect academic performance and stress levels. Jain (2017) found that nearly half of the students who experienced high levels of academic stress had a lower SES. On the other hand, they found that many students who experienced little academic stress had a high SES. College students of lower SES have higher levels of emotional distress compared to students of high SES (Jury et al., 2017). In addition to higher levels of psychological distress, students of lower SES tend to have less support at home and attend worseperforming schools. This can lead to an “achievement gap,” which describes the educational achievement gap between different socioeconomic groups (Duncan & Magnuson, 2012). Destin et al. (2019) found that students who come from wealthier backgrounds tend to perform better on tests, have a higher GPA, and have higher graduation rates than students from a lower socioeconomic background. It is important to note that lower SES does not directly cause lower academic performance, and interventions can help improve performance. Li et at. (2020) found that students from a low SES but that had high selfefficacy performed significantly better than students from a low SES that had low selfefficacy. These findings show that factors such as high selfefficacy can help to better academic achievement. SES has an impact on students’ academic stress levels and performance and should be incorporated into the updated scale.
Classroom dynamics, or how peers and teachers interact, influence, and communicate with each other, can affect how students perform academically and how comfortable they feel in their classroom. Working in small groups can often be stressful for students and unproductive. In a class of college students, it was found that when students were put into small groups, 20% of the time the conversations were unproductive (Theobald et. al, 2017). Either the students did not interact or simply just agreed on the answer of one person. In about 9% of conversations, one student would confidently give an answer with no reasoning, and the other members did not question their choice. In 1.7% of the conversations, students would discuss how they did not know the answer instead of trying to figure out an answer (James & Willoughby, 2011). Furthermore, with the rise of online courses, Greenan (2021) examined the dynamics of classes online. Students had little to no social interactions with each other, which led to a lack of trust and relationships with their peers, thus creating an unsupportive learning environment. Classroom dynamics can affect students’ stress levels, performance, and
productivity, and should be included in the academic stress scale. This investigation hypothesized that an updated academic stress scale that incorporates technology, SES, and classroom dynamics will demonstrate a high validity and reliability in measuring modern academic stress.
Study 1
Method
Participants
There were 17 students in an undergraduate research methods course at our university who took the scale twice. No demographic information was collected on this sample. The students’ participation or lack of participation was anonymous. Their identity was protected by having them create a unique 4character code they were told to remember and indicate on their papers so the papers could later be matched. Students received extra credit in the course for completion of this survey (or by completing an alternate assignment). The study was reviewed and approved by Purdue University’s Institutional Research Board (Protocol IRB2024230).
Instrument
As a team, we first analyzed the original SAS and decided which questions were obsolete, poorly worded, or still relevant. We revised 27.5% of questions to fit modern wording or to fit into a category of technology, SES, or classroom dynamics. For example, we updated, “Lack of fluency while speaking the language other than the mother tongue” to “A language barrier in the classroom makes it difficult to effectively communicate.” There were six questions (15%) that we deemed obsolete and removed; we then added six questions that fell into the previous three categories. We removed “Progress reports to parents” because we are focusing on college students and this does not apply (see Appendix A for the revisions; https://osf.io/zfxwg/files/pfn35). The resulting scale, the Modified Academic Stress Scale (MASS) had 40 questions. Participants had to indicate their level of stress for each question on a fivepoint scale: 0 (no stress), 1 (slight stress), 2 (moderate stress), 3 (high stress), and 4 (extreme stress). Items were summed and scores could range between 0 and 160 points. The original scale is licensed under the CC BY NC license and can be used and adapted.
Design
Students in an undergraduate Research Methods course were administered the MASS on paper. The students completed the scale twice, 16 days apart. A Pearson correlation was computed to test for testretest reliability.
Results
The means and standard deviations of scores for the first administration were M = 93.65, SD = 16.37, and for the second administration were M = 94.353, SD = 24.06. A Pearson correlation revealed a significant positive relationship between the two administrations, r(15) = .622, N = 17, p = .008.
Study 2
Method
Sample
A total of 172 undergraduate students participated through the online platform Prolific. Participants were all at least 18 years of age, current college students, and from the United States. The participants selfidentified as 49% women, 44% men, and 5% as others/ prefer not to answer. The ages ranged from 18 to 72, with 54% falling within the 18–24 age group, 13% within the 25–30 age group, 20% within the 31–40 age group, 8% within the 41–50 age group, and 5% being older than 50. The participants received a small monetary compensation for participating. The study was reviewed and approved by Purdue University’s Institutional Research Board (Protocol IRB2024230).
Instrument
We utilized the MASS to measure academic stress. Additionally, we used the Perceived Stress Scale (PSS; Cohen et al., 1997; Cohen et al., 1983) which is a standardized tool to measure an individual’s overall or general perceived stress levels. This scale was coadministered to the participants.
Design
The MASS and the PSS were administered to the sample from Prolific through Qualtrics, which is an online service, and the two scales were presented in a randomized order. A correlation between the two scales was computed to test for validity of our updated academic stress scale.
Results
A Pearson Correlation was completed between the participants who took the MASS and PSS to test for validity. The means and standard deviations for the MASS was M = 91.52, SD = 25.17, and for the PSS M = 21.56, SD = 3.82. A Pearson correlation revealed that the two tests were significantly positively correlated, r(170) = .49, N = 172, p < .001 (See Figure 1 https://osf. io/zfxwg/files/qdejs). An internal consistency analysis was performed for the MASS, a 40 item scale. The Cronbach’s alpha was a = .95, indicating the scale has excellent reliability.
Factor Analysis
An exploratory principal components analysis was performed on the 40 questions of the MASS. The Kaiser rule, which accepts factors with Eigenvalues greater than 1.0, identified seven factors. Collectively, these factors accounted for 63.05% of the variance in responses on the academic stress questions. See Table 1 (https://osf. io/zfxwg/files/cmqw5), which contains the questions in each factor, the seven factor loadings, and the proportion of the observed variance for each factor.
Discussion
The original Scale of Academic Stress was created in 1970 and then revised in 1990. The way classrooms were designed and functioned is vastly different today from when the scale was created. Our goal for this study was to update the SAS to be better equipped to measure academic stress in modern educational environments. The original scale had five categories of questions: personal inadequacy, fear of failure, interpersonal difficulties with teachers, teacherpupil relationship/teaching methods, and inadequate study facilities. We revised the scale to include three new categories: technology, SES, and classroom dynamics. After our revisions, the MASS, which incorporates technology access, SES, and classroom dynamics, demonstrated a high construct validity and reliability in measuring academic stress. We found a positive correlation between the MASS and the PSS (Cohen et al., 1983), establishing the validity of our scale. Furthermore, we found a positive correlation between the scores of the scales taken twice, establishing reliability. It is important to note the difference in the standard deviation; the first time it was SD = 16.37, the second time it was SD = 24.06. This could have been from external factors. Because the participants took the scale 16 days apart, it is possible that it was a more stressful time in the semester. It is also important to note that our survey was first given in the 12th week of the semester and then again in the 14th week of the semester out of a 16week semester.
This study has several limitations. It is wellknown that academic stress varies throughout a semester (Baghurst & Kelley, 2014; Lindsay & Rogers, 2009). Therefore, the time of semester when a stress scale is administered may impact the results and interpretation of the results. The scale was administered near the end of the semester, which could have caused stress levels to be higher. Perhaps it would be instructive to administer an academic stress survey shortly after the semester begins, and then periodically, so problems can be addressed before there are significant negative impacts on student grades.
Another issue surrounding the assessment of
academic stress is that a narrow assessment focused on academic stress may miss more significant issues that students are facing. For instance, Backhaus et al. (2020) assessed college students across several countries and found that 48% of the students struggled with clinically relevant depression. Further, in another crosscountry analysis of student mental health, Auerbach et al. (2018) found that in a given year, 31.4% of college students met criteria for major depressive episode, generalized anxiety disorder, panic disorder, broad mania, alcohol use disorder, or substance use disorder. It is noteworthy that scales of academic stress are just one component of student health.
It is important to note that there are numerous factors of stress besides the factors our scale focuses on, and they differ based on individuals. Firstgeneration students, those whose parents did not complete an education beyond a bachelor’s degree, experience higher levels of stress. These students often come from lowerincome families and do not have as much social support, leading to higher levels of stress, dropout rates, and lower academic achievement (Grubic et al., 2020; Stevens et al., 2018). Furthermore, students of minority groups could experience stress differently. Ethnic minority groups attending college often experience compounding stress. The compounding factors could be low SES, being a firstgeneration student, and feelings of imposter syndrome (Smedley, 1993; Wei et al., 2011). These compounding factors can lead to chronic stress. Neurodivergent students also face many challenges and often must put in twice the effort to perform at the same level as neurotypical students. Neurodivergence is not obvious, which means that teachers and others may not know that students need support (Tcherdakoff et al., 2025). Not receiving support can frequently lead to feelings of frustration, shame, not feeling in control, and not feeling as though they fit in (Speyer et al., 2023). All these feelings can lead neurodivergent students to experience increased stress. International students also face different stress factors, such as adapting to a new country, possible language barriers, isolation or lack of social support, and differences in learning styles compared to their native country (Alharbi & Smith, 2018). Numerous other factors could affect academic stress. It is important to incorporate all factors, including age, gender, and ethnicity when assessing academic stress. Another limitation is the small sample size of Group A. With only 17 participants and no demographic information collected, this limits the generalizability of our findings. Furthermore, the sample was from a convenience group, peers from our university. This could potentially lead to a sampling basis and does not represent the broader population, which may
affect the reliability of the results. All participants were current undergraduate students, so our findings might not be applicable to other levels of education. Another concern is survey fatigue; the participants answered over 40 questions. This could lead to careless responses and inaccurate results. Questions on the MASS could also be misinterpreted, leading to incorrect responses. For instance, the question “Teacher does not use the technology” could be interpreted as the teacher chose to not use the technology or the class itself could not need technology. Some questions could have been made clearer. Finally, external factors that cannot be controlled such as home environment, work hours, or academic workload load may influence participants’ reported stress levels.
The original scale focused on personal inadequacy, fear of failure, interpersonal difficulties with teachers, teacher pupil relationship/teaching methods, and inadequate study facilities. Out of these, Phillips et al. (2020) found that personal inadequacy was the most impactful to college students. The exploratory factor analysis we performed on the data from the MASS found clear themes within the factors. The first factor focused on barriers to effective learning that often centered on both difficulties with the instructor and technology. For example, questions here included “Difficulty communicating with teacher through email,” “The teacher has difficulty with classroom technologies,” and “Teacher doesn’t use technology that the campus has available.” Also included in this factor were two statements related to SES: “Biased attitude of the teacher towards student, due to lack of personal laptop” and “Teacher (sometimes unknowingly) stresses inferiority of a student’s socioeconomic status.” The first of these two relates to the instructor and technology, which may point to its inclusion in this factor, but the second does not. Inclusion of SES statements in this factor may point to an underlying link to general barriers to effective learning.
The second factor largely encompassed personal inadequacy related to the subject material. Statements in this factor included: “Feelings of inferiority,” “Lack of selfconfidence,” “not knowing how to prepare for the examinations,” and “Lack of mutual help among classmates.” This factor focused on having selfdoubt about academic performance, leading to stress.
The third factor specifically related to worry about academic pressure with regards to preparation (e.g. “Worry about the examinations” and “Difficulty in remembering all that is studied”) and performance on course assessments, including assignments, papers, and examinations. This measures academic stress from testtaking, and exam preparation, along with fear of not performing well. The fourth factor focused on poor teacherstudent communication and negative classroom
dynamics. It is also interesting to note that questions clustered together here involved the instructor, but were distinct from instructorrelated statements from the first factor, which included a component of technology or teacher bias. The remaining three factors accounted for 9 of the 40 questions. The fifth factor also involved classroom dynamics and communication barriers. The sixth factor involved stress from external factors, including worklife balance, difficulties studying at home, and demands made by teachers. Conversely, the seventh factor dealt with the internal factors of motivation and focus.
The MASS has important implications for research and student support. This scale can be used to quantify overall academic stress, with higher scores potentially indicating that a student needs an intervention. It is conceivable that individual subscores within the seven identified factors can be instrumental in targeting specific problem areas of academic stress. For instance, students whose stress originates from internal factors (factor seven), external factors (factor six), or academic pressure (factor three) can be referred to a campus counseling center to learn targeted techniques to work with their sources of stress. Students with high scores in personal inadequacy with the subject material (factor two) might benefit from both growth mindset techniques (Burnette et al., 2023; Okonofua et al., 2022) and tutoring services. Students with high stress from barriers to effective learning (factor one) can be referred to their advisor or a peer tutor who has taken that course before. Various aspects of problems with classroom dynamics (factors four and five) might best be resolved in concert with the faculty member teaching the course. This can also allow educational organizations to know what the most pressing issue is and how to adjust. This scale allows for a larger scope of factors to be measured related to academic stress.
Other scales have been developed for college students and are worth noting. For example, Kent et al. (2022) developed a College Student Acute Stress Scale and Bodenhorn et al. (2007) developed the Inventory of College Students’ Recent Life Experiences, both of which are scales to measure broader stress levels amongst college students, which can also be instructive. In sum, the MASS represents an updated and useful tool that can be used to better identify problematic academic stress levels, with the overall goal of fostering student success.
The MASS can be a foundation for future research. The MASS should be considered for use in a more broad sense, including altering it to better fit other cultures and educational levels. Furthermore, research should be done using the scale and to measure if practices like a growth mindset work or other forms of intervention. Overall, it is important to advance research on academic stress and the effects it has on students.
References
Ahnert, L., Harwardt-Heinecke, E., Kappler, G., Eckstein-Madry, T., & Milatz, A. (2012). Student–teacher relationships and classroom climate in first grade: How do they relate to students’ stress regulation? Attachment & Human Development, 14(3), 249–263. https://doi.org/10.1080/14616734.2012.673277
Alharbi, E., & Smith, A. (2018). A review of the literature on stress and wellbeing among international students in English-speaking countries. International Education Studies, 11(5), 22–44. https://doi.org/10.5539/ies.v11n6p22
Auerbach, R. P., Mortier, P., Bruffaerts, R., Alonso, J., Benjet, C., Cuijpers, P., Demyttenaere, K., Ebert, D. D., Green, J. G., Hasking, P., Murray, E., Nock, M. K., Pinder-Amaker, S., Sampson, N. A., Stein, D. J., Vilagut, G., Zaslavsky, A. M., Kessler, R. C., & WHO WMH-ICS Collaborators (2018). WHO World Mental Health Surveys International College Student Project: Prevalence and distribution of mental disorders. Journal of Abnormal Psychology, 127(7), 623–638. https://doi.org/10.1037/abn0000362
Backhaus, I., Varela, A. R., Khoo, S., Siefken, K., Crozier, A., Begotaraj, E., Fischer, F., Wiehn, J., Lanning, B. A., Lin, P. H., Jang, S. N., Monteiro, L. Z., Al-Shamli, A., La Torre, G., & Kawachi, I. (2020). Associations between social capital and depressive symptoms among college students in 12 countries: Results of a cross-national study. Frontiers in Psychology, 11, 644. https://doi.org/10.3389/fpsyg.2020.00644
Baghurst, T., & Kelley, B. C. (2014). An examination of stress in college students over the course of a semester. Health Promotion Practice, 15(3), 438–447. https://doi.org/10.1177/1524839913510316
Bodenhorn, N., Miyazaki, Y., Ng, K.-M., & Zalaquett, C. (2007). Analysis of the Inventory of College Students’ Recent Life Experiences. Multicultural Learning and Teaching, 2, 65–77. https://doi.org/10.2202/2161-2412.1022
Burnette, J. L., Billingsley, J., Banks, G. C., Knouse, L. E., Hoyt, C. L., Pollack, J. M., & Simon, S. (2023). A systematic review and meta-analysis of growth mindset interventions: For whom, how, and why might such interventions work? Psychological Bulletin, 149(3–4), 174–205. https://doi.org/10.1037/bul0000368
Cashman, M. R., Strandh, M., & Högberg, B. (2023). Does fear-of-failure mediate the relationship between educational expectations and stress-related complaints among Swedish adolescents? A structural equation modelling approach. European Journal of Public Health, 34(1), 101–106. https://doi.org/10.1093/eurpub/ckad200
Cohen, S., Kamarck, T., & Mermelstein, R. (1983). A global measure of perceived stress. Journal of Health and Social Behavior, 24(4), 385–396. https://doi.org/10.2307/2136404
Cohen, S., Kessler, R. C., & Gordon, L. U. (Eds.). (1997). Measuring stress: A guide for health and social scientists. Oxford University Press, USA. https://psycnet.apa.org/record/1998-07054-000
Destin, M., Hanselman, P., Buontempo, J., Tipton, E., & Yeager, D. S. (2019). Do student mindsets differ by socioeconomic status and explain disparities in academic achievement in the United States? AERA Open, 5(3). https://doi.org/10.1177/2332858419857706
Duncan, G. J., & Magnuson, K. (2012). Socioeconomic status and cognitive functioning: moving from correlation to causation. WIREs Cognitive Science, 3(3), 377–386. https://doi.org/10.1002/wcs.1176
Greenan, K. A. (2021). The influence of virtual education on classroom culture. Frontiers in Communication, 6 https://doi.org/10.3389/fcomm.2021.641214
Grubic, N., Badovinac, S., & Johri, A. M. (2020). Student mental health in the midst of the COVID-19 pandemic: A call for further research and immediate solutions. The International Journal of Social Psychiatry, 66(5), 517–518. https://doi.org/10.1177/002076402092510
Jaggars, S. S., Motz, B. A., Rivera, M. D., Heckler, A., Quick, J.D., Hance, E. A., & Karwischa, C. (2021). The digital divide among college students: Lessons learned from the COVID-19 emergency transition. Midwestern Higher Education Compact. https://mhec.org/mhec_reports/the-digital-divide-among-collegestudents-lessons-learned-from-the-covid-19-emergency-transition/ Jain, P. (2017). A correlational analysis of academic stress in adolescents in respect of socio- economic status. International Journal of Physical Sciences and Engineering, 59–61. https://doi.org/10.21744/ijpse.v1i1.14
James, M. C., & Willoughby, S. (2011). Listening to student conversations during Clicker Questions: What you have not heard might surprise you! American Journal of Physics, 79(1), 123–132. https://doi.org/10.1119/1.3488097
Jury, M., Smeding, A., Stephens, N. M., Nelson, J. E., Aelenei, C., & Darnon, C. (2017). The experience of low‐SES students in higher education: Psychological barriers to success and interventions to reduce social‐class inequality.
Journal of Social Issues, 73(1), 23–41. https://doi.org/10.1111/josi.12202
Kent, N., Alhowaymel, F., Kalmakis, K., Troy, L., & Chiodo, L. M. (2022). Development of the College Student Acute Stress Scale (CSASS). Perspectives in psychiatric care, 58(4), 2998–3008. https://doi.org/10.1111/ppc.13053
Kristensen, S. M., Larsen, T. M., Urke, H. B., & Danielsen, A. G. (2023). Academic stress, academic self-efficacy, and psychological distress: A moderated mediation of within-person effects. Journal of Youth and Adolescence, 52(7), 1512–1529. https://doi.org/10.1007/s10964-023-01770-1
Li, S., Xu, Q., & Xia, R. (2020). Relationship between SES and academic achievement of junior high school students in China: The mediating effect of self-concept. Frontiers in Psychology, 10 https://doi.org/10.3389/fpsyg.2019.02513
Lindsay, E., & Rogers, H. (2009). Variations in students’ perceptions of stress and workload throughout a semester. [Paper presentation]. SEFI 37th Annual Conference 2009, Rotterdam, Netherlands. https://www.scopus.com/pages/publications/84938817360
Njeri, M., & Taym, A. (2024). Analyzing the power of socioeconomic status on access to technology-enhanced learning in secondary schools. Research Studies in English Language Teaching and Learning, 2(4), 223–250. https://doi.org/10.62583/rseltl.v2i4.55
Ogunsola, J., & Oluwafemi Ogundokun, M. (2017). Development and validation of academic stress scale among undergraduates in Nigeria. Sabinet. https://hdl.handle.net/10520/EJC-b278037c7
Okonofua, J. A., Goyer, J. P., Lindsay, C. A., Haugabrook, J., & Walton, G. M. (2022). A scalable empathic-mindset intervention reduces group disparities in school suspensions. Science Advances, 8(12). https://doi.org/10.1126/sciadv.abj0691
Phillips, S. C., Halder, D. P., & Hasib, W. (2020). Academic stress among tertiary level students: A categorical analysis of academic stress scale in the context of Bangladesh. Asian Journal of Advanced Research and Reports, 8(4), 1–16. https://doi.org/10.9734/AJARR/2020/v8i430203
Rajendran, R., & Kaliappan, K. V. (1990). Efficacy of behavioral programme in managing the academic stress and improving academic performance. Journal of Personality and Clinical Studies, 6(2), 193–196.
Rao, R. B. (2012). A study of academic stress and adjustment styles of teacher trainees [Doctoral dissertation, Acharya Nagarjuna University]. http://hdl.handle.net/10603/126852
Reddy, K. J., Menon, K. R., & Thattil, A. (2018). Academic stress and its sources among university students. Biomedical and Pharmacology Journal, 11(1), 531–537. https://doi.org/10.13005/bpj/1404
Reisdorf, B., & Rhinesmith, C. (2020). Digital inclusion as a core component of social inclusion. Social Inclusion, 8(2), 132–137. https://doi.org/10.17645/si.v8i2.3184
Smedley B. D., Myers H.F., Harrell S.P (1993). Minority-status stresses and the college adjustment of ethnic minority freshmen. Journal of Higher Education, 64(4), 434–452. https://doi.org/10.2307/2960051
Speyer, L. G., Brown, R. H., Ribeaud, D., Eisner, M., & Murray, A. L. (2023). The role of moment-to-moment dynamics of perceived stress and negative affect in co-occurring ADHD and internalizing symptoms. Journal of Autism and Developmental Disorders, 53, 3(3 2023), 1213–1223. https://doi.org/10.1007/s10803-022-05624-w
Stevens, C., Liu, C. H., & Chen, J. A. (2018). Racial/ethnic disparities in US college students’ experience: Discrimination as an impediment to academic performance. Journal of American College Health, 66(7), 665–673 https://doi.org/10.1080/07448481.2018.1452745
Tcherdakoff, N. A., Marshall, P., Dowthwaite, A., Bird, J., & Cox, A. L. (2025). Burnout by design: How digital systems overburden neurodivergent students in higher education. Proceedings of the 4th Annual Symposium on HumanComputer Interaction for Work, 1–18. https://doi.org/10.1145/3729176.3729193
Theobald, E. J., Eddy, S. L., Grunspan, D. Z., Wiggins, B. L., & Crowe, A. J. (2017). Student perception of group dynamics predicts individual performance: Comfort and equity matter. PLoS ONE, 12(7), Article 0181336. https://doi.org/10.1371/journal.pone.0181336
Trigueros, R., Padilla, A., Aguilar-Parra, J. M., Lirola, M. J., García-Luengo, A. V., Rocamora-Pérez, P., & López-Liria, R. (2020). The influence of teachers on motivation and academic stress and their effect on the learning strategies of university students. International Journal of Environmental Research and Public Health, 17(23), 9089. https://doi.org/10.3390/ijerph17239089
Tiruneh, S. T., Abegaz, B. A., Bekel, A. A., Adamu, Y. W., Kiros, M. D., & Woldeyes, D. H. (2020). Facility-related factors affecting academic performance of medical students in human anatomy. Advances in Medical Education and Practice, 11, 729–734. https://doi.org/10.2147/AMEP.S269804
Academic Stress Scale | Hough, Campuzano, Hallock, and Birkenfeld
Wei, M., Ku, T. Y., & Liao, K. Y. H. (2011). Minority stress and college persistence attitudes among African American, Asian American, and Latino students: perception of university environment as a mediator. Cultural Diverse Ethnic Minor Psychology, 17(2), 195–203. https://doi.org/0.1037/a0023359
Author Note Gianna Hough played a lead role in conceptualization, research design, data collection, data analysis and interpretation, and
substantive original writing. Nancy Campuzano played a lead role in conceptualization, research design, data collection, and a supporting role in data analysis. Robert Hallock played a lead role in data analysis and interpretation, supervision, and a supporting role in writing and editing. Catarina Birkenfeld played a lead role in conceptualization, research designs. Correspondence concerning this article may be addressed to Gianna Hough. Email: houghg@pnw.edu
Personality and Political Orientation: Big Five Aspect-Level Associations Among Students at a Southeastern U.S. University
Savannah G. Diggett1 and Ben F. Cotterill*2
1Department of Methodology, London School of Economics and Political Science
2Department of Psychology, Clemson University
ABSTRACT. This study sought to extend existing research regarding the relationship between political orientation and psychological traits and aspects in a sample of students from a large university in South Carolina, as prior literature on these relationships in this region is limited. Participants ( N = 139) provided information about their psychological profiles, opinions of political issues, and the parties they have/will vote(d) for during the 2020 and 2024 election cycles. As predicted, compassion ( r = –.23, p = .007), openness/intellect (r = –.24, p = .004), and openness (r = –.26, p = .002) significantly predicted selfreported liberalism, and conscientiousness (r = .17, p = .042) and industriousness (r = .20, p = .021) were significant predictors of rightleaning political beliefs. Though not specifically predicted, there was a significant positive association between extraversion and conservatism (r = .20, p = .019) and a significant negative association between neuroticism and conservatism ( r = –.18, p = .032). Intellect, orderliness, and politeness were not significant predictors of political orientation. Agreeableness predicted economic liberalism ( r = –.28, p < .001) , but not social conservatism. Additionally, aspectlevel traits accounted for more variance in political orientation (R² = .164) than factorlevel traits (R² = .134). Although research on the role of intermediatelevel traits in the political arena is underdeveloped, the current study highlights essential personality differences between those on the left and right of the political spectrum, which is crucial for understanding the political divide in the U.S.
Keywords: big five, personality, conservatism, political orientation, southeast
In times of global uncertainty—such as the COVID19 pandemic and the rise of political instability (Gao & Liu, 2023)—it is increasingly important to understand how individuals think, feel, and behave in order to make informed predictions about the future. One of the most effective ways to assess these characteristics is through the study of personality traits, which are stable, reliable, and consistent predictors of human cognition, emotion, and behavior (Roberts & Jackson, 2008; Tellegen, 1991). By examining individual differences in personality, researchers can better understand patterns of decisionmaking, social attitudes, and responses to societal challenges.
The Big Five Model of Personality
The Five Factor Model (FFM; John, 2021; McCrae, 2020) is empirically supported, temporally and culturally
stable (Widiger & Crego, 2019), and is the most popular trait approach among personality researchers (Verhulst, et al., 2012). The FFM outlines five broad personality traits: openness/intellect, conscientiousness, extraversion, agreeableness, and neuroticism. These traits are measured on continuums and aim to capture the human personality at the fundamental level. Numerous researchers have agreed on the following general definitions of the Big Five domains (John et al., 2008; McCrae & Costa, 2010). Openness is the tendency to be creative and imaginative, characterized by the need for novelty and change. Conscientiousness is associated with the need for achievement and having a strong sense of purpose. It is marked by the tendency to be organized and responsible. Extraversion refers to a preference for sociability, companionship, and behavioral rewards, and
the tendency to be energetic and positive. Agreeableness is a factor that is associated with compliance and a tendency to cooperate in social situations, to avoid confrontation/conflict, and to forgive others. Lastly, neuroticism refers to a tendency to experience negative emotions, low selfesteem, and pessimism.
Prior research on the structure of the Big Five, such as the NEO Personality Inventory3 (NEOPI3; McCrae &. Costa, 2010) has focused on a two level hierarchy, where each of the five factors are broken down into six “facets,” for a total of 30 facets. For example, conscientiousness is broken down into the facets of competence, order, dutifulness, achievementstriving, selfdiscipline, and deliberation. Other researchers argue that the twolevel structure allows for considerable overlap between the facets (DeYoung et al., 2002; Jang et al., 2006; Markon et al., 2005; Saucier, 2003). To solve this issue, DeYoung et al. (2007) suggested an intermediate level, situated between the factor level and the facet level. The intermediate level serves to minimize the overlap created by the facet level while providing more specificity than the broad factor level. DeYoung et al. (2007) created the Big Five Aspect Scales (BFAS) to capture this intermediate level, which became known to personality researchers as the “aspect level.” In the BFAS framework, each of the five factors is divided into two aspects, creating ten total aspects. This separation of factors into aspects provides detailed and more accurate representation of personality and helps to capture meaningful psychological distinctions within each of the five broad traits (DeYoung et al., 2007). Since its development, the BFAS has become a widely utilized instrument in scientific research (Anglim et al., 2020; Bainbridge et al., 2022). Sun et al. (2018) applied the BFAS to their study of life outcomes. They found distinct patterns at the aspect level, where one aspect within each factor showed stronger relationships with the wellbeing variables. For example, they found industriousness to be associated with accomplishment and intellect with personal growth. In addition to its applicability in clinical settings, experts in the personality field have studied these aspectlevel associations to understand their influence in political settings (ChagasBastos, 2023; Hirsh et al., 2010; Xu et al., 2021) which is the focus of the present study. In the rest of this section, we will use DeYoung et al. (2007) as a guiding framework to provide a deeper understanding of the ten BFAS aspects.
Personality Aspects
Openness/intellect refers to the Big Five factor which is composed of the two differential aspects, labeled openness and intellect. Openness reflects an individual’s tendency to engage with aesthetic and sensory information, and
intellect reflects the engagement with abstract and philosophical ideas where they can employ logical reasoning and cognitive processing (DeYoung et al., 2013). For example, an artist and a scientist may both score the same on the factor openness/intellect, but on the aspectlevel, openness may account for most of the artist’s openness/intellect level, the scientist’s high intellect may account for most of the variance in their levels of the same factor. Although closely related, these aspects capture distinct nuances within the broader openness/ intellect factor (DeYoung et al., 2007).
The two aspects of conscientiousness are orderliness and industriousness. Orderliness involves perfectionism and a preference for routines, and Industriousness relates to productivity and work ethic. Someone high in orderliness but low in industriousness might rigidly stick to a set schedule, even if a more efficient option is available. For example, they might take the same route to work daily, ignoring a faster alternative. Someone high in industriousness would prioritize efficiency and goal completion, taking the faster alternative route and breaking their daily routine.
Extraversion consists of the aspects enthusiasm and assertiveness. The enthusiasm aspect differs from the assertiveness aspect in that the former refers to positive emotionality as an outcome of social interaction whereas the latter is characterized by actionable leader tendencies of these individuals in social settings (Zhang et al., 2022). Highly assertive individuals will be among the first to speak up, to raise their hand when a volunteer is needed, and to persuade others to see their point of view. For example, a confident business executive may excel in influencing others and taking charge during work meetings (a quality of those high in assertiveness). The same business executive may find themselves lost when trying to engage in small talk at the company Christmas party, whereas an individual scoring high on enthusiasm would feel right at home making small talk during the same event.
Agreeableness consists of the aspects compassion and politeness. compassion is marked by an emotional affiliation with others and driven by cognitive processes (Strauss et al., 2016), whereas politeness is more about respecting social norms and not wanting to be offensive (Hirsh et al., 2010; Osborne et al., 2013). For example, someone might avoid telling an offensive joke due to not wanting to appear rude. Someone high in compassion, however, is empathetic and altruistic, attuned to the needs of others and likely to feel when others are upset. Therefore, they may not tell an offensive joke because they genuinely care about the wellbeing of others and do not want to hurt someone’s feelings.
Neuroticism is composed of the aspects withdrawal and volatility. Both aspects refer to the expression of negative
affect; however they differ in the ways they are expressed. Withdrawal refers to the inhibition or internalization of negative emotional impulses, and is marked by facets such as depression, anxiety, and vulnerability. On the other hand, volatility, as its label suggests, refers to the externalizing of negative emotional impulses, and encompasses facets such as anger, impulsiveness, and instability. For example, when given negative feedback, a person who is high on the withdrawal aspect may ruminate over the feedback for days, whereas someone high on the volatility aspect may lash out at the person giving the negative feedback.
Political Orientation and Personality
Prior literature has established significant and consistent relationships between political orientation and some of the Big Five factors at the factor level. For example, openness/ intellect has been found to predict voting for liberal political parties (Mondak & Canache, 2014; Rentfrow et al., 2009; Vecchione et al., 2011), whereas conscientiousness predicts voting for conservative parties. Osborne et al. (2021) further showed that the negative relationship between openness/intellect (referred to as openness to experience in their research) and conservatism was twice as strong as the next strongest positive correlate, conscientiousness. The positive association between openness and liberalism may come from the trait’s relationship with curiosity, intellectual stimulation, and novelty seeking tendencies (Carney et al., 2008; Jost et al., 2003). Individuals high in the trait of openness are likely to prefer change and be more likely to support progressive policies that challenge traditional norms. Conscientiousness is characterized by a preference for structure and order, which aligns with the conservative values that emphasize stability, tradition, and responsibility over constant novelty and change (Gerber et al., 2010). Conservatives favor well established social institutions and hierarchies, which is tied to the structured nature of highly conscientious people.
Aspects and Political Orientation
Emerging evidence suggests that factorlevel analysis alone is insufficient, as aspectlevel traits provide a more nuanced understanding (Xu et al., 2021). In some cases, the two aspects of a trait relate inversely to political ideology, effectively canceling out the overall factor’s effect (Hirsh et al., 2010). For these reasons, aspects of the Big Five should be considered when studying the relationship between personality and political orientation. Few studies have systematically explored how aspects influence political orientation, but those that have suggest that broad traitlevel findings may obscure important distinctions at the aspect level. Although prior research has examined the links between openness, conscientiousness, and political orientation, the role of
agreeableness, extraversion, and neuroticism in these relationships remains unclear (Carney et al., 2008; Cotterill, 2023; Hirsh et al., 2010). For example, Xu et al. (2021) found that liberalism was positively associated with openness, compassion, and withdrawal, and negatively associated with orderliness, politeness, and assertiveness. Xu and Plaks (2023) further demonstrated that aspectlevel personality differences emerged even among voters within the same political party. Supporters of Biden in 2020 reported higher levels of withdrawal, while supporters of Clinton and Sanders in 2016 showed higher levels of volatility—both aspects of Neuroticism. In contrast, Trump supporters in 2016 reported lower levels of openness and higher levels of volatility, and in 2020 they reported lower levels of compassion and higher levels of industriousness. These findings suggest that personality traits associated with voter preferences may shift across election cycles and candidates, reflecting changes in political context and messaging.
These findings highlight a key limitation in previous research: because aspects of the same trait can predict opposing political outcomes, they can create a statistical issue where the broader Big Five factors appear to have no relationship with political orientation. This has been particularly evident in studies of agreeableness. For instance, researchers found that the compassion aspect of agreeableness was positively associated with liberalism (or negatively with conservatism), and politeness was positively associated with conservatism (Hirsh et al., 2010; Osborne et al., 2013). These findings suggest that failing to consider aspects could lead to misleading conclusions, as the contrasting effects within a trait may cancel each other out at the broad factor level.
Recognizing these issues, many researchers have called for future studies to examine the association between personality aspects and political attitudes and orientation (Cotterill, 2023; Hirsh et al., 2010; Xu et al., 2021). The importance of considering the aspect level in personality research on political attitudes is crucial, as it allows for a more granular and accurate understanding of these relationships.
Although the previous section focused on how aspectlevel traits relate to general political orientation, political ideology is not a unitary construct. Instead, it is often divided into distinct dimensions, most commonly social and economic attitudes (Duckitt & Sibley, 2009; Feldman & Johnston, 2014). These dimensions may relate differently to personality traits and aspects, making it important to examine not only overall ideology but also these specific ideological subtypes. The next section reviews literature that has examined the relationship between Big Five traits and social/economic political attitudes.
Social and Economic Attitudes
The relationships between the Big Five traits with social and economic attitudes are not well established. Some researchers found that openness/intellect positively predicts preference for both social and economic liberal policies (Gerber et al., 2010; Van Hiel et al., 2000), whereas conscientiousness positively predicts preference for both social and economic conservative policies. Secondly, Gerber et al. (2010) found that Agreeableness was positively associated with economic liberalism and social conservatism but lacked an association with overall selfreported ideology. Additionally, research has found positive associations between neuroticism and leftwing economic attitudes (Gerber et al., 2010; 2011; Verhulst et al., 2012), but other studies have failed to replicate this finding (Carney et al., 2008; Leeson & Heaven, 1999; Van Hiel & Mervielde, 2004). Similarly, positive associations have been found between extraversion and both economic and social conservatism (Gerber et al., 2010). It is evident that the effects of personality on social and economic political attitudes are unclear. Therefore, replication of these findings is necessary to add a meaningful contribution to the growing body of literature on the relationship.
Our Approach
Past research on political orientation has often relied on onedimensional models that measure political attitudes as a single liberal–conservative spectrum, overlooking the complexity that arises when distinguishing between social and economic dimensions (Conover & Feldman, 1981; Evans et al., 1996; Feldman & Johnston, 2014; Treier & Hillygus, 2009; Van Der Brug & Van Spanje, 2009). In addition, many studies have measured personality using only the broad Big Five traits, neglecting the more specific aspectlevel distinctions proposed by DeYoung et al. (2006). This study addresses both limitations by applying a multidimensional framework that distinguishes between social and economic dimensions of political orientation and evaluates whether aspectlevel personality traits offer greater explanatory power than broad factorlevel traits. Furthermore, we build on previous work by studying a sample from the Southeastern U.S.—a population underrepresented in much of the existing literature (Carney et al., 2008). Our sample also consisted primarily of emerging adults, a developmental group often overlooked in research on personality and political orientation, despite the fact that this period is formative for the development of both political identity and psychological traits (Stockemer et al., 2023).
By replicating key findings while refining methodological limitations, this study contributes to understanding how Big Five aspects relate to political attitudes and whether they offer deeper predictive value than the five original factors. The current study
aims to answer the research question: how are the Big Five aspects related to political attitudes, and do they provide a deeper understanding of these attitudes than the five original factors?
Hypotheses
Drawing on prior research showing positive associations between traits such as conscientiousness and political conservatism (Rentfrow et al., 2009; Vecchione et al., 2011), as well as studies linking personality traits to partisan affiliation in U.S. samples (Mondak & Canache, 2014), we formulated two related predictions. We predicted that (H1a) politeness, industriousness, orderliness, and overall conscientiousness would be positively associated with conservatism, and (H1b) positively associated with Republican party affiliation. We also predict (H2a) compassion, openness, intellect, and overall openness/ intellect will be positively associated with liberalism and (H2b) positively associated with Democratic party affiliation. Additionally, based on the findings of Hirsh et al. (2010) and Osborne et al. (2013), we hypothesize (H3) divergent aspect level associations among the agreeableness factor, specifically that (a) agreeableness will be negatively related to economic conservatism (positively related to economic liberalism) and (b) positively related to social conservatism (negatively related to social liberalism). To provide a more holistic answer to our research question, we also will test the final hypothesis (H4) that the aspect model will account for more variance in political orientation than the factor model. Since prior research has not provided consistent findings on the relationship between neuroticism aspects and political orientation, we do not make specific predictions regarding withdrawal and volatility in the current study.
Method
Participants
Participants responded to opportunities to volunteer for research at a large Southeastern university. At the time of data collection, approximately 58.4% of undergraduates were instate residents, while 41.6% were from out of state. Of the outofstate population, a substantial portion—approximately 44.4%—came from other Southern states (e.g. North Carolina, Georgia, Virginia, and Florida). Therefore, an estimated 77% of the undergraduate student body originated from the American Southeast (College Factual, 2023). One hundred thirtynine participants (83.5% female) completed a survey on Qualtrics between October 24, 2022 and May 8, 2023. The sample included undergraduate students, 96.4% of participants were between the ages of 18–24, and they were slightly right leaning ( M Cons = 57.04, SD = 16.03). Further demographic information can be
found in Table 1. The sample showed higher reported intentions to vote in 2024 compared to actual voting behavior in 2020, with more participants indicating planned support for the Republican party. Further voting behavior information can be found in Table 1.
Materials
The Big Five Aspects Scales (BFAS; DeYoung et al., 2007), the 12Item Social and Economic Conservatism Scale (SECS; Everett, 2013) and the essential demographic questions were implemented through Qualtrics for completion. The BFAS are empirically validated measurements to assess the Big Five dimensions of personality (DeYoung et al., 2007). The scales contain 100 Likertscale response items, with ten items measuring each of the ten aspects. The participants indicated their level of agreement with the items on a 5point Likert scale ranging from 1 (strongly disagree) to 5 (strongly agree), where higher scores reflect a stronger presence of that personality aspect. For example, the item “I get angry easily” measures the volatility aspect of neuroticism, and a high score would indicate greater emotional reactivity and a tendency toward irritability. Reliability and validity of the BFAS was demonstrated in DeYoung and colleague’s (2007) study. Cronbach’s α internal consistency for the scales in the present study ranged from .74 to .90, with a mean of .82 (see Table 2).
To measure political orientation, participants completed the 12 item SECS (Everett, 2013). The SECS assesses attitudes toward a range of political issues and yields both subscale scores and an overall conservatism score. Specifically, the scale includes two theoretically distinct subscales: Social Conservatism (e.g., attitudes toward abortion, traditional marriage, religion) and Economic Conservatism (e.g., views on taxes, private property, capitalism), each comprising six items. Participants rated their feelings toward each item using a slider ranging from 0 ( very negative ) to 100 ( very positive). Higher scores reflect greater endorsement of conservative values, while lower scores indicate more liberal attitudes. A composite conservatism score was calculated by averaging all 12 items, consistent with Everett’s (2013) recommendation for capturing general political conservatism. For example, a rating of 90 on the item “traditional marriage” would suggest strong support for socially conservative values. In the original validation study, Everett (2013) reported high internal consistency for the total SECS scale (α = .88), as well as for the Social (α = .87) and Economic (α = .70) subscales. The measure also demonstrated good construct validity, as SECS scores were strongly correlated with selfreported conservatism. In the present study, Cronbach’s alpha indicated good internal consistency for the SECS
TABLE 1
Descriptive Frequencies for Study Variables
TABLE 2
Means, Standard Deviations, and Cronbach’s Alpha Reliabilities for Study Constructs
total scale (α = .86) and the Social Conservatism subscale ( α = .86). However, due to the preliminary nature of the study, the Economic Conservatism subscale demonstrated low internal consistency in this sample (α = .57). See Table 2 for internal consistency for all study constructs.
To measure demographic characteristics, participants completed a brief questionnaire that included items on age (e.g., “18–24,” “25–34”) and gender identity (i.e., “Male,” “Female,” “Other,” “Prefer not to say”). In addition to demographic questions, the questionnaire included two behavioral measures of political orientation. The first asked which political party participants voted for in the 2020 U.S. presidential election (i.e., “Republican,” “Democrat,” “Green Party,” “I did not vote”), and the second asked which party they intended to vote for in the 2024 presidential election. Although these items referred to “party,” we interpreted responses as reflecting participants’ support for that party’s presidential candidate. This interpretation is consistent with how voting behavior is typically measured in survey research, particularly given that party identification strongly predicts presidential vote choice (Ko et al., 2025).
Procedure
This study was approved by Clemson University’s IRB
prior to data collection. Students were able to find and sign up for the study through the university’s Sona system in order to receive research credits. All participants provided written informed consent prior to participating. Participants were given the link to the Qualtrics survey and informed that completion of the survey would take 30 minutes. They were informed of the study’s purpose, notified that participation was voluntary, provided with an overview of the survey materials, and notified that they would receive extra credit upon completion of the survey. First, the students were asked to provide basic demographic information (age, gender, and political party affiliation). Next, they completed the BFAS and the 12 Item SECS. Upon completing the 30 minute survey, participants were thanked for their participation and provided with the appropriate research team member’s contact information to arrange a debriefing and receive additional information about the study’s purpose and procedures. They were compensated with Sona research credits through their university classes.
Results
A priori power analysis using G*Power 3.1.9 (Faul et al., 2009) indicated that a sample size of 126 would be sufficient to detect a medium effect size (r = .22) with 80% power at an alpha level of .05. Descriptive statistics,
TABLE 3
Correlations Between Study Variables
17.
including means, standard deviations, and internal consistency values (Cronbach’s α) for all study variables are presented in Table 2. The data met assumptions of normality and linearity. Pearson correlations were used to test H1a, H2a, H3a, and H3b; see Table 3 for the correlation matrix. Multiple regression analysis was utilized to test H4, and the results are presented in Table 4. Independentsamples t tests were used to test H1b and H2b, and the results are presented in Table 5.
H1: Politeness, Conscientiousness and Conservatism
H1a predicted that conservatism would be positively associated with politeness, overall conscientiousness, and its aspects industriousness and orderliness. Pearson correlations provided partial support for this hypothesis. Overall conservatism was significantly positively correlated with conscientiousness, r(137) = .17, p = .042, and industriousness, r(137) = .20, p = .021. Furthermore, social conservatism was also positively related to both factorlevel conscientiousness, r(137) = .19, p = .025, and industriousness, r(137) = .21, p = .011. However, politeness ( r (137) = .10, p = .225) and orderliness (r(137) = .12, p = .167) were not significantly associated with conservatism.
H1b predicted that Republican party voters would score higher than Democratic party voters in politeness, conscientiousness, industriousness, and orderliness. To maintain consistency, we included only data from participants whose reported party affiliation—interpreted as intended support for the party’s presidential candidate—remained consistent across both the 2020 and 2024 elections. Including only participants whose affiliation remained the same across both elections ensured that results from subsequent analyses reflected stability. This decision was made to reduce noise in the data while allowing for a more reliable interpretation of attitudinal differences across voters. Independentsamples t tests were conducted and provided partial support for H1b. Republican voters scored significantly higher than Democratic voters on conscientiousness, t(58.39) = 2.15, p = .046, d = 0.52 (M = 3.63, SD = 0.58 vs. M = 3.33, SD = 0.58), and on industriousness, t(56.48) = 2.02, p = .048, d = 0.50 ( M = 3.40, SD = 0.58 vs. M = 3.11, SD = 0.61). No significant group differences were found for politeness or orderliness. Full t test results are presented in Table 5.
H2: Openness/Intellect, Compassion, and Liberalism
H2a predicted that Compassion, Openness, Intellect, and overall Openness/Intellect would be positively associated with liberalism (i.e., negatively associated with
conservatism). This hypothesis was mostly supported. Significant negative correlations were found between overall conservatism and Compassion, r(137) = –.23, p = .007; Openness, r (137) = –.26, p = .002; and factorlevel Openness/Intellect, r(137) = –.24, p = .004. Openness was negatively associated with both social conservatism, r(137) = –.25, p = .003, and economic conservatism, r (137) = –.22, p = .008. Intellect was
negatively associated with social conservatism, r(137) = –.19, p = .027, but was not significantly associated with overall or economic conservatism.
H2b predicted that Democratic party voters would score higher than Republican party voters in compassion, openness, intellect, and overall openness/intellect. This hypothesis was partially supported. Democrats scored significantly higher than Republicans on the openness aspect, t(47.01) = –2.66, p = .004, d = –0.67 (Mdem = 3.87, SD dem = .76 vs. M rep = 3.42, SD rep = .57), and on the openness/intellect composite, t(49.65) = –2.39, p = .022, d = –0.60 (M = 3.84, SD = .60 vs. M = 3.52, SD = .49). However, compassion and intellect did not significantly differ by party affiliation.
H3: Agreeableness and Ideological Subtypes
H3 predicted that agreeableness would be (a) positively related to economic liberalism and (b) negatively related to social liberalism. This hypothesis was partially supported. Agreeableness was significantly positively associated with economic liberalism, r (137) = –.28, p < .001. Its aspects, compassion ( r (137) = –.25, p = .003) and politeness ( r (137) = –.22, p = .009), were also significantly related to economic liberalism. However, compassion was positively associated with social liberalism, r (137) = –.19, p = .025, contrary to H3b. Politeness was not significantly associated with social liberalism.
H4: Comparing Factor and Aspect Models
H4 predicted that the aspect model would account for more variance in political orientation than the factor model. This hypothesis was supported. In the first regression model, the Big Five factor scores significantly predicted conservatism, F (5, 138) = 4.11, p = .002, accounting for 13.4% of the variance. In the second model, the ten personality aspects also significantly predicted conservatism, F (10, 138) = 2.51, p = .009, accounting for 16.4% of the variance. Although both models explained a significant portion of the variance, the aspectlevel model accounted for an additional 3%, indicating a modest increase in explanatory power. This suggests that specific personality aspects may capture variation in political orientation that is not fully represented by the broader factor scores. Full regression results are presented in Table 4.
Exploratory Analyses
To further describe personality profiles associated with political orientation, we also examined other traits beyond those included in the formal hypotheses. Extraversion was positively associated with conservatism, r(137) = .20, p = .019. Additionally, neuroticism, r (137) = –.18,
p = .032, and its aspect withdrawal, r (137) = –.20, p = .016, were negatively associated with conservatism. These unpredicted findings suggest that emotional and social tendencies may also relate to political attitudes and warrant further investigation in future research.
Discussion
Research has shown that specific personality traits are related to an individual’s political leaning. However, most research on this relationship has not specifically examined the American Southeast (Carney et al., 2008). The current study extends what was previously known about the personality correlates of political leaning by replicating a vast majority of findings with a sample from college undergraduates at a large university in the Southeast.
H1: Conscientiousness and Conservatism
Most prior literature has identified conscientiousness as a stable personality predictor of conservatism (Hirsh et al., 2010). The current study replicated this finding, as conscientiousness positively predicted both overall and social conservatism. At the aspect level, industriousness, but not orderliness, was positively associated with overall conservatism and social conservatism; neither aspect of conscientiousness was related to economic conservatism. Republican voters scored significantly higher in conscientiousness and industriousness. These results support the claim that there are associations between conservatism and preferences for tradition, order, and stability.
Politeness was negatively associated with economic conservatism but was not significantly related to conservatism or social conservatism. The nonsignificant relationship between politeness and conservatism may be due to the cultural differences between Northern and Southern United States. Southerners possess a “culture of honor” (Cohen et al., 1996), as they act with politeness and hospitality so that they do not invoke violence from others. The Southeast is known to have a stereotype of being polite and reports the highest scores of agreeableness in the United States (Rentfrow et al., 2008); therefore, it is possible that the reason for not observing a significant relationship between politeness and conservatism in this sample of mostly southern students (College Factual, 2023) is due to this fundamental cultural difference.
H2: Openness/Intellect, Compassion, and Liberalism
In line with previous research, openness/intellect was positively associated with liberalism (Hirsh et al., 2010). Our aspectlevel findings regarding openness/intellect
align with more recent findings from Xu et al. (2021), as openness exhibited a robust positive relationship with overall, social, and economic liberalism. Intellect was only significantly (positively) associated with social liberalism. Xu et al.’s (2021) aspectlevel models showed exactly this pattern—with openness having broad liberal associations and intellect being more narrowly tied to the social dimension. A reason for this finding is because liberals tend to seek novelty and are more appreciative of diversity (Carney et al., 2008), whereas conservatives are more resistant to change (van der Toorn et al., 2017). Compassion was positively related to liberalism, including both social and economic liberalism, which also replicates the findings in Xu et al. (2021). However, Democratic voters scored significantly higher on openness and openness/intellect, but not intellect or compassion. These findings suggest that although openness includes aesthetic sensitivity, imagination, and preference for novelty, which align with liberal ideals, intellect’s association with abstract reasoning and curiosity may uniquely contribute to social liberalism. These results highlight the importance of examining personality at the aspect level.
H3: Agreeableness and Ideological Subtypes
Our findings contribute to the growing body of research examining the distinct psychological correlates of social and economic dimensions of political orientation. Consistent with Duckitt and Sibley’s (2010) perspective, our results support the idea that economic ideology is shaped by different traits than social ideology. Specifically, we found that overall agreeableness—along with its aspects, compassion and politeness—was positively associated with economic liberalism (i.e., negatively associated with economic conservatism). This association may reflect a broader prosocial orientation: agreeable individuals are typically more concerned with others’ welfare and therefore more supportive of welfare policies and efforts to reduce economic inequality (Gerber et al., 2010).
However, contrary to our hypothesis, we did not observe divergent aspectlevel associations between compassion and politeness in relation to social and economic ideology. One possible explanation lies in the dual process model of ideology (Duckitt & Sibley, 2009), which suggests that the effects of personality traits on social and economic attitudes are mediated by rightwing authoritarianism and social dominance orientation. These mediators may obscure or redirect direct associations between agreeableness and ideological subtypes.
Another potential explanation for the link between agreeableness and economic attitudes involves individuals’
perceptions of money and competition. Agreeable individuals tend to place less importance on money (Matz & Gladstone, 2020), which may make them less responsive to economic policy shifts. In contrast, individuals low in agreeableness often value power, are more sensitive to competition, and perceive greater resource scarcity (Sibley & Duckitt, 2008). These individuals are more likely to endorse economic conservatism, which favors limited government spending and reduced national debt—motivated, in part, by a desire to avoid personal economic vulnerability (Everett, 2013). This orientation reflects what Duckitt (2001; 2005) described as a competitive world view, in which the social world is seen as a zerosum environment with finite resources.
Taken together, these findings suggest that the association between low agreeableness and economic conservatism may be driven by underlying differences in worldview. Future research should directly assess participants’ beliefs about the social world to determine whether competitive worldviews mediate this relationship.
H4: Factor vs. Aspect Models
This study tested whether aspectlevel traits provide deeper insight into political orientation than factorlevel traits. Results indicated that aspectlevel traits explained more variance in conservatism than factorlevel traits. This supports the idea that aspectlevel models can offer a more granular understanding of political attitudes. For example, although openness/intellect did not significantly relate to economic conservatism overall, openness alone did. Likewise, intellect predicted social liberalism but not economic conservatism. Similarly, conscientiousness significantly predicted conservatism, but this relationship was largely driven by industriousness. These findings demonstrate that aggregate factorlevel scores may mask meaningful differences in how specific personality aspects relate to political beliefs.
Additional Findings: Neuroticism and Extraversion
Conservatism, specifically social conservatism, was negatively correlated with neuroticism, withdrawal and volatility, which replicates prior research that conservative ideologies are linked to higher emotional stability (Carney et al., 2008; Mondak & Halperin, 2008; Verhulst et al., 2012). This finding may be due to liberals being more attuned to, and concerned about, social inequalities, discrimination, and injustices (JanoffBulman, 2009). This heightened awareness of societal problems and their emotional impact can contribute to higher levels of neuroticism, as liberals may experience more distress related to these issues. Engagement in political activism
and advocacy can be emotionally taxing, especially when individuals perceive that their efforts are not resulting in the desired social or political changes. The stress and frustration associated with these activities can contribute to higher levels of neuroticism over time (Magnus et al., 1993; Saudino et al., 1997).
Further, social conservatism can be associated with strong community and family ties. Having a robust support network and social connections can reduce feelings of withdrawal and vulnerability, which could explain why neuroticism predicted social liberalism. Individuals with strong social support systems may feel more secure, less prone to emotional turmoil, and less inclined to exhibit neurotic traits. Waytz et al. (2019) found that conservatives express concern towards more welldefined and less permeable social circles, whereas liberals express concern towards less welldefined and more permeable social circles. Neuroticism is associated with social inhibition and lessdefined social groups (Waytz et al., 2019), which may explain why liberals were found to be more neurotic. Extraversion was found to be a significant positive predictor of economic conservatism, which replicates findings from Gerber et al. (2010). The relationships of extraversion with conservatism and neuroticism with liberalism provide support for findings that more conservatives report higher satisfaction with life and happiness, when compared to liberals (Taylor et al., 2006).
Limitations and Future Research
Internal Validity and Reliability
This study relied exclusively on selfreport measures of personality and political ideology, which introduces potential sources of bias such as social desirability and common method variance. Additionally, the administration order of the scales was not randomized, raising the possibility of order effects influencing participant responses. Future research should counterbalance the presentation of measures to reduce this potential bias and consider incorporating behavioral or observerrated measures to enhance validity. Another limitation concerns the internal consistency of the Economic Conservatism subscale of the SECS, which demonstrated a relatively low internal consistency (α = .57) in the current sample. This limitation is due to the preliminary nature of the findings in our study. Although we retained the subscale to maintain consistency with the original scale and prior research, interpretations involving this dimension should be made with caution. Future work may benefit from refining or supplementing the Economic Conservatism subscale items to improve internal consistency.
External Validity and Generalizability
The sample consisted primarily of female undergraduate
students from the American Southeast, which contributes to an underrepresented region in the literature but limits the broader generalizability of the findings. Notably, 83.5% of participants identified as female, introducing a gender imbalance that may have influenced the results, particularly given known gender differences in personality and political attitudes. Specifically, significantly more women identify as liberal than men (Saad, 2024). Women also tend to score higher on agreeableness and neuroticism (Weisberg et al., 2011), and men score higher on assertiveness and extraversion (Hofmann et al., 2025). Consequently, our sample’s skew toward women could have influenced the observed associations between personality and political orientation. Future research should prioritize more genderbalanced samples to better capture these dynamics across genders. Additionally, the age range of participants was largely confined to emerging adults, with 96.4% of participants between 18–24 years old. This developmental stage is associated with identity exploration and changing political attitudes, which may not reflect the patterns of older or more politically stable populations. Generalizing these findings to other age groups should be done cautiously.
A significant limitation is the absence of data on race/ethnicity and socioeconomic status. According to APA’s Journal Article Reporting Standards (Appelbaum et al., 2018), such demographic data are essential for evaluating generalizability. Without them, it is unclear to what extent the findings apply to racially or socioeconomically marginalized groups. As Dupree & Kraus (2022) note, omitting such variables may unintentionally reinforce assumptions of universality based on Whiteness and middleclass experience. Future studies should collect and transparently report these demographics and include Constraints on Generality statements to reflect on how sample composition may limit interpretations. Another limitation that effects the generalizability of our results is the size of observed correlations between personality aspects with social and economic conservatism. Although statistically significant, most of the observed correlations were small, with most rs < .30. As such, these findings should be interpreted with caution, as their generalizability to broader populations may be limited.
Furthermore, nearly half of the sample did not vote in the 2020 election. Most likely, a large majority of the sample did not meet minimum voting age requirements at the time. Future research should consider these limitations and reframe the political identification question to be more considerate of people who did not vote, or choose not to vote, in future elections. The Pew Research Center (2017) uses the following question in
their surveys: “In politics today, do you consider yourself a Republican, Democrat or Independent?”, which could be a better alternative than selfreported party voted for, since it allows researchers to capture how the participant currently identifies.
Although this study contributes new data from a Southeastern U.S. sample, the demographic composition —including gender, age, and voter behavior—limits its representativeness. Future work should replicate these findings in nationally representative or crosscultural samples to assess their broader relevance. For example, it would be valuable to test whether the observed associations between conscientiousness, openness/intellect, and political orientation are consistent across nonWestern cultural contexts.
Finally, some relationships appeared measurespecific. For example, Democrats scored higher in intuition, but participants who scored higher in liberalism in the SECS did not mirror this pattern. This suggests differences between ideological self identification and behavioral or trait based measures of political orientation, in that voting behavior reflects a partisan, identitybased choice, whereas selfreported social and economic political attitudes reflect an orientation on political policy and values. When studying personality, it is crucial to account for this methodological distinction because voting behavior and political attitudes load onto separate dimensions of political identity. Specifically, the former reflects partisan group affiliation while the latter reflects abstract beliefs/attitudes. Future research should further unpack these distinctions to better understand how ow behavioral, attitudinal, and traitbased measures each capture political ideology and link to personality.
Conclusions
These findings highlight that different political orientations may be associated with distinct patterns of personality traits. Individuals who lean conservative often value structure, personal responsibility, and social confidence—traits reflected in higher levels of conscientiousness, industriousness, and assertiveness. In contrast, those with more liberal views tend to be more open to new ideas and experiences, more likely to internalize negative emotions, and more attuned to the feelings of others, reflected in higher levels of openness/ intellect, withdrawal, and compassion.
Understanding these personality differences has several practical benefits. In political communication, this knowledge can inform the design of messages that resonate with individuals’ core psychological values—for instance, appealing to empathy in liberal audiences or duty and stability in conservative ones. In educational and organizational settings, acknowledging
that ideological differences may reflect stable personality traits can promote empathy and reduce interpersonal conflict. Rather than viewing political disagreement as purely ideological or moral, recognizing the personality underpinnings may reduce polarization by fostering greater understanding of the “other side.”
More broadly, these findings contribute to the refinement of political psychology theory by supporting an aspectlevel approach. Rather than assuming broad traits uniformly predict ideology, this study illustrates that specific aspects—such as openness versus intellect, or compassion versus politeness—offer a more accurate and predictive framework. By mapping these distinctions onto social and economic ideologies, this study supports calls for a more granular, psychologically grounded model of political belief systems.
References
Appelbaum, M., Cooper, H., Kline, R. B., Mayo-Wilson, E., Nezu, A. M., & Rao, S. M. (2018). Journal article reporting standards for quantitative research in psychology: The APA Publications and Communications Board task force report. American Psychologist, 73(1), 3–25. https://doi.org/10.1037/amp0000191
Anglim, J., Horwood, S., Smillie, L. D., Marrero, R. J., & Wood, J. K. (2020). Predicting psychological and subjective well-being from personality: A meta-analysis. Psychological Bulletin, 146(4), 279–323. https://doi.org/10.1037/bul0000226
Bainbridge, T. F., Ludeke, S. G., & Smillie, L. D. (2022). Evaluating the Big Five as an organizing framework for commonly used psychological trait scales. Journal of Personality and Social Psychology, 122(4), 749–777. https://doi.org/10.1037/pspp0000395
Carney, D. R., Jost, J. T., Gosling, S. D., & Potter, J. (2008). The secret lives of liberals and conservatives: Personality profiles, interaction styles, and the things they leave behind. Political Psychology, 29(6), 807–840. https://doi.org/10.1111/j.1467-9221.2008.00668.x
Chagas-Bastos, F. H. (2023). A comprehensive aspect-level approach to the personality micro-foundations of foreign policy attitudes. Personality and Social Psychology Bulletin https://doi.org/10.1177/01461672231213899
Cohen, D., Nisbett, R. E., Bowdle, B. F., & Schwarz, N. (1996). Insult, aggression, and the southern culture of honor: An “experimental ethnography.” Journal of Personality and Social Psychology, 70(5), 945–960. https://doi.org/10.1037/0022-3514.70.5.945
College Factual. (2023). Where are Clemson University students from? https://www.collegefactual.com/colleges/clemson-university/studentlife/diversity/chart-geographic-breakdown.html
Conover, P. J., & Feldman, S. (1981). The origins and meaning of liberal/ conservative self-identifications. American Journal of Political Science, 25(4), 617–645. https://doi.org/10.2307/2110756
Cotterill, B. F. (2023). Personality psychology, ideology, and voting behavior: Beyond the ballot. Palgrave Macmillan.
DeYoung, C. G., Peterson, J. B., & Higgins, D. M. (2002). Higher-order factors of the Big Five predict conformity: Are there neuroses of health? Personality and Individual Differences, 33(4), 533–552. https://doi.org/10.1016/S0191-8869(01)00171-4
DeYoung, C. G., Quilty, L. C., & Peterson, J. B. (2007). Between facets and domains: 10 aspects of the big five. Journal of Personality and Social Psychology, 93(5), 880–896. https://doi.org/10.1037/0022-3514.93.5.880
DeYoung, C. G., Quilty, L. C., Peterson, J. B., & Gray, J. R. (2013). Openness to experience, intellect, and cognitive ability. Journal of Personality Assessment, 96(1), 46–52. https://doi.org/10.1080/00223891.2013.806327
Duckitt, J. (2001). A dual-process cognitive-motivational theory of ideology and prejudice. In M. P. Zanna (Ed.), Advances in experimental social psychology, Vol. 33, pp. 41–113). Academic Press.
Duckitt, J. (2005). Personality and Prejudice. In J. F. Dovidio, P. Glick, & L. A. Rudman (Eds.), On the nature of prejudice: Fifty years after Allport (pp. 395–412). Blackwell Publishing. https://doi.org/10.1002/9780470773963.ch24
SUMMER 2026
PSI CHI JOURNAL OF PSYCHOLOGICAL RESEARCH
Personality and Political Orientation | Diggett and Cotterill
Duckitt, J., & Sibley, C. G. (2009). A dual-process motivational model of ideology, politics, and prejudice. Psychological Inquiry, 20(2/3), 98–109. https://www.jstor.org/stable/40646407
Duckitt, J., & Sibley, C. G. (2010). Personality, ideology, prejudice, and politics: A dual-process motivational model. Journal of Personality, 78(6), 1861–1893. https://doi.org/10.1111/j.1467-6494.2010.00672.x
Dupree, C. H., & Kraus, M. W. (2022). Psychological Science Is Not Race Neutral. Perspectives on Psychological Science, 17(1), 270–275. https://doi.org/10.1177/1745691620979820
Evans, G., Heath, A., & Lalljee, M. (1996). Measuring left-right and libertarianauthoritarian values in the British electorate. British Journal of Sociology, 47(1), 93–112. https://doi.org/10.2307/591118
Everett, J. A. (2013). The 12 item Social and Economic Conservatism Scale (SECS). PloS ONE, 8(12), e82131. https://doi.org/10.1371/journal.pone.0082131
Faul, F., Erdfelder, E., Buchner, A., & Lang, A.-G. (2009). Statistical power analyses using G*Power 3.1: Tests for correlation and regression analyses. Behavior Research Methods, 41(4), 1149–1160. https://doi.org/10.3758/BRM.41.4.1149
Feldman, S., & Johnston, C. (2014). Understanding the determinants of political ideology: Implications of structural complexity. Political Psychology, 35(3), 337–358. https://doi.org/10.1111/pops.12055
Gao, R., & Liu, H.-H. (2023). Political stability as a major determinant of the Covid-19 pandemic outcomes. Heliyon, 9(10), e20617. https://doi.org/10.1016/j.heliyon.2023.e20617
Gerber, A., Huber, G., Doherty, D., Dowling, C., Ha, S., Bullock, J., Fowler, J., & Gosling, S. (2010). Personality and Political Attitudes: Relationships Across Issue Domains and Political Contexts. American Political Science Review, 104 https://doi.org/10.1017/S0003055410000031
Gerber, A. S., Huber, G. A., Doherty, D., & Dowling, C. M. (2011). The Big Five Personality Traits in the Political Arena. Annual Review of Political Science, 14(Volume 14, 2011), 265–287. https://doi.org/10.1146/annurev-polisci-051010-111659
Hirsh, J. B., DeYoung, C. G., Xiaowen Xu, null, & Peterson, J. B. (2010). Compassionate liberals and polite conservatives: Associations of agreeableness with political ideology and moral values. Personality & Social Psychology Bulletin, 36(5), 655–664. https://doi.org/10.1177/0146167210366854
Hofmann, R., Rozgonjuk, D., Soto, C. J., Ostendorf, F., & Mõttus, R. (2025). There are a million ways to be a woman and a million ways to be a man: Gender differences across personality nuances and nations. Journal of Research in Personality, 115, 104582. https://doi.org/10.1016/j.jrp.2025.104582
Jang, K. L., Livesley, W. J., Ando, J., Yamagata, S., Suzuki, A., Angleitner, A., Ostendorf, F., Riemann, R., & Spinath, F. (2006). Behavioral genetics of the higher-order factors of the Big Five. Personality and Individual Differences, 41(2), 261–272. https://doi.org/10.1016/j.paid.2005.11.033
Janoff-Bulman, R. (2009). To provide or protect: Motivational bases of political liberalism and conservatism. Psychological Inquiry, 20(2/3), 120–128. https://www.jstor.org/stable/40646409
John, O. P. (2021). History, measurement, and conceptual elaboration of the BigFive trait taxonomy: The paradigm matures. In Handbook of personality: Theory and research, 4th ed (pp. 35–82). The Guilford Press.
Jost, J. T., Glaser, J., Kruglanski, A. W., & Sulloway, F. J. (2003). Political conservatism as motivated social cognition. Psychological Bulletin, 129(3), 339–375. https://doi.org/10.1037/0033-2909.129.3.339
Ko, H., Jackson, N., Osborn, T., & Lewis-Beck, M. S. (2025). Forecasting presidential elections: Accuracy of ANES voter intentions. International Journal of Forecasting, 41(1), 66–75. https://doi.org/10.1016/j.ijforecast.2024.03.003
Leeson, P., & Heaven, P. C. (1999). Social attitudes and personality. Australian Journal of Psychology, 51(1), 19–24. https://doi.org/10.1080/00049539908255330
Magnus, K., Diener, E., Fujita, F., & Pavot, W. (1993). Extraversion and neuroticism as predictors of objective life events: A longitudinal analysis. Journal of Personality and Social Psychology, 65(5), 1046–1053. https://doi.org/10.1037/0022-3514.65.5.1046
Matz, S. C., & Gladstone, J. J. (2020). Nice guys finish last: When and why agreeableness is associated with economic hardship. Journal of Personality and Social Psychology, 118(3), 545–561. https://doi.org/10.1037/pspp0000220
McCrae, R.R., & Costa, P.T., Jr. (2010). NEO inventories for the NEO Personality Inventory-3 (NEO-PI-3), NEO Five-Factor Inventory-3 (NEO-FFI-3), NEO Personality Inventory-Revised (NEO-PI-R) professional manual. Lutz, FL: Psychological Assessment Resources.
McCrae, R. R. (2020). The Five-Factor Model of Personality: Consensus and Controversy. In P. J. Corr & G. Matthews (Eds.), The Cambridge Handbook of
Personality Psychology (pp. 129–141). Cambridge University Press.
Markon, K. E., Krueger, R. F., & Watson, D. (2005). Delineating the structure of normal and abnormal personality: An integrative hierarchical approach. Journal of Personality and Social Psychology, 88(1), 139–157. https://doi.org/10.1037/0022-3514.88.1.139
Mondak, J. J., & Halperin, K. D. (2008). A framework for the study of personality and political behaviour. British Journal of Political Science, 38, 335–362. https://doi.org/10.1017/S0007123408000173
Mondak, J. J., & Canache, D. (2014). Personality and political culture in the American states. Political Research Quarterly, 67(1), 26–41. https://doi.org/10.1177/1065912913495112
Osborne, D., Satherley, N., & Sibley, C. G. (2021). Personality and ideology: A metaanalysis of the reliable, but non-causal, association between Openness and conservatism. In A. Mintz & L. Terris (Eds.), Oxford Handbook on Behavioral Political Science. Oxford University Press. https://doi.org/10.1093/oxfordhb/9780190634131.013.35
Osborne, D., Wootton, L. W., & Sibley, C. G. (2013). Are liberals agreeable or not? Politeness and compassion differentially predict political conservatism via distinct ideologies. Social Psychology, 44(5), 354–360. https://doi.org/10.1027/1864-9335/a000132
Pew Research Center. (2017). What low response rates mean for telephone surveys. Pew Research Center Methods. https://www.pewresearch.org/ methods/2017/05/15/what-low-response-rates-mean-for-telephone-surveys/
Rentfrow, P. J., Gosling, S. D., & Potter, J. (2008). A theory of the emergence, persistence, and expression of geographic variation in psychological characteristics. Perspectives on Psychological Science, 3(5), 339–369. https://doi.org/10.1111/j.1745-6924.2008.00084.x
Rentfrow, P. J., Jost, J., Gosling, S., & Potter, J. (2009). Statewide differences in personality predict voting patterns in 1996–2004 U.S. presidential elections. In J. T. Jost, A. C. Kay, & Hulda T. (Eds.), Social and psychological bases of ideology and system justification https://doi.org/10.1093/acprof:oso/9780195320916.003.013
Roberts, B. W., & Jackson, J. J. (2008). Sociogenomic personality psychology. Journal of Personality, 76(6), 1523–1544.
Saad, L. (2024, February 7). U.S. women have become more liberal; men mostly stable. Gallup News. https://news.gallup.com/poll/609914/women-becomeliberalmenmostlystable.aspx
Saucier, G. (2003). An alternative multi‐language structure for personality attributes. European Journal of Personality, 17(3), 179-205. https://doi.org/10.1002/per.489
Saudino, K. J., Pedersen, N. L., Lichtenstein, P., McClearn, G. E., & Plomin, R. (1997). Can personality explain genetic influences on life events? Journal of Personality and Social Psychology, 72(1), 196–206. https://doi.org/10.1037/0022-3514.72.1.196
Sibley, C. G., & Duckitt, J. (2008). Personality and prejudice: A meta-analysis and theoretical review. Personality and Social Psychology Review, 12(3), 248–279. https://doi.org/10.1177/1088868308319226
Stockemer, D., Thompson, H., & Sundström, A. (2023). Young adults’ underrepresentation in elections to the US House of Representatives. Electoral Studies, 81, 102554. https://doi.org/10.1016/j.electstud.2022.102554
Strauss, C., Lever Taylor, B., Gu, J., Kuyken, W., Baer, R., Jones, F., & Cavanagh, K. (2016). What is compassion and how can we measure it? A review of definitions and measures. Clinical Psychology Review, 47, 15–27. https://doi.org/10.1016/j.cpr.2016.05.004
Sun, J., Kaufman, S. B., & Smillie, L. D. (2018). Unique Associations Between Big Five Personality Aspects and Multiple Dimensions of Well-Being. Journal of Personality, 86(2), 158–172. https://doi.org/10.1111/jopy.12301
Taylor, P., Funk, C., & Craighill, P. (2006). Are we happy yet? (Social Trends Report). Pew Research Center. https://www.pewresearch.org/wp-content/ uploads/sites/3/2010/10/AreWeHappyYet.pdf
Tellegen, A. (1991). Personality traits: Issues of definition, evidence, and assessment. In D. Cicchetti & W. M. Grove (Eds.), Thinking clearly about psychology: Essays in honor of Paul E. Meehl, Vol. 1. Matters of public interest; Vol. 2. Personality and Psychopathology (pp. 10–35). University of Minnesota Press.
Treier, S., & Hillygus, D. S. (2009). The nature of political ideology in the contemporary electorate. Public Opinion Quarterly, 73(4), 679–703. https://doi.org/10.1093/poq/nfp067
Van der Brug, W., & Van Spanje, J. (2009). Immigration, Europe and the ‘new’ cultural dimension. European Journal of Political Research, 48(3), 309–334. https://doi.org/10.1111/j.1475-6765.2009.00841. x
SUMMER 2026
PSI CHI JOURNAL OF PSYCHOLOGICAL RESEARCH
Personality and Political Orientation | Diggett and Cotterill
van der Toorn, J., Jost, J. T., Packer, D. J., Noorbaloochi, S., & Van Bavel, J. J. (2017). In defense of tradition: Religiosity, conservatism, and opposition to same-sex marriage in North America. Personality & Social Psychology Bulletin, 43(10), 1455–1468. https://doi.org/10.1177/0146167217718523
Van Hiel, A., Kossowska, M., & Mervielde, I. (2000). The relationship between openness to experience and political ideology. Personality and Individual Differences, 28(4), 741–751. https://doi.org/10.1016/S0191-8869(99)00135-X
Van Hiel, A., & Mervielde, I. (2004). Openness to experience and boundaries in the mind: Relationships with cultural and economic conservative beliefs. Journal of Personality, 72(4), 659–686. https://doi.org/10.1111/j.0022-3506.2004.00276.x
Vecchione, M., Schoen, H., Castro, J. L. G., Cieciuch, J., Pavlopoulos, V., & Caprara, G. V. (2011). Personality correlates of party preference: The Big Five in five big European countries. Personality and Individual Differences, 51(6), 737–742. https://doi.org/10.1016/j.paid.2011.06.015
Verhulst, B., Eaves, L. J., & Hatemi, P. K. (2012). Correlation not causation: The relationship between personality traits and political ideologies. American Journal of Political Science, 56, 34–51. https://doi.org/10.1111/j.1540-5907.2011.00568.x
Waytz, A., Iyer, R., Young, L., Haidt, J., & Graham, J. (2019). Ideological differences in the expanse of the moral circle. Nature Communications, 10(1), 4389. https://doi.org/10.1038/s41467-019-12227-0
Weisberg, Y. J., Deyoung, C. G., & Hirsh, J. B. (2011). Gender differences in personality across the ten aspects of the Big Five. Frontiers in psychology, 2, 178. https://doi.org/10.3389/fpsyg.2011.00178
Widiger, T. A., & Crego, C. (2019). The Five Factor Model of personality structure: An update. World psychiatry: Official journal of the World Psychiatric Association (WPA), 18(3), 271–272. https://doi.org/10.1002/wps.20658
Xu, X., & Plaks, J. E. (2023). Aspect-level personality characteristics of U.S. Presidential candidate supporters in the 2016 and 2020 elections. Social Psychological and Personality Science, 14(5), 588–598. https://doi.org/10.1177/19485506221113954
Xu, X., Soto, C. J., & Plaks, J. E. (2021). Beyond openness to experience and conscientiousness: Testing links between lower‐level personality traits and
American political orientation. Journal of Personality, 89(4), 754–773. https://doi.org/10.1111/jopy.12613
Zhang, J., Yin, K., & Li, S. (2022). Leader extraversion and team performance: A moderated mediation model. PloS one, 17(12), e0278769. https://doi.org/10.1371/journal.pone.0278769
Author Note.
Savannah G. Diggett https://orcid.org/0009000817739967
Ben F. Cotterill https://orcid.org/0000000197022916
The authors declared no potential conflicts of interest with respect to the research, authorship, and/or publication of this article. The authors received no financial support for the research, authorship, and/or publication of this article. This study was approved by the Clemson University Research Ethics Committee (approval no. IRB20220177) on September 06, 2022. All participants provided written informed consent to conduct the study prior to participating. All participants provided written informed consent to publish the study prior to participating.
Savannah G. Diggett played a lead role in data collection, data analysis and interpretation, and substantive original writing, and a supporting role in research design. Ben F. Cotterill played a lead role in conceptualization and research design and a supporting role in substantive original writing, and provided supervision and editorial assistance
The datasets generated during and/or analyzed during the current study are available from the corresponding author on reasonable request. Special thanks go to undergraduate research student, Elizabeth Warren, for her contributions to this project. Correspondence concerning this article should be addressed to Savannah G. Diggett, Department of Methodology, London School of Economics and Political Science, Connaught House, 65 Aldwych, London WC2B 4DS, United Kingdom. Email: savannahdiggett@gmail.com
Perception and Recognition of Computer-Altered Face Images
April M. Drumm-Hewitt*1 and Addison F. Angstadt2
1Department of Psychology, Lycoming College
2Department of Psychology, Binghamton University
ABSTRACT. With the development of artificial intelligence (AI) technology and its increasing use online, it is rapidly becoming important to understand how humans interact with these technologies. This research investigated how humans perceive AIaltered face images. We used AI filters (Adobe, 2023) to alter images and measured participants’ perceived artificiality through the Godspeed Scales, a standardized measurement of perceptions in human–computer interaction (Bartneck et al., 2009), and Tobii eye tracking technology (Tobii AB, 2024). Key findings from Experiment 1 (N = 52) and Experiment 2 (N = 10) suggest that, although participants did rate altered images as more artificial on the Godspeed Scales, Wilks’ Lambda = .46, F(5, 48) = 8.07, p < .001, η2p = .46, they were not able to reliably identify AIaltered images (d = .00). Also in Experiment 2, participants fixated on the eyes of altered images less than those of original images, Total Fixation Duration: F(1, 20) = 6.25, p = .031, ηp2 = .39; Number of Fixations: F(1, 6.51) = 5.93, p = .029, η2p = .39, suggesting an aversion to uncanny faces. These findings may reveal a human bias against AIaltered images.
Keywords: artificial intelligence, neural filters, face perception, Godspeed Scales, eyetracking
It is increasingly important to understand how humans interact with artificial intelligence (AI) technologies. These technologies gather large amounts of data to then create an output designed to mimic the work of humans (IBM, 2024). With these technologies, companies have created programs that can either alter a user’s image or generate a new one entirely from scratch (e.g., Adobe Photoshop). The capabilities of AI programs that generate and alter images and videos are changing rapidly, with an increasing ability to mimic subtle biological features such as hair and skin texture, and even the complexion flushing patterns associated with the function of the circulatory system (Siebold et al., 2025). In an online environment where images are now commonly altered or entirely generated by AI, it is important to understand how this affects the perceptions of human observers, and whether humans are even aware they are viewing AI content. Some social media apps have begun tagging content as AIgenerated to inform users as to the source of the image or content (e.g. TikTok, Instagram), however, this is not a general practice across all social media
platforms. There are suggestions that AI use may be harmful to the perception of a company or individual (Arango et al., 2023; Mustak et al., 2023). This makes it important to study how consistently people can detect AI use, and how peoples’ perceptions are altered when viewing AI content.
The realism of the images generated by AI technologies is constantly in development, such that the ability to identify AIgenerated video or images with the naked eye will be increasingly difficult as the technology matures. At present, the final images these resources create may be realistic, but may also include some odd mistakes which are easily spotted by viewers. These mistakes range from generating images with unrealistic blurring, to generating realistic images of an impossible nature, such as yoga poses with extra limbs or umbrellas growing out of heads (Ross & Bliabaitė, 2023). With minimal training, viewers can become better at recognizing even realistic looking computergenerated images (Becker & Laycock, 2023; Holmes et al., 2016). One recent study found that participants presented with AIgenerated and natural faces could correctly
identify natural faces 76.8% of the time (Huang et al., 2024). However, other research has supported the idea that highquality AIgenerated images are difficult for humans to detect, often showing only approximately 55% accuracy (Lu et al., 2023; Nexcess, 2023; Samo & Highhouse, 2023). These findings suggest that the subtle inaccuracies of AIgenerated images are often not enough to make participants consciously aware or confident that the image is artificial.
Although participants may not be consciously aware that specific content is AIgenerated, they may still show differences in the perceptual processing of this content. A single study using event related potentials (ERPs) found that even when participants cannot consciously distinguish between natural and AI generated images, there are differences in brain activity (Moshel et al., 2022). Despite not knowing why, participants respond more favorably to humanmade artwork even if they cannot easily identify the source (Samo & Highhouse, 2023). People also tend to perceive AI generated deepfake videos as less empathetic and credible than videos of real humans (Kaate et al., 2023). Conversely, computergenerated influencers on social media are rated higher in attractiveness when they appear more anthropomorphically human (Ahn et al., 2022). Given these results, it seems likely that there are unconscious processes that identify image features as less human, which may lead to a prohuman bias.
Consumers may also consciously feel more negatively about AIgenerated or altered content. For example, when individuals are made aware of falsity in charity ads (in this case, ads that were created using AI), it can harm donation intentions by lowering viewers’ empathy (Arango et al., 2023). Similarly, when participants believe artwork to be humanmade, they report feeling more affinity toward it, regardless of whether or not it was actually made by humans (Demmer et al., 2023). As a consequence, it may be a risk for businesses to utilize AI technology in marketing campaigns, despite the potential benefits due to its lower costs (Gibbons, 2023).
Although several studies have suggested that AI images may elicit negative reactions from viewers, conversely, other studies have found that edited photos are often perceived as more attractive. Exposure to edited images has been shown to increase participants’ likelihood of editing their own photos (Wolfe & Yakabovits, 2022), a behavior that has been linked to negative effects on social media users’ mood and body image (Tiggemann et al., 2020). Some studies have even shown that participants are likely to perceive AIgenerated faces as more realistic than photos of actual faces and are therefore more likely to misidentify them as genuine human faces (Miller et al., 2023). Given the potential for
human bias against AI images alongside the widespread use of AI filters, there is a need to more precisely characterize how viewers perceive and emotionally respond to these images. For such a measure, we turned to previous studies of human perceptions for other types of artificial representations, such as robots.
The Uncanny Valley theory (Mori, 1970/2012; Wang et al., 2015) explains that as robots become more human like, humans tend to have more of an affinity for them, feeling that they are more likeable. This affinity increases until the human resemblance reaches the uncanny valley. In this “valley,” robots that are moderately humanlike can cause humans to feel a sense of eeriness while looking at the figure. As the natural humanness of a robot increases beyond the uncanny valley, viewers’ feelings of eeriness decrease and their feelings of affinity increase once again (Mori, 1970/2012). Mori also discovered that adding movement to the humanlike figure accentuates the uncanny valley curve. Although this idea was originally developed to describe human interactions with robots, some studies have also used the uncanny valley curve to study human reactions to computergenerated images, such as video game characters and online avatars (e.g., Tinwell et al., 2011; Shin et al., 2019). Although AIaltered images retain human characteristics from the original image, they are also partially altered, viewers may feel a sense of discomfort when they see these kinds of images. A standard measure of perceived uncanniness used by the humancomputer interaction community when developing robots could therefore be applied to AIaltered images as well. The Godspeed Scales (Bartneck et al., 2009) offer a reliable and descriptive measure in which participants rate stimuli on 24 Likert scales which are then summarized into 5 dimensions: anthropomorphism, animation, likeability, perceived intelligence, and perceived safety. Given the literature, it seems likely that AIaltered images would be rated as more artificial on the Godspeed scales than unaltered images.
Much of the current research on AI technology focuses on how to use it for information processing or completing functional tasks, such as diagnosing patients (Barua et al., 2024; Hsieh, 2023), checking for manufacturing defects (Aramkul & Sugunnasil, 2023), and even education (Mouti & Rihawi, 2023). In recent years, advances in computergenerated imagery have increased people’s exposure, through films and AI generated images, to figures that look human but are not actually human. It is essential to know whether humans perceive the subtle use of AI in images, and whether even subtle AI adjustment of photos can result in participants having a negative emotional reaction in comparison to unaltered images. In the following experiments we aimed to gain
insight into how people recognize and perceive altered photos of human faces using the Godspeed scales and eye tracking measures. Over two experiments, we hypothesized that (a) participants would rate AIaltered images as more artificial than unaltered images on the Godspeed scales, (b) participants would show poor recognition of which images were altered, and (c) eyetracking measures would show participants attended to altered and unaltered images differently.
Experiment 1
Individuals may perceive AIgenerated images of people as seeming more unnatural than authentic photographs, regardless of whether they can consciously identify the source of the images. Experiment 1 sought to discover whether participants perceived unnaturalness when viewing images of faces that had been altered using AI photo editing. As these images were originally authentic photos of human beings, they were more realistic than images which are entirely AIgenerated. We measured participants’ perceptions of artificiality for the AI altered images using the Godspeed Scales. Although the Godspeed Scales have been used previously to measure participants’ perceptions of artificiality, they have mostly been used for participants to rate robots, not subtly AIaltered human faces (Bartneck et al., 2009; Mori, 1970/2012). We hypothesized that participants would experience more of an uneasy or uncanny feeling when viewing AIaltered images, and that this would lead to more artificial perceptions of the images edited using Photoshop’s neural filters (Adobe, 2023) as compared to the original images. This would result in lower Godspeed Scale ratings for the altered images than for the original images.
Method Participants
Participants consisted of 56 individuals recruited via Prolific, 50% of which were female, 48.2% of which were male, and 1.8% of which were nonbinary. Ages ranged from 18–68 (M = 40.6, SD = 14.1). Participants selfidentified as 69.2% White, 11.5% Asian, 11.5% Black or African American, 5.8% multiracial, and 1.9% did not report. Participants were paid $2.57 through Prolific for their participation with support from the Joanne and Arthur Haberberger Fellowship, awarded at Lycoming College, Williamsport, PA.
Stimuli
Face images were collected from an online forum where users share pictures of themselves for others to view and rate. The images were chosen based on facial visibility, resolution, and plain backgrounds. Each of the original 20 images (10 male and 10 female), were edited in Photoshop to have a 72ppi resolution with height set
to 4 inches. Photoshop v.25 (Adobe, 2023) included AI powered “neural filters” which allowed a user to alter images on scales from 50 to +50 for happiness, facial age, hair thickness, eye direction, lighting direction, and other features. Using these AI filters, each stimulus was
TABLE 1
Photo Alteration Using AI “Neural” Filter Settings
FIGURE 1
Example Stimuli for Original and Altered Conditions
altered to increase or decrease happiness, and one of the following characteristics: hair thickness or eye direction (See Table 1 for alteration settings by item; see Figure 1 for example stimuli). Some images were altered to display an emotion different from the original expression, whereas others were made more extreme displays of the same emotion (e.g., a happy smile made happier). For each gender, an equal number of stimuli were adjusted to be happier and sadder. Each characteristic was altered within a range of +/ 5 to +/ 30, with +/ 25 as the most typical setting. A range was used to generate images that were judged by researchers to be visibly altered a similar amount by the Photoshop program. As the program uses a proprietary algorithm to determine the exact alterations made to each photo, there was some variation in the intensity or noticeability of the alterations from image to image. Some images had to be put through the neural filter at slightly different percentage settings to achieve an image that visibly appeared to have been altered a similar amount as others in the stimuli set.
Materials
The Godspeed scales were initially developed to measure participants’ affinity for robots (Bartneck et al., 2009). As a part of the original measure, participants must rate a robot from 1–5 on a variety of continuum scales (e.g., fakenatural, deadalive, unfriendlyfriendly). A lower number on each of the scales indicates a feeling of negativity or artificiality, whereas a higher number indicates a feeling of positivity or humanity. Ratings of the robot are grouped into subscales for Anthropomorphism, Animacy, Likeability, and Perceived Intelligence, each of which consists of five continuum scales. There is an additional subscale for Perceived Safety, in which participants rate their own emotional state on three continuum scales. The third item in the Perceived Safety scale is reverse coded.
In the present study, participants filled out a modified Godspeed Scales questionnaire that was altered to include the word “figure” instead of “robot,” (i.e., “Please rate your impression of the figure on these scales”). We also removed the Japanese words on the original questionnaire and removed the second instance of the scale “artificiallifelike,” (for full original scales, see Bartneck et al., 2009). Ratings for altered and original images were collected for each index in the Godspeed scales and were analyzed for internal consistency within each subscale (see Table 2 for previously published and our collected Cronbach’s alpha values). Our findings showed high internal consistency for each of the subscales except for the Safety subscale, which was marginal (α = .57). This may be partially due to the scale having fewer items than the other scales—only three instead of five—and
partially due to participants not understanding the quiescent–surprised scale as ‘quiescent’ is a much less frequently used descriptor than the others.
Design and Procedure
This study was approved by the Lycoming College Institutional Review Board (IRB #132 2023 24). Participants accessed the study through Prolific, where they were sent to a Survey Monkey form containing face images, the Godspeed Scales, and demographic questions. The independent variable was the version of the image displayed. Each participant saw 20 images presented in random order, some of which were altered and some of which were original. For each image trial, there was a 50% chance that a participant would be presented with the edited version. Participants did not necessarily see an equal number of edited and original images. Participants were told that some of the images they were viewing had been altered. The dependent variable was the rating of affinity given on the Godspeed Scales (Bartneck et al., 2009), which participants were asked to fill out in response to each image. Participants were not told which images were altered or unaltered, and they were not asked to judge whether the images had been altered. Participants rated each image on scales such as fake to natural, unfriendly to friendly, and awful to nice, among others. Additionally, as a part of the Godspeed Scales, participants rated their current emotional state on scales from anxious to relaxed, agitated to calm, and quiescent to surprised.
Results and Discussion
Ratings for individual items within each subscale were aggregated to reflect mean judgments for altered and original items from each participant for each of the Godspeed subscales. A MANOVA was performed with Photographic Alteration as a withinparticipants independent variable, and with dependent measures for the Godspeed subscales for Anthropomorphism, Animacy, Likeability, Perceived Intelligence, and Perceived Safety. The MANOVA confirmed our hypothesis that there
TABLE 2
Godspeed Scales Subscale Internal Consistency Analyses (Cronbach's Alpha) Bartneck et
Computer-Altered Faces | Drumm-Hewitt and Angstadt
would be an effect of Photographic Alteration on artificiality ratings as shown through the Godspeed Scales. AIaltered images were judged to be significantly more artificial than original images overall on the Godspeed Scales, Wilks’ Lambda = .46, F(5, 48) = 8.07, p < .001, η2 p = .46, with an observed posthoc power of 0.999. Using the Bonferroni adjustment (p < .05; see Figure 2 for all subscale means), this overall finding was accompanied by significant univariate test differences between altered and original images for the Godspeed subscales on Anthropomorphism, F (1, 52) = 27.25, p < .001, η2p = .34, Animacy, F(1, 52) = 12.71, p < .001, η2p = .19, and Safety, F(1, 52) = 4.14, p = .047, η2p = .07. Images that were altered by AI were rated as less anthropomorphic and less animate than original images. Additionally, participants rated themselves as feeling significantly less safe when viewing the altered images. These findings support the idea that even when not told which images are altered, participants can detect that there is something different or unnatural about them. No significant differences were found for the Likeability, F (1, 52) = 2.68, p = .11, or Perceived Intelligence, F(1, 52) = 1.65, p = .21, subscales, however the ratings for Likeability and Perceived Intelligence also show mean differences in the direction we would have expected—altered images were rated more artificial than the original versions for likeability and intelligence.
Experiment 2
Experiment 1 established that participants perceive AIaltered images as less human and less animate than unaltered images. However, it did not provide information about whether participants could consciously identify the altered images, or what facial features were being attended to as participants made those judgments. Experiment 2 was designed to further investigate the judgment differences found in Experiment 1.
Participants in Experiment 1 were not explicitly asked whether they believed the images were AIaltered. This was done to allow participants to make judgments of the images without focusing on looking for influences of AI in each one. In Experiment 2 we explicitly asked participants whether the image appeared to be AI altered just before they completed the Godspeed scales. One previous study found that participants were unable to consciously identify AIaltered images, yet still exhibited different ERP patterns while viewing them (Moshel et al., 2022). Moshel et al. did not use a rating scale as sensitive as the Godspeed scales in measuring participant perceptions of AI images and did not show whether these unconscious differences in brain activity would result in behavioral differences in reactions to AI generated content. To extend their findings, we hypothesized that
participants would have poor ability to consciously identify altered images but would nonetheless rate altered images as more artificial than original images through the Godspeed scales. This would indicate that although participants are not confident that the images have been altered, they still have an uncanny or unnatural feeling about them.
Also in Experiment 2, we utilized eye tracking to further investigate what features participants attended to when making their judgments of the images. In general, when viewing a real face, humans tend to fixate on the eyes, followed by the mouth, and then followed by the eyes again, in a triangular pattern (Arizpe et al., 2017; Iskra & Tomc, 2016). Although there is relatively little eyetracking research on AIaltered and generated face images, there has been research on both anthropomorphic images and deepfake videos. In an eyetracking study of service robots, researchers found that participants fixated on the least humanlike robot first and for the longest amount of time (Ene & Bădescu, 2019). Additionally, a database of deepfake videos and eyetracking data has found distinctive eye movements when participants view real and deepfake videos. When viewing a real video, participants explore the “background” space around the face more, whereas for a deepfake video, participants fixate longer on the face (Gupta et al., 2020). Additionally, recent findings on differences in viewing AIgenerated and real faces have shown that participants may view AI faces more carefully (Huang et al., 2024). This suggests that participants
FIGURE 2
Godspeed Subscale Ratings for Altered and Original Images in Experiment 1
viewing AIaltered faces may fixate more on altered images than on original images.
Alternatively, it is possible that an uncanny appearance of the altered faces could lead to reduced total fixation durations. It has been established that emotional valence of stimuli can influence looking preference and total fixation durations. Participants will commonly look toward positive stimuli (Guy et al., 2024), and away from stimuli that make them feel uncomfortable. Particularly, participants have been shown to persistently have significantly reduced fixation times for stimuli that lead to an increased sense of disgust (e.g., Armstrong et al., 2014; Armstrong, et al., 2022; Dalmaijer et al., 2021).
The Uncanny Valley Effect is one in which participants experience a feeling of unease and possibly disgust with the unnatural or artificial object they are viewing (Mori, 1970/2012). If participants experience a feeling of unnaturalness when viewing AI altered images, we might expect that they would look away from the altered images sooner, resulting in lower total fixation durations. Therefore, in Experiment 2 we hypothesized that AIaltered images may be attended to differently, resulting in a difference in looking patterns and ultimately lower ratings on the Godspeed scales similar to what we observed in Experiment 1. The stimuli used in Experiment 1 had alterations in areas of interest (AOIs) for the eye, mouth, and hair regions. These same stimuli were used again for Experiment 2, with the AOI regions identified in Tobii Pro Lab.
Method
Participants
An a priori power analysis was conducted using G*Power (Faul et al., 2007) to determine the sample size for Experiment 2. The effect observed in Experiment 1 (η2p = .46) was conservatively adjusted by a factor of 0.75 to reduce potential overestimation (adjusted η2p = .345). With α = .05 and desired power (1 − β) = .80 for the planned analyses, this adjusted effect size indicated that a sample of 12 participants would be sufficient to detect the large effect. Unfortunately, due to time and resource constraints in the data collection period, the sample size was smaller than originally planned. Participants consisted of 11 Lycoming College students, 10 of whom were female and 1 of whom was nonbinary. Ages ranged from 18–22 years (M = 19.7, SD = 1.5). Participant ethnicity was not recorded. Participants were recruited via flyers and email and were compensated $5 for their time with support from the Joanne and Arthur Haberberger Fellowship, Lycoming College, Williamsport, PA.
Materials
Experiment 2 utilized the same modified Godspeed
Scales as Experiment 1. Ratings for altered and original images for each index in the Godspeed scales were again analyzed for internal consistency within each subscale (see Table 2). Our findings showed high internal consistency for each of the subscales except for the Safety subscale, which was again marginal (α = .57). One additional question was presented to participants for each image before the Godspeed Scales: “Do you believe that this image has been altered by AI technology?” Participants simply answered “No” or “Yes” with a button press and continued to the Godspeed scales.
Stimuli and Apparatus
This experiment utilized the Tobii Pro Spectrum 250Hz screenbased eye tracking bar run through Tobii Prolab (Tobii AB, 2024). Participants were calibrated in Tobii Pro Lab with a viewing distance of 50–60cm. Stimuli were displayed on a monitor with a 24inch diagonal and 1920 x 1080 resolution. The same stimuli pairs from Experiment 1 were imported into Tobii Pro Lab (Tobii AB, 2024) where we set area of interest (AOI) masks on the images to record participants’ eye movements and fixations through the regions “eyes,” “mouth,” and “hair” as those regions were the areas modified using the Photoshop neural filters (Adobe, 2023) for Experiment 1.
Design and Procedure
This study was approved by the Lycoming College Institutional Review Board (IRB# 162_2023 2024). Participants completed a calibration in Tobii Pro Lab and then were presented with a fixation cross on the left side of the screen for three seconds. After fixation was established, participants saw either the altered or original version of each stimulus pair for five seconds while eye tracking measurements were taken. After the five seconds had passed, the image was removed from the screen and participants were asked a yes/no question about whether they believed the image to be altered by AI technology and responded with a key press. They then responded to the Godspeed Scales questions (Bartneck et al., 2009) for each image one at a time using a key press response.
Results and Discussion
In keeping with Experiment 1, for Experiment 2 the Godspeed Scales were analyzed through a MANOVA performed with Photographic Alteration as a withinparticipants independent variable, and with dependent measures for the Godspeed subscales for Anthropomorphism, Animacy, Likeability, Perceived Intelligence, and Perceived Safety. One participant did not contribute full data due to a technological error
mid session; therefore the analyses are based on 10 participants. Given the small sample which lacked diversity, the generalizability of our findings is limited. The MANOVA did not show a significant overall effect of Photographic Alteration, Wilks’ Lambda = .18, F(5, 5) = 3.93, p = .08, η2p = .79, (1 – β) = .54. It is likely that with a larger sample this finding could have more power and become significant, however. Our planned univariate tests for the Godspeed subscales indicate significant differences between the altered and original versions for Anthropomorphism, F (1, 9) = 16.78, p = .003, η2p = .65, and Animacy, F(1, 9) = 5.45, p = .04, η2 p = .38, (see Figure 3 for all Experiment 2 subscale means). Although not statistically significant, the differences in ratings for Likability, F (1, 9) = 3.15, p = .11, η2p = .26, Perceived Intelligence, F(1, 9) = 1.81, p = .21, η2p = .17, and Perceived Safety, F(1, 9) = 1.17, p = .31, η2p = .12, also showed the same pattern: altered images were judged as less likeable, intelligent, and safe than the original images. Although not significant with this small sample, the trend of these findings in combination with the findings in Experiment 1 gives some further support that altered images were rated to be more unnatural overall than the original images. For Experiment 2, an additional question was added to each trial which did not appear in Experiment 1. Participants were asked whether they believed each image was an AI image. A signal detection analysis revealed a d’ value close to zero (d’ = 0.00137), indicating chance performance at detecting when a photo was altered. Participants were likely guessing, as they only correctly identified AIaltered images 33% of the time (see Table 3). This is notably lower than the accuracy levels found in previous studies. In one previous study, participants were able to correctly identify the fully AI generated images 55.8% of the time (Lu et al., 2023), and others have found that participants could only correctly identify AIgenerated images 53.36% of the time (Nexcess, 2023). The lower accuracy found in our study may be due to the subtlety of the AIaltered images we used as opposed to fully AIgenerated images used in other studies, or to our small sample size. Our participants appeared to be fairly conservative about saying that an image was AIaltered, as they were overall more likely to judge images as original (54.5%) than altered (45.5%).
Initial Looking Measures
To assess whether participants initially viewed the altered images differently than unaltered images, analyses were carried out on the eye tracking data for Time to First Fixation (TFF) and First Fixation Duration (FFD; see Table 4 for initial looking measure means). Time to
First Fixation was compared for each of the AOIs using a repeated measures 2 x 3 ANOVA with Alteration (altered, not altered) and AOI (eyes, mouth, hair) as factors. Alteration alone did not reliably affect TFF, F(1, 8) = 0.16, p = .70, however there was a significant effect of AOI, F (2, 16) = 14.30, p < .001, η p 2 = .64.
TABLE 3
Signal Detection for Altered vs. Original Stimuli in Experiment 2
Judgement
TABLE 4
Means and Standard Deviations for Initial Looking Pattern Metrics by Area of Interest (AOI)
FIGURE 3
Godspeed Subscale Ratings for Altered and Original Images in Experiment 2
Participants looked at the eyes after a shorter delay ( M = 713.70 ms, SD = 450.48 ms) than the mouth (M = 1454.88 ms, SD = 788.06 ms), or hair (M = 2813.45 ms, SD = 1158.78 ms), however only the difference between the eyes and hair was significant (Bonferroni, p < .05). There was no interaction of Alteration and AOI for TFF, F(2, 16) = 1.52, p = .25. The TFF data demonstrates that regardless of photo alteration, participants were most likely to look at the eyes as their first view of the face, followed by the mouth, and much later the hair. Two participants never looked at the hair in unaltered photos, and so their data was eliminated from the repeated measures ANOVA, however this also further illustrates that the hair was not a highly important feature to participants when viewing the face stimuli.
To further investigate the initial looking behavior of participants, a repeatedmeasures 2 x 3 ANOVA was also carried out for First Fixation Duration with Alteration (altered, not altered) and AOI (eyes, mouth, hair) as factors (see Table 4 for initial looking measure means). Alteration did not reliably affect FFD, F(1, 10) = 1.15, p = .31, however there was again a significant effect of AOI, F(2, 20) = 5.52, p = .01, ηp2 = .36. Participants spent more time looking at the eyes (M = 219.36 ms, SD = 70.83 ms) than the mouth ( M = 249.69 ms, SD = 249.69 ms) or hair (M = 160.64 ms, SD = 160.63 ms) regardless of Alteration, however these differences were not statistically significant using the Bonferroni correction ( p > .05). There was no interaction of Alteration and AOI for FFD, F(2, 20) = 1.45, p = .26. The FFD data demonstrates that despite having been told that images could be AI altered, and that they were supposed to try to identify the altered photos, participants initially retained a typical looking pattern (Arizpe et al., 2017) of viewing the eyes and mouth more than other areas of the face. Taken together, the current TTF and FFD results demonstrate that simply knowing the photo might be AI altered did not appear to change the typical initial looking pattern for faces in our participants.
Duration Looking Measures
To measure how participants attended to the AOIs over the duration of the five second image presentation, we analyzed participants’ Total Fixation Duration (TFD) and Number of Fixations (NF; see Table 5 for means of attention over the duration). A repeated measures 2 x 3 factorial ANOVA for Total Fixation Duration was carried out with Alteration (altered, not altered) and AOI (eyes, mouth, hair) as factors. Photograph Alteration significantly affected TFD, F(1, 20) = 6.25, p = .031, ηp2 = .39, such that participants viewed altered images ( M = 762.98 ms, SD = 333.75 ms) for significantly less time than unaltered images ( M = 849.67 ms,
SD = 351.93 ms). AOI also significantly affected TFD, F(2, 20) = 50.85, p < .001, η2p = .84, with all AOIs significantly different from one another (Bonferroni, p < .001). Participants reliably spent more time looking at the Eyes ( M = 1715.44 ms, SD = 604.36 ms) than the Mouth ( M = 606.06 ms, SD = 333.95 ms), and spent only a negligible amount of time looking at the Hair (M = 97.47 ms, SD = 90.19 ms). For the interaction between Alteration and AOI, Mauchley’s Test of Sphericity was significant, χ2(2) = 16.66, p < .001, so the GreenhouseGeisser adjustment was used. There was a significant interaction, F (1.09, 10.85) = 5.93, p = .031, η2p = .37, which showed that participants spent significantly less time looking at the eyes of altered faces (M = 1535.84 ms, SE = 184.99 ms) in comparison to unaltered ones (M = 1895.04 ms, SE = 179.46 ms; Bonferroni, p < .05). This pattern was not seen for the “Mouth” or “Hair” AOIs (see Figure 4).
To further investigate looking patterns over the
TABLE 5
Means and Standard Deviations for Attention Eye Tracking Metrics by Area of Interest (AOI)
FIGURE 4
Total Fixation Duration Means by Area of Interest (AOI)
Note. *Significant difference, Bonferroni, p < .05. Error bars show standard error of the mean.
Computer-Altered Faces | Drumm-Hewitt and Angstadt
duration of image presentation, a 2x3 repeated measures ANOVA on Number of Fixations (see Table 5 for means of attention over the duration) was also conducted. There was a significant effect of Alteration, F(1, 6.51) = 5.93, p = .029, η2p = .39, a significant effect of AOI, F(2, 20) = 50.53, p < .001, η2 p = .84, and a significant interaction, F(1.07, 10.74) = 7.64, p = .017, η2p = .43. For the interaction between Alteration and AOI, Mauchley’s Test of Sphericity was again significant, χ2(2) = 17.824, p < .001, and the Greenhouse Geisser adjustment was used. Like the findings for TFD, the NF analyses also found that participants specifically viewed the eyes of altered images (M = 6.12 fixations, SE = .65 fixations) less than original images (M = 7.54 fixations, SE = .76 fixations; Bonferroni, p < .05) but showed no difference in viewing time for the mouth or hair (see Figure 5).
Taken together, the results from the TFD and NF measures demonstrate that participants not only spent more time overall looking at the eyes of unaltered photos, but they came back to looking at the unaltered eyes more frequently than altered ones. This is in contrast with the findings of others that have shown participants focusing more on AIgenerated photos (Huang et al., 2024), artificial looking robots, and deepfakes (Ene & Bădescu, 2019; Gupta et al., 2020). Rather than finding that participants focused more on the AIaltered images, our findings are consistent with the literature on disgust avoidance (e.g., Armstrong et al., 2014). Our small and homogenous sample limits generalizability; however, our findings support the idea that our participants may have avoided looking at the AIaltered images as they felt that the images were disturbing or unnatural in some way. Although participants could not directly identify the AIaltered faces when asked, they did show evidence of an unconscious difference in their looking pattern.
General Discussion
Artificial intelligence is increasingly being used to alter and generate photos that are posted online and on social media platforms. Despite the regular appearance of altered images in daily internet use, previous findings have suggested that viewers do not easily identify AIaltered or generated images (Lu et al., 2023; Nexcess, 2023; Samo & Highhouse, 2023) and may in fact believe AIgenerated images are hyperreal (Miller et al., 2023). Our present findings support the idea that viewers do not reliably detect which images have been altered using AI, even when told that they would be judging images for potential alteration. Participants demonstrated a bias to assume the photo was unaltered. The visual differences in stimulus pairs we used for the present experiments were presumably more subtle than the fully AIgenerated images used in previous studies. This
resulted in even less participant accuracy at detecting AI images than has been previously found (Lu et al., 2023; Nexcess, 2023).
Previous studies have shown that viewers respond negatively to AI art and advertising (e.g., Ahn et al., 2022; Kaate et al., 2023; Samo & Highhouse, 2023), computergenerated video game characters (Tinwell et al., 2011) and hyperrealistic avatars (Shin et al., 2019). This feeling of unease with artificial images is in line with the idea of the Uncanny Valley phenomenon originally observed in humans’ reactions to humanlike robots (Mori, 1970/2012; Wang et al., 2015). Our findings show that participants also responded negatively to AIaltered face images. Although our participants showed poor accuracy at consciously identifying which images were altered, they still rated the altered images as significantly more artificial than the original images on the Godspeed scales. Participants in Experiment 1 rated altered images as significantly less anthropomorphic, animate, and safe than unaltered images. Although with a much smaller and less generalizable sample in Experiment 2, participants still seemed to rate the altered images as less anthropomorphic, animate, and likeable than unaltered images.
It was possible that the subtlety of our manipulation might have led participants to have a high affinity for the images regardless of AI alteration. Previous studies have found AI images to be judged more attractive (Wolfe & Yakabovits, 2022), and more reallooking than photos of actual faces (Miller et al., 2023); however, that is not what we found. Despite our subtle manipulation, participants still detected the alteration in some implicit way, demonstrating a bias against almosthuman figures
Note. *Significant difference, Bonferroni, p < .05. Error bars show standard error of the mean.
FIGURE 5
Mean Number of Fixations by Area of Interest (AOI)
through their ratings on the Godspeed Scales. Taken along with the poor accuracy of identifying altered images, these results show an unconscious difference in the processing of AI images. This finding is in keeping with Mochel et al.’s (2022) conclusion that even when participants could not consciously identify AI images, there were differences in brain activity for participants viewing artificial and real images.
In addition to ratings on the Godspeed Scales, the evidence from participants’ eye movements in Experiment 2 suggests that they experienced a feeling of unnaturalness for AIaltered images. The Uncanny Valley Effect shows that participants experience a feeling of unease and possibly disgust with the unnatural or artificial object they are viewing. Although some literature has suggested that AI images may draw more attention (Ene & Bădescu, 2019; Gupta et al., 2020; Huang et al., 2024) previous literature on eye movements suggests that it is common for participants to look away or look less at an image that increases their sense of disgust (e.g., Armstrong et al., 2014; Armstrong, et al., 2022; Dalmaijer et al. 2021). Our participants spent significantly less time looking at the altered images. This attentional difference was not in their initial looking pattern, but over the duration of each trial. Participants fixated fewer times on the eyes of AIaltered faces as compared to unaltered images, and for shorter amounts of time, suggesting a pattern of avoidance. Although our sample in Experiment 2 was very small, with limited generalizability due to having no male participants and a lack of other demographic information, the agreement of the significant eye tracking data with the findings from the Godspeed Scales ratings in both Experiments 1 and 2 increases confidence in the reliability of our findings. Although we believe our findings to reflect real differences in how participants viewed AIaltered images, there are notable limitations to our study. Due to time and resource constraints in data collection for Experiment 2, our small sample size, lack of ethnicity data, and lack of male participants limited our power to find the effect of AIalteration and limits the generalizability of our findings. Future studies should examine eyetracking and ratings data in a larger and more diverse sample. Additionally, in both experiments, the presentation of stimuli was randomized for order and condition selection, but trials were not counterbalanced due to limitations of the presenting software. It is possible that some participants saw slightly more AIaltered images whereas others saw slightly more unaltered images. Future studies should control for counterbalancing of stimulus conditions. Future studies could also investigate a more graded view of participants’ abilities and perceptions in identifying the differences of fully AI images,
AIaltered, and unaltered images. It is also possible that the subtle featural differences which unsettle participants when viewing AI faces may not matter or even cause more affinity for images of objects that are AI generated or altered. We therefore propose that future studies could investigate whether these findings are generalizable beyond faces to images of objects and products.
The suggestion of this research is that viewers may react to AIaltered and AIgenerated images of humans in an adverse way without knowing why. Viewers may have an implicit bias against AIaltered images, as seen in our study by higher levels of perceived artificiality on the Godspeed Scales, fewer fixations and lower fixation durations on the eyes of altered images, and a participant preference to assume images were unaltered. Other research has suggested before that human viewers may have a bias against fully AIgenerated images (e.g, Arango et al., 2023; Demmer et al., 2023; Gibbons, 2023; Kaate et al., 2023; Samo & Highhouse, 2023). More research on implicit reactions to AIaltered and generated images is needed, however. Given our present findings, it seems that even using AIaltered images may result in less viewing of the content. If AI images truly elicit a disgust and avoidance response in viewers, the use of AI images would result in ineffective marketing campaigns for businesses, political figures, or online content creators. Educational resources made with AI images may also be less effective at retaining students’ attention than resources with natural images. Further research could hopefully inform content creators and marketers as to the best use of AI imagery to draw viewers’ attention where it is wanted, rather than inspiring avoidance in consumers. More natural images may result in increased viewing, and higher affinity for the people and products being pictured. The implications of this research as AI images and videos now saturate online content should not be minimized.
Ahn, R. J., Cho, S. Y., & Tsai, W. S. (2022). Demystifying computer-generated imagery (CGI) influencers: The effect of perceived anthropomorphism and social presence on brand outcomes. Journal of Interactive Advertising, 22(3), 327–335. https://doi.org/10.1080/15252019.2022.2111242
Aramkul, S., & Sugunnasil, P. (2023). Intelligent IoT framework with GAN‐synthesized images for enhanced defect detection in manufacturing. Computational Intelligence. https://doi.org/10.1111/coin.12619
Arango, L., Singaraju, S. P., & Niininen, O. (2023). Consumer responses to AIGenerated charitable giving ads. Journal of Advertising, 52(4), 486–503. https://doi.org/10.1080/00913367.2023.2183285
Armstrong, T., McClenahan, L., Kittle, J., & Olatunji, B. O. (2014). Don’t look now! Oculomotor avoidance as a conditioned disgust response. Emotion, 14(1), 95–104. https://doi.org/10.1037/a0034558
Armstrong, T., Stewart, J. G., Dalmaijer, E. S., Rowe, M., Danielson, S., Engel, M., Bailey, B., & Morris, M. (2022). I’ve seen enough! Prolonged and repeated exposure to disgusting stimuli increases oculomotor avoidance. Emotion, 22(6), 1368–1381. https://doi.org/10.1037/emo0000919
SUMMER 2026
PSI CHI JOURNAL OF PSYCHOLOGICAL RESEARCH
Arizpe, J., Walsh, V., Yovel, G., & Baker, C. I. (2017). The categories, frequencies, and stability of idiosyncratic eye-movement patterns to faces. Vision Research, 141, 191–203, https://doi.org/10.1016/j.visres.2016.10.013
Bartneck, C., Kulić, D., Croft, E., & Zoghbi, S. (2009). Measurement instruments for the anthropomorphism, animacy, likeability, perceived intelligence, and perceived safety of robots. International Journal of Social Robotics 1, 71–81. https://doi.org/10.1007/s12369-008-0001-3
Barua, P. D., Vicnesh, J., Lih, O. S., Palmer, E. E., Yamakawa, T., Kobayashi, M., & Acharya, U. R. (2024). Artificial intelligence assisted tools for the detection of anxiety and depression leading to suicidal ideation in adolescents: A review. Cognitive Neurodynamics, 18(1), 1–22. https://doi.org/10.1007/s11571-022-09904-0
Becker, C., & Laycock, R. (2023). Embracing deepfakes and AI‐generated images in neuroscience research. European Journal of Neuroscience, 58(3), 2657–2661. https://doi.org/10.1111/ejn.16052
Dalmaijer, E. S., Lee, A., Leiter, R., Brown, Z., & Armstrong, T. (2021). Forever yuck: Oculomotor avoidance of disgusting stimuli resists habituation. Journal of Experimental Psychology. General, 150(8), 1598–1611. https://doi.org/10.1037/xge0001006
Demmer, T. R., Kühnapfel, C., Fingerhut, J., & Pelowski, M. (2023). Does an emotional connection to art really require a human artist? Emotion and intentionality responses to AI- versus human-created art and impact on aesthetic experience. Computers in Human Behavior, 148, 107875. https://doi.org/10.1016/j.chb.2023.107875
Ene, I., & Bădescu, R. (2019). Eye tracking study regarding the perception of AIbased service robots. Proceedings of the 5th International Conference on New Trends in Sustainable Business and Consumption, pp. 718-723. https://conference.ase.ro/papers/volume/Volum%20BASIQ%202019.pdf
Faul, F., Erdfelder, E., Lang, A.-G., & Buchner, A. (2007). G*Power 3: A flexible statistical power analysis program for the social, behavioral, and biomedical sciences. Behavior Research Methods, 39, 175–191. https://doi.org/10.3758/BF03193146
Gibbons, M. (2023, December 11). The 6 best AI image generators for your marketing needs. WebFX. https://www.webfx.com/blog/web-design/best-ai-image-generator/ Gupta, P., Chugh, K., Dhall, A., & Subramanian, R. (2020). The eyes know it: FakeET- an eye-tracking database to understand deepfake perception. In Proceedings of the 2020 international conference on multimodal interaction, 519–527. https://doi.org/10.1145/3382507.3418857
Guy, N., Sklar, A., Amiaz, R., Golan, Y., Livny, A., & Pertzov, Y. (2024). Individuals vary in their overt attention preference for positive images consistently across time and stimulus types. Scientific Reports. 14. https://doi.org/10.1038/s41598-024-58987-8
Holmes, O., Banks, M. S., & Farid, H. (2016). Assessing and improving the identification of computer-generated portraits. ACM Transactions on Applied Perception, 13(2), 1–12. https://doi.org/10.1145/2871714
Hsieh, P.-J. (2023). Determinants of physicians’ intention to use AI-assisted diagnosis: An integrated readiness perspective. Computers in Human Behavior, 147, 1–13. https://doi.org/10.1016/j.chb.2023.107868
Huang, J., Gopalakrishnan, S., Mittal, T., Zuena, J., & Pytlarz, J. (2024). Analysis of human perception in distinguishing real and AI-generated faces: An eye-tracking based study https://doi.org/10.48550/arXiv.2409.15498
IBM. (2024, March 19). What is artificial intelligence (AI)? https://www.ibm.com/topics/artificial-intelligence
Iskra, A., & Tomc, H. G. (2016). Eye-tracking analysis of face observing and face recognition. Journal of Graphic Engineering and Design, 7(1), 5–11. https://doi.org/10.24867/JGED-2016-1-005
Kaate, I., Salminen, J., Santos, J., Jung, S., Olkkonen, R., & Jansen, B. (2023). The realness of fakes: Primary evidence of the effect of deepfake personas on user perceptions in a design task. International Journal of HumanComputer Studies, 178, 103096. https://doi.org/10.1016/j.ijhcs.2023.103096
Lu, Z., Huang, D., Bai, L., Qu, J., Wu, C., Liu, X., & Ouyang, W. (2023). Seeing is not always believing: Benchmarking Human and Model Perception of AI-Generated Images arXiv e-prints, arXiv:2304.13023; Version 3. https://doi.org/10.48550/arXiv.2304.13023
Miller, E. J., Steward, B. A., Witkower, Z., Sutherland, C. A. M., Krumhuber, E. G., & Dawel, A. (2023). AI hyperrealism: Why AI faces are perceived as more real than human ones. Psychological Science, 34(12), 1390–1403. https://doi.org/10.1177/09567976231207095
Mori, M. (2012). The uncanny valley (K. F. MacDorman & N. Kageki, Trans.). IEEE Spectrum, 7(4), 33–35. https://spectrum.ieee.org/the-uncanny-valley (Original work published 1970)
Moshel, M. L., Robinson, A. K., Carlson, T. A., & Grootswagers, T. (2022). Are you for real? Decoding realistic AI-generated faces from neural activity. Vision Research, 199 https://doi.org/10.1016/j.visres.2022.108079
Mouti, S., & Rihawi, S. (2023). Special needs classroom assessment using a sign language communicator (CASC) based on artificial intelligence (AI) techniques. International Journal of E-Collaboration, 19(1). https://doi.org/10.4018/IJeC.313960
Mustak, M., Salminen, J., Mäntymäki, M., Rahman, A., & Dwivedi, Y. K. (2023). Deepfakes: Deceptions, mitigations, and opportunities. Journal of Business Research, 154 https://doi.org/10.1016/j.jbusres.2022.113368
Nexcess. (2023, June 14). Surprising new study reveals humans struggle to spot AI-generated content, says Nexcess https://www.nexcess.net/blog/humans-struggle-to-spot-ai-generated-content/ Ross, A. R., & Bliabaitė, E. (2023, July 7). 50 AI art fails that are both horrifying and hilarious. Bored Panda. https://www.boredpanda.com/ai-fails /
Samo, A., & Highhouse, S. (2025). Artificial intelligence and art: Identifying the aesthetic judgment factors that distinguish human- and machinegenerated artwork. Psychology of Aesthetics, Creativity, and the Arts, 19(5), 1084–1098. https://doi.org/10.1037/aca0000570
Shin, M., Kim, S.J., & Biocca, F. (2019). The uncanny valley: No need for any further judgments when an avatar looks eerie. Computers in Human Behavior, 94, 100–109. https://doi.org/10.1016/j.chb.2019.01.016
Seibold, C., Wisotzky, E.L., Beckmann, A., Kossack, B., Hilsmann, A. & Eisert, P. (2025). High-quality deepfakes have a heart! Frontiers in Imaging, 4, 1504551. https://doi.org/10.3389/fimag.2025.1504551
Tiggemann, M., Anderberg, I., & Brown, Z. (2020). Uploading your best self: Selfie editing and body dissatisfaction. Body Image, 33, 175–182. https://doi.org/10.1016/j.bodyim.2020.03.002
Tinwell, A., Grimshaw, M., Nabi, D. A., & Williams, A. (2011). Facial expression of emotion and perception of the Uncanny Valley in virtual characters. Computers in Human Behavior, 27(2), 741–749. https://doi.org/10.1016/j.chb.2010.10.018
Tobii AB (2024). Tobii Pro Lab (Version 1.232 [Computer software]. Danderyd, Sweden: Tobii AB.
Wang, S., Lilienfeld, S. O., & Rochat, P. (2015). The uncanny valley: Existence and explanations. Review of General Psychology, 19(4), 393–407. https://doi.org/10.1037/gpr0000056
Wolfe, W. L., & Yakabovits, L. (2022). I’ll see your beautified photo and raise you one: An experimental investigation of the effect of edited social media photo exposure. Psychology of Popular Media. https://doi.org/10.1037/ppm0000443
Author Note
April M. DrummHewitt https://orcid.org/0009-0001-6047-2283
Addison F. Angstadt https://orcid.org/0009-0004-8236-172X
Portions of this research were presented at the 95th Annual Meeting of the Eastern Psychological Society (March, 2024, Philadelphia, PA), and the 65th Annual Meeting of the Psychonomic Society (November, 2024, New York, New York).
This research was supported by the Joanne and Arthur Haberberger Research Fellowship awarded to Addison Angstadt at Lycoming College.
We have no known conflict of interest to disclose.
The data that support the findings of this study are available from the corresponding author upon reasonable request.
April M. DrummHewitt played a lead role in conceptualization, research design, data analysis and interpretation, and substantive original writing. She provided a supporting role in data collection. Addison F. Angstadt played a lead role in conceptualization, research design, data collection, and substantive original writing on a previous version of the manuscript. She provided a supporting role in data analysis and interpretation, and in writing this version of the manuscript.
Correspondence concerning this article should be addressed to Dr. April M. DrummHewitt, Lycoming College, One College Place, Williamsport, PA 17701 United States.
Email: drummhewitt@lycoming.edu
SUMMER 2026
PSI CHI JOURNAL OF PSYCHOLOGICAL RESEARCH
Role Strain in Professional Women With Children
Tammy Lowery Zacchilli*, Lara K. Ault*, and O’Shea Williams Department of Social Sciences, Saint Leo University
ABSTRACT. The relationship between role strain and wellbeing in women has been examined extensively in past research, demonstrating that women are often expected to fulfill multiple roles in and outside of the home, resulting in role strain. The purpose of the current study was to examine the experiences of role strain in professional women with children. It was predicted that depression, anxiety, and stress would be positively related to role strain overall as well as the specific rolestrain subscales. Also, it was predicted that partner emotional support, communication of support needs, and resilient coping would be negatively related to role strain, and that household division of labor inequities would positively predict role strain and negatively predict partner emotional support. Participants were recruited through social media platforms including groups devoted to professional women who have children. Participants (n = 109 in final analyses) responded to measures of role strain as well as the potentially strain mitigating variables, resilience and communication of support needs. They also completed measures of anxiety, depression, and stress. Additionally, participants in partnered relationships responded to a measure of dyadic coping. As predicted, overall role strain significantly correlated positively with anxiety (r = .45, p < .001), depression (r = .48, p < .001), and stress (r = .57, p < .001). Contrary to predictions, resilience was not significantly related to any of the measures of role strain. Overall role strain, however, was significantly and negatively correlated with partner social support (r = .29, p = .008), as predicted. Future research should examine additional types of social support and communication related to coping with role strain.
Keywords: role strain, professional women, division of labor, coping
As reported in 2023, 68.9% of mothers with children under age six were employed, and 77.8% of mothers with older children participated in the workforce (U.S. Bureau of Labor Statistics, 2024). Despite the demands of motherhood, the majority of mothers were active in the labor force. Working mothers often face challenges in simultaneously juggling employment and domestic
responsibilities (Verma & Negi, 2020). The relationship between women’s role strain and wellbeing has been examined extensively in past research (Erdwins et al., 2004; Harrington et al., 2022; Home, 1997; Reid & Hardy, 1999), with a common refrain being that women are often expected to fulfill multiple roles in and outside of the home, resulting in role strain. Professional women with children may be particularly vulnerable to the
Diversity badge earned for conducting research focusing on aspects of diversity.
effects of role strain because they may be expected to be both breadwinners and primary childcare givers. Additionally, single mothers are susceptible to role strain because they are the sole provider and caregivers of their children and do not have the support of a significant other. The purpose of the current study was to examine the extent and sources of role strain as well as methods of coping for professional women with children. Although the goal was to represent a broad spectrum of women in professional careers, the sample is made up of 51% faculty in higher education and 77% partnered women, which is reflected throughout the paper.
Types of Role Strain
Role strain refers to the stress experienced when the demands associated with a social role are difficult to fulfill, and it can be categorized into several distinct types, as measured by the Role Strain Scale developed by Goode (1960) and later refined by researchers such as DeMeis and Perkins (1996). Role conflict occurs when there are incompatible demands between different roles or within the same role—for instance, a working mother may struggle to balance her professional responsibilities with the expectations of parenting. Role incongruity refers to a mismatch between a person’s values or identity and the expectations of their role; for example, a nurse who values patientcentered care may experience strain in a hospital environment that prioritizes efficiency over empathy. Role incompetence arises when individuals feel they lack the skills or knowledge required for a role— such as a new teacher feeling unprepared to manage a classroom. Role ambiguity occurs when expectations are unclear, leaving individuals uncertain about how to perform their role; for instance, a new employee may not receive enough guidance on job responsibilities. Lastly, role overload happens when the quantity of demands exceeds a person’s capacity, such as a college student managing a full course load, parttime job, and family obligations. Each of these types contributes uniquely to the overall experience of strain and can negatively impact well being and performance (Goode, 1960; DeMeis & Perkins, 1996; Coverman, 1989). It seems that working mothers would be particularly susceptible to role conflict and role overload.
Role strain may also be influenced by specific job types. For example, teachers experienced considerable role strain during the COVID19 pandemic as they navigated online teaching (Pereira et al., 2025; Robinson et al., 2023). However, teaching specific role strain is not limited to experiences during the pandemic. As mentioned previously, teachers might experience role incompetence if they feel unable to manage the classroom. However, teachers might also experience role
conflict if they feel that pressure to conduct research interferes with teaching expectations. Due to the anticipated recruitment of a significant number of participants in the field of education, a measure of teacherspecific role strain was also included.
Potential Sources of Role Strain
One potential source of role strain could involve the disparity in the division of household labor. Research has shown that there tends to be a gender gap among heterosexual married Americans of working age in the four categories of cleaning, cooking, grocery shopping, and home maintenance (Altintas & Sullivan, 2017; Doan & Quadlin, 2019; Guppy et al., 2019; Kolpashnikova, 2018; Kolpashnikova & ManYee, 2021; Perry‐Jenkins & Gerstel, 2020). There are at least three theoretical frameworks used to explain gendered division of labor in the home that might be relevant to role strain for women. The time constraint approach proposes that the partner who has more time away from paid work will have more time to devote to household tasks (Foster & Stratton, 2018; Hook, 2004). For example, Bünning (2020) noted that fathers who are employed parttime spend more time on household chores and childcare than fathers who are employed full time. This time constraint approach proposes that women tend to work fewer hours than men, so they are more likely to do household tasks such as cooking and cleaning (Craig & Powell, 2018; Guppy & Luongo, 2015). Interestingly, past research has shown that women’s housework increases as their husbands spend more time at work, but the reverse is not the case for men with women’s increased outside (paid) work (McFarlane et al., 2000). However, women who earn more of the family income spend less time on housework compared to those who earn less.
The second framework is the relative resources argument, which is supported by the above imbalance in taking on tasks. It proposes that the spouse who has more resources (e.g., stemming from employment status, educational prestige, or social standing) has more power to bargain and thus avoid housework (Greenstein, 2000). If the woman works more hours or has a higher level of education than her partner, she might have less time to devote to household tasks and childcare. However, role strain could occur if she is still expected to take on more household tasks and childcare despite the time commitment at her job. Research shows, in fact (e.g., McFarlane et al., 2000), that even when women are working or earning more than their partners, the responsibility still falls to them to take care of a greater share of (unpaid) domestic labor (Ervin et al., 2022).
The Job DemandResources Model (JDR Model) is a third framework that is applicable to role strain
(Demerouti et al., 2001). This model proposes that there are two types of job characteristics: job demands and job resources. Job demands involve negative characteristics such as heavy workload, workfamily conflict, and job uncertainty (Bakker & Demerouti, 2007). Role strain due to familywork conflict could be explained by the JDR Model, as this model addresses both a health impairment process and motivational process. This model proposes that workfamily conflict (e.g., role strain) could lead to emotional exhaustion, anxiety, and burnout, but that role satisfaction and abundant job resources may be related to a reduced level of these negative outcomes.
The COVID19 pandemic and its lingering effects of illness (Zarei et al., 2021), mental health problems from quarantine (e.g., Aladsani, 2022; Arad et al., 2021), or lost education for children (Zhdanov et al., 2022) became another potential source of role strain in professional women with children. The pandemic resulted in professional women with children reaching out to others for support through social media groups as well as an organization called the Motherscholar Collective. The Motherscholar initiative allowed academics who were women with young children to provide support as well as conduct research on topics such as coping through kinship (Blanks Jones et al., 2022a), doctoral student experiences (Blanks Jones et al., 2022b), and building a virtual village (Motherscholar Collective et al., 2023). At present, the Motherscholar Collective includes 90 members from a diverse representation of fields. Although the height of the COVID19 pandemic has passed, this organization has continued to grow and foster relationships and research among professionals who are also mothers. Although this study did not specifically focus on pandemic experiences, data collection occurred near the return to “normal” in late 2022, and the pandemic likely continued to influence some participants’ experiences and responses.
Other researchers have also examined how the COVID19 pandemic influenced working mothers. For example, research indicated that the role strain experienced by women with schoolage and younger children resulted in increased levels of anxiety, depression, and other mental health difficulties (Aladsani, 2022; Benassi et al., 2020; Calarco et al., 2020). These mothers may have had to work from home, maintain the house, and assist their children with their education.
Partner Support, Communication of Support Needs, and Role Strain
Social support plays an important role in dealing with a variety of stressors including stress related to role strain (Wester et al., 2007). Zhang et al. (2020) examined the relationship between role conflict and social support
in a sample of nurses and physicians who were women. They examined a moderated mediation model and found that the relationship between workfamily conflict and anxiety symptoms, through emotional exhaustion, was weakest for medical staff who were women who experienced the highest levels of social support.
Interestingly, Sumra and Schillaci (2015) examined role stress in “superwomen” (i.e., women who serve the role of mother/wife/homemaker/worker) and found that these women did not report higher levels of stress than women who had fewer roles. However, role satisfaction was negatively related to stress, suggesting that satisfaction with one’s roles was related to lower reported stress. The JDR model (Demerouti et al., 2001) mentioned above could help explain how job (or role) satisfaction can exist alongside job demands, thus mitigating the negative health and emotional effects of role strain. For this reason, the JDR model may be the most relevant framework for understanding the relationship between role strain and negative mental health outcomes. Social support, as illustrated by the Motherscholar program as well as other literature (e.g., Zhang et al., 2020), seems to be an important factor in helping women deal with role strain (Erdwins et al., 2004; Park, 2012).
Coping for oneself is clearly important, but for partnered individuals, partners’ participation in and success with supporting one another is also important. Dyadic coping refers to how stress is managed in the context of a romantic relationship (Rusu et al., 2020). Supportive dyadic coping involves how well the partner can respond to the other partner’s stress signals. The Dyadic Coping Inventory (Bodenmann, 2008) measures individual coping, partner’s coping, and both partners’ combined efforts to cope and support each other. Research on dyadic coping has shown that the more a partner felt supported by one’s partner on a yearly basis and the more overall stress the partner experienced the greater the levels of relationship satisfaction (Rusu et al., 2020). Thus, coping with stress as a couple while also viewing one’s partner as supportive was related to increased relationship satisfaction. The Dyadic Coping Inventory has also been used to examine the protective role of partner social support in decreasing symptoms of depression, anxiety, and posttraumatic stress disorder (Allen et al., 2025).
Resilient Coping and Role Strain
According to Ehrich et al. (2017), resilience is a psychological characteristic that reflects a person’s ability to maintain a constructive outlook and adapt well when faced with adversity or pressure. As an individual tendency to respond to stress adaptively (Ehrich et al., 2017; Smith et al., 2008), resilience could mitigate
negative responses to stress such as anxiety and depression. For example, resilience may act as a buffer against developing mental health problems (Reipenhausen et al., 2022). Recent research has begun to view resilience, often seen as a trait or ability as described above, more widely as an outcome—specifically, the absence of long term mental health issues despite exposure to adversity, such as chronic stress, negative life events, or major transitions. This view highlights the active, dynamic processes involved in effectively coping with stressors (Reipenhausen et al., 2022). Review studies, from resilience in the face of disasters, including natural disasters, terror attacks, and COVID19 (Bonnano et al., 2024) or daily hassles such as work overwhelm (Tang & Vandenberghe, 2021), have shown a negative relationship between resilience and anxiety and depression. The measure of resilience used in the present study was a measure of resilient coping, which reflected an efficacybased traitlike resilience that likely did not address the process or outcome aspects of resilience. The present study thus expected resilience, or resilient coping as a traitlike characteristic, to correlate with lower scores on selfreported role strain, stress, anxiety, and depression.
Mental Health Outcomes Related to Role Strain
The relationship between depression, anxiety, stress, and role strain is complex given the existing relationship between these three mental health related variables (Morrison et al., 2024; Shin & Park, 2025). For example, chronic stress is related to increased likelihood of experiencing depression and anxiety (Shin & Park, 2025). Additionally, because depression and anxiety often cooccur, they may share symptoms and protective factors. Role strain can lead to emotional fatigue, unmanaged stress, and reduced performance (Morrison et al., 2024) and women are most susceptible to these effects. In fact, women consistently report higher levels of stress than men, and these stress levels are even higher for working mothers (Medaris, 2023). Role strain can lead to burnout and other mental health outcomes, which is why it is important to provide support to individuals who are experiencing role strain. Unfortunately, societal expectations tend to value multitasking and increased commitments over workfamily balance.
Purpose of Current Study
The purpose of this study was to examine the prevalence of role strain in professional women as well as how role strain relates to mental health. This study included three hypotheses. First, depression, anxiety, and stress were predicted to be positively associated with overall role strain as well as with the specific rolestrain subscales. Second, individual resilience, communication of support
needs, and partner emotional support were expected to be negatively associated with role strain. Third, household division of labor inequities were predicted to be positively associated with role strain and negatively associated with partner emotional support. Most study participants were in partnered relationships, and partner support was expected to be negatively associated with role strain, stress, depression, and anxiety for these individuals. Openended questions were also included to explore additional factors contributing to role strain; no specific hypotheses were made for these questions.
Method
Participants
Participants were recruited through social media platforms including groups devoted to professional women who have children. For example, many of the participants were recruited through the Facebook group Ph.D. Mamas. This Facebook group includes 19,000 members who are either in the process of obtaining their Ph.D. or have already received their Ph.D. in various areas of study. General requests for participation were also posted on personal Facebook pages. Participants included 115 women (M age = 40.0; SD = 8.83), the majority of whom were married (75.7%; n = 87) with 8.7% (n = 10) divorced, 8.7% (n = 10) single, 2.6% (n = 3) dating, 1.7% (n = 2) engaged, 1.7% (n = 2) separated, and 0.9% (n = 1) widowed. Thus, approximately 77.40% (n = 92) of participants reported being in committed relationships. Most participants held a bachelor’s level degree or higher (75.0%), with 27.0% being students. More specifically, 20.0% held a BA/BS degree, 20.0% held a MA/MS degree, 8.7% were all but dissertation, and 34.8% held doctorate degrees. Most of the participants were employed fulltime (77.4%) with 15.7% employed parttime, 1% unemployed, and 3.5% were stayathome parents. Non working mothers were removed from the analyses.
Additionally, 98.0% of the sample had at least one child with 33.3% having one child, 22.2% having two children, 22.2% having three children, 11.1% having four children, and 11.1% having five children. Most participants did not report children’s ages as this was an openended response. Of the 40 participants reporting ages, most (n = 11) had toddlers aged 1–3 years, followed by school children aged 6–12 and teenagers aged 13–17 (n = 9 each), and four each reported having preschool children aged 3–5 years and adult children aged 18 and older. Women without children were removed from analyses.
The survey asked participants to indicate their occupation. Their responses were grouped based on similar areas of employment. Most of the participants were employed in educational settings (51.0%), 10.5%
were counselors/therapists/social workers, 6.7% worked in business settings, 5.7% worked in the medical field, 5.7% were researchers, 4.8% worked in customer service, 3.8% were Ph.D. candidates, 2.9% worked in a government setting, 1% were real estate agents, 1% were selfemployed stayathome moms, and 6.7% worked in other areas. After removing those without children and those not currently working, 109 participants’ data were included in the final analyses for the majority of the analyses. Some of the analyses required partnered participants so the sample sizes in these analyses were smaller.
Materials and Procedure
Data collection took place between October of 2022 and January of 2023. The study was approved by the Institutional Review Board. Participants received an online link through Qualtrics that included a consent form, demographic questionnaire, and measures of role strain, partner emotional support and communication of support needs, resilient coping, and mental health.
The Role Strain Survey (Kolagari et al., 2014; Mobily, 1991) is a 33item fivepoint Likert scale that measures five aspects of role strain. The Role Strain Survey includes the aspects described in the introduction, including Conflict (α = .75; e.g., “Having job demands interfere with other activities of personal importance”), Incongruity (α = .72; e.g., “Feeling that my progress on the job is not what it could or should be”), Incompetence (α = .76; e.g., “Coping with the complexity of my job expectations”), Ambiguity (α = .78; e.g., “Dealing with unsystematic evaluation practices”), and Overload ( α = .74; e.g., “Feeling pressured to do more than I currently am”). Reported internal consistency was calculated from the present study’s data. All participants responded to 22 questions from the survey. Participants who were in a teaching profession (n = 59) went on via skip logic to respond to 11 items about facultyspecific scenarios in the incompetence, incongruence, conflict, and ambiguity subscales (α = .73, e.g., “Feeling that research and publication expectations take time needed for my teaching responsibilities.”).
The DASS21 (Lovibond & Lovibond, 1995) is a 21 item self report scale that asks participants to rate how often they experienced a variety of negative thoughts and feelings over the last twoweeks. The scale used a fourpoint Likert response format ranging from 1 (did not apply to me at all) to 4 (applied to me most of the time). The DASS21 was used to measure Depression (α = .90; e.g., “I felt that I had nothing to look forward to.”), Anxiety (α = .76; e.g., “I was aware of dryness of my mouth.”), and Stress (α = .80; e.g., “I found it hard to wind down.”). The fouritem Brief Resilient Coping
Scale used a fivepoint Likert response format ranging from 1 (does not describe me at all) to 5 (describes me very well) in response to statements about how individuals cope with adversity. It measured individual efficacy for dealing with stress (Smith et al., 2008; α = .64; e.g., “I look for creative ways to alter difficult situations”).
Two subscales from the Dyadic Coping Inventory (DCI; Bodenmann, 2008, Simmons & Lehmann, 2012) measured dyadic coping. The first fouritem subscale, Communication of Support Needs, measured how individuals communicate their need for help using a fivepoint Likert response format, with responses ranging from 1 (very rarely) to 5 (very often). This scale showed good internal consistency (α = .72) and a sample item is “I ask my partner to do things for me when I have too much to do.” The second subscale, including 11items and using with the same Likert response above measured Partner Emotional Support (α =.90; “My partner does not take my stress seriously (R),” items 5–15 of the DCI; Simmons & Lehmann, 2012). Skip logic in Qualtrics was used so that only participants in a romantic relationship responded to the DCI.
Items that assessed division of household work and income were also included. Specifically, participants were asked to estimate the percentage of work both they and their partner invested from 1–100% on housework tasks and childcare tasks (“What percentage of the housework [childcare] do you [does your partner] complete?”). They were also asked about income, for both them and their partners (“What percentage of the total income do you [does your partner] contribute?”). Finally, participants were presented with two open ended
TABLE 1
Correlations Between Strain Variables and Depression, Anxiety, and Stress (DASS21 Subscales)
questions that asked about other areas of role strain. The openended questions were “Are there other aspects of your life that create role strain?” and “Is there anything else you would like to tell us about role strain that you experienced?”
Results
To examine the first hypothesis regarding the positive relationship between stress, anxiety, depression and role strain, correlations were calculated between the role strain subscales and depression, anxiety, stress from the DASS21. See Table 1 for correlations (n = 108 except for teachingspecific strain. As predicted, overall role strain significantly correlated positively with anxiety (r = .45, p < .001), depression (r = .48, p < .001), and stress (r = .57, p < .001). Contrary to predictions, resilience was not significantly related to any of the measures of role strain. Overall role strain, however, was significantly and negatively correlated with partner social support (r = .29, p = .008), as predicted. Only the correlation between role strain and ambiguity and role strain and depression were nonsignificant. Role strain ambiguity refers to a lack of clarity about one’s duties and responsibilities. Therefore, it is reasonable to expect that this variable may not be strongly associated with depression.
To investigate hypothesis two, correlations were calculated between the role strain variables (total and subscales) and partner emotional support, communication of support needs (both from Dyadic Coping) and resilient coping. Note that analyses included 89 participants who reported having a current partner (n = 26 did not indicate having a partner). Contrary to hypotheses, neither resilience nor support needs communication significantly related to any of the role strain or DASS variables (all ps > .100). However, partner emotional support, as predicted, correlated with all role strain and DASS variables except strain overload, teaching specific strain, and DASS Anxiety (three nonsignificant ps > .05).
See Table 2 for correlations.
The third hypothesis stated that greater perceived inequities in the division of household labor would correlate positively with strain and negatively with positive relationship variables. To test the third hypothesis, first paired samples t tests were calculated to examine whether participants reported perceived inequitable division of labor for income, housework, and childcare. Unfortunately, many participants did not respond to these questions, leaving n = 89 participants who completed division of labor items. See Table 3 for descriptive statistics for division of labor variables. Participants reported no significant difference in income, t(88) = .15, p = .250, 95% CI: [.33; .09], but they reported perceiving that they invested significantly more time than did their
partners on both housework, t(86) = 9.57, p < .001, 95% CI: [4.19; 2.75], and childcare, t(87) = 8.90, p < .001, 95% CI: [3.88, 2.41].
Differencescore variables were created by subtracting the perception of partner’s contributions from self reported percentages (See Table 4), indicating a perceived inequity of an average of over 30% of housework and childcare compared to the partner, but also showing large variability among respondents for all three perceived differences. These difference scores were correlated with role strain, the DASS variables, resilience, communication of support needs, and partner emotional support. Counter to predictions, role strain
TABLE 2
Correlations Between Role Strain Variables and Partner Support, Resilience, and DCI (Communication of Needs)
TABLE 3
Descriptive Statistics for Division of Labor Variables
TABLE 4
Descriptive Statistics for Division of Labor
did not significantly correlate with perceived inequities (all ps > .05). However, perceived inequity in housework was positively related to DASS anxiety, r (84) = .27, p = .012, 95% CI [.06, .41]. Finally, difference scores between perceived partner and own income, housework, and childcare were correlated with one another to examine the relative resources framework. Only the correlation between perceived percentage of housework was significantly correlated with perceived percentage of childcare, r(87) = .50, p < .001, 95% CI [.33, .64]. Correlations between perceived greater childcare and housework and reported higher partner income were nonsignficant (both ps > .80).
Anonymous openended responses were analyzed for emotional tone using ChatGPT (OpenAI, 2024), with prompts requesting themes weighted by importance and centrality. Previous research supports the use of ChatGPT in qualitative analysis (Rahman et al., 2023; Theelen et al., 2024). To ensure methodological rigor, a structured process aligned with traditional coding procedures was employed while leveraging AI for efficiency. Responses were systematically reviewed and annotated to develop preliminary codes, grounding the analysis in participants’ language and context. The analytic framework was designed to broadly capture strainrelated themes.
ChatGPT was used to assist with data reduction. Prompts directed the AI to segment responses and number entries. It generated initial codes, identified patterns, and refined them into broader themes through iterative prompting. Reliability was supported by prompt consistency; validity was strengthened by triangulating AIgenerated themes with humancoded exemplars.
This analysis revealed six themes: (a) stress and overwhelm, (b) frustration with societal expectations, (c) resilience and coping, (d) emotional impact of life events, (e) seeking support and connection, and (f) adaptation and lack of adjustment. See Table 5 for a list of themes and several example quotations representing each one.
The first theme, stress and overwhelm, was consistent across many of the participants’ responses. Participants referred to all kinds of stress, including financial, selfcare, and work demands. In frustration with societal expectations, women’s frustrations mostly focused on gender roles, some referring to men’s workplace power and gaslighting. Resilience and coping as a theme largely reflected circumstances that allowed women to reduce their load, such as changing jobs or having a spouse step up when needed. Others spoke about developing healthy boundaries and work life integration skills they would like to share with others. Many participants mentioned in emotional impact of
life events how significant life events such as toxic work environments, custody hearings, and health problems had created role strain. Many participants noted the importance of social support and connection and many reported they lacked support or resources to get support. Finally, others noted ways that they adapted and adjusted (or have not done so) to their environment. This theme reflected many stressors women have had to adjust to with little help.
Discussion
The purpose of the current study was to examine the relationship between role strain, mental health, social support, and resilience in professional women with children. This study aimed to examine the degree to which women experience role strain in various forms, mental health concerns such as stress or depression which might relate to role strain, and ways women cope or mitigate the stress of having too much to do.
On a fivepoint scale, women reported an aboveaverage level of overall role strain, reflecting little variability. Some domainspecific strains were rated even
TABLE 5
Thematic Analysis of Open-Ended Responses From Participants
Themes Example Quotations
Stress and Overwhelm
“Trying to balance work, home, kids, and self as only one person.”
“It’s been challenging to manage prioritizing children, professional growth, self-care, and building relationships with other adults.”
“Work micromanages and I never feel like I have free time to complete things.”
Frustration with Societal (Gender)
Expectations
Resilience and Coping
Emotional Impact of Life Events
Seeking Support and Connection
Adaptation and Adjustment
“Men are lazy.”
“Having to ask my husband to help out instead of him seeing what needs to be done and doing it.”
“As a woman, I am still dealing with men that don't realize how dominant, gas lighting or disregarding they are being...”
“Because of my pregnancy, my husband has really stepped up...”
“I recently quit a full-time job that was not healthy...”
“I have always had strong boundaries around work-life integration, and I would love to be able to share some of my strategies...”
“...having an 11-year-old with Down Syndrome, sorting out schooling has been a challenge.”
“having a chronic illness while caring for my elderly parents.”
“I’m currently pregnant, which has impacted my energy and physical ability levels...”
“My mother-in-law helps me with childcare.”
“Missing my support network.”
“Parents living local.”
“Spouse’s demanding job and hours at work. Spouse and I do not get enough time together...”
“Balancing childcare and work events...”
higher. Role strain was significantly and moderatelytostrongly related to mental health concerns. Women experienced at least moderate levels of role strain, which is related to anxiety, depression, and most strongly and consistently, stress.
The lack of correlation between the variables of communication of support needs and resilience and role strain and mental health (DASS) was surprising. Resilience should be related to reduced role strain, or its negative mental health correlates, especially if it is viewed as an individual difference in bouncing back from adversity. It is also possible that women’s communication of their support needs may be ineffective, at least in terms of solving their concerns for getting help with household responsibilities. Another possibility is that our use of resilience as an individual’s capability to respond well to stress did not take into account the complex nature of resilience as a construct. More recent views, including neurological perspectives, define resilience as both a process (of responding to stress) and as an outcome of the response (Seema, 2021). In this sense, resilience is viewed as an adaptive response to stress that improves recovery time poststress to baseline functioning, and that can result in a high quality of life after a stressful or traumatic event (Leppin, 2014). In the present study, we defined resilient coping in the more traditional way to mean one’s ability to “bounce back” from stress well due to a positive outlook and adaptability to adversity. Thus, perhaps the relationship between resilience and negative mental health outcomes such as those studied here is more nuanced and complex than expected. Viewing resilience as a process (Reipenhausen et al., 2022), including communicating the need for emotional support, might better explain how resilience relates to strain and mental health. Future work should examine mediators of the resiliencemental health relationship or, further, “resilience factors” (Riepenhausen et al., 2022, p. 311), those individual elements that make resilient responses more likely by activating resilience mechanisms.
In examining the openended responses, participants articulate a pervasive theme of experiencing stress and overwhelm, a testament to the challenges posed by juggling both professional and personal responsibilities. Concurrently, there is a palpable frustration with societal expectations, specifically regarding gender roles and biases, suggesting broader discontent with established norms. One academic participant said “I am made to feel like I am never paying enough attention to anyone. It’s a systemic problem academia is not friendly to families. It is a sexist problem, as women bear the brunt of this stress and constantly told we are not doing enough when we do EVERYTHING.” Despite these challenges and
reported difficulties adapting in many cases, another notable theme was the resilience and coping mechanisms exhibited by participants, signifying a proactive approach to navigating their multifaceted roles. That resilience as measured in this study did not relate to any mental health or role strain variables contrast with these selfreported narratives and may reflect a need for a nuanced measure of resilience focused on a process or outcome rather than an individual capacity.
There are numerous studies on role strain among women who work and have children, yet each study contributes to an understanding and acknowledgement of a need for larger societal changes, even in an incremental way. Childcare, the responsibility for which falls primarily to women (e.g., Petts et al., 2021), is prohibitively expensive or otherwise insecure for many (Luhr et al., 2022). This study and others underscore that the results of worklife conflict and other stress are harmful to women’s mental health. Examination of the negative outcomes of these patterns provides increasing evidence that largescale changes are urgently needed. This study indicated that women who invest time, money, and effort to attain higher education and professional employment—often with the goal of achieving an easier life—continue to experience stress, anxiety, and depression. Although women still shoulder a majority of household and childcare responsibilities (Milkie et al., 2025), awareness of this fact and the consequences to women’s health has increased enormously over time because of research in this area.
Perhaps the biggest limitation was due to a crucial oversight. Several important variables were inadvertently omitted from the demographic survey, including race, ethnicity, and sexual orientation. This omission limits the ability to examine potential cultural, racial, and samesex relational influences on the variables studied. Further, our unintentional exclusions limit the generalizability of our findings across diverse populations, not to mention rendering intersectional analyses impossible. Although unintentional, this gap underscores the critical importance of inclusive demographic reporting in psychological research. The goal was to focus on a broad view of professional women with children without specific hypotheses about group differences, which partly explains our blind spot. However, the deficit in the ability to accurately represent or compare diverse groups should not be overstated.
To address this limitation, future studies should include comprehensive demographic questions, including race, ethnicity, sexual orientation, and household income, to enable more representative sampling and nuanced analysis. Findings should be interpreted with caution, as the absence of racial, ethnic, and sexual orientation data
may obscure important subgroup differences. Given the relatively small sample size, testing meaningful relationship differences between samesex and oppositesex participants was unlikely, although such comparisons are important and warrant examination in future research.
Given the large proportion of women employed in academia, focusing exclusively on this sector could provide valuable insights; however, such an approach would reduce the sample size by nearly half. The number of women employed part time was insufficient for meaningful comparison. Similarly, comparing partnered and unpartnered women could be informative, but the heterogeneity of unpartnered groups (e.g., widowed, single, divorced, dating) limited the ability to draw meaningful conclusions. These areas represent important directions for future research.
Future research might also explicitly test the three frameworks introduced earlier as guiding theoretical orientations for the hypotheses. For example, future research should further examine the relative resources framework to determine if role strain could occur if the mother is still expected to take on more household tasks and childcare despite the time commitment at her job. Measuring selfperceived contributions to housework and childcare provides an initial estimate; however, ideally, data on housework, childcare, income, and hours worked outside the home would be obtained from both partners. Such dual reporting could enhance accuracy and reduce variability.
Future research might explicitly test the three frameworks introduced earlier as guiding theoretical orientations for the hypotheses. The time constraint approach suggests that the partner with more time at home would assume more household responsibilities. Although not directly tested, current findings offer limited support: correlations between perceived household workload, role strain, and stress related outcomes indicate that increased domestic labor does not necessarily reflect greater time availability. The relative resources/autonomous role framework posits that partners with more exchangeable resources (e.g., income) will do less housework. Although women in this study reported earning slightly less than their partners, they did not perceive a reduction in role strain when engaging in paid work, suggesting limited ability to leverage financial resources. The Job DemandResources model (Demerouti et al., 2001) may offer the most promising avenue for future inquiry, as perceived inequity in housework—rather than income—was weakly correlated with anxiety. However, high variability in inequity measures warrants cautious interpretation. Overall, women reported substantial role strain, and neither equal income nor increased household workload
appeared to buffer its effects. Future studies should incorporate objective measures and partner reports to assess whether perceived responsibility for housework and childcare—significantly linked to anxiety in this sample—reflects broader patterns of strain and support. Future research might involve more extensive data from both couple members. Studies could involve both partners in a dyadic analysis to examine perceptions of household/childcare labor equity, partner communication effectiveness, and partner emotional support in a Social Relations Model (e.g., Cook & Dreyer, 1984). Such dyadic data could better address the effectiveness of support communication from both partners. Importantly, data from both partners would allow researchers to assess any inconsistencies in selfreported housework and childcare that might contribute to feeling over or underbenefitted or strained by their roles.
Additional work should examine how women with role strain seek support and communicate their support needs to their partners as well as to others in their support network, and perhaps researchers should use multiple support measures. In addition, studies have found that running the household––the planning, organizing, and making/remembering important family appointments, making financial decisions and other executive function roles that require multitasking— disproportionately affects women (Offer et al., 2011). Women do most of this cognitive work, and future research should add the invisible multitasking aspect of women’s role strain to the concept of role strain.
Despite limitations, this study provides valuable insights into the experiences of professional women with children, particularly regarding role strain, mental health, and support mechanisms. Even with a relatively small and demographically incomplete sample, findings reveal substantial levels of role strain and its association with stress, anxiety, and depression. These results underscore the persistence of work family conflict and highlight the gaps between societal expectations and the actual support women receive, suggesting that structural and cultural changes are urgently needed. By documenting these patterns, the present study contributes to a growing body of evidence demonstrating that even highly educated, professionally employed women continue to face significant mental health challenges related to household and childcare responsibilities. Furthermore, the study identifies areas for further investigation, such as empirical testing of theoretical models, dyadic analyses of partner roles, nuanced measures of resilience, and culturally inclusive research designs, emphasizing that understanding and mitigating role strain is critical not only for individual wellbeing but also for broader social equity.
References
Aladsani, H. K. (2022). The perceptions of female breadwinner parents regarding their children’s distance learning during the COVID-19 pandemic. Educational Information Technology, 27(4), 4817–4839. https://doi.org/10.1007/s10639-021-10812-9
Allen, E., Witting, A. B., & Bradford, A. (2025). The Dyadic Coping Inventory and mental health across various stress contexts: A decade in review. The American Journal of Family Therapy, 53(1), 1–25. https://doi.org/10.1080/01926187.2025.2527610
Altintas, E., & Sullivan, O. (2017). Trends in fathers’ contribution to housework and childcare under different welfare policy regimes. Social Politics: International Studies in Gender, State & Society, 24(1), 81–108. https://doi.org/10.1093/sp/jxw007
Arad, G., Shamai-Leshem, D., & Bar-Haim, Y. (2021). Social distancing during a COVID-19 lockdown contributes to the maintenance of social anxiety: A natural experiment. Cognitive Therapy and Research, 45(4), 708–714. https://doi.org/10.1007/s10608-021-10231-7
Bakker, A. B., & Demerouti, E. (2007). The job demands-resources model: State of the art. Journal of Management Psychology, 22(3), 309–328.
Benassi, E., Vallone, M., Camia, M., & Scorza, M. (2020). Women during the Covid-19 lockdown: More anxiety symptoms in women with children than without children and role of the resilience. Mediterranean Journal of Clinical Psychology, 8(3), 1–25. https://doi.org/10.6092/2282-1619/mjcp-2559
Blanks Jones, J. L., Cerdeña, J., Coleman-King, C., & Shaw Bonds, M. (2022a). Coping through kinship during COVID-19: Lessons from women of color. In S. McCarther (Ed.) [Special edition]. American Educational History Journal, Snapshots of History: Portraits of the 21st Century Pandemic, 51–58.
Blanks Jones, J. L., Richardson, I., Conley, J., Donohue, J. L. A., & Loomis, C. (2022b).
“All you can say is that you plan on being finished soon:” Doctoral student mothers during the COVID-19 pandemic. In S. McCarther (Ed.) [Special edition]. Snapshots of History: Portraits of the 21st Century Pandemic, 233–240. Bodenmann, G. (2008). Dyadisches Coping Inventar: Testmanual [Dyadic Coping Inventory: Test manual]. Bern, Switzerland: Huber.
Bonanno, G. A., Chen, S., Bagrodia, R., & Galatzer-Levy, I. R. (2024). Flexible adaptation in the face of uncertain threat. Annual Review of Psychology, 75, 573–599. https://doi.org/10.1146/annurev-psych-011123-024224
Bünning, M. (2020). Paternal part‐time employment and fathers’ long‐term involvement in childcare and housework. Journal of Marriage and Family, 82(2), 566–586. https://doi.org/10.1111/jomf.12608
Calarco, J. M. C., Anderson, E., Meanwell, E. V., & Knopf, A. (2020). “Let’s not pretend it’s fun:” How COVID-19-related school and childcare closures are damaging mothers’ well-being. SocArXiv Papers. https://doi.org/10.31235/osf.io/jyvk4
Cook, W., & Dreyer, A. (1984). The Social Relations Model: A new approach to the analysis of family-dyadic interaction. Journal of Marriage and Family, 46(3), 679–687. https://doi.org/10.2307/352609
Coverman, S. (1989). Role overload, role conflict, and stress: Addressing consequences of multiple role demands. Social Forces, 67(4), 965–982. https://doi.org/10.2307/2579710
Craig, L., & Powell, A. (2018). Shares of housework between mothers, fathers and young people: Routine and non-routine housework, doing housework for oneself and others. Social Indicators Research, 136(1), 269–281. https://doi.org/10.1007/s11205-016-1539-3
DeMeis, D. K., & Perkins, D. V. (1996). Supermoms of the nineties: Homemaker and employed mothers’ performance and perceptions of the motherhood role. Journal of Family Issues, 17(6), 777–792.
Demerouti, E., Bakker, A. B., Nachreiner, F., & Schaufeli, W. B. (2001). The job demands-resources model of burnout. Journal of Applied Psychology, 86(3), 499–512. https://doi.org/10.1037/0021-9010.86.3.499
Doan, L., & Quadlin, N. (2019). Partner characteristics and perceptions of responsibility for housework and childcare. Journal of Marriage and Family, 81(1), 145–163. https://doi.org/10.1111/jomf.12526
Ehrich, J., Mornane, A., & Powern, T. (2017). Psychometric validation of the 10-item Connor-Davidson Resilience Scale. Journal of Applied Measurement, 18(2), 122–136. Erdwins, C. J., Buffardi, L. C., Casper, W. J., & O’Brien, A. S. (2001). The relationship of women’s role strain to social support, role satisfaction, and self-efficacy. Family Relations, 50, 230-238. https://doi.org/10.1111/j.1741-3729.2001.00230.x
Ervin, J., Taouk, Y., Alfonzo, L. F., Hewitt, B., & King, T. (2022). Gender differences in the association between unpaid labour and mental health in employed adults: A systematic review. The Lancet Public Health, 7(9), e775–e786. https://doi.org/10.1016/S2468-2667(22)00160-8
Foster, G., & Stratton, L. S. (2018). Do significant labor market events change who does the chores? Paid work, housework, and power in mixed-gender Australian households. Journal of Population Economics, 31(2), 483–519. https://doi.org/10.1007/s00148-017-0667-7
Goode, W. J. (1960). A theory of role strain. American Sociological Review, 25(4), 483–496. https://doi.org/10.2307/2092933
Greenstein, T. N. (2000). Economic dependence, gender, and the division of labor in the home: A replication and extension. Journal of Marriage and Family, 62(2), 322–335. https://doi.org/10.1111/j.1741-3737.2000.00322.x
Guppy, N., & Luongo, N. (2015). The rise and stall of Canada’s gender-equity revolution. Canadian Review of Sociology, 52(3), 241–265. https://doi.org/10.1111/cars.12076
Guppy, N., Sakumoto, L., & Wilkes, R. (2019). Social change and the gendered division of household labor in Canada. Canadian Review of Sociology/Revue Canadienne de Sociologie, 56(2), 178–203. https://doi.org/10.1111/cars.12242
Harrington, A. G., Overall, N. C., & Maxwell, J. A. (2022). Feminine gender role discrepancy strain and women’s self-esteem in daily and weekly life: A person × context perspective. Sex Roles, 87(1–2), 35–51. https://doi.org/10.1007/s11199-022-01305-1
Home, A. M. (1997). Learning the hard way: Role strain, stress, role demands, and support in multiple-role women students. Journal of Social Work Education, 33(2), 335–346.
Hook, J. L. (2004). Reconsidering the division of household labor: Incorporating volunteer work and informal support. Journal of Marriage and Family, 66(1), 101–117. https://doi.org/10.1111/1467-6478.00050-i1
Kolagari, S., Zagheri Tafreshi, M., Rassouli, M., & Kavousi, A. (2014). Psychometric evaluation of the Role Strain Scale: The Persian version. Iranian Red Crescent Medical Journal, 16(10), e15469. https://doi.org/10.5812/ircmj.15469
Kolpashnikova, K. (2018). American househusbands: New time use evidence of gender display, 2003–2016. Social Indicators Research, 140(3), 1259–1277. https://doi.org/10.1007/s11205-017-1813-z
Kolpashnikova, K., & Man-Yee, K. (2021). Gender gap in housework time: How much do individual resources actually matter? The Social Science Journal, 58(3), 345–357. https://doi.org/10.1080/03623319.2021.1997079
Leppin, A. L., Bora, P. R., Tilburt, J. C., Gionfriddo, M. R., Zeballos-Palacios, C., Dulohery, M. M., Sood, A., Erwin, P. J., Brito, J. P., Boehmer, K. R., & Montori, V. M. (2014). The efficacy of resiliency training programs: A systematic review and meta-analysis of randomized trials. PLoS One, 9(10), e111420.
Lovibond, S. H., & Lovibond, P. F. (1995). Manual for the Depression Anxiety Stress Scales (2nd ed.). Psychology Foundation.
Luhr, S., Schneider, D., & Harknett, K. (2022). Parenting without predictability: Precarious schedules, parental strain, and work-life conflict. RSF: Russell Sage Foundation Journal of the Social Sciences, 8(5), 24–44. https://doi.org/10.7758/RSF.2022.8.5.02
McFarlane, S., Beaujot, R., & Haddad, T. (2000). Time constraints and relative resources as determinants of the sexual division of domestic work. The Canadian Journal of Sociology/Cahiers Canadiens de Sociologie, 25(1), 61–82. https://doi.org/10.2307/3341911
Medaris, A. (2023, August 3). Women say they’re stressed, misunderstood, and alone. American Psychological Association. https://www.apa.org/topics/stress/women-stress
Milkie, M. A., Sayer, L. C., Nomaguchi, K., & Yan, H. X. (2025). Who’s doing the housework and childcare in America now? Differential convergence in twenty-first-century gender gaps in home tasks. Socius, 11 https://doi.org/10.1177/23780231251314667
Mobily, P. R. (1991). An examination of role strain for university nurse faculty and its relation to socialization experiences and personal characteristics. Journal of Nursing Education, 30(2), 73–80. https://doi.org/10.3928/0148-4834-19910201-0
Morrison, J., Coulter, T. J., & Polman, R. (2024). The relationships between role strain, mental toughness and mental health amongst adolescent athletes. Advanced Exercise and Health Science, 1(1), 59–66. https://doi.org/10.1016/j.aehs.2024.01.007
Motherscholar Collective, Blanks Jones, J. L., Bielski, L. M., Cerdeña, J. P., Richardson, I., Coleman-King, C., Myles-Baltzly, C. C., Ho, H. K., GarciaHallett, J., Greene-Rooks, J. H., Azim, K. A., Frazier, K. E., Wagner, K. L., Quaynor, M., Lim, S. R., Pennell, S. M., & Brooks, T. (2023). Building a virtual village: Academic mothers’ online social networking during COVID-19. In S. Trocchio, L. K. Hanasono, J. Jorgenson Borchert, R. Dwyer, & J. Yih Harvie (Eds.), It takes a village: Academic mothers building online communities (pp. 1–14). Macmillan. https://doi.org/10.1007/978-3-031-26665-2_1
SUMMER 2026
PSI CHI JOURNAL OF PSYCHOLOGICAL RESEARCH
Offer, S., & Schneider, B. (2011). Revisiting the gender gap in time-use patterns: Multitasking and well-being among mothers and fathers in dual-earner families. American Sociological Review, 76(6), 809–833. https://doi.org/10.1177/0003122411425170
OpenAI. (2024). ChatGPT (February 9 version 3.5) [Large language model]. https://chat.openai.com
Park, J., Kitayama, S., Karasawa, M., Curhan, K., Markus, H. R., Kawakami, N., Miyamoto, Y., Love, G. D., Coe, C. L., & Ryff, C. D. (2013). Clarifying the links between social support and health: Culture, stress, and neuroticism matter. Journal of Health Psychology, 18(2), 226–235. https://doi.org/10.1177/1359105312439731
Pereira, D., Aguiar Vieira, D., Flores, M. A., Machado, E. A., & Fernandes, E. (2025). Teachers’ concerns and teaching experience during the pandemic and beyond: Implications for research, policy, and practice. Cogent Education, 12(1), Article 2461395. https://doi.org/10.1080/2331186X.2025.2461395
Perry‐Jenkins, M., & Gerstel, N. (2020). Work and family in the second decade of the 21st century. Journal of Marriage and Family, 82(1), 420–453. https://doi.org/10.1111/jomf.12636
Petts, R. J., Carlson, D. L., & Pepin, J. R. (2021). A gendered pandemic: Childcare, homeschooling, and parents’ employment during COVID-19. Gender, Work & Organization, 28(S2), 515–534. https://doi.org/10.1111/gwao.12614
Rahman, M., Terano, H. J., Rahman, N., & Salamzadeh, A. (2023). ChatGPT and academic research: A review and recommendations based on practical examples. Journal of Education Management and Development Studies, 3(1), 1–12. https://doi.org/10.52631/jemds.v3i1.175
Reid, J., & Hardy, M. (1999). Multiple roles and well-being among midlife women: Testing role strain and role enhancement theories. The Journals of Gerontology: Series B: Psychological Sciences and Social Sciences, 54(6), S329–S338. https://doi.org/10.1093/geronb/54B.6.S329
Riepenhausen, A., Wackerhagen, C., Reppmann, Z. C., Deter, H.-C., Kalisch, R., Veer, I. M., & Walter, H. (2022). Positive cognitive reappraisal in stress resilience, mental health, and well-being: A comprehensive systematic review. Emotion Review, 14(4), 310–331. https://doi.org/10.1177/17540739221114642
Robinson, L. E., Valido, A., Drescher, A., Woolweaver, A. B., Espelage, D. L., LoMurray, S., Long, A. C. J., Wright, A. A., & Dailey, M. M. (2023). Teachers, stress, and the COVID-19 pandemic: A qualitative analysis. School Mental Health, 15(1), 78–89. https://doi.org/10.1007/s12310-022-09533-2
Rusu, P. P., Nussbeck, F. W., Leuchtmann, L., & Bodenmann, G. (2020). Stress, dyadic coping, and relationship satisfaction: A longitudinal study disentangling time-stable from yearly fluctuations. PLoS One, 15(3), e0231133. https://doi.org/10.1371/journal.pone.0231133
Seema, B. (2021). Rethinking stress resilience. Trends in Neurosciences, 44(12), 936–945.
Shin, H., & Park, C. (2025). Perceived stress shapes symptom and social network dynamics: A network analysis of depression, anxiety, and relationship-specific support and strain. BMC Psychiatry, 25(1), 715. https://doi.org/10.1186/s12888-025-07146-y
Simmons, C., & Lehmann, P. (2012). Tools for strengths-based assessment and evaluation. Springer.
Smith, B. W., Dalen, J., Wiggins, K., Tooley, E., Christopher, P., & Bernard, J. (2008). The Brief Resilience Scale: Assessing the ability to bounce back. International Journal of Behavioral Medicine, 15(3), 194–200. https://doi.org/10.1080/10705500802222972
Sumra, M. K., & Schillaci, M. A. (2015). Stress and the multiple-role woman: Taking a closer look at the “superwoman.” PLOS ONE, 10(3), e0120952. https://doi.org/10.1371/journal.pone.0120952
Tang, W.-G., & Vandenberghe, C. (2021). Role overload and work performance: The role of psychological strain and leader–member exchange. Frontiers in Psychology, 12, Article 691207. https://doi.org/10.3389/fpsyg.2021.691207
Theelen, H., Vreuls, J., & Rutten, J. (2024). Doing research with help from ChatGPT: Promising examples for coding and inter-rater reliability. International Journal of Technology in Education (IJTE), 7(1), 1–18. https://doi.org/10.46328/ijte.537
U.S. Bureau of Labor Statistics. (2023, November 1). American Time Use Survey –2022 Results. https://www.bls.gov/news.release/atus.nr0.htm
Verma, A., & Negi, Y. S. (2020). Working women and motherhood—A review. Annals of Agri Bio Research, 25(1), 170–178.
Wester, S. R., Christianson, H. F., Vogel, D. L., & Wei, M. (2007). Gender role conflict and psychological distress: The role of social support. Psychology of Men & Masculinity, 8(4), 215-224. https://doi.org/10.1037/1524-9220.8.4.215
Zarei, M., Bose, D., Nouri-Vaskeh, M., Tajiknia, V., Zand, R., & Ghasemi, M. (2022). Longterm side effects and lingering symptoms post COVID-19 recovery. Reviews in Medical Virology, 32(3), e2289. https://doi.org/10.1002/rmv.2289
Zhang, N., Xu, D., Li, J., & Xu, Z. (2022). Effects of role overload, work engagement and perceived organisational support on nurses’ job performance during the COVID-19 pandemic. Journal of Nursing Management, 30(4), 901–912 https://doi.org/10.1111/jonm.13598
Zhdanov, S., Baranova, K., Udina, N., Terpugov, A., Lobanova, E., & Zakharova, O. (2022). Analysis of learning losses of students during the COVID-19 pandemic. Contemporary Educational Technology, 14, ep369. https://doi.org/10.30935/cedtech/11812
Lara K. Ault https://orcid.org/0000000320629140
Tammy Lowery Zacchilli played a lead role in conceptualization of the study, data analysis, writing the manuscript, and revision and a supporting role in data collection. Lara K. Ault played a lead role in data analysis, writing the manuscript, and revising the manuscript and a supporting role in data collection. O’Shea Williams played a lead role in the IRB process and data collection and a supporting role in writing the manuscript.
Correspondence concerning this article should be addressed to Dr. Tammy Lowery Zacchilli, Department of Social Sciences, Saint Leo University, MC 2127, Box 6665, Saint Leo, FL 33574, United States. Email: tammy.zacchilli@saintleo.edu
When Love Hurts: Exploring the Links Between Narcissism, Attachment Issues, and Infidelity Intentions
Helen Huynh and Tammy Lowery Zacchilli* Department of Social Sciences, Saint Leo University
ABSTRACT. The three pillars of narcissism—superiority, exploitativeness, and fragility— distinguish it from self esteem. Prior research has suggested that permissive or authoritarian caregiving may foster maladaptive perceptions of relationships and increase infidelity intentions. This quantitative investigation examined associations among narcissism, infidelity intentions, relationship satisfaction, and demographic variables across 2 studies. Study 1 examined correlations among narcissism, infidelity intention, relationship satisfaction, and potential gender and age differences with no formal hypotheses. Study 2 included attachment style as an additional variable. Men high in narcissism and older individuals were predicted to report greater infidelity intentions, and attachment style was expected to influence infidelity intentions: secure attachment with lower risk, and fearful or dismissing attachment with higher risk. Participants included 80 men, 125 women, and 4 nonbinary individuals. Measures included a background inventory, the Relationship Assessment Scale (Hendrick, 1988), the Narcissistic Personality Inventory (Raskin & Hall, 1979), the Intention Towards Infidelity Scale (Jones et al., 2011), and the Relationship Questionnaire (Bartholomew & Horowitz, 1991). Results of Study 1 indicated that infidelity intentions and relationship satisfaction were negatively correlated (r = –.37, p = .002), age and infidelity intentions positively correlated (r = .39, p = .001), and age and satisfaction negatively correlated (r = –.21, p = .016 ). In Study 2, regression analyses showed that narcissism and relationship dissatisfaction significantly predicted infidelity intentions, whereas attachment style did not. Limitations included convenience sampling, gender imbalance, and no assessment of current relationship status and duration. Future research should explore additional personality traits related to infidelity risk, such as psychopathy.
From ancient myth to modern psychology, narcissism has long fascinated—and troubled— our understanding of human relationships. The story of Narcissus, who famously fell in love with his own reflection while rejecting the love of Echo, still echoes in today’s romantic struggles (Jauk & Kanske, 2021). In the modern world, narcissism is more than myth: An estimated 450 million people may meet the criteria for narcissistic personality disorder, making up roughly 6% of the global population (Bonchay, 2017). Narcissists often view relationships not as mutual partnerships, but as stages for control, validation, and superiority. These dynamics can manifest in harmful behaviors such as manipulation, emotional
detachment, and even infidelity (Peterson & DeHart, 2014). This article examined how narcissism, along with relationship dissatisfaction and attachment styles, intertwines with the intention toward infidelity— revealing the psychological patterns behind betrayal in intimate relationships.
Narcissism Versus Self-Esteem
Although narcissism and self esteem may appear similar, they have fundamentally different psychological foundations. Selfesteem reflects a person’s selfworth and is composed of realism, growth, and robustness (Brummelman & Sedikides, 2020). Realism involves setting achievable goals without needing to outperform
Narcissism, Attachment Issues, and Infidelity | Huynh and Zacchilli
others. Growth reflects selfawareness and commitment to self improvement, such as taking criticism constructively. Robustness is resilience to hardships, enabling learning from setbacks. Individuals with stable selfesteem tend to selfregulate their emotions and rely less on external validation (Strutzenberg, 2016; Suraj et al., 2023).
Narcissism involves an inflated sense of selfworth coupled with deep insecurities and disregard for others (Brummelman & Sedikides, 2020; Strutzenberg et al., 2016). Grandiose narcissists display superiority, entitlement, and a need for admiration, whereas vulnerable narcissists fluctuate between feelings of superiority and inferiority (Dinić & Jovanović; Ellina & Parpottas, 2023; Schmidt et al., 2015). Narcissism has three pillars—illusory thinking, superiority, and fragility—which shape maladaptive behaviors such as envy, overachievement, and mood instability (Alinok & Kihc, 2020; Brummelman & Sedikides, 2020; Suraj et al., 2023). Vulnerable narcissists may use strategies like lovebombing or shortterm relationships to regain attention and bolster selfworth, often leading to relationship conflict (Altinok & Kihc, 2020; Dinić & Jovanović, 2021; Peterson & DeHart, 2002; Strutzenberg et al., 2016). These behaviors align with selfenhancement theory, highlighting narcissists’ reliance on external validation to regulate fragile selfesteem (Campbell et al., 2002; Peterson & DeHart, 2014).
Attachment, Parenting
Styles, and Infidelity Intentions
People first learn about relationships through their caregivers, which shapes their attachment style (Givertz et al., 2024; Schmidt et al., 2015). Insecure attachment may develop when caregivers fail to establish secure bonds, increasing the likelihood of narcissistic traits and avoidant attachment (Altinok & Kihc, 2020; Ellina & Parpottas, 2023). Parenting extremes—permissive or authoritarian—contribute to these tendencies. Permissive parents provide little structure, fostering entitlement and grandiosity (Kauten et al., 2015; Irfan Thalib et al., 2024), whereas authoritarian parents impose high control, harsh discipline, and low affection, leading to destructive entitlement and sensitivity to feedback (Ellina & Parpottas, 2023; Kauten et al., 2015; Schmidt et al., 2015).
These parenting patterns can result in avoidant attachment, categorized as fearfulavoidant or dismissiveavoidant, which are prevalent in narcissists (Altinok & Kihc, 2020; Bartholomew & Horowitz, 1991; Ghiasi et al., 2023). Narcissists with avoidant attachment often prioritize shortterm relationships to gain validation, avoid emotional intimacy, and cope with conflict
through selfenhancement or withdrawal (Altinok & Kihc, 2020; DeWall et al., 2011; Ellina & Parpottas, 2023; Dinić & Jovanović, 2021; Kislev, 2022). Fearfully attached individuals may react aggressively to regain attention, whereas dismissively attached individuals seek alternative connections to maintain autonomy (Dinić & Jovanović, 2021; Ellina & Parpottas, 2023; Peterson & DeHart, 2020).
Attachment styles also influence infidelity intentions. Avoidant individuals are more likely than securely attached individuals to consider physical or emotional infidelity (Ahmadi et al., 2023; Altinok & Kihc, 2020; DeWall et al., 2011; Ghiasi et al., 2023). Fearfully attached individuals may pursue affairs for validation, while dismissively attached individuals may use extradyadic connections to maintain distance (Allen & Baucom, 2004). Securely attached individuals, valuing intimacy and trust, are less prone to infidelity intentions (Feeney, 1999). Narcissists’ love styles—ludus (shortterm, lowcommitment) or mania (possessive, volatile)—may further increase intentions toward infidelity, particularly when attention and admiration from a partner wane (Altinok & Kihc, 2020; Campbell et al., 2002; Dinić & Jovanović, 2021; Ghiasi et al., 2023).
Overall, underlying emotional needs, attachment strategies, and narcissistic tendencies interact to influence relationship stability and the likelihood of considering infidelity. However, attachment alone does not account for the role of relationship dissatisfaction, which also significantly shapes infidelity intentions (Ghiasi et al., 2023).
Relationship Dissatisfaction, Age, and Infidelity Intentions
Although early parenting experiences help shape narcissistic tendencies and attachment styles, these traits often manifest most clearly in the context of romantic relationships, particularly when dissatisfaction begins to erode relational stability. The Investment Model supports the notion that intentions to engage in infidelity may also be the consequence of relationship dissatisfaction (Rusbult et al., 2001). Narcissists often have superficial, short term relationships to fulfill their needs for admiration and attention while lacking commitment (DeWall et al., 2011; Ellina & Parpottas, 2023; March et al., 2023). In the face of conflict, where the level of attention and admiration decreases, they may consider pursuing alternative connections to meet their needs (Ellina & Parpottas, 2023; March et al., 2023). They may experience a cycle of forming a shortterm connection, experiencing damage to their ego from their partner’s lack of feedback, followed by self regulation with aggression or selfenhancement strategies, and quickly
moving on to the next shortterm relationship (Dinić & Jovanović, 2021). Overall, narcissists have difficulty maintaining relationship satisfaction because of their fragile selfesteem and overreliance on their environment for validation.
Age plays an important role in relationship satisfaction. Past research has shown that relationship satisfaction follows a U shape pattern, with satisfaction slowly declining, reaching a midlife crisis, and increasing with old age (Buhler et al., 2021). Relationship satisfaction may be at its highest in younger adults as they have the autonomy to form new connections and detach from relationships that bring them dissatisfaction (Buhler et al., 2021). In middle adulthood, individuals strive to find stability and settle down, but may struggle to balance other domains, experiencing a midlife crisis when it negatively affects their relationships (Buhler et al., 2021). In late adulthood, social circles are smaller and connections are more intentional, so adults may want to maximize their energy and time by focusing on being present and positive (Buhler et al., 2021). Research has also shown that relationship satisfaction and duration are negatively associated with the “honeymoonisover” effect (Buhler et al., 2021). Over time, couples are confronted with daily tasks, stressful circumstances, adjustments, and reality checks (Buhler et al., 2021; Lavner & Bradbury, 2010). As a result, the relationship may be prone to negative emotions and diminish in intimacy, losing its passion and excitement (Buhler et al., 2021). To regain satisfaction, individuals may seek other connections, either by separating from their current partner or considering infidelity (DeWall et al., 2011). The “honeymoonisover” effect may be visible in all age groups, but is commonly associated with couples who have been together for many years.
Gender and Infidelity Intentions
Past research has shared similar results that men are more likely than women to report intentions toward infidelity, with a study showing that men are 18% more likely to engage in or consider infidelity (Stewart, 2017; Tan et al., 2025). From an evolutionary perspective, men tend to benefit more from shortterm relationships as they help achieve reproductive success (Millar et al., 2018). On the other hand, women benefit more from seeking a reliable longterm partner who can provide support, stability, and resources to help raise and protect their offspring (Millar et al., 2018). Men experience lower reproductive risk because they may choose not to invest further into the relationship with their female counterparts and pursue other sexual opportunities, whereas women have to be more selective with whom they mate because they experience more reproductive
risks and have a higher biological investment (Pazhoohi, 2022). Therefore, men are more likely to consider infidelity because they are able to do so with relatively low reproductive or social risk, whereas women may experience higher reproductive or social consequences. Although men show higher intentions toward infidelity than women, women may still consider extradyadic partners for various reasons. For example, women may pursue other partners outside of their current relationship if they perceive a male counterpart who can provide longterm support and better fatherly qualities (Murphy et al., 2024).
To examine the relationship between relationship satisfaction, narcissism, attachment, and the intention toward infidelity, two studies were conducted. Study 1 focused primarily on narcissism, relationship satisfaction, and infidelity intentions, and Study 2 included these variables along with attachment styles.
Study 1
Purpose of the Study
The purpose of the study was to examine the relationship between narcissism, relationship satisfaction, and infidelity intentions. The study also examined potential age and gender differences. First, we hypothesized that men who score high in narcissism would have lower relationship satisfaction and would be more likely to consider infidelity than women. Second, we predicted that age would also be positively related to infidelity intentions.
Method Participants
A total of 134 participants (107 women, 24 men, and 3 nonbinary) with the mean age of 23.43 (SD = 8.80) participated in the study. Most of the sample (86.0%) were between the ages of 18 and 25 with the age ranging from 18 to 66. Participants were 47.0% European American/ White, 21.6% African American/Black, 13.4% Other Spanish American/Latino, 7.5% Mexican/Mexican American/Chicano, 3.7% Asian American, 6.0% Other, and 0.7% Declined to State/Do Not Know.
Materials and Procedure
Prior to data collection, this study was approved by the Institutional Review Board. Participants received an online survey link through Qualtrics. Before taking the survey, participants read and agreed to the implied consent form.
Background. The Background Inventory was used to collect participants’ demographics. The inventory consisted of 5 items.
Relationship Satisfaction . Hendrick’s (1998) Relationship Assessment Scale (α = .91) was used to
Narcissism, Attachment Issues, and Infidelity | Huynh and Zacchilli
measure relationship satisfaction. The scale consists of 7 items. A sample question from the scale is “In general, how satisfied are you with your relationship?”
Narcissism. Raskin and Hall’s (1979) Narcissistic Personality Inventory (α = .84) was used to examine whether one is a narcissist. This inventory consists of 40 paired items. A sample question from the inventory is “I am average” vs “I am special.”
Infidelity. Jones et al.’s (2011) Intention Towards Infidelity Scale (α = .83) was used to measure infidelity. The scale contains 8 items. A sample question from the scale is “How likely are you to be unfaithful to a partner if you knew you wouldn’t get caught?”
Results
Means and descriptive data along with the correlations between the three variables may be found in Table 1.
Infidelity intentions and relationship satisfaction had a significant, negative correlation (r = .37, p = .002). There was no significant relationship between infidelity intentions and narcissism. However, age and infidelity intentions were positively related (r = .39, p = .001), and age was significantly, negatively related to satisfaction (r = .21, p < .016).
A simultaneous multiple linear regression was calculated to examine age, gender, narcissism, and relationship satisfaction as predictors of infidelity intention. The three participants who reported nonbinary gender were excluded so that the assumptions of the regression analysis were met. The model was significant, F(4, 97) = 11.57, p < .001. The model accounted for 32% of the variance in infidelity intentions. The results indicated that all four predictors were significant. Age emerged as the strongest predictor of infidelity intentions, β = .36, p < .001, such that middleaged adults reported higher levels of infidelity intentions Relationship satisfaction also significantly predicted infidelity intentions, β = .28, p < .002, with lower satisfaction associated with greater infidelity intentions. Gender was a significant predictor, β = .20, p = .021, with men reporting higher infidelity intentions than women. Finally, narcissism was a modest but significant predictor, β = .19, p = .02, such that higher narcissism scores were related to higher infidelity intentions. Results are located in Table 2.
Discussion
The purpose of Study 1 was to examine the relationship between narcissism, relationship satisfaction, and intentions toward infidelity. The results indicated that individuals with lower relationship satisfaction reported higher intentions to engage in infidelity, and that these intentions were positively associated with age. One
possible explanation is that, as relationships progress over time, partners may experience declines in novelty and excitement, which can contribute to dissatisfaction. In turn, some individuals may consider pursuing outside relationships as a way to restore those feelings, though intentions do not always translate into behavior. Although Study 1 did not directly measure relationship length, the findings suggest that both age and duration of partnership may be relevant factors in understanding risk for infidelity intentions.
There are limitations to the study, including convenience sampling and uneven gender and age proportions. Given that the sample was collected at a private Catholic university in the southeast, the results do not necessarily generalize to the broader population. There were significantly more female participants than male, making it difficult to examine gender differences in intentions toward infidelity, satisfaction, or narcissism.
To further examine the relationship between narcissism, relationship satisfaction, and infidelity intentions, future research should examine other variables that may affect an individual’s likelihood of considering extradyadic behavior. In Study 2, attachment was added as an important variable to examine the relationship between narcissism and relationship satisfaction on a deeper level. A narcissist’s upbringing may help explain their intentions toward infidelity, and we also attempted to reduce the gender imbalance in the sample.
Descriptive Statistics and Correlations for Variables in Study 1
Multiple Regression Predicting Infidelity Intentions in Study 1
TABLE 1
TABLE 2
Study 2
Purpose of the Study
The purpose of the study was to examine the correlation between narcissism, relationship satisfaction, attachment, and infidelity intentions. The study also examined age and gender differences. First, for Hypothesis 1, we predicted that men with high levels of narcissism would experience low relationship satisfaction and would be more likely to consider infidelity than women. Second, for Hypothesis 2, we predicted that age would be positively related to infidelity intentions. For Hypothesis 3, we predicted that individuals with a secure attachment style would report lower levels of infidelity intentions compared to individuals with insecure attachment styles. For Hypothesis 4, we predicted that individuals with a fearful attachment style would be more likely to consider infidelity due to heightened relational anxiety and avoidance of intimacy. Finally, for Hypothesis 5, we predicted that individuals with a dismissing attachment style would be more likely to consider infidelity as a means of maintaining autonomy and avoiding emotional closeness.
Method
Participants
A total of 209 participants (125 women, 80 men, 4 nonbinary) participated in the study with 45.9% European American/White, 21.5% African American/Black, 15.8% Other Spanish American/Latino, 8.6% Asian American, 3.8% Other, 3.3% Mexican, and 1% reported Declined to State/Do Not Know. The mean age of the sample was 22.78 (SD = 7.70) with 82.0% of the participants being between 18–years old and 18.0% being 25 years old or older. Participants were age 18 to 59.
Materials and Procedure
Prior to data collection, this study was approved by the Institutional Review Board. Participants were recruited in person, through social media, and email. Flyers were also posted with the QR code to take the survey. Participants received an online survey link through Qualtrics. Before taking the survey, participants read and agreed to the implied consent form.
Background. The Background Inventory was used to collect the participants’ demographics. The inventory consisted of 5 items.
Relationship Satisfaction . Hendrick’s (1998) Relationship Assessment Scale (a = .91) was used to measure relationship satisfaction. The scale consists of 7 items. A sample question from the scale is “In general, how satisfied are you with your relationship?”
Narcissism. Raskin and Hall’s (1979) Narcissistic Personality Inventory (a = .83) was used to examine
whether one is a narcissist. This inventory consists of 40 paired items. A sample question from the inventory is “I am average” vs “I am special.”
Infidelity. Jones et al.’s (2011) Intention Towards Infidelity Scale (a = .75) was used to measure infidelity. The scale contains 8 items. A sample question from the scale is “How likely are you to be unfaithful to a partner if you knew you wouldn’t get caught?”
Attachment. Bartholomew and Horowitz’s (1991) Relationship Questionnaire was used to measure participants’ attachment style. This scale measures four attachment styles: Secure, Fearful, Preoccupied, and Dismissing. The questionnaire includes one item in which participants choose which of the attachment styles best describes them. The second question allows participants to rate each attachment style on a 5point Likerttype scale. A sample question from the questionnaire is “It is easy for me to become emotionally close to others.”
Note * p < .05. ** p < .01.
TABLE 4
Multiple Regression Predicting Infidelity Intentions for Study
Note. Dependent variable: Infidelity intentions. R2 = .15, Adjusted R2 = .11. B = unstandardized regression coefficient. SE B = standard error of B. β = standardized coefficient Partial r2 represents effect size for each predictor.
Results
Descriptive statistics as well as correlations were calculated between the four variables. These results may be found in Table 3.
Infidelity intentions and relationship satisfaction had a significant, negative correlation (r = -.23, p = .006). Infidelity intentions and narcissism had a significant, positive correlation (r = .30, p < .001). Age and attachment styles were not significantly related to infidelity intentions, narcissism, or relationship satisfaction. One-way ANOVAs were calculated to examine gender differences in all of the variables but none of these were significant. A multiple linear regression was calculated to examine age, gender, narcissism, relationship satisfaction and attachment as predictors of infidelity intentions. The model was significant, F(7, 114) = 3.06, p = .005. The model accounted for 15% of the variance in infidelity intentions. Relationship satisfaction was a significant predictor of infidelity intentions (b = -.23, t = -2.45, p = .016). Narcissism was also a significant predictor of infidelity intentions (b = .34, t = 3.44, p < .001). Gender, age, and attachment styles were not significant predictors of infidelity intentions. See Table 4 for complete results.
General Discussion
The present research examined how narcissism, relationship satisfaction, attachment styles, age, and gender predict infidelity intentions. Across two studies, relationship dissatisfaction consistently emerged as a strong predictor of infidelity intentions, reinforcing prior findings that dissatisfaction undermines commitment and increases the likelihood of seeking alternative partners (Rusbult et al., 2001). Narcissism was also associated with intentions toward infidelity, particularly in Study 2, where a larger and more balanced sample revealed that higher narcissism scores predicted greater intentions. These findings align with the SelfEnhancement Hypothesis, which suggests that narcissists, motivated by fragile selfesteem and external validation, are more prone to extradyadic behaviors when their needs for admiration are unmet (Campbell et al., 2002; Peterson & DeHart, 2014). It is important to note that we measured intentions rather than actual infidelity behaviors, and intentions do not always translate directly into behavior due to situational factors, selfregulation, moral values, or opportunity. Contrary to expectations, attachment style was not a significant predictor of infidelity intentions in Study 2. This finding challenges much of the existing literature that links insecure attachment—especially fearful and dismissing styles—to infidelity risk (Ahmadi et al., 2023; Givertz et al., 2024). Although attachment style did not emerge as a significant predictor, this is unlikely due to
low variability, as participants’ scores spanned the full range of the scale. It is possible that the selfidentification format of the measure or social desirability bias influenced responses. Alternatively, attachment may interact with other relational variables, such as conflict resolution or communication patterns, rather than directly predicting intentions toward infidelity on its own.
Age and gender differences produced mixed findings. In Study 1, age was positively correlated with infidelity intentions, and men reported higher intentions than women. These results may reflect both relational dynamics that shift across the lifespan—such as declining satisfaction or the “honeymoonisover” effect (Bühler et al., 2021)—and evolutionary perspectives suggesting men may benefit more from short term mating opportunities (Miller et al., 2018). However, in Study 2, neither age nor gender significantly predicted infidelity intentions, perhaps due to differences in sampling or statistical power. These inconsistent results suggest the need for further investigation with larger and more demographically balanced samples. Again, it should be emphasized that intentions do not necessarily equate to actual infidelity, and individuals who report high intentions may not engage in extradyadic behaviors, while others with low intentions might.
Potential Limitations
Several limitations warrant consideration. Both studies relied on convenience samples primarily composed of college students, restricting the generalizability of findings. The overrepresentation of women, particularly in Study 1, limited analyses of gender differences. The reliance on selfreport measures for sensitive behaviors like infidelity also raises concerns about underreporting due to social desirability. A more substantial limitation involves the absence of relationshipstatus variables. Because participants were not asked whether they were currently in a relationship, had prior relationship experience, or the duration of those relationships, their responses could not be contextualized within their relational histories. This omission constrains the interpretation of the findings, as infidelityrelated attitudes and behaviors can differ meaningfully based on relationship involvement.
Relatedly, although the mean age of participants was 23, the age range spanned from 18 to 59 years old in Study 2. Without data on relationship length, it is unclear how long participants, particularly younger adults who may have had fewer opportunities for longterm partnerships, had been involved in their relationships, if any. This further limits the ability to interpret how relationship duration or experience might have influenced the observed associations.
Although the primary aim was to examine personality and relational predictors of infidelity intentions at a broad level, future work should incorporate detailed relationshipstatus and relationshiphistory measures to strengthen interpretability and ensure sample adequacy for relational research. Finally, the crosssectional design prevents conclusions about causality; it remains unclear whether narcissism and dissatisfaction lead to infidelity intentions or whether engaging in infidelity further erodes satisfaction and selfperceptions.
Future Research
Future research should address these limitations by using longitudinal designs to track how narcissism, attachment, and satisfaction interact over time to predict infidelity intentions. Recruiting more diverse samples across different cultural contexts and relationship types would also increase generalizability. Additionally, employing multimethod approaches—such as partner reports, behavioral observations, or implicit measures—could provide more reliable insights into infidelityrelated processes. Exploring protective factors, such as secure attachment, empathy, or emotion regulation, may also shed light on how some individuals maintain commitment despite relational stress.
Conclusion
In sum, these studies highlight the critical role of relationship satisfaction and narcissism in predicting infidelity intentions. Although attachment style did not emerge as a direct predictor, its developmental origins remain relevant for understanding how early caregiving shapes relational expectations and vulnerabilities. These findings should be interpreted with the understanding that intentions represent a potential for behavior rather than a definitive outcome; actual infidelity is influenced by a combination of opportunity, personal values, and situational constraints. Together, the findings suggest that fostering satisfaction and addressing narcissistic tendencies are central to reducing the risk of infidelity and promoting healthier, more resilient partnerships.
References
Ahmadi, M., Seyfi, A., & Sadeghi, H. (2023). The interplay of attachment styles and marital infidelity: A systematic review and meta-analysis. Heliyon, 9(1), e13745. https://doi.org/10.1016/j.heliyon.2023.e13745
Allen, E. S., & Baucom, D. H. (2004). Adult attachment and patterns of extradyadic involvement. Family Process, 43(4), 467–488. https://doi.org/10.1111/j.1545-5300.2004.00034.x
Altınok, A., & Kılıç, N. (2020). Exploring the associations between narcissism, intentions towards infidelity, and relationship satisfaction: Attachment styles as a moderator. PLOS ONE, 15(11), e0242277. https://doi.org/10.1371/journal.pone.0242277
Bartholomew, K., & Horowitz, L. M. (1991). Attachment styles among young adults: A test of a four-category model. Journal of Personality and Social Psychology, 61, 226–244. https://doi.org/10.1037//0022-3514.61.2.226
Bonchay, B. (2017). Narcissistic abuse affects over 158 million people in the U.S.
Brummelman, E., & Sedikides, C. (2020). Raising children with high self‐esteem (but not narcissism). Child Development Perspectives, 14(2), 83–89. https://doi.org/10.1111/cdep.12362
Bühler, J. L., Krauss, S., & Orth, U. (2021). Development of relationship satisfaction across the life span: A systematic review and meta-analysis. Psychological Bulletin, 147(10), 1012–1053. https://doi.org/10.1037/bul0000342
Campbell, W. K., Foster, C. A., & Finkel, E. J. (2002). Does self-love lead to love for others? A story of narcissistic game playing. Journal of Personality and Social Psychology, 83(2), 340–354. https://doi.org/10.1037/0022-3514.83.2.340
DeWall, C. N., Lambert, N. M., Slotter, E. B., Pond, R. S., Jr., Deckman, T., Finkel, E. J., & Fincham, F. D. (2011). So far away from one’s partner, yet so close to romantic alternatives: Avoidant attachment, interest in alternatives, and infidelity. Journal of Personality and Social Psychology, 101(6), 1302–1316. https://doi.org/10.1037/a0025497
Dinić, B. M., & Jovanović, A. (2021). Shades of narcissistic love: Relations between narcissism dimensions and love styles. Personality and Individual Differences, 175, 110707. https://doi.org/10.1016/j.paid.2021.110707
Ellina, E., & Parpottas, P. (2023). The role of narcissism and attachment in adult romantic relationships: A study of Greek-speaking adult participants. European Journal of Counselling Psychology. https://doi.org/10.46853/001c.84014
Feeney, J. A. (1999). Adult romantic attachment and couple relationships. In J. Cassidy & P. R. Shaver (Eds.), Handbook of attachment: Theory, research, and clinical applications (pp. 355–377). Guilford Press.
Ghiasi, N., Rasoal, D., Haseli, A., & Feli, R. (2023). The interplay of attachment styles and marital infidelity: A systematic review and meta-analysis. Heliyon, 10(1), e23261. https://doi.org/10.1016/j.heliyon.2023.e23261
Givertz, M., Lopez, R. A., Segrin, C., & Taylor, A. R. (2024). Adverse childhood experiences and infidelity: The mediating roles of anxious and avoidant attachment styles. Family Process, 64(2), 1–21. https://doi.org/10.1111/famp.13088
Hendrick, S. S. (1988). A generic measure of relationship satisfaction. Journal of Marriage and the Family, 50, 93–98. https://doi.org/10.2307/352430
Irfan Thalib, H., Zobairi, A., Khan, S., Abou Touk, M., Bahkali, R., Alhusaynan, S., & Fatima Hussain, S. (2024). Tracing the link between narcissistic personality disorder and childhood overgratification. Cureus16(10), e72638. https://doi.org/10.7759/cureus.72638
Jauk, E., & Kanske, P. (2021). Can neuroscience help to understand narcissism? A systematic review of an emerging field. Personality Neuroscience, 4(3). https://doi.org/10.1017/pen.2021.1
Jones, D., Olderbak, S., & Figueredo, A. (2011). The Intention Towards Infidelity Scale. In J. H. Harvey & A. Wenzel (Eds.), Handbook of sexuality-related measures (pp. 251–253).
Kauten, R., Lui, J., Doucette, H., & Barry, C. (2015). Perceived family conflict moderates the relations of adolescent narcissism and CU traits with aggression. Journal of Child & Family Studies, 24(10), 2914–2922. https://doi.org/10.1007/s10826-014-0095-1
Kislev, E. (2022). The longitudinal effect of narcissistic admiration and rivalry traits on relationship satisfaction. Social Psychological and Personality Science, 14(7), 865–874 https://doi.org/10.1177/19485506221134348
Lavner, J. A., & Bradbury, T. N. (2010). Patterns of change in marital satisfaction over the newlywed years. Journal of Marriage and Family, 72(5), 1171–1187. https://doi.org/10.1111/j.1741-3737.2010.00757.x
March, E., Antunovic, J., Poll, A., Dye, J., & Van Doorn, G. (2023). High (in)fidelity: Gender, the Dark Tetrad, and infidelity. Sexual and Relationship Therapy, 1–18. https://doi.org/10.1080/14681994.2023.2220279
Millar, M., Westfall, R. S., & Lovitt, A. (2018). The influence of mate value on women’s desire for long and short-term mates: Implicit responses. Personality and Individual Differences, 130, 36–40. https://doi.org/10.1016/j.paid.2018.03.043
Murphy, M., Phillips, C. A., & Blake, K. R. (2024). Why women cheat: Testing evolutionary hypotheses for female infidelity in a multinational sample. Evolution and Human Behavior, 45(5), 106595. https://doi.org/10.1016/j.evolhumbehav.2024.106595
Pazhoohi, F. (2022). Parental Investment Theory. The Cambridge Handbook of Evolutionary Perspectives on Sexual Psychology, 137–159. https://doi.org/10.1017/9781108943529.010
Peterson, J. L., & DeHart, T. (2014). In defense of self-love: An observational study on narcissists’ negative behavior during romantic relationship conflict. Self & Identity, 13(4), 477–490. https://doi.org/10.1080/15298868.2013.868368
Raskin, R. N., & Hall, C. S. (1979). A narcissistic personality inventory. Psychological Reports, 45(2), 590. https://doi.org/10.2466/pr0.1979.45.2.590
Rusbult, C. E., Olsen, N., Davis, J. L., & Hannon, P. A. (2001). Commitment and relationship maintenance mechanisms. In J. Harvey & A. Wenzel (Eds.), Close romantic relationships: Maintenance and enhancement (pp. 87–113). Lawrence Erlbaum Associates Publishers.
Schmidt, A. E., Green, M. S., & Prouty, A. M. (2015). Effects of parental infidelity and interparental conflict on relational ethics between adult children and parents: A contextual perspective. Journal of Family Therapy, 38(3), 386–408. https://doi.org/10.1111/1467-6427.12091
Stewart, C. M. (2017). Attitudes, attachment styles, and gender: Implications on perceptions of infidelity (Master’s thesis, University of Nevada, Las Vegas). UNLV Theses, Dissertations, Professional Papers, and Capstones, 3172. https://digitalscholarship.unlv.edu/thesesdissertations/3172
Strutzenberg, C. C., Wiersma-Mosley, J. D., Jozkowski, K. N., & Becnel, J. N. (2016). Love-bombing: A narcissistic approach to relationship formation. Discovery, the Student Journal of Dale Bumpers College of Agricultural, Food and Life Sciences, 18(1), 1–12.
Suraj, S., Lohi, R., Singh, B. B., & Patil, P. (2023). Self-esteem and locus of control as predictors of academic achievement: A study among graduate students. Annals of Neurosciences, 31(4). https://doi.org/10.1177/09727531231183214
Tan, S. A., Ang, S. M., Pung, P. W., Teoh, X. Y., & Seow Ling Ooh. (2025). Sex life dissatisfaction contributes to intention toward infidelity among Malaysians: Relationship satisfaction as a mediator. BMC Psychology, 13(1), 1–13. https://doi.org/10.1186/s40359-025-02414-8
Helen Huynh played a lead role in conceptualizing the study and writing the manuscript and a supporting role in data analyses. Tammy Lowery Zacchilli played a lead role in data analysis and a supporting role in writing and revising the manuscript.
Correspondence concerning this article should be addressed to Dr. Tammy Lowery Zacchilli, Department of Social Sciences, Saint Leo University, MC 2127, Box 6665, Saint Leo, FL 33574, United States. Email: tammy.zacchilli@saintleo.edu
Evolutionary Theory and Mating Preferences: A Partial Replication of Kenrick et al.’s (1993) Study
Helen Huynh, Tammy Lowery Zacchilli*, Jillian Falvo, and Emma Pillsbury Department of Social Sciences, Saint Leo University
ABSTRACT. Research has suggested that individuals select mates who meet their evolutionary and social needs. To create successful offspring, women look for a provider and protector, whereas men look for physical attractiveness and childrearing traits. Kenrick et al. (1993) analyzed the differences in mate preferences by studying 24 traits. The purpose of the present study was to conduct a quantitative partial replication of Kenrick and colleagues’ (1993) analysis using wealth, good health, emotional stability, physical attractiveness, ambition, and intelligence as traits across different commitment levels (a date, onenight stand, a sexual partner, a steady dating partner, and a marriage partner). In the partial replication, it was predicted that, as commitment level increases, women would show increasingly higher standards for wealth, emotional stability, and intelligence, and men would show increasingly higher standards for physical attractiveness and good health. Results from 120 participants (72% women, 27% men, 1% prefer not to say) found that men and women were more similar than different. The only significant difference was that women had stronger preferences for emotional stability, especially on a date, F(1, 103) = 10.13, p = .018, and in a steady partner, F(1,112) = 8.79, p = .032. Given substantial cultural and technological changes in relationship norms over the years, the present study provides a contemporary test of key patterns reported by Kenrick et al. (1993). Limitations to the study are convenience sampling and a small sample size. Future research should analyze mate selection in the LGBTQIA+ community and do a complete replication of Kenrick and his colleagues’ studies.
The consistency of trait preferences across different cultures and time periods suggests that human attraction is guided by fundamental psychological and evolutionary mechanisms. Rather than being purely a matter of individual taste, mate selection reflects deeper adaptive strategies shaped by biology and culture. Evolutionary psychologists have suggested that romantic preferences developed over time to maximize reproductive success and genetic fitness.
Traits like physical attractiveness, health, intelligence, and social status serve as cues to a partner’s reproductive value or resource potential (Buss, 2019). As a result, modern decisions about love and attraction are often rooted in ancient biological drives for survival and legacy.
Sexual Strategies Theory
Sexual strategies theory is an extension of Darwin’s two causal processes of mating success, and offers a
Replication badge earned for transparent research practices.
Theory and Mating Preferences | Huynh, Zacchilli, Falvo, and Pillsbury
more detailed framework for understanding how men and women differ in their mating behaviors (Buss and Schmidt, 1993; Masoom, 2022). According to the sexual strategies theory, mating behavior is shaped by two forms of evolutionary selection: intrasexual selection and intersexual selection. Intrasexual selection involves members of the same sex competing to mate with the opposite sex. Men are more active in this process. Men compete by displaying qualities that enhance mate value, such as physical fitness or resource acquisition ability. With intersexual selection, individuals choose partners based on their mate value. On average, women tend to engage more heavily in this evaluative process, selecting mates whose characteristics signal longterm investment, stability, or genetic quality (Buss, 2023; Sefcek et al., 2006). Men and women’s different mating behaviors help them overcome short and longterm mating challenges, which are key to reproductive success and survival.
Men face fewer reproductive constraints, so their primary challenge in longterm mating lies in identifying partners with reproductive potential and traits that signal fertility (Buss, 2023; Selterman et al., 2015). Traits like physical attractiveness and youth convey information about her health, age, history, and likelihood of bearing healthy offsprings (Buss 2023; Selterman et al., 2015). In the shortterm, men focus on acquiring as many sexual partners as possible. Engaging in shortterm relationships maximizes men’s reproductive opportunities with little to no risk in contrast to women (Millar et al., 2018).
On the other hand, women face similar mating challenges in both short and longterm, which differ from those faced by men. Women strive to find a partner who will invest their resources and time into taking care of her and her children and protect them from harm (Buss, 2023). For generations, women have experienced the burden of acquiring resources for themselves and their children during gestation, so finding a partner who is willing to take on the responsibility lifts the burden. Therefore, women tend to be especially selective and strategic in their mating decisions to maximize genetic quality and access to resources (Buss, 2023; Millar et al., 2018). Ultimately, women often value traits that signal protection and resourcefulness—such as wealth, ambition, and bravery—and may, in some cases, change partners to pursue higher mate value associated with greater survival benefits (Buss, 2023; Selterman et al., 2015). Unlike men, shortterm relationships are not as beneficial as longterm relationships because of the longterm consequences of mating with the wrong partner (Millar et al., 2018). Overall, survival and support are key aspects to women’s mating strategy. The parental investment theory provides an indepth review of the
efforts that women and men put into the offspring and how it affects women’s survival.
Parental Investment Theory
Parental investment is the time and effort that parents put into their offspring to increase their offspring’s chance of survival (Trivers, 1972). Investment examples include gestation, lactation, food provision, protection, etc. According to parental investment theory, women incur greater biological investment because they bear the costs of gestation and provide the primary source of nutrition through lactation after birth (Pazhoohi, 2022). Men have lower parental investment because they may choose not to invest beyond conception and instead pursue additional mating opportunities (Pazhoohi, 2022). Consequently, women face the mating challenge of securing a reliable partner who can provide resources and protection, often bearing the burden of raising offspring alone, whereas men may mitigate their mating challenges by seeking other sexual opportunities (Millar et al., 2018). The potential lack of parental investment from men leads to women’s choosiness for traits of longterm resources, emotional stability, and protection. The preferred traits signal to the women that he will show the same level of parental investment and not leave to pursue other mates. However, preferred traits and what people look for in a partner is subject to change based on various factors, such as culture, personal needs, and selfassessment.
Assortative Mating and Perceived Mate Value
In addition to sexbased patterns, individual differences in perceived mate value also influence partner preferences. Individuals who perceive themselves as having high mate value tend to set higher standards and seek partners of equal or greater desirability (Edlund & Sagarin, 2014). Typically, seeking partners with equal or greater desirability applies to egalitarian societies (Van Bavel et al., 2018). For example, in Western countries where men and women are highly active in the job market and educational system, people may look for partners who share the same level of activeness (BechSørensen & Pollet, 2016; Puschmann & PujadasMora, 2024). On the other hand, patterns of assortative mating are subject to change for those with traditional mate preferences. Women may strongly value a financially responsible counterpart, whereas men might have a preference for women with strong homemaking and childrearing skills (Puschmann & PujadasMora, 2024; Van Bavel et al., 2018). As a result, women may purposefully cut down their labor participation to avoid outearning their partner, allowing the partner to be the main provider (Van Bavel et al., 2018). Assortative mating supports
Theory and Mating Preferences | Huynh, Zacchilli, Falvo, and Pillsbury
the idea that partner selection is not only biologically driven but also influenced by selfassessment, social comparison, and culture. Over time, partner selection has shifted due to modern day technology and trends.
The Modern Twist in Mate Selection
Mate selection has evolved as individuals increasingly use media to find partners, moving away from traditional societal norms. Greater media use allows people more control over their selfpresentation and how they are perceived by potential mates. For example, women may use facial filters to appear more youthful, whereas men may pose in ways that enhance perceptions of height and muscularity (Ponseti et al., 2022). With the click of a button, individuals can edit their biography to alter people’s perception to appear more desirable with high mate value. Still, women are selective with finding mates who display qualities of protectiveness and resourcefulness, whereas men look for cues of reproductive opportunities and fertility.
With increasing mental health awareness, emotional stability has become an important trait sought in both online and inperson mate selection. Individuals high in emotional stability are better able to understand others’ complex emotions, provide emotional support, and effectively regulate their own emotions (Chen, 2023; Smetana et al., 2006). In addition to the shift in mental health, access to higher education and employment shifted mate preferences too. Both women and men may judge the fit of a partner based on their level of intelligence. Women may look for a mate with the same or higher level of intelligence as it symbolizes resourcefulness and security, which are beneficial in the longterm (Jonason et al., 2019; Van Bavel et al., 2018). However, men may show a preference for women with lower intelligence as it increases reproductive success and gives men a chance to showcase their mate value (Jonason et al., 2019; Van Bavel et al., 2018).
From this social and evolutionary perspective, individuals select mates based on traits that enhance personal gain, survival, and reproductive success (Buss & Schmitt, 1993). Overall, women look for a partner who can provide and protect, whereas men look for cues of fertility. Mistakenly choosing a partner who has mutations and imperfections, such as sicknesses, diseases, and undesirable behavior and traits, poses a risk for both men and women (Sefcek et al., 2006). Women may not receive the necessary protection and support to raise her children, and men may be at risk of having defective offspring. Although modern technology and changes in social culture have altered mate selection, Kenrick and colleagues’ (1993) study illustrated how past ancestors’ behavior continues to influence behavior today.
Kenrick
et al.’s (1993)
Study: Overview and Findings
Building on these theoretical foundations of evolutionary mate preferences, Kenrick and colleagues (1993) designed a study to examine how such preferences translate into the minimum acceptable traits across different levels of relationship involvement. The levels of partner involvement included: single date, sexual relations, onenight stand, steady dating partner, and marriage. Kenrick et al. (1993) included 24 traits in both of their studies. These traits included kind and understanding, religious, exciting personality, creative and artistic, good housekeeper, intelligent, good earning capacity, wants children, easygoing, good heredity, college graduate, physically attractive, healthy, aggressive, emotionally stable, friendly, popular, powerful, sexy, wealthy, ambitious, good sense of humor, high social status, and dominant. In their original studies, they created composite scores using traits that most closely matched evolutionary explanations of what men and women desired in a romantic partner. For women rating men, they created two composite scores. Dominance consisted of dominant, powerful, and aggressive while status consisted of high status, ambitious, college graduate, wealth, and earning capacity. For men rating women, the authors also created two composite scores. Attractiveness consisted of healthy, sexy, and physically attractive while family orientation consisted of wanting children, good housekeeper, and good heredity. The remaining items were placed into one of four composites, which included agreeableness, extraversion, emotional stability, and intellect. The authors also created an overall aggregate, which included the average of all criterion variables across each partner level. Finally, Kenrick et al. (1993) asked participants to report selfappraisals of the criterion variables.
Item selection followed the factorderived composite structure reported by Kenrick et al. (1993). Rather than choosing individual traits on the basis of face validity, the item groupings that emerged from the authors’ factoranalytic procedures (e.g., dominance, status, attractiveness, family orientation) were used. This strategy ensured conceptual consistency with the original study and minimized potential bias in the operationalization of each construct.
Kenrick et al.’s (1993) results showed that both men and women became increasingly selective as the level of relationship involvement grew more serious, with the highest standards reserved for longterm commitment and marriage. Consistent with evolutionary theory, women placed stronger emphasis on traits linked to status and resources, while men prioritized physical attractiveness and health. Interestingly, both women
Evolutionary Theory and Mating Preferences | Huynh, Zacchilli, Falvo, and Pillsbury
and men considered traits such as kindness, emotional stability, and intelligence as important across all relationship contexts.
Current Study
Although Kenrick et al.’s (1993) work is foundational in the study of mating preferences, the dating landscape has transformed dramatically over the past three decades. The rise of online dating, shifts in gender roles, changes in attitudes toward casual sex, and increased cultural emphasis on equality and autonomy may all influence the traits people view as minimally acceptable in partners at different levels of relationship involvement. Replicating core components of Kenrick and colleagues’ paradigm therefore provides an opportunity to test the stability of wellestablished evolutionary predictions in contemporary contexts. Additionally, partial replications serve an important function by isolating the most theoretically meaningful elements of an original study while allowing for updated measurement and improved methodology. By reexamining these trait thresholds today, it is possible to assess whether previously documented sex differences and evaluative patterns persist—or whether modern social environments have altered how individuals evaluate potential partners.
The current study partially replicated Kenrick et al.’s (1993) approach using a revised set of traits: wealth, good health, emotional stability, physical attractiveness, ambition, and intelligence. Only six of the original 24 traits were assessed to reduce potential fatigue or participant dropout that can occur with longer surveys. Trait selection was based on choosing two traits consistent with evolutionary theory for women (i.e., ambition and wealth) and two traits consistent with evolutionary theory for men (i.e., good health and physical attractiveness). Intelligence was included to directly test Kenrick and colleagues’ (1993) findings regarding sex differences in intelligence ratings across levels of partner involvement. Emotional stability was included because prior research has indicated that emotional qualities such as stability, support, and understanding are important to close relationship quality and mating choices (Chen, 2023; Smetana et al., 2006), and because it reflects increased contemporary attention to mental health (Chen, 2023). Participants rated the minimum percentile they would accept for each trait across the same five relationship contexts. It was hypothesized that women would show increasingly higher standards for wealth, ambition, and intelligence as partner involvement increases, whereas men would show increasingly higher standards for physical attractiveness and good health. No significant sex differences in emotional stability were expected across levels of partner involvement.
Method
Participants
A total of 120 participants (72.0% women, 27.0% men, 1.0% prefer not to say) participated in the study with 42.0% European American/White, 20.0% Latino/ Hispanic, 14.0% Asian American, 12.0% African American/Black, 6.0% Multiracial, and 5.0% reported other. The mean age of the sample was 23.18 (SD = 8.09). Most of the sample reported being in a heterosexual relationship (92.0%) while 8.0% reported being in a same sex relationship. All participants were included in the analyses regardless of sexual orientation.
Materials and Procedure
Participants were recruited using convenience sampling at a private Catholic university in the southeast, as well as sharing the survey on social media. Prior to taking the survey, participants read and agreed to the implied consent form by clicking “I agree” in Qualtrics, an online survey platform. Afterward, participants completed the background inventory, which asked for their age, gender, sexual orientation, racial identification, and if they were a college student. Participants rated the minimum percentage of wealth, good health, emotional stability, physical attractiveness, ambition, and intelligence they would accept in a potential partner across different relationship commitment levels (a date, onenight stand, a sexual partner, a steady dating partner, and a marriage partner). A sample question from the survey is: “For each trait below, what is the minimum percentile you would accept in considering someone for: a date 0%, 10%, 20%, 30%, 40%, 50%, 60%, 70%, 80%, 90%, 100%.”
The rest of the sample items with instructions are located in the Appendix.
Cronbach’s alpha was calculated for each of the six criterion variables across the level of partner involvement, similarly to Kenrick et al.’s (1993) studies. Each of the criterion variables demonstrated high reliability: intelligence (α = .86), physical attractiveness (α = .87), wealth α = .91), good health (α = .88), emotional stability (α = .83), and ambition (α = .82). We did not aggregate scores since we only used six of the 24 original traits.
Results
To partially replicate Kenrick and colleagues’ (1993) study, separate ANOVAs were calculated. A Holm Bonferroni correction was applied to control the family wise error rate that can occur with multiple comparisons. Prior to applying the correction, there were nine significant ANOVAs. After applying the correction, only two of the comparisons remained significant. Table 1 below includes the test details, F values, and Holm adjusted p values. To facilitate direct comparison with
Evolutionary Theory and Mating Preferences | Huynh,
Zacchilli, Falvo, and Pillsbury
Kenrick and colleagues (1993) results, Table 2 presents each trait alongside the corresponding sex differences reported in the original study and in the present study. After applying the Holm–Bonferroni correction, only Test 1 (Emotional stability, date: adj p = .018) and Test 6 (Emotional stability, steady dating partner: adj p = .032) remained significant ( α = .05 ). For a date, women preferred a higher percentile in emotional stability for a date (M = 76.44, SEM = 1.91) than men (M = 72.81, SEM = 1.94). For a steady dating partner, women also preferred a higher percentile (M = 79.38, SEM = 1.67) than men (M = 76.35, SEM = 1.72).
Discussion
The primary objective of the present study was to partially replicate the findings of Kenrick and colleagues (1993) by examining how mate preferences vary across different relationship contexts. After applying the Holm–Bonferroni correction to control for familywise error, only one significant gender difference remained: women rated emotional stability higher than men when considering both a date and a steady dating partner. This finding provides partial support for evolutionary theories such as sexual strategies theory (Buss & Schmitt, 1993) and parental investment theory (Trivers, 1972), which posit greater female selectivity in mate choice due to higher reproductive investment. However, the absence of significant differences for most traits suggests that, in this contemporary sample, men and women are more similar than different in their mate preferences. Whereas the original study reported significant sex differences for traits such as wealth, ambition, and physical attractiveness, only emotional stability remained significant in the present sample after applying the Holm–Bonferroni correction. This sidebyside comparison highlights the growing convergence between men and women in contemporary mate preferences and underscores traits whose relative importance might have shifted over time.
Taken together, these results indicate that, although women placed greater emphasis on emotional stability, other traits—such as ambition, wealth, and intelligence—did not remain significant after correction. These findings highlight the increasing importance of emotional predictability and psychological support in partner selection. Notably, emotional stability emerged as a significant trait even in a relatively shortterm context (dating), suggesting that its relevance may extend across different levels of relationship commitment.
Because this study was designed as a partial replication, direct comparison with Kenrick et al.’s (1993) findings is warranted. Kenrick and colleagues reported that women valued wealth and ambition more highly
than men, particularly in longterm contexts, and that men were more willing to accept lower intelligence in shortterm partners. In contrast, these patterns were not replicated in the present study. Although our data initially showed trends in the predicted directions, none of these effects survived the Holm–Bonferroni correction. Instead, emotional stability—a trait that received less emphasis in Kenrick et al.’s original work—emerged as the only reliable difference across relationship types. Overall, these results suggest greater convergence between men and women across most mate preference traits. Although some expected sex differences appeared directionally consistent, their reduced magnitude highlights the importance of considering both cultural and methodological factors when evaluating evolutionary predictions. This pattern reflects both continuity and change: Certain sex differences appear weaker in contemporary samples, whereas emotional stability might have increased in relative importance.
Beyond methodological considerations, several cultural and social changes over the past three decades
Comparison of Kenrick et al.’s (1993) Study to Current Study
TABLE 1
Significant Results After Applying Holm Bonferroni Correction
TABLE 2
Evolutionary Theory and Mating Preferences | Huynh, Zacchilli, Falvo, and Pillsbury
may help explain these differences. First, gender roles have become substantially less traditional, and women’s increased economic independence might have reduced the necessity of prioritizing status or resourcerelated traits in partner selection. Second, the rise of online dating has expanded the pool of potential partners and altered evaluation strategies, potentially increasing selectivity and emphasizing traits that are psychologically meaningful or immediately observable. Third, cultural attitudes toward casual sex and shortterm relationships have liberalized, which may reduce sex differences that were previously pronounced in early relationship contexts. Finally, contemporary mating norms increasingly prioritize emotional compatibility, autonomy, and mutual support, which may elevate the relative importance of emotional stability. Together, these shifts suggest that, while evolutionary predispositions may continue to shape broad mating strategies, their expression remains sensitive to social and technological change.
Methodological factors may also contribute to the observed discrepancies. Kenrick and colleagues did not apply conservative familywise error corrections, which might have allowed weaker effects to reach statistical significance. In contrast, the present study’s use of the Holm–Bonferroni correction reduced the risk of Type I error but might have increased the likelihood of Type II error by obscuring subtle but meaningful differences. Additionally, broader structural changes since the early 1990s may play a role. For example, as women’s economic opportunities have expanded, wealth may no longer function as a central determinant of partner choice. Similarly, intelligence may now be viewed as a universally desirable trait across relationship types, reducing sex differences observed in earlier samples. Differences in sample composition may further account for discrepancies, as the present sample was smaller, more femaleskewed, and potentially more influenced by contemporary campus culture than participants in Kenrick et al.’s original study.
In addition to these broader patterns, the lack of significant findings for onenight stand contexts diverges from earlier evolutionary predictions. This outcome may reflect a shift toward more egalitarian mating standards or the influence of social desirability in selfreported preferences. As such, observed gender differences were limited to emotional stability in dating and steady dating contexts, providing only partial support for the notion that partner selectivity increases with relationship seriousness.
Several limitations should be acknowledged. First, the modest sample size and disproportionate representation of female participants limit the generalizability of the findings. Second, the use of convenience sampling and selfreport measures introduces potential biases,
including social desirability effects and inaccuracies in self perception. Third, the study did not assess participants’ selfrated mate value, which could provide important insight into assortative mating processes. Finally, an additional limitation is that the sample was drawn from a Catholic university, where religious values may influence attitudes toward dating, sexuality, and partner selection. As a result, participant responses may not fully reflect broader population patterns predicted by evolutionary theories of mating.
Future research should aim to replicate this study using larger, more diverse, and more genderbalanced samples. Including individuals from LGBTQIA+ communities would improve inclusivity and enhance the generalizability of findings; however, the present study’s limited number of participants in samesex relationships precluded such analyses. Additionally, incorporating selfassessments of the traits under investigation would allow for examination of how perceived mate value influences partner preferences. Expanding the trait list to include those examined in Kenrick et al.’s (1993) original research—such as dominance and extraversion—may further clarify mating strategies. Finally, because the present study primarily replicated Study 1 of Kenrick and colleagues’ work, future research could incorporate the sextyping variable included in their Study 2.
In conclusion, the present study offers limited support for evolutionary predictions of sex differences in mate preferences, with emotional stability emerging as the most reliable distinction. Overall, the findings suggest that sex differences in mate preferences may be more constrained than previously assumed, with men and women sharing broadly similar priorities across most traits. Only select characteristics, such as emotional stability, show consistent divergence, indicating that contemporary mate selection reflects an interplay between evolutionary predispositions and modern social influences. Direct comparisons with Kenrick et al. (1993) reveal both overlap and divergence: Whereas several of their reported effects were not replicated, the present findings highlight the growing salience of emotional stability in partner preferences. These results suggest that emotional predictability and psychological support remain central in contemporary mate selection—even in relatively shortterm contexts— whereas the importance of other traits might have shifted due to cultural and methodological change.
The present findings contribute to ongoing discussions regarding the stability of mate preferences over time. Because Kenrick et al.’s (1993) original studies were conducted more than three decades ago, reassessing their core patterns within a modern dating environment provides valuable insight into the robustness of evolutionary predictions across shifting cultural contexts. Although the
Evolutionary Theory and Mating Preferences | Huynh, Zacchilli, Falvo, and Pillsbury
present study represents a partial replication, its focus on theoretically central constructs allowed for meaningful evaluation of relationship selectivity while accounting for the substantial social and technological changes that characterize contemporary mating landscapes.
References
Bech-Sørensen, J., & Pollet, T. V. (2016). Sex differences in mate preferences: A replication study, 20 years later. Evolutionary Psychological Science, 2(3), 171–176. https://doi.org/10.1007/s40806-016-0048-6
Buss, D. M. (2019). Evolutionary psychology: The new science of the mind (6th ed.). Routledge.
Buss, D. M. (2023). The sexual selection of human mating strategies. Oxford University Press EBooks, 15–41. https://doi.org/10.1093/oxfordhb/9780197524718.013.1
Buss, D. M., & Schmitt, D. P. (1993). Sexual strategies theory: An evolutionary perspective on human mating. Psychological Review, 100(2), 204–232. https://doi.org/10.1037/0033-295X.100.2.204
Chen, Y. N. (2023). The relationship between personality traits, emotional stability and mental health in art vocational and technical college students during epidemic prevention and control. Psychology Research and Behavior Management, 16, 2857–2867. https://doi.org/10.2147/PRBM.S417243
Edlund, J. E., & Sagarin, B. J. (2014). Mate value and mate preferences: How relationship status affects desire for ideal mate characteristics. Human Nature, 25(2), 213–227. https://doi.org/10.1007/s12110-014-9192-1
Jonason, P. K., Marsh, K., Dib, O., Plush, D., Doszpot, M., Fung, E., Crimmins, K., Drapski, M., & Di Pietro, K. (2019). Is smart sexy? Examining the role of relative intelligence in mate preferences. Personality and Individual Differences, 139, 53–59. https://doi.org/10.1016/j.paid.2018.11.009
Kenrick, D. T., Groth, G. E., Trost, M. R., & Sadalla, E. K. (1993). Integrating evolutionary and social exchange perspectives on relationships: Effects of gender, self-appraisal, and involvement level on mate selection criteria. Journal of Personality and Social Psychology, 64(6), 951–969. https://doi.org/10.1037/0022-3514.64.6.951
Masoom, M. R. (2022). What potential traits do adolescents and early adults look for in mate preferences? Heliyon, 8(12), e12169. https://doi.org/10.1016/j.heliyon.2022.e12169
Millar, M., Westfall, R. S., & Lovitt, A. (2018). The influence of mate value on
women’s desire for long and short-term mates: Implicit responses. Personality and Individual Differences, 130, 36–40. https://doi.org/10.1016/j.paid.2018.03.043
Pazhoohi, F. (2022). Parental investment theory. In T. K. Shackelford (Ed.), The Cambridge handbook of evolutionary perspectives on sexual psychology (pp. 137–159). https://doi.org/10.1017/9781108943529.010
Ponseti, J., Diehl, K., & Stirn, A. V. (2022). Is dating behavior in digital contexts driven by evolutionary programs? A selective review. Frontiers in Psychology, 13. https://doi.org/10.3389/fpsyg.2022.678439
Puschmann, P., & Pujadas-Mora, J. M. (2024). The quest for a partner in the past and today: Exploring trends and drivers in partner preferences and selection through new sources and approaches. The History of the Family, 29(4), 445–460. https://doi.org/10.1080/1081602X.2024.2417749
Sefcek, J. A., Brumbach, B. H., Vasquez, G., & Miller, G. F. (2006). The evolutionary psychology of human mate choice. Journal of Psychology & Human Sexuality, 18(2–3), 125–182. https://doi.org/10.1300/j056v18n02_05
Selterman, D. F., Chagnon, E., & Mackinnon, S. P. (2015). Do men and women exhibit different preferences for mates? A replication of Eastwick and Finkel (2008). SAGE Open, 5(3). https://doi.org/10.1177/2158244015605160
(Original work published 2015)
Smetana, J. G., Campione-Barr N., & Metzger A. (2006). Adolescent development ininterpersonal and societal contexts. Annual Review Psychology, 57, 255–284. https://doi.org/10.1146/annurev.psych.57.102904.190124
Trivers, R. L. (1972). Parental investment and sexual selection. In B. Campbell (Ed.), Sexual selection and the descent of man, 1871–1971 (pp. 136–179). Aldine. Van Bavel, J., Schwartz, C. R., & Esteve, A. (2018). The reversal of the gender gap in education and its consequences for family life. Annual Review of Sociology, 44(1), 341–360. https://doi.org/10.1146/annurev-soc-073117-041215
Helen Huynh played a lead role in writing, data collection, and revision and a supporting role in data analysis. Tammy Lowery Zacchilli played a lead role in developing the research idea, writing the manuscript, and analyzing data and a supporting role in revising the paper and data collection. Jillian Falvo and Emma Pillsbury played a lead role in data collection and a supporting role in data analysis.
Correspondence concerning this article should be addressed to Tammy Lowery Zacchilli. Email: tammy.zacchilli@saintleo.edu
APPENDIX
Sample Items
For each type of relationship listed below, indicate the lowest percentile that you would be willing to consider for each trait. For example, if you would only consider someone with intelligence at the 90th percentile for marriage, you would choose 90%. A person at the 50th percentile would be above 50% of other people on kind and understanding and below 49% of the people in this dimension. Use 100 to indicate someone who was above the rest of the population and 0 to indicate someone below the rest of the population.
For each trait below, what is the minimum percentile you would accept in considering someone for: a date
Intelligence
Physical Attractiveness
Wealth
Good health
Emotional stability
Ambition
For each trait below, what is the minimum percentile you would accept in considering someone for: a sexual partner
Intelligence
Physical Attractiveness
Wealth
Good health
Emotional stability
Ambition
Exploring the Impact of Supplemental Education During the Pandemic on Subsequent Academic Performance
Jordan M. Robinette and Nancy J. Karlin*
College of Education and Behavioral Sciences, University of Northern Colorado
ABSTRACT.This study explored the amount of supplemental education provided by parents to their preschoolaged children (ages 3 to 5) at the beginning of the coronavirus disease 2019 pandemic (COVID19) and those same children’s academic performance in the 2023–2024 school year. It was hypothesized that children who received higher levels of parental supplemental education during the COVID19 pandemic would show stronger literacy and mathematics performance in 2023–2024. The Parental Support During Academic Disruption Survey, which includes a total of 111 items, 80 of which measure supplemental education and academic performance, was designed to consider the impact of parental support for children who had recently or were about to enter formal education. Subcomponents of the instrument also measure demographic and technology/resource availability. Data was collected from 101 parents of children aged 7–9 in northern Colorado. The results revealed a significant positive correlation between supplemental education in literacy and mathematics and academic performance. Regression analyses indicated that supplemental literacy education significantly predicted literacy performance (p = .005, R² = .08), and supplemental mathematics education predicted mathematics performance (p < .001, R² = .12). These findings suggest that children who received more supplemental education during the COVID19 pandemic demonstrated stronger academic outcomes in the 2023–2024 school year, highlighting the potential longterm impact of parental involvement during educational disruptions. This supported the idea that there are longterm benefits of structured parental support during periods of educational disruption.
The World Health Organization (WHO) declared coronavirus disease 2019 (COVID 19) a pandemic on March 11, 2020 (Centers for Disease Control and Prevention [CDC], 2023; WHO, 2020), which led to widespread school closures and a shift to remote learning that significantly impacted education in the United States. Early childhood education is a critical period for foundational skill development (Burchinal et al., 2016), and research has highlighted young children’s vulnerability to learning interruptions, which can cause developmental delays. Scholars widely acknowledge the COVID19 pandemic’s negative effects on early childhood education (ECE), yet there is limited empirical research on its impact on informal education and the role of parental socialization during crises. Beyond academic instruction, children develop essential social skills in classroom settings, and missing these interactions can hinder their ability to navigate school
challenges (CortésAlbornoz et al., 2023; Uğraş et al., 2023). Systematic reviews have reported postpandemic socialization disruptions and language acquisition delays (CortésAlbornoz et al., 2023; Uğraş et al., 2023). However, a study by the Center for Education Policy Research at Harvard and The Educational Opportunity Project at Stanford found slight academic recovery by 2023, with gains of 0.17 grade levels in mathematics and 0.08 grade levels in literacy (Fahle et al., 2024). While some students show resilience, recovery remains below prepandemic levels, and the factors that have contributed to individual differences in learning delays are still unclear. This study examined the relationship between supplemental education during the pandemic and academic performance after the pandemic to inform strategies for mitigating negative developmental outcomes in times of crisis.
Supplemental Education
Supplemental education refers to learning opportunities beyond conventional classrooms. In this study, the definition of supplemental education is extended to refer to structured literacy and math activities that parents implemented at home during the pandemic. Supplemental education has historically played a vital role in addressing children’s academic needs through personalized learning experiences. Adaptive learning technologies enhance this process by tailoring education to individual student needs. A 2022 poll by the National Parents Union identified eight categories of parental interest in supplemental education programs, including academic, arts, athletics, career prep, community, culture, mental health support, and religion (Croft et al., 2022). Understanding supplemental education requires recognizing diverse learning styles: visual, auditory, reading/ writing, and kinesthetic (Malvik, 2020). Research suggests that when supplemental education aligns with children’s learning preferences, it can significantly enhance their academic outcomes and foster a love for learning. This alignment is particularly critical in early childhood education, where engagement and motivation are essential for developing foundational skills.
Parental Involvement During and After the Pandemic
Parental involvement is a key factor in educational success, with previous research demonstrating a positive correlation between active parental engagement and academic achievement (Wilder, 2013). However, the Annie E. Casey Foundation (2022) suggests that during the pandemic, increased parental involvement sometimes hindered students’ adaptability to remote learning. The shift in educational responsibility placed unprepared parents under significant stress, affecting family dynamics. Parental involvement includes various activities that support children’s learning and development (Ma et al., 2016), but its extent during the pandemic depended on factors like education level, employment, and resources (Lordi & Tan, 2023). Knopik et al. (2021) identified three parental roles. These included the committed teacher, the autonomysupporting coach, and the autonomysupporting coach. The committed teacher managed school logistics, the autonomysupporting coach encouraged independence, and the intervener dedicated extensive time to education. These roles highlight the diverse ways parents navigated educational challenges during the crisis.
Child Development Between the Ages of 3 and 5
Child development encompasses growth from birth to age eight, with the first five years being crucial (Committee on the Science of Children Birth to Age 8, 2015). During ages
three to five, children develop cognitive skills, vocabulary, and mathematical abilities essential for school readiness. The CDC emphasizes the importance of social interactions in developing independence and shaping personalities (CDC, 2023). The pandemic has indirectly impacted child development, with increased developmental delays and learning disabilities, particularly in language and social skills reliant on inperson experiences (Mulkey et al., 2023). These effects have exacerbated underlying risks for some children. Research indicates a concerning increase in behavioral issues and mental health challenges among young children attributed to the disruption of their social environments and routines during the pandemic (Brunton, 2022). As children return to inperson learning, the importance of addressing these developmental gaps becomes evident, highlighting the need for targeted interventions and support systems within educational settings.
Observable Academic Proficiency in the 2023–2024 School Year
The federal COVID19 public health emergency ended May 11, 2023 (CDC, 2023). Thus, the current study focused on academicfocused supplemental education provided during preschool years amidst pandemic conditions for postpandemic children aged 7 to 9 during the 2023–2024 academic year. In Colorado, this age group typically corresponds to grades 2 through 4. Academic proficiency was measured using the Colorado Academic Standards (CAS), which outline expectations across various content areas, including literacy and mathematics. Although each grade has specific academic benchmarks, the Colorado Essential Skills are aligned across grade levels so that each grade builds on previously learned skills. (Colorado Department of Education, 2020a). This study focused on reading, writing, communicating, and mathematics expectations to assess academic proficiency. Additionally, understanding the longterm impact of the pandemic on educational attainment requires a comprehensive evaluation of student progress, incorporating qualitative measures such as engagement and motivation.
Purpose
The impacts of COVID 19 on education have been profound, particularly for early childhood development. This literature review highlighted the need for continued research and intervention strategies to support young learners in recovering from the disruptions caused by the pandemic. Millions of children had their foundational developmental milestones disrupted, creating widespread concern about the longterm effects on their academic and social growth. The need for the current research lay in understanding how parents supported
their children during this critical period. By identifying successful parental strategies for mitigating learning losses, this study aimed to inform future interventions and educational policies, providing valuable insights into how to better support early childhood development during times of crisis. The authors sought to better understand how the level of parental involvement influences children’s academic performance.
A crosssectional correlational survey focusing on the supplemental education parents provided and the academic performance of their children set the foundation for the current study. Prior research shows that parental engagement and supplemental learning activities can strengthen early literacy and numeracy skills (Ma et al., 2016; Wilder, 2013). Similarly, structured parental involvement during the pandemic has been linked to children’s resilience in academic performance (Knopik et al., 2021; Lordi & Tan, 2023). These findings suggest that when parents provide consistent, targeted learning support, children are better able to maintain academic progress despite disruptions. Building on this evidence, the present study hypothesized that higher levels of parental supplemental education during the pandemic would predict stronger literacy and mathematics performance in 2023–2024. The goal of this study was to provide insight for educators, policymakers, and families regarding best practices for fostering resilience and mitigating future educational disruptions in times of crisis.
Method
Participants
This study included 101 parents aged 18 or older. Participants were recruited primarily through convenience sampling through flyer distribution, community tabling events, and library outreach. Data was collected from parents of children who were preschoolaged during the pandemic, and aged 7 to 9 during data collection. Participants resided in one of the seven largest cities in Weld and Larimer counties. These cities were designated as study areas due to their population size and accessibility for recruitment (World Population Review, 2024a; 2024b). All parents experienced the COVID19 pandemic while parenting a preschoolaged child. To be eligible, their child must have been enrolled in school in one of seven designated study areas during the 2023–2024 academic year. Recruitment was conducted through digital platforms such as Facebook and Reddit, inperson community events including a regional public library and university homecoming tailgate that included individuals of diverse backgrounds, and physical flyers distributed in targeted locations. A G*Power analysis indicated a minimum of 76 participants for the study. Cases with any missing data were removed, resulting in the final sample of 101 participants.
Table 1 provides an overview of participant demographics. The sample consisted primarily of women, most of whom were married and between the ages of 35 and 44. The sample was predominantly White, with limited representation from other racial and ethnic groups. Participants generally reported high levels of educational attainment and were predominantly employed fulltime. Household sizes were typically larger and reported household incomes skewed toward higher income ranges. Participants were drawn from multiple cities across northern Colorado, with the largest proportions residing in Fort Collins, Greeley, and Loveland.
Apparatus
The Parental Support During Academic Disruption Survey, the primary tool for data collection, was an online survey designed to examine the supplemental education provided to children aged 3 to 5 during the COVID19 pandemic and its impact on their educational performance in the 2023–2024 school year (See Table 1). This education included both online and inperson activities that promoted learning through four styles: visual, auditory, reading/writing, and kinesthetic (Malvik, 2020). The full survey is available on the Open Science Framework (Robinette & Karlin, 2025). The survey was developed using the Qualtrics platform by the primary researcher and was available in both English and Spanish. The study employed a single survey (The Parental Support During Academic Disruption Survey) to examine supplemental education and educational performance. This survey was created by the primary investigator. No incentives were offered for completing the survey. However, two gift cards and a prize item were given out in raffle form at the university’s event. These incentives served only for community engagement and were not used as payment for participation. The survey contained one consent form and 111 questions that assessed demographic information, technology availability during the pandemic, supplemental education in literacy and mathematics, and academic performance during the 2023–2024 school year. The consent form was presented (Protocol Number 2406060365) followed by 15 demographic questions, 16 items assessing technology/resource availability, 40 questions about supplemental education, and 40 questions regarding academic performance (19 for literacy and 21 for mathematics). The section assessing supplemental education included 40 questions in total, 20 questions in each literacy and mathematics.
Within each subject, the questions were grouped by learning style, with five questions each targeting visual, auditory, reading/writing, and kinesthetic approaches. Responses were measured on a 5point Likerttype scale ranging from 1 (strongly disagree) to 5 (strongly agree).
Impact
The performance assessment section consists of 40 questions rated on a 5 point scale. Higher scores reflected greater proficiency in literacy and mathematics. An example of a question used to assess supplemental education is “During the COVID19 pandemic shutdown, I explored language learning apps offering audiobased lessons and interactive activities, providing my child with engaging opportunities to improve language skills through auditory learning.” An example of a question used to assess academic performance is “By the end of the 2023–2024 school year, my child can summarize stories or informational texts accurately.”
Translation
Both the flyer and consent form were translated from English to Spanish by a graduate student at a regional Hispanic Cultural Center. The survey was then translated using DeepL, a Neural Machine Translation software, as an attempt to verify the accuracy of the original translation. Subsequently, items were finally reviewed by three native Spanish speakers for translation accuracy.
Procedure
Parents of children aged 7 to 9 were contacted and provided with a community flyer in English and Spanish. Flyers were posted in community areas and shared on digital platforms like Facebook to reach a broader audience. Screening questions ensured participants met the study’s criteria. Participants received detailed information about the study, including its purpose, procedures, risks, and benefits. Informed consent was obtained electronically through Qualtrics, ensuring voluntary participation and confidentiality. All data were anonymized and stored securely, accessible only to the research team. This study protocol was approved by the IRB review committee (2406060365) and meets ethical guidelines.
Potential participants were provided with instructions on how to access a link for informed consent. Upon consent, participants completed the survey. The survey included multiplechoice and rating scale questions about supplemental education provided between March 1, 2020, and February 1, 2021 (Denton & Fries, 2020; Johnson, 2021). Completion of the survey required less than 30 minutes, and all data collection occurred online. To mitigate potential sampling bias, multiple recruitment methods were employed, including outreach via social media, library popup events, and schoolbased parent tables. This approach helped diversify the sample by reaching participants from a variety of contexts.
Results
The present study explored the relationship between supplemental education provided to preschoolers during
$40,000-$49,000
$50,000-$59,000
$60,000-$69,000
Impact of Supplemental Education During the Pandemic | Robinette and Karlin
the COVID19 pandemic and academic performance during the 2023–2024 school year. Prior to analysis, all survey responses were reviewed for completeness and potential inconsistencies. Only fully completed surveys were retained, resulting in the removal of 40 incomplete responses. No additional cases were excluded, as no patterns of inconsistent responding were identified. This resulted in the study having a sample of 101 participants, all parents of schoolaged children between the ages of 7 and 9 at the time of measurement. Variables were analyzed to understand how supplemental education given to preschoolers during the COVID19 pandemic affected their academic performance in the 2023–2024 school year. The study also examined demographic patterns to identify factors contributing to the academic performance of these children. Understanding these dynamics is critical for identifying areas where targeted interventions or supports may be most effective, particularly in addressing disparities for access to resources or academic opportunities.
Cronbach’s Alpha Tests
Cronbach’s alpha for the supplementaleducation questions (Questions 32 to 70) was α = .96. For the academicperformance questions (Questions 71 to 111) it was α = .97. Both values indicate high internal consistency for each construct.
Exploratory Factor Analysis
Prior to conducting EFA, data suitability was assessed using the KaiserMeyerOlkin (KMO) measure and Bartlett’s test of sphericity. For supplemental education items, KMO = .89 and Bartlett’s test was significant (χ² = 3204.97, p < .001). For academic performance items, KMO = .89 and Bartlett’s test was significant (χ² = 4406.37, p < .001), indicating the data were suitable for factor analysis.
Statistical Analysis
Several forms of analysis were completed postdescriptive analysis to evaluate the relationship and predict variables of interest. Analyses included simple linear regression and a Spearman rankorder correlation.
Simple Linear Regression
Simple linear regression analyses were conducted to evaluate the extent to which supplemental education in literacy could predict academic performance in literacy during the 2023–2024 school year.
Literacy. Figure 1 shows a simple linear regression analysis that was conducted to evaluate the extent to which supplemental education in literacy could predict academic performance in literacy. A significant regression was found, F(1, 99) = 7.40, p = .008. The R² was
approximately .07, indicating that supplemental literacy education explained about 7% of the variance in literacy performance.
Confidence intervals indicated that we can be 95% certain that the slope to predict literacy performance from supplemental literacy education was between 0.05 and 0.32.
Mathematics. Figure 2 shows a simple linear regression analysis that was conducted to evaluate the
Note
FIGURE 1
FIGURE 2
Impact of Supplemental Education During the Pandemic | Robinette and Karlin
extent to which supplemental education in mathematics could predict academic performance in mathematics. A significant regression was found, F(1, 99) = 12.92, p < .001. The R² was approximately .12, indicating that supplemental mathematics education explained about 12% of the variance in mathematics performance.
Confidence intervals indicated that we can be can be 95% certain that the slope to predict mathematics performance from supplemental mathematics education was between 0.14 and 0.45.
Total Supplemental Education. Figure 3 shows a simple linear regression analysis that was conducted to evaluate the extent to which total supplemental education (combined literacy and mathematics) could predict total academic performance. A significant regression was found, F(1, 99) = 11.41, p = .001. The R² was approximately .10, indicating that total supplemental education explained about 10% of the variance in total academic performance.
Confidence intervals indicated that we can be 95% certain that the slope to predict total academic performance from total supplemental education was between 0.11 and 0.41.
Spearman Rank Correlation
Figures 4 through 6 show Spearman rank correlation analyses assessing the relationship between parental education levels and academic performance scores. The education levels were encoded such that higher numbers represent higher levels of education. Spearman’s rho showed nonsignificant positive associations between parental education and performance: ρ = .13, p = .191 (literacy); ρ = .14, p = .162 (mathematics); ρ = .15, p = .137 (total). This suggests the relationship between parental education levels and academic performance (literacy, mathematics, and total scores) is not statistically significant in the current dataset.
Discussion
The present study examined the relationship between demographic factors, parental involvement, and academic performance, with supplemental education as the key focus area. The results demonstrated several noteworthy findings that aligned with other existing literature on this topic. Supplemental education in literacy and mathematics was significantly associated with reported higher academic outcomes, though the effect was more pronounced for mathematics. Higher academic performance scores indicate greater parental agreement that children demonstrated grade level academic skills. The observed data reflect modest changes rather than large shifts in performance. These findings corroborate prior research by Ma et al. (2016), which
emphasized the importance of parental engagement in fostering academic achievement, particularly when that engagement is targeted toward specific subject areas.
Although the relationship between supplemental education and academic performance was modest, the persistence of these associations several years after the pandemic is noteworthy. These findings suggest that small amounts of structured parental support during early childhood may contribute to longterm academic outcomes. Together, these results highlight the potential
Note. Education level coded as 1 = High school, 2 = 2- year degree, 3 = Some college, 4 = 4-year degree, 5 = Professional degree, 6 = Doctorate. Error bars represent the interquartile range. Spearman's rho = 0.13, p = .191.
FIGURE 3
Relationship of Total Supplemental Education and Total Academic Performance
Note. The solid line represents the linear regression fit. R2 = 0.103, p = .001.
FIGURE 4
Distribution of Academic Performance in Literacy by Parental Education Level
Impact
value of providing parents with accessible, targeted guidance for supporting early learning during times of educational disruption.
Limitations
Several limitations should be considered when interpreting these findings. First, the study relied on selfreported data from parents, which introduces the possibility of bias. Parents may have unintentionally misrepresented the amount of supplemental education provided or their children’s academic performance. Future research could improve reliability by incorporating objective indicators, such as standardized assessments. Another factor that could add bias is that the survey was retrospective. Parents were asked to recall their practices during the early pandemic years, which increases the risk of recall bias.
An additional limitation to consider is that the sample was demographically skewed. Most respondents were predominantly white women, aged 35–44, from highincome households in a single state. These characteristics limit the generalizability of the findings to parents from different racial or ethnic backgrounds, socioeconomic groups, geographic regions, or age ranges. Future studies should prioritize recruiting more diverse participants across locations and family structures.
Although reliability analyses indicated high internal consistency (alphas > .90), such high values may suggest redundancy in the survey. A shorter version of the Parental Support During Academic Disruption Survey could be developed in future studies to reduce participant burden and improve completion rates. Future iterations of the tool could use item analysis to identify and remove repetitive items and revalidate the shortened form.
Another limitation of this study is that it did not fully account for several potentially influential household factors, such as the number of siblings, involvement of grandparents, tutors, family employment, and income levels. Although these ideas were explored for demographic reasons, they were not considered as factors impacting academic outcomes in this study. These unmeasured variables could also have contributed to children’s academic outcomes. It is important to note that parents who were able to provide higher levels of supplemental education may also have had greater financial or educational resources, which could have contributed to their children’s academic outcomes. Future researchers may consider looking into these factors and seeing how differences in resources contribute to the ability to give supplemental education.
Conclusion
This study highlights the important role of parental involvement, supplemental education, and structured
technology use in shaping academic performance. Notably, mathematics education proved to be a particularly impactful area for intervention, suggesting that focused educational programs in this area could lead to significant improvements. However, the findings also suggest a complexity for these relationships, with demographic diversity and the quality of interventions potentially playing a role in outcomes. To enhance future research, addressing the limitations identified in this study and incorporating insights from prior research is important. These steps can help
Note. Education level coded as 1 = High school, 2 = 2- year degree, 3 = Some college, 4 = 4-year degree, 5 = Professional degree, 6 = Doctorate. Error bars represent the interquartile range. Spearman's rho = 0.14, p = .162.
Note. Education level coded as 1 = High school, 2 = 2- year degree, 3 = Some college, 4 = 4-year degree, 5 = Professional degree, 6 = Doctorate. Error bars represent the interquartile range. Spearman's rho = 0.15, p = .137.
FIGURE 5
Distribution of Academic Performance in Mathematics by Parental Education Level
FIGURE 6
Distribution of Academic Performance Total by Parental Education Level
Impact
develop strategies that better support students and reduce disparities in academic achievement. As well, The Parental Support During Academic Disruption Survey should be revised to incorporate use during other periods of educational interruptions. Slight adjustments in the removal of reference to the pandemic and replacing the term with specific descriptors for other potential educational interruptions are possible. In addition, the academic performance standards were drawn from the Colorado Academic Standards (Colorado Department of Education, 2020a; 2020b). Future studies should reference the relevant local or state academic standards to contextualize results.
Implementing these findings could involve developing programs encouraging targeted parental involvement, particularly in mathematics, and promoting structured educational technology use in the home. Schools and community organizations may play a pivotal role by offering resources and training to help parents effectively engage with their children’s education and utilize technology in ways that maximize academic benefits, even in academically challenging times. These findings suggest that parents can continue to provide supplemental education beyond the pandemic to help offset learning losses associated with that period. Furthermore, these findings encourage the use of supplemental education during future academic disruptions to help sustain children’s academic progress when formal schooling is interrupted.
References
Brunton, R. (2022, March 14). Social skill development of young children amid the pandemic. ZERO to THREE. https://www.zerotothree.org/resource/ journal/social-skill-development-of-young-children-amid-the-pandemic/ Burchinal, M., (2018). Measuring early care and education quality. Child Development Perspectives, 12(1), 3–9. https://doi.org/10.1111/cdep.12260
Centers for Disease Control and Prevention. (2023, March 15). COVID-19 timeline. Centers for Disease Control and Prevention; CDC. https://www.cdc.gov/museum/timeline/covid19.html
Colorado Department of Education. (2020a, July 8). Mathematics academic standards https://www.cde.state.co.us/comath/statestandards
Colorado Department of Education. (2020b, September 1). Reading, writing, and communicating https://www.cde.state.co.us/coreadingwriting Committee on the Science of Children Birth to Age 8. (2015, July 23). Child development and early learning. In L. Allen & B. B. Kelly (Eds.), Transforming the workforce for children birth through age 8: A unifying foundation National Academies Press. https://www.ncbi.nlm.nih.gov/books/NBK310550/ Cortés-Albornoz, M. C., Ramírez-Guerrero, S., García-Guáqueta, D. P., Vélez-Van-Meerbeke, A., & Talero-Gutiérrez, C. (2023). Effects of remote learning during COVID-19 lockdown on children’s learning abilities and school performance: A systematic review. International Journal of Educational Development, 101(102835), 102835. https://doi.org/10.1016/j.ijedudev.2023.102835
Croft, M., Spurrier, A., & Squire, J. (2022, October). Education beyond the classroom: Parent demand and policy support for supplemental learning options https://files.eric.ed.gov/fulltext/ED626052.pdf
Denton, R., & Fries, T. (2020, April 8). Coronavirus timeline: An in-depth look at COVID-19 in Colorado. The Denver Post. https://www.denverpost.com/2020/04/08/colorado-coronavirus-covid-timeline/ Fahle, E., Kane, T., Reardon, S., & Staiger, D. (2024). The first year of pandemic recovery: A district-level analysis. https://educationrecoveryscorecard.org/ wp-content/uploads/2024/01/ERS-Report-Final-1.31.pdf
Johnson, D. (2021, January 4). Here’s when school districts plan to return to in-person learning. https://www.9news.com/article/news/education/ back-to-learning/heres-when-school-districts-plan-to-return-to-in-personlearning/73-bb5a7be3-71aa-406d-a5ec-b670526c4d12
Knopik, T., Błaszczak, A., Maksymiuk, R., & Oszwa, U. (2021). Parental involvement in remote learning during the COVID‐19 pandemic—Dominant approaches and their diverse implications. European Journal of Education, 56(4), 623–640. https://doi.org/10.1111/ejed.12474
Lordi, N., & Tan, S. (2023). Experiences of families with young children during the COVID-19 pandemic, 2020 to 2021 https://healthpolicy.ucla.edu/sites/default/files/2023-06/families-withyoung-children-during-covid-19-pandemic-policybrief-jun2023.pdf
Malvik, C. (2020, August 17). 4 types of learning styles: How to accommodate a diverse group of students. Rasmussen University. https://www.rasmussen.edu/degrees/education/blog/types-of-learning-styles/
Ma, X., Shen, J., Krenn, H., Hu, S., & Yuan, J. (2016). A meta-analysis of the relationship between learning outcomes and parental involvement during early childhood education and early elementary education. Educational Psychology Review, 28(4), 771–801. https://doi.org/10.1007/s10648-015-9351-1
Mulkey, S. B., Bearer, C. F., & Molloy, E. J. (2023). Indirect effects of the COVID-19 pandemic on children relate to the child’s age and experience. Pediatric Research, 94(5), 1586–1587. https://doi.org/10.1038/s41390-023-02681-4
Robinette, J., & Karlin, N. (2025). The Parental Support During Academic Disruption Survey. Open Science Framework. https://osf.io/9pgc3/overview
The Annie E. Casey Foundation. (2022, December 14). Parental involvement in your child’s education. The Annie E. Casey Foundation. https://www.aecf. org/blog/parental-involvement-is-key-to-student-success-research-shows
Uğraş, M., Zengin, E., Papadakis, S., & Kalogiannakis, M. (2023). Early childhood learning losses during COVID-19: Systematic review. Sustainability, 15(7), 6199. https://doi.org/10.3390/su15076199
Wilder, S. (2013). Effects of parental involvement on academic achievement: A meta-synthesis. Educational Review, 66(3), 377–397. https://doi.org/10.1080/00131911.2013.780009
World Health Organization. (2020). Coronavirus disease (COVID-19). World Health Organization. https://www.who.int/health-topics/coronavirus#tab = tab_1 World Population Review. (2024a). Larimer County, Colorado Cities (2024) World Population Review.
https://worldpopulationreview.com/us-cities/colorado/larimer-county World Population Review. (2024b). Weld County, Colorado Cities (2024). World Population Review.
Nancy J. Karlin https://orcid.org/0000000308206903
Jordan M. Robinette is now at the University of Colorado Denver.
We have no known conflict of interest to disclose. This study was supported by the Undergraduate Research & Creative Works Grant from the University of Northern Colorado. We thank the McNair Scholars Program, including Krista Caufman, Jordan Garcia, and Erin van Gorkom, for their insightful guidance.
Jordan M. Robinette played a lead role in conceptualization, research design, data collection, data analysis and interpretation, and substantive original writing. Nancy J. Karlin played a supporting role in conceptualization, research design, interpretation, and editorial assistance.
Correspondence concerning this article should be addressed to Nancy J. Karlin, McKee Hall 126. Campus Box 106. Greeley, CO 80639 Email: nancy.karlin@unco.edu
Cultivating Belonging Through Identity-Expression: Normalizing Pronoun Use in Introductions Affects Pronoun Comfort and Usage
Jasmine H. Borland and Tonya M. Buchanan* Department of Psychology, Central Washington University
ABSTRACT. LGBTQIA+ individuals are experiencing a public health crisis driven by internal and external stressors that are disproportionate compared to the nonLGBTQIA+ population (e.g., Bauer et al., 2015; Bockting et al., 2013; James et al., 2016). The present study empirically investigated how the impact of exposure to genderneutral (they/them) pronoun use during an introduction affects frequency of use and levels of comfort using those pronouns for others, selfesteem, and anxiety. Participants included 219 undergraduates who were randomly assigned to a condition framed as a memory assessment featuring a brief video introduction that included a name and genderneutral pronouns or only a name. Measures used include the Rosenberg SelfEsteem Scale, StateTrait Anxiety Inventory, and a 1item Likert measure of comfort with genderneutral pronoun use. We found a significant effect of LGBTQIA+ identity on selfesteem, F(1, 215) = 12.93, p < .001, anxiety, F(1, 215) = 8.03, p = .01, use of genderneutral pronouns for another, F(1, 214) = 24.53, p < .001, and comfort using genderneutral pronouns to refer to another, F(1, 215) = 22.77, p < .001. We also found a significant effect of pronoun condition on use of genderneutral pronouns, F(1, 214) = 84.34, p < .001, and comfort using those pronouns to refer to others, F(1, 215) = 4.66, p = .03 However, we did not find any interactions between LGBTQIA+ identity and pronoun condition on our outcomes of interest with the exception of actual pronoun use, in which LGBTQIA+ participants were especially likely to use gender neutral pronoun use for another when exposed to those pronouns in an introduction, F(1, 214) = 4.69, p = .03. The present findings suggest that stating genderneutral pronouns in introductions may aid in increasing gender neutral pronoun use and, consequentially, comfort with and use of affirming language. This is encouraging given that prior work has shown that creating an affirming environment can promote resiliency and reduce stressors faced by LGBTQIA+ individuals.
Diversity badge earned for conducting research focusing on aspects of diversity.
Stigma, prejudice, and discrimination against the transgender and nonbinary (TNB) community1 are wellestablished in the literature throughout a variety of settings, including but not limited to universities, K–12 schools, workplaces, places of public accommodation, health care institutions, and shelters for those who are victims of abuse or houseless (e.g., Farmer et al., 2020; James et al., 2016; Perales et al., 2022). This literature includes evidence of the microaggressions and discrimination TNB individuals face for nontraditional expression and performance of gender, traditional gender role endorsement relating to stigma, and the impact of genderism/cisgenderism2 on sexual and gender minorities (e.g., Buck, 2016; Tebbe & Budge, 2022; Tebbe & Moradi, 2012). It is also well documented that TNB individuals, as well as other members of the LGBTQIA+ community, have disproportionately high rates of suicidal ideation and suicide attempts, PTSD, anxiety, depression, substance abuse, self harm, disordered eating, somatization, and general psychological distress (e.g., Bockting et al., 2013; Tebbe & Budge, 2022; The Trevor Project, 2023). A little under half of the respondents in the U.S. Transgender Survey (USTS; James et al., 2016) reported that they had significant psychological distress (39%) and suicide attempts in their lifetime (40%). Twelve percent of respondents also stated that they had attempted suicide in the last year, which is nearly 12 times that of the general U.S. population. This research demonstrates a need for further insights into mitigating these disparate challenges within sexual and gender minority populations.
Stigma related stressors, both perceived and experienced, are repeatedly mentioned as a cause of health disparities in the TNB population (e.g., Bauer
1Throughout the manuscript, we use both the terms LGBTQIA+ and TNB. TNB incorporates gender minorities, but LGBTQIA+ incorporates both gender and sexual minorities. These are not mutually exclusive identities and often intersect/overlap. TNB, as gender minorities, are part of the LGBTQIA+ umbrella and particularly relevant to the present research on genderneutral pronoun use. That said, important research incorporates LGBTQIA+ individuals demographically rather than focusing solely on TNB individuals, as does the present research. Minority stress models demonstrate that the stressors of gender and sexual minorities are distinct yet similar in notable ways (Meyer, 1995; 2003; Testa et al., 2015), making examining both important and relevant (refer to our extensive discussion of minority stress models later in the literature review for further context). Other research focuses on TNB individuals and provides valuable insight into social stressors and the resulting health disparities particular to said population. In summary, when the present research references LGBTQIA+, it includes TNB populations while incorporating sexual minorities as well (LGB+ individuals) due to their identity and social stressors being experienced similarly.
2Genderism (also known as cisgenderism) is defined as a binary view of gender as well as the belief that one should adhere to one’s assigned sex at birth rather than fall outside of said binary.
et al., 2015; Bockting et al., 2013; James et al., 2016). The minority stress model (Meyer, 1995; 2003) and the gender minority stress and resilience model (Testa et al., 2015) both showcase the stigma, prejudice, and discrimination that contribute to disproportionate social stressors faced by minority populations and resulting mental health disparities. Meyer (1995; 2003) defined this interaction between social stressors and mental health as minority stress, emphasizing the high rates of external sources of stress that are experienced by stigmatized individuals from minority groups. The minority stress model was developed to explain stressors for sexual minorities (i.e., the LGB community) only. However, Meyer’s (1995; 2003) minority stress model laid out the foundation for the gender minority stress and resilience model created by Testa and colleagues (2015) to specifically incorporate gender minorities (the TNB community) and their similar and unique stigma related stressors. The minority stress model articulates the processes that lead to social stressors (e.g., prejudice, rejection, concealment, internalized homophobia, resilience/mitigation) and describes these as lying on a continuum of both proximal/external stressors and distal/internal stressors. Stressors in the gender minority stress and resilience model incorporate and expand on stressors mentioned in the minority stress model, including two separate categories for internal stressors (i.e., anticipating negative future events, internalized transphobia, and not disclosing and/or expressing one’s gender identity) and external stressors (i.e., victimization, rejection, discrimination, and nonaffirmation), related to one’s gender identity (Testa et al., 2015). Nonaffirmation is highlighted as an additional stressor that gender minorities face. Relevant to the present research, the gender minority stress and resilience model is an important framework that incorporates gender minorities into the discussion of stigmarelated stress and resulting mental health disparities. This model touches on the interconnectedness of stigma, prejudice, and discrimination, laying out specific stressors faced by gender minorities and how they impact the TNB population disproportionately to the cisgender population.
The framework of stigma based stressors and resulting disparities laid out by these models is increasingly relevant as systemic discrimination against the TNB community increases through antitrans legislation (e.g., restrictions on bathroom use; Vollers, 2025; mandated removal of pronouns in federal emails; Wang et al., 2025; portraying TNB identities as a social contagion; Kesslen, 2022; portraying TNB identities as harmful to children; Exec. Order No. 14,187, 2025). An alarming example of a recent uptick in systemic discrimination
against the TNB population would be Executive Order No. 14,168 (2025), which calls for a plethora of restrictions in TNB access to care and equality, including but not limited to: official government documents only legally allowing sex assigned at birth listed, halted funding on gender identity research and genderaffirming care, and removing protections on gender based discrimination. This increase in systemic discrimination against gender minorities can reasonably be said to influence interpersonal discrimination by engraving antitrans prejudice into law, thereby normalizing these harmful antitrans narratives and feeding discrimination interpersonally. It is also likely the case that the inverse is true and antitrans narratives influence antitrans legislation.
According to these frameworks discussing stigmabased stressors, stressors can be categorized and understood at three levels: as individual (e.g., internalized transphobia), interpersonal (e.g., assault, discrimination, nonaffirmation), and structural (e.g., antitrans legislation) challenges. Empirical evidence highlights these challenges. For example, respondents of the USTS (James et al., 2016) reported facing mistreatment, harassment, discrimination, violence (including disproportionate police and intimate partner violence), economic disparities including high rates of poverty, antitrans stigma, health care disparities both in treatment and accessibility, mental health disparities including elevated psychological distress and suicide risk, and homelessness or barriers to purchasing homes compared to the general U.S. population. Among these stressors, anti trans stigma and nonaffirmation are particularly relevant to identity labels such as pronouns and will therefore be highlighted in this discussion of genderneutral pronoun use as affirmation.
Nonaffirmation can be linked to stressors and resulting disparities experienced by TNB individuals via the relationship between the gender minority stress and resilience model and the interpersonalpsychological theory of suicidality (Joiner, 2005), with the latter model focusing on related stressors and the high rates of suicidality in the TNB population. Nonaffirmation refers to the lack of affirmation behaviors, whether incidental (due to lack of familiarity/ignorance or implicit bias) or malicious (intentional discrimination). For example, nonaffirmation can take the form of choosing not to use the pronouns or name that someone goes by or limiting their access to affirming spaces such as restrooms that align with their gender identity. Testa and colleagues (2016) found that both models help explain high rates of suicidal ideation in TNB populations. More specifically, thwarted belongingness and perceived burdensomeness, which are correlates of suicidal ideation in the interpersonalpsychological theory of suicidality model, are connected to nearly every stressor mentioned in the gender minority
stress and resilience model (i.e., victimization, rejection, discrimination, nonaffirmation, internalized transphobia, not disclosing one’s gender identity). Further evidence of the connection of these models can be found in the research of Wesselmann et al. (2021), which suggests that microaggressions3 against TNB individuals are experienced as social exclusion, contributing to thwarted belongingness and perceived burdensomeness. These findings highlight the importance of the present research and future research on pronoun use in promoting social support, inclusion, and affirmation. Social support and inclusion, especially from family members, as well as a reduction in experienced or witnessed transphobia, protection from transphobia and discrimination, having identifying documents that align with their gender identity, and access to genderaffirming care are all cited as mitigating factors in suicide risk throughout the literature (Bauer et al., 2015; James et al., 2016; Tebbe & Budge, 2022; The Trevor Project, 2023).
It follows that acts of affirmation, such as social support and inclusion, mitigate nonaffirmation and consequent stressors. Bockting et al. (2013) found that affirming behaviors in their sample of gender minorities, including social support, acceptance of self, incorporation of minority gender identity, peer support (especially of others who are TNB), and facilitating cultural normalization of gender variance promoted wellbeing and affirmation. Alongside incorporation of minority gender identity as a resilience factor for gender minorities, disclosure of identity, pride in identity, and social support were demonstrated by Meyer (1995; 2003) to be moderators of the impact of social stressors on health for sexual minorities. This is also discussed by Testa et al. (2015) where pride and community connectedness are found to be aspects of resilience in their gender minority stress and resilience model, demonstrating this shared resilience for both gender and sexual minorities. Similarly, being able to use chosen names, being free from discrimination, being able to use facilities that align with gender identity, selfacceptance, being expressive of one’s gender identity, and having peers at work were all aligned with TNB wellbeing in the workplace (Perales et al., 2022). These resilience behaviors, including the expression and pride in one’s minority identity, which are especially relevant to the present research, address the stigma and social exclusion that are attached to the experiences of those who are gender and sexual minorities. Encouraging affirmation through pronoun use fosters an environment of social support, inclusion, and can be an important mitigating behavior in stigmabased disparities (Bockting et al., 2013; Perales et al., 2022). Research has shown that those who are TNB feel
3Microaggressions are actions that come off as demeaning to another, whether it was intended to or not, in a way that is subtle yet impactful.
more comfort and well being with the inclusion of diverse gender pronouns in surveys (Palanica et al., 2022) and in workplaces (Perales et al., 2022). Johnson and colleagues (2021) found that inclusion of genderneutral pronouns in employee biographies acts as an identity safety cue for both sexual and gender minorities and increases these minorities’ trust in the organization. This research suggests that including pronouns in a variety of contexts and settings could contribute to gender identity affirmation and subsequently encourage the wellbeing of gender and sexual minorities alike.
Certain factors likely play a role in encouraging affirming pronoun use, including modeling and familiarity with genderneutral pronouns (Kramer et al., 2022). Interestingly, being familiar with LGBTQIA+ individuals (rather than solely TNB individuals) was a predictor (among others) of genderneutral pronoun use in Kramer and colleagues (2022) research. Kramer and colleagues’ work is foundational to the present research in that they found an increase of genderneutral pronoun use not only when participants were more familiar with LGBTQIA+ and TNB individuals using a general measure of familiarity presented separately for each of these communities, but also when these pronouns were modeled. Alongside familiarity, Kramer and colleagues (2022) found that nonbinary participants were more likely to produce gender neutral pronouns spontaneously (when not modeled/at baseline) and when prompted (modeled). This work supports our hypothesis that LGBTQIA+ participants will use gender neutral pronouns more than those who do not identify as LGBTQIA+.
Similarly, research by Arnold et al (2022) demonstrates that lack of familiarity with genderneutral pronouns and nonbinary individuals may contribute to less frequent use of said pronouns over binary pronouns. This further strengthens the importance of familiarity in genderneutral pronoun use. This incorporation of both sexual and gender minority participants and results that followed could reflect the notion that gender and sexual minorities have similarly salient identities that are often conflated by majority groups and that, though distinct identities and experiences, they often intersect. It follows that LGBTQIA+ individuals may feel more belonging and comfort with the inclusion of gender minorities as hypothesized in the present research.
The literature on factors that encourage pronoun use supports the aim of the present research by suggesting that incorporating genderneutral pronouns into introductions may encourage participants’ use of such pronouns through wellestablished psychological mechanisms such as modeling and familiarity (Kramer et al., 2022). This practice could foster affirmation for those who are
gender minorities and may extend to other members of the LGBTQIA+ community to the extent that pronouns signal broader inclusion. Research on mitigating TNB social stressors and health disparities highlights resilience through peer support, representation, and health care/documentation accessibility (e.g., Bauer et al., 2015; James et al., 2016; Tebbe & Budge, 2022), yet there is a lack of experimental research examining the impact of pronoun use in introductions on important outcomes such as selfesteem and anxiety, as well as comfort with, and use of, pronouns when referring to others. Reviewing the relevant literature (e.g., Meyer, 1995; 2003; Testa et al., 2015) indicates that creating a more inclusive environment through pronoun use in introductions has the potential to foster affirmation, resiliency, and selfacceptance. Testa and colleagues (2016) note that high rates of suicidality and selfharm in TNB people suggest that this is a public health crisis. As such, it is vital that the stigma and stressors that contribute to these disparities in mental and general health are addressed. The present study attempts to do so by examining the impact of including pronouns in introductions on anxiety, selfesteem, and comfort with, as well as use of, genderneutral pronouns in LGBTQIA+ and nonLGBTQIA+ samples. This research can provide further evidence of strategies that create more inclusive environments and offer insights into how pronoun usage may affect selfesteem, anxiety, and wellbeing through comfort.
Overview of the Current Research
Research on health disparities among TNB individuals has primarily focused on resilience through peer support, representation, and genderaffirming care/ documentation accessibility, with little experimental research on pronoun use in introductions and potential impacts on selfesteem, anxiety, comfort, and use of pronouns. In the present study, we assessed the impact of genderneutral pronoun use during an introduction on frequency of pronoun use, selfesteem, and anxiety among participants in a 2 (LGBTQIA+ membership: LGBTQIA+ vs nonLGBTQIA+) x 2 (video condition: nameonly vs pronouns included) betweensubjects quasi experimental research design. We explored interactions between LGBTQIA+ identity and pronoun condition on selfesteem and anxiety [H1], as well as the impact of pronoun condition on comfort with and use of genderneutral pronouns [H2, H3]. Specifically, we examined whether LGBTQIA+ participants would report lower selfesteem and higher anxiety than nonLGBTQIA+ peers and whether this difference was moderated by exposure to gender neutral pronoun use in an introduction. We also tested whether being
assigned to the pronoun condition would increase comfort with and use of gender neutral pronouns, regardless of LGBTQIA+ identity.
Method
Participants
Based on an a priori power analysis (G*Power 3.1; Faul et al., 2007) with an estimated medium effect size ( f = .25) and power (1 – β) set at .95, we needed to collect data from at least 210 participants. We recruited 219 university undergraduate students (M age = 20.72, SD age = 4.69) to participate in the study. All participants passed the manipulation check and were thus retained in the analyses. Specifically, participants were undergraduate students enrolled in at least one psychology course during the quarter of the study. Compensation was provided as course or extra credit, determined by the students’ instructors. Participants included both LGBTQIA+ (27%) and nonLGBTQIA+ (73%) individuals (see Table 1).
Procedure
Approval from Central Washington University’s Institutional Review Board was acquired prior to data collection. Participants were informed that they were taking part in an online study on memory and were randomly assigned to one of two conditions in which they watched a brief video (36–37 seconds, depending on condition) of an ostensible peer (masculine presenting) telling a short story about themselves. In the control condition (n = 111), the individual in the video introduced themselves using only their name before beginning their story. In the experimental condition (n = 108), participants watched the same video, but the introduction included the individual’s name and genderneutral pronouns. The videos were created from the same original recording, with one version retaining the pronouninclusive line and the other having that line removed through editing. This ensured that all other aspects of the video, such as tone, pacing, and visuals, remained identical across conditions. After watching the video, participants wrote a short reflection/ summary statement about the video and were asked a series of content questions about the video to reinforce the cover story for the study on memory and to provide participants a chance to use pronouns for the peer in the video. Researchers performed a manipulation check by asking participants to identify the person in the video’s pronouns from a list (i.e., he/him, she/her, they/them, did not say). Participants then completed counterbalanced measures of selfesteem and anxiety, followed by a question on their comfort with using genderneutral pronouns in conversation. Lastly, participants completed demographic questions.
Measures
Rosenberg Self-Esteem Scale
Selfesteem was measured using the Rosenberg SelfEsteem Scale (RSES; Rosenberg, 1965), a 10 item self report scale that measures global self worth by assessing both positive and negative feelings about oneself. For example, participants rate their agreement with statements such as, “I feel that I have a number of good qualities.” on a scale from 1 (strongly disagree) to 4 (strongly agree). Scores on items were then averaged (reverse scoring when necessary) such that higher scores reflect higher levels of selfesteem. A Guttman scale coefficient of reproducibility for the RSES is .92 and a coefficient representing testretest reliability in the span of two weeks of .85 to .88 suggests that the scale is reliable (Rosenberg, 1979). The RSES has also been established as having good construct, concurrent, and predictive validity (Rosenberg, 1979). The scale exhibited high internal consistency in our sample (α = .90).
State-Trait Anxiety Inventory
The present research used the 20item State Anxiety component of the StateTrait Anxiety Inventory
TABLE 1 Participant Demographics
(STAI; Spielberger, 1989) to measure participants’ anxiety levels in the moment. Coefficients assessing internal consistency of the STAI have been found to range from .86 to .95, and coefficients assessing testretest reliability over a time frame of two months ranged from .65 to .75 (Spielberger et al., 1989). Although the full STAI includes 40 items assessing both state and trait anxiety, it is common for researchers to use only one component based on the specific focus of the study. In our case, state anxiety was most relevant to our research objectives. Participants rated the extent to which a variety of statements (e.g., tense, nervous) describe their present feelings on a scale from 1 (not at all) to 4 (very much so). Scores on items were averaged (reverse scoring when necessary), with higher scores representing relatively higher levels of anxiety. The internal consistency of the scale in our sample was high (α = .93).
Comfort With Gender-Neutral Pronoun Use
Participants were asked to rate their comfort level using genderneutral pronouns. Specifically, they responded to the item, “How comfortable are you with using the personal pronouns ‘they/them’ when referring to specific others?” on a scale from 1 (not at all comfortable) to 5 (very comfortable).
Use of Gender-Neutral Pronouns
After watching the video, participants responded to the following instructions: “In your own words, please take a few minutes to summarize the information you can remember from the video. Do your best to include details about the storyteller and the story itself.” We then measured usage of gender neutral pronouns using the Linguistic Inquiry and Word Count (LIWC; a text analysis tool that quantifies features of language) program to count the frequency of they/them pronouns in participants’ responses (Pennebaker et al., 2015).
LGBTQIA+ Membership and Other Demographic Questions
Participants were asked to complete a short series of demographic questions assessing age, race/ethnicity, gender identity, sexual orientation, and LGBTQIA+ membership. The LGBTQIA+ membership question simply asked participants to indicate whether or not they identified as a member of the LGBTQIA+ community (yes/no). Roughly half of the LGBTQIA+ participants were randomly assigned to the nameonly condition (n = 30) while the other half participated in the pronoun condition (n = 29). Eightyone participants who did not identify as LGBTQIA+ were assigned to the nameonly condition, and 79 were assigned to the pronoun condition.
Results
See Table 2 for descriptive statistics on the dependent variables.
Self-Esteem and Anxiety (H1)
To examine our first hypothesis, we conducted a factorial ANOVA to assess the impact of LGBTQIA+ identity and pronoun condition on selfesteem and anxiety. Contrary to our hypothesis, there were no significant interactions between LGBTQIA+ identity and pronoun condition on selfesteem, F(1, 215) = 0.05, p = .82, or anxiety, F(1, 215) = 1.07, p = .190. However, there was a significant main effect of LGBTQIA+ identity on both selfesteem, F(1, 215) = 12.93, p < .001, and anxiety, F(1, 215) = 8.03, p = .010, with LGBTQIA+ individuals reporting higher self esteem ( M = 2.53, SD = 0.56) and higher anxiety (M = 2.34, SD = 0.59) compared to nonLGBTQIA+ individuals selfesteem (M = 2.23, SD = 0.54) and anxiety (M = 2.09, SD = 0.58).
Comfort Using Gender-Neutral Pronouns (H2)
Next, to examine our second hypothesis, we conducted a factorial ANOVA to examine the effect of LGBTQIA+ membership and pronoun condition on selfreported comfort when using genderneutral pronouns. There was no interaction between LGBTQIA+ identity and pronoun condition on comfort using genderneutral pronouns, F(1,215) = 0.46, p = .450. However, there was a significant main effect of LGBTQIA+ identity on comfort using genderneutral pronouns to refer to others, F(1, 215) = 22.77, p < .001, with LGBTQIA+ individuals reporting higher levels of comfort (M = 4.42, SD = 1.10) compared to nonLGBTQIA+ individuals (M = 3.54, SD = 1.26). Results also indicated a significant main effect of pronoun condition on comfort using genderneutral pronouns to refer to others, F(1, 215) = 4.66, p = .030. Supporting our second hypothesis, participants who watched the introduction that included the individual’s name and genderneutral pronouns reported higher levels of comfort using said pronouns to reference
TABLE 2
Descriptive Statistics for Dependent Variables
another (M = 12.94, SD = 1.15) compared to participants who watched the introduction that only included the individual’s name (M = 12.62, SD = 1.38). See Figure 1 for a visual depiction of the results involving comfort using genderneutral pronouns by pronoun condition and LGBTQIA+ status.
Use of Gender-Neutral Pronouns (H3)
To explore our last hypothesis, we conducted another factorial ANOVA to examine the effect of LGBTQIA+ membership and pronoun condition on the actual use of genderneutral pronouns in their descriptions of the video and storyteller. Results showed an interaction between condition and identity, F(1, 214) = 4.69, p = .03. Simple effects tests showed a significant difference between LGBTQIA+ and nonLGBTQIA+ participants in the genderneutral pronoun condition, t(214) = 4.99, p < .001, but not the nameonly condition, t(214) = 1.99, p = .28. The significant main effect of the pronoun condition on the use of genderneutral pronouns when describing the individual in the video, F (1, 214) = 84.34, p < .001, indicated that participants who were exposed to genderneutral pronouns were more likely to use them in their descriptions ( M = 8.22, SD = 6.53) compared to those in the name only condition (M = 1.89, SD = 3.95). The significant main effect of identity, F(1, 214) = 24.53, p < .001, demonstrated that LGBTQIA+ participants used genderneutral pronouns more frequently (M = 7.77, SD = 6.84) compared to nonLGBTQIA+ participants (M = 3.97, SD = 5.66). As shown in Figure 2, LGBTQIA+ participants were more responsive to the pronoun condition compared to their nonLGBTQIA+ peers.
Discussion
Results of this study replicate prior research in that LGBTQIA+ individuals reported higher anxiety levels than their peers (e.g., Bauer et al., 2018; Tebbe & Budge, 2022; Testa et al., 2016). Higher anxiety in this group is consistent with recent literature demonstrating higher rates of not only anxiety, but also depression and general mental distress (e.g., suicidality) in the LGBTQIA+ community compared to those not in the LGBTQIA+ community (e.g., Bockting et al., 2013; James et al., 2016; The Trevor Project, 2020). Our first hypothesis (H1) predicted that LGBTQIA+ participants assigned to the pronoun condition would exhibit higher selfesteem than those in the no pronoun condition, however, no significant differences were found, and we were unable to support this hypothesis. Although we did not observe an interaction effect involving pronoun condition and LGBTQIA+ status on selfesteem or anxiety, this may be due to issues of statistical power. Specifically,
because only 27% of our sample identified as members of the LGBTQIA+ community, the sample size within certain conditions may have been too small to detect such effects. Researchers did find support for the next two hypotheses. Specifically, participants assigned to the pronoun condition reported more comfort using genderneutral pronouns (H2). Although there were no significant differences based on LGBTQIA+ status on the effect of pronoun condition on comfort using pronouns, LGBTQIA+ participants were more responsive to the
Comfort Using Gender-Neutral Pronouns Pronoun Condition and LGBTQIA+ Status
Use of Gender-Neutral Pronouns by Pronoun Condition and LGBTQIA+ Status
FIGURE 1
Note. Analyses indicate significant main effects, with no interaction.
FIGURE 2
pronoun condition in their use of pronouns compared to their nonLGBTQIA+ counterparts (H3).
This research contributes to the literature by providing initial evidence that viewing introductions involving genderneutral pronouns can increase both comfort and usage of said pronouns in LGBTQIA+ and nonLGBTQIA+ individuals without increasing anxiety levels. This is compelling given previous research on proper pronoun use as an act of inclusion, acceptance, and affirmation that contributes to the wellbeing of members of the TNB community (Johnson et al., 2021; Kramer et al., 2022; Palanica et al., 2022; Perales et al., 2022; Tebbe & Budge, 2022). Adopting language change, in this case increasing comfort with or use of genderneutral pronouns, can be an important mitigating factor in the mental health disparities faced by the TNB community through identity affirmation. Further research should investigate other factors that both encourage and discourage adoption of language change.
Theoretical Implications
Microaggressions may be experienced as exclusion by LGBTQIA+ persons. Inclusion, in this case through proper pronoun use, is one of many helpful resilience factors for TNB individuals (e.g., Bauer et al., 2018; Bockting et al., 2013; The Trevor Project, 2020). As mentioned previously, our research suggests that genderneutral pronoun use in introductions can encourage individuals to use genderneutral pronouns when referring to others. This is encouraging given the connection between genderneutral pronoun use for others and the wellbeing felt by the atrisk TNB community. Pronoun use in introductions could act as a mitigating factor in the stigma and resulting disparities in the TNB community.
Collectively, research on correct and affirming pronoun use has demonstrated how impactful this simple action can be in easing the plethora of stressors TNB individuals face (e.g., Johnson et al., 2021; Kramer et al., 2022; Palanica et al., 2022; Perales et al., 2022; Tebbe & Budge, 2022). Even so, systemic barriers are increasingly prevalent as an obstacle to the health of the LGBTQIA+ community, and especially the TNB population. A telling example most relevant to the present research would be the executive order pushed forth in January of 2025 by the Trump Administration, enforcing the removal of pronouns on email signatures for all federal employees (Wang et al., 2025). This is one of many actions against Diversity, Equity, Inclusion, and Accessibility (DEIA) initiatives in the United States, which means inclusion of those who are TNB among other minorities. This, alongside the increasing amount of antitrans legislation in the nation (e.g., Exec. Order No. 14,168, 2025; Exec. Order No. 14,187, 2025), makes research on affirmation
and mitigation of these disproportionate stressors for the TNB population vital.
Previous research highlights key predictors of resilience within the TNB community, which are crucial for addressing stigma and reducing mental health disparities. These include, but are not limited to, peer support (Bauer et al., 2018), familial support (Bockting et al., 2013; The Trevor Project, 2020), and support from other LGBTQIA+ individuals (Perales et al., 2022). Our results demonstrated that those who identify as part of the LGBTQIA+ community are more likely to use genderneutral pronouns to refer to others, so focusing future research on ways to encourage this in others who may be less likely to use genderneutral pronouns (e.g., those less familiar with these pronouns or less comfortable adopting language change) could be helpful in efforts to increase inclusion through genderneutral pronoun use. Those in the LGBTQIA+ community may be more supportive of TNB individuals; thus, efforts should be made to encourage the fostering of affirmative and welcoming spaces for those in the LGBTQIA+ community as a protective measure, encouraging resiliency alongside encouraging genderneutral pronoun use in those less familiar and comfortable with adopting this language change. Other factors of resiliency are mentioned by Bauer et al. (2015), namely social support, inclusion, and affirmation. Bockting et al. (2013) also highlighted important resilience factors, including social support, acceptance of self, incorporation of minority gender identity, peer support, self acceptance/affirmation, and the facilitation of cultural normalization of gender variance. These affirming and supportive behaviors address the stigma and social exclusion experienced by those who are TNB and should be encouraged and promoted where possible, on individual, interpersonal, and structural levels. Factors of resilience could be expanded on and further investigated, meaningfully contributing to research to care for those who are TNB.
Limitations and Future Directions
Although most of our findings replicate and/or extend previous research in this area, the LGBTQIA+ participants in our study reported higher self esteem compared to their peers. Selfesteem and anxiety can be thought of as interconnected, making these findings a discrepancy in our research and a contradiction with past research. It is a possibility, though unlikely, that our recruitment strategy (undergraduates taking Qualtrics surveys for psychology course credit) contributed to these contradictory results. Our collegiate sample could have hypothetically contributed to this discrepancy in selfesteem due to increased familiarity of TNB issues on campus and subsequent identity affirmation. Psychology
is a social science and thus a discipline predicated on social awareness. The sample being students of psychology could have thus swayed the selfesteem results in that they are affirmed through course teachings and other students in the discipline. The study was outlined as a memory assessment and may therefore not have appealed to those who are gender and sexual minorities as might have been more likely had researchers not made the choice to disguise the objective of the research. Another limitation of our study involves issues of statistical power. Specifically, because only 27% of our sample identified as members of the LGBTQIA+ community, the sample size within certain conditions may have been too small to detect existing effects. Future research should examine factors that impact selfesteem in the TNB population and the LGBTQIA+ community at large by incorporating a more diverse sample of participants, ideally students who are more diverse in terms of area of study/outside of collegiate populations. Other samples could include more gender and sexual minorities in order to acquire higher statistical power.
Another point of reflection is that the person in the introduction video is masculine presenting, which could contribute to the attention to gender boundaries in the conditions due to rigid gender norms attributed to men. Replicating this study with masculine, feminine, or androgynous presenting individuals may bear different results. For example, the work of Kramer et al. (2022) found that androgynous and feminine presenting individuals (over masculine presenting individuals) were more likely to be described using gender neutral pronouns. This finding suggests that participants in the present study could have been more likely to use gender neutral pronouns had the individual in the introduction video been androgynous and/or feminine presenting. Research on this topic should consider gender expression as a variable and examine a range of gender expressions accordingly. It is important to note that our study focused on the shortterm effects of pronoun usage on selfesteem, anxiety, comfort using, and subsequent use of pronouns. Selfesteem tends to be a stable trait and therefore being exposed to pronouns in introductions in this short period of time is unlikely to significantly shift selfesteem. Longitudinal research on pronoun use and its impact on selfesteem, anxiety, and other variables could help better understand this relationship between genderneutral pronoun use and selfesteem. Another future research direction one might consider could incorporate other designs such as a withinsubjects design that includes conditions with no pronouns and/ or binary pronouns in order to assess factors that change an individual’s spontaneous pronoun use. It could also be that other constructs, such as affect,
were impacted by exposure to genderneutral pronouns. For instance, it could be that some participants felt a sense of belonging/social connectedness when in the pronoun condition and this resulted in positive emotions/affect (Steptoe et al., 2009), such as participants in the LGBTQIA+ community, social connectedness and positive affect being. This is promising given prior literature on peer support and belonging, social phenomenon synonymous with social connectedness, mitigating suicidal ideation (Bauer et al., 2015; Bockting et al., 2013; The Trevor Project, 2023). Variables such as affect would be beneficial to future research on genderneutral pronoun use by expressing other factors that may contribute to mental health and selfesteem in sexual and gender minorities. Important to consider is how affect may arguably be a more suitable outcome variable to measure in pronoun use research than selfesteem due to its fluctuation (unlike selfesteem which tends to be stable) and relation to social connectedness.
More research is needed to address the mental health disparities seen between members of the LGBTQIA+ community and their nonLGBTQIA+ peers beyond affirmation through pronoun use and encouraging comfort with genderneutral pronouns. Research on intervening mental health disparities within the TNB community could include further exploration of resilience factors mentioned by Bauer et al. (2015), namely social support, inclusion, and affirmation. Research could also further explore the factors of TNB resilience outlined by Bockting et al. (2013), specifically social support, acceptance of self, incorporation of minority gender identity, peer support, selfacceptance/affirmation, and the facilitation of cultural normalization of gender variance.
Another notable limitation would be that the focus of the present research is comfort using genderneutral pronouns; however, this variable was assessed using a single 7point Likert scale question. Ideally, future research on comfort using genderneutral pronouns would benefit from a more comprehensive and multiitem measure. As of the date of this work, an established measure has not been identified for comfort using genderneutral pronouns. Given the increasing rate of nonaffirmation of TNB individuals through systemic discrimination and consequently the normalization of interpersonal discrimination, the development of a measure focusing on pronoun use, and more research on affirmation through pronoun use in general, seems imperative.
Conclusion
Given research on the importance of using one’s proper pronouns, studies demonstrating methods for increasing comfort in using genderaffirming language may be a key factor in supporting the mental health and wellbeing
of TNB individuals. Affirmation has been shown to lower suicide attempt risk, promote resilience, and be a protective factor to the wellbeing of the TNB community (Bauer et al., 2015; Bockting et al., 2013; The Trevor Project, 2023; Wesselmann et al., 2021). Fostering inclusion in a community that is facing extraordinary systemic exclusion, disproportionate mental health struggles, and overall stigma/discrimination is imperative. The mental health disparities and suicidality in the TNB population is a public health crisis (Tebbe & Budge, 2022) and should be addressed as such by psychologists and scholars in related academic disciplines. Creating an inclusive environment through encouraging and demystifying genderneutral pronoun use is an area that deserves more attention. Promoting an affirmative environment has the potential to foster resiliency, selfacceptance, and mitigate some of the many stressors faced disproportionately by TNB individuals. Research that helps to build such an environment is as timely as it is important.
References
Arnold, J. E., Marquez, A., Li, J., & Franck, G. (2022). Does nonbinary they inherit the binary pronoun production system? Glossa Psycholinguistics, 2(1), 1–14. https://doi.org/10.5070/G601183
Bauer, G. R., Scheim, A. I., Pyne, J., Travers, R., & Hammond, R. (2015). Intervenable factors associated with suicide risk in transgender persons: A respondent driven sampling study in Ontario, Canada. BioMed Central Public Health, 15(525), 1–14. https://doi.org/10.1186/s12889-015-1867-2
Bockting, W. O., Miner, M. H., Swinburne Romine, R. E., Hamilton, A., & Coleman, E. (2013). Stigma, mental health, and resilience in an online sample of the US transgender population. American Journal of Public Health, 103(5), 943–951. https://dx.doi.org/10.2105/AJPH.2013.301241
Buck, D. M. (2016). Defining transgender: What do lay definitions say about prejudice? Psychology of Sexual Orientation and Gender Diversity, 3(4), 465–472. https://dx.doi.org/10.1037/sgd0000191
Exec. Order No. 14,168, 3 C.F.R. 8615 (2025). https://www.federalregister.gov/ documents/2025/01/30/2025-02090/defending-women-from-genderideology-extremism-and-restoring-biological-truth-to-the-federal
Exec. Order No. 14,187, 3 C.F.R. 8771 (2025). https://www.federalregister.gov/documents/2025/02/03/2025-02194/ protecting-children-from-chemical-and-surgical-mutilation
Faul, F., Erdfelder, E., Lang, A. G. and Buchner, A. (2007) G*Power 3: A flexible statistical power analysis program for the social, behavioral, and biomedical sciences. Behavior Research Methods, 39 (175–191). https://doi.org/10.3758/BF03193146
Farmer, L. B., Robbins, C. K., Keith, J. L., & Mabry, C. J. (2020). Transgender and gender-expansive students’ experiences of genderism at women’s colleges and universities. Journal of Diversity in Higher Education, 13(2), 146–157. https://dx.doi.org/10.1037/dhe0000129
James, S. E., Herman, J. L., Rankin, S., Keisling, M., Mottet, L., & Anafi, M. (2016). The Report of the 2015 U.S. Transgender Survey. National Center for Transgender Equality https://transequality.org/sites/default/files/docs/ usts/USTS-Full-Report-Dec17.pdf
Johnson, I. R., Pietri, E. S., Buck, D. M., & Daas, R. (2021). What’s in a pronoun: Exploring gender pronouns as an organizational identity-safety cue among sexual and gender minorities. Journal of Experimental Social Psychology, 97, 104194–104207. https://doi.org/10.1016/j.jesp.2021.104194
Joiner, T. (2005). Why people die by suicide. Harvard University Press. https://doi.org/10.2307/j.ctvjghv2f
Kesslen, B. (2022, August 18). How the idea of a “transgender contagion” went viral—and caused untold harm: A single paper on the notion that gender dysphoria can spread among young people helped galvanize an antitrans movement. MIT Technology Review. https://www.technologyreview. com/2022/08/18/1057135/transgender-contagion-gender-dysphoria/
Kramer, M. A., Boland, J., & Queen, R. (2022). Getting to know them: The influence of familiarity on the production of singular specific they. PsyArXiv. 1–31. https://doi.org/10.31234/osf.io/v5yjz
Meyer, I., H. (1995). Minority stress and mental health in gay men. Journal of Health and Social Behavior, 36 38–56. https://doi.org/10.2307/2137286
Meyer, I. (2003). Prejudice, social stress, and mental health in lesbian, gay, and bisexual populations: Conceptual issues and research evidence. Psychological Bulletin, 129(5), 674–697. https://dx.doi.org/10.1037/0033-2909.129.5.674
Palanica, A., Lopez, L., Gomez, A., & Fossat, Y. (2022). Effects of including gender pronoun questions in surveys. Frontiers in Psychology, 13, 873442–873442. https://doi.org/10.3389/fpsyg.2022.873442
Pennebaker, J. W., Booth, R. J., Boyd, R. L., & Francis, M. E. (2015). Linguistic Inquiry and Word Count: LIWC2015 [Computer software]. Pennebaker Conglomerates. https://www.liwc.app
Perales, F., Ablaza, C., & Elkin, N. (2022). Exposure to inclusive language and well-being at work among transgender employees in Australia, 2020. American Journal of Public Health, 112(3), 482–490. https://doi.org/10.2105/AJPH.2021.306602
Rosenberg, M. (1965). Society and the adolescent self-image. Princeton University Press
Rosenberg, M. (1979). Conceiving the self. Basic Books.
Spielberger, C., Gorsuch, R., Lushene, R., Vagg P., & Jacobs G. (1983). Manual for the State-Trait Anxiety Inventory. Consulting Psychologists Press, Inc.
Steptoe, A., Dockray, S., & Wardle, J. (2009). Positive affect and psychobiological processes relevant to health. Journal of Personality, 77(6), 1747–1776. https://dx.doi.org/10.1111/j.1467-6494.2009.00599.x
Tebbe, E. A., & Budge, S. L. (2022). Factors that drive mental health disparities and promote well-being in transgender and nonbinary people. Nature Reviews Psychology (1), 694–707. https://doi.org/10.1038/s44159-022-00109-0
Tebbe, E. N., & Moradi, B. (2012). Anti-transgender prejudice: A structural equation model of associated constructs. Journal of Counseling Psychology, 59(2), 251–261. https://www.dx.doi.org/10.1037/a0026990
Testa, R. J., Bliss, W., Balsam, K. F., Michaels, M. S., Rogers, M, L., & Joiner, T. (2016). Suicidal ideation in transgender people: Gender minority stress and interpersonal theory factors. Journal of Abnormal Psychology, 126(1), 125–136. https://doi.org/10.1037/abn0000234
Testa, R. J., Habarth, J., Peta, J., & Balsam, K. (2015). Development of the gender minority stress and resilience measure. Psychology of Sexual Orientation and Gender Identity, 2(1), 65–77. https://dx.doi.org/10.1037/sgd0000081
The Trevor Project. (2023). 2023 U.S. National Survey on the Mental Health of LGBTQ Young People. https://www.thetrevorproject.org/survey-2023/
Vollers, A. C. (2025, June 26). More states pass laws restricting transgender people’s bathroom use: About 1 in 4 transgender people live in states with some form of bathroom restrictions. Stateline https://stateline.org/2025/06/26/more-states-pass-laws-restrictingtransgender-peoples-bathroom-use/
Wang, S., Abdelmalek, M., Flaherty, A., & Steakin, W. (2025, January 31). Federal employees told to remove pronouns from email signatures by end of day: The mandate is the latest effort in the Trump administration’s push to end DEI. ABC News. https://abcnews.go.com/US/federal-employees-toldremove-pronouns-email-signatures-end/story?id=118310483 Wesselmann, E. D., DeSouza, E. R., AuBuchon, S., Bebel, C., & Parris, L. (2021). Investigating microaggressions against transgender individuals as a form of social exclusion. Psychology of Sexual Orientation and Gender Diversity, 9(4), 454–465. https://doi.org/10.1037/sgd0000513
Jasmine H. Borland played a lead role in substantive original writing and editorial assistance and a supporting role in data analysis and interpretation. Tonya M. Buchanan played a lead role in conceptualization, research design, data collection, and data analysis. Correspondence regarding this article should be addressed to Tonya M. Buchanan, Central Washington University, 400 E University Way, Ellensburg, WA 98926, United States. Email: tonya.buchanan@cwu.edu
Grit, Resilience, and
Thinking About Dropping Out of College
Abigail Lockridge1, Frank Hammonds*2, Gina Mariano*1, Fred Figliano*2, and Kirk Davis*3
1Department of Psychology, Troy University
2College of Education and Behavioral Sciences, Troy University
3Troy University
ABSTRACT. Colleges and universities nationwide are experiencing enrollment declines, and this trend is expected to continue over the next several years at least. Already, some institutions have been forced to eliminate programs, reorganize, or even close. Given the current climate, it is essential that institutions of higher education increase and improve their efforts to recruit and retain students. A logical first step is to identify the reasons that students drop out so that effective retention strategies can be developed. We collected data from 184 students from a mediumsized university in the southeastern United States through an online survey that included measures of grit and resilience as well as questions related to academic standing, whether participants had thought about dropping out of college, and potential reasons for dropping out. Our findings indicated that higher grit (B = –.83, SE = .33, p = .011), resilience (B = –.47, SE = .22, p = .034), and GPA (B = –.75, SE = .31, p = .015) predicted decreased likelihood of thinking about dropping out of college. Participants reported money and mental health as the variables most likely to lead to dropping out and reported mental health and family troubles as the variables that had most commonly led to academic probation and suspension. Although our data are correlational and descriptive, the findings suggest that grit and resilience may be contributing factors to dropping out of college and should be considered during recruitment and retention efforts.
Keywords: grit, resilience, college students, retention
Institutions of higher education face significant challenges related to recruitment, retention, and graduation rates. One factor that is predicted to affect college enrollment over the next several years is the decreased birth rate between 2008 and 2011, which is expected to result in an “enrollment cliff” (Campion, 2020; Copley & Douthett, 2020; Schuette, 2023). Grawe (2018) estimated that 2029 will see an 11% decrease in students compared to 2012. Another estimate has the collegeage population declining by 15% from 2025 to 2029 and an additional 1 to 2% after 2029 (Copley & Douthett, 2020). Long term implications of the upcoming enrollment cliff include a smaller work force beginning in 2030 and decreases in institutional income (Campion, 2020).
Other factors likely contributing to the decline in college enrollment include cost, stress, and uncertainty about choosing a major or career. Cost seems to be
especially important, with three of the five most commonly cited reasons for not going to college or not finishing being related to money (Edge Research, 2022). However, other researchers (see LorenzoQuiles et al., 2023, for a review) found that most causes of dropout were related to stress and other psychological factors as well as socioeconomic status, social support, and institutional support. One study found that most of the students at one college who dropped out would likely have done so even if direct costs of attending college were zero and loans were readily available to cover other costs (Stinebrickner & Stinebrickner, 2008).
Recent studies have placed overall retention rates among fouryear institutions at 78–82%. These rates varied across several variables such as acceptance rates, whether the institution was public or private and profit or nonprofit, and student variables such as full or parttime status, major, age, and ethnicity (National
Center for Education Statistics, 2022; National Student Clearinghouse Research Center, 2024). Generally, both retention and graduation rates were higher at 4year institutions than at 2year institutions. Regional institutions, and those serving rural student populations, may face greater difficulties in attracting and retaining students (Campion, 2020; Grawe, 2018; National Center for Education Statistics, 2023)
Given the current and likely future challenges, colleges and universities must work to recruit and retain more students. Some are taking steps to make college more attractive and affordable (Copley & Douthett, 2020). Authors have suggested additional strategies such as improving rural recruitment and better supporting students once they enroll (Cain & Class, 2023; Toutkoushian, 2025). Strategies for increasing enrollments will likely benefit from taking into account relevant personal characteristics of current and potential students. Two especially important examples appear to be grit and resilience. Based on the literature, both seem to be crucial to persistence and success in education. Below, we will briefly discuss findings supporting the case for considering grit and resilience when addressing student recruitment and retention.
Grit
Grit has been described as “perseverance and passion for longterm goals” and “working strenuously toward challenges, maintaining effort and interest over years despite failure, adversity, and plateaus in progress” (Duckworth et al., 2007, p. 1087). Students with high levels of grit may be less likely to procrastinate and have more motivation, diligence, selfcontrol and resilience (Kannangara et al., 2018; Wolters & Hussain, 2015). Grit has been found to be positively correlated to college student retention and level of education, even surpassing ACT scores and high school GPA as a predictor of retention (Duckworth et al., 2007; SaundersScott et al., 2018). Much of the research relating grit and education has focused on grades. Grit and its components, perseverance of effort and consistency of interest, have been associated with higher GPA and greater academic achievement (Bowman et al., 2015; Lam & Zhou, 2019, 2022; Muenks et al., 2017; Reysen et al., 2019).
Resilience
Yoon et al. (2023) noted that there is no consensus on the definition of resilience. However, resilience has been referred to as a process that encompasses positive adaptation under significant adversity (Luthar et al., 2000). Radhamani and Kalaivani (2021) defined academic resilience as “a student’s capability to deal efficiently with academic setbacks, anxiety, and study
pressure” (p. 360) and stated that academic resilience can improve students’ achievement, because even in adversity, these students continue their education and focus on higher grades.
Studies (e.g., Bittmann, 2021; Pidgeon et al., 2014; Sharma & YukhymenkoLescroart, 2022) have found that resilience is associated with persistence, feeling more connected on campus, and better academic outcomes, though this is not always the case (e.g., GarcíaMartínez et al., 2022). Still, increasing resilience could be an important factor in retention. Some studies (e.g., Carsone et al., 2024; Tormon et al., 2023) have stressed the importance and usefulness of resilience training. Colleges and universities may want to seek out potential students with high resilience, identify students who may be at risk due to low resilience, and work to foster resilience in all students.
Current Study
The current study investigated grit and resilience, along with other variables, in relation to the likelihood of contemplating dropping out of college or thinking that one would actually drop out. Given that both grit and resilience are associated with greater perseverance, we hypothesized that college students with high grit and resilience scores would be less likely to have thought about dropping out of college and would be less likely to anticipate that they might actually drop out. We also hypothesized that grit, resilience, and GPA would be positively correlated. We were also interested in other factors related to academic standing such as whether participants had ever been on academic probation or suspension, whether they had changed majors or transferred from another institution, and the factors they thought would be most likely to lead to dropping out. Although these questions were not part of our primary focus, the resulting descriptive data provide a more comprehensive view of our participants and may inform interpretations of the results.
Method
Participants
The participants in this study were students at a mediumsized university in the southeastern U.S. The initial sample size was 211. Data from 25 participants who did not report their gender or GPA or did not complete the grit or resilience tests were excluded through listwise deletion. Data from two participants reporting a gender other than male or female were not included in the analysis due to the small sample size and the fact that gender was a variable of interest. We analyzed data from the remaining 184 participants. Participants’ ages ranged between 18 and 66, with most (55%) reporting an age
Grit, Resilience, and Dropping Out | Lockridge, Hammonds, Mariano, Figliano, and Davis
between 18 and 30. The sample was diverse in terms of classification with 24 firstyear students, 25 secondyear students, 30 thirdyear students, 45 fourthyear students, and 59 graduate students. Additional information regarding sample demographics can be seen in Table 1.
Materials and Procedure
We obtained approval for the protocol and procedures from the Troy University IRB prior to recruiting participants, which we did through an email announcement. The email included a link to an online survey, which began with the informed consent document and boxes that could be checked to confirm consent or to decline to participate. The survey included 35 items, including the 12item Short Grit Scale (Duckworth et al., 2007), the 6item Brief Resilience Scale (Smith et al., 2008), 11 questions regarding participants’ academic history and likelihood of dropping out of college, and six demographic questions. Internal consistency for the grit and resilience scales was assessed using Cronbach’s alpha. Good reliability (Nunnally & Bernstein, 1994) was demonstrated for both the Short Grit Scale (α = .81) and the Brief Resilience Scale (α = .87). Data from 184 college students were analyzed using IBM SPSS Statistics (Version 29). Grit and resilience scores were calculated by adding the scores from individual items on a 5point scale and dividing by the number of items.
The Short Grit Scale consists of 12 items. It is a widelyused and accepted measure of grit. Sample items include “Setbacks don’t discourage me” and “I finish whatever I begin.” Responses are on a 5 point scale from “Not at all like me” to “Very much like me.” The Brief Resilience Scale has also been used extensively and is an accepted measure of resilience. It consists of six items, including “I tend to bounce back quickly after hard times” and “I usually come through difficult times with little trouble.” Responses are on a 5point scale from 1(strongly disagree) to 5 (strongly agree). Both of these scales have been shown to be valid, with good internal consistency and testretest reliability (Duckworth et al., 2007; Smith et al., 2008).
We asked participants whether they had thought of dropping out of college and whether they thought they would actually do so. Additional questions included whether the participant was currently enrolled in classes, whether they had changed their major, and whether they had been or currently were on academic probation or suspension. Responses to these questions are presented in Table 2. We also asked, “If you were to drop out, which of the following reasons would you suppose caused it?”, “If you have ever been placed on academic probation, which of the following reasons do you think caused it?”, and “If you have ever been placed on academic
suspension, which of the following reasons do you think caused it?”. These questions were presented along with several response options. Participants were instructed to “Check all that apply,” The number of participants who selected each choice are presented in Figures 1, 2, and 3. Finally, we asked typical demographic questions including age, gender, and ethnicity.
TABLE 1 Sample Demographics as a Function of Gender and Ethnicity
TABLE 2 Academic Standing
TABLE 3
Variables Predictive of Thinking of Dropping
Note. Variables were entered for each step using a forward-conditional method. Grit was entered on step 1, GPA on step 2, and resilience on step 3. β = standardized coefficient; SE = standard error; Wald = Wald chi-square; OR = odds ratio.
Grit, Resilience, and Dropping Out | Lockridge, Hammonds, Mariano, Figliano, and Davis
Results
Grit scores ranged from 2 to 5 (M = 3.58, SD = 0.57). Resilience scores ranged from 1.17 to 5 ( M = 3.39, SD = 0.80). GPA ranged from 1 to 4 ( M = 3.42, SD = 0.59). Based on previous research and because our hypotheses were directional, onetailed Pearson’s correlation coefficients were computed to determine if relationships existed among grit, resilience, and GPA. Grit was positively correlated with resilience, r(182) = .39, p < .001, and with GPA, r(182) = .18, p = .006. Resilience and GPA were not significantly correlated, r(182) = .12, p = .054.
A binary logistic regression was conducted to examine whether grit, resilience, GPA, and gender predicted students’ likelihood of contemplating dropping out of college. Using a forwardconditional method for entering variables, three of the four variables were selected. Grit was the first variable selected, with 59.8% of the cases correctly classified. The second variable selected was GPA, which increased the number of cases being correctly classified to 63.0%. The third and final variable selected for entry into the model was resilience, which increased the number of cases being correctly classified to 67.9%. As indicated by the negative regression coefficients presented in Table 3, higher levels of grit, resilience, and GPA were each associated with decreased odds of thinking of dropping out of college. Gender did not significantly contribute to the model (β = 0.15, SE = 0.38, p = .692) and was not selected. The overall model was statistically significant χ²(4, N = 184) = 27.71, p < .001, explained 18.7% of the variance (Nagelkerke R² = .19), and correctly classified 67.9% of cases, whereas the null model correctly classified only 51.2% of cases. A second logistic regression was conducted to determine if grit, resilience, gender, and GPA could be used to predict the likelihood that a participant believed they actually would drop out of college. The model, which excluded grit and resilience using the forwardconditional method for entering variables, was statistically significant, χ2(2, N = 184) = 8.53, p = .015. However, the model did not improve on the null model, with both correctly classifying 88.6% of the cases. As such, we did not consider the model useful.
Discussion
The current study investigated potential relationships between grit, resilience, GPA, and thinking of dropping out of college. Higher grit, resilience, and GPA were associated with a lower likelihood of thinking about dropping out. This makes sense intuitively in that individuals with higher grit and resilience would be expected to persevere and overcome challenges. Similarly, students with higher GPAs might be expected to be less
FIGURE 1
FIGURE 2
Reasons for Academic Probation
FIGURE 3 Reasons for Academic Suspension
likely to consider dropping out of college.
Colleges and universities are searching for ways to recruit and retain students. Recognizing factors predictive of dropout is crucial to retention efforts. Grit and resilience may be especially useful tools for identifying students who might drop out of college because the tests for grit and resilience are brief, easy to administer, readily available, and free to use. It would be a simple matter to incorporate these tests in course evaluation surveys in firstyear courses. Students scoring low on grit and resilience could be provided with extra support immediately.
Over half of our participants said they had thought about dropping out of college, but only two said they thought they would drop out. Another 19 participants said that they might. The reasons most frequently cited by our participants as being most likely to cause them to drop out of college were money, mental health, family troubles, and work. Mental health and family troubles were the responses most commonly given for academic probation and academic suspension. These results are consistent with those of previous studies that identified cost (Edge Research, 2022) and psychological factors (LorenzoQuiles et al., 2023) as being among the top reasons students drop out of college.
The reasons given by participants for potentially dropping out should be considered during the development of retention strategies. Colleges and universities could focus on supporting students in these areas and/ or use any available data on these variables to identify atrisk students. Efforts to reduce the cost of education and increase mental health services would address the issues most frequently indicated by our participants.
One limitation of the current study is that the sample did not include students who had dropped out of college. Instead, we asked participants if they thought about dropping out and if they thought they would drop out. Other studies (e.g., Gonzalez et al., 2025; see Véliz Palomino & Ortega, 2023, for a review) have also examined factors contributing to dropout intentions. The value of the data resulting from such investigations depends on how closely the intentions predict actual dropout rates. Numerous studies (e.g., Findeisen et al., 2024; LópezAngulo et al., 2024) have provided evidence for a link between thinking about dropping out and actually doing so. Clearly, anyone looking to retain students would be very interested in knowing which students were considering dropping out. The model did not predict the likelihood of thinking one would actually drop out. This was not surprising given the low number of participants who thought they would drop out.
Another limitation was that participants selfselected by responding to an email announcement and those who
chose to participate in the study might not have been representative of the overall U.S. student population, especially given the relatively low response rate and the fact that all participants were students at a single university. Also, it is important to remember that our data are correlational and descriptive. As a result, we cannot say that grit and resilience are causally connected to likelihood of dropping out of college or thinking of doing so.
An additional factor to consider when interpreting the results involves the inclusion of graduate students in our sample. Most studies on grit and resilience have focused on undergraduates. We included graduate students with the assumption that the connections to academic performance and persistence would be similar to those found among undergraduates. There is some evidence to support this assumption. For example, Cross (2013) found that grit was positively correlated to both GPA and time per week spent on schoolwork among doctoral students. For this reason, and because of the relatively small sample size, we included both groups of students and did not distinguish between them in our analysis. Additional research is needed to further demonstrate the possible connections between the variables in this study among graduate students.
As we hypothesized, this study succeeded in demonstrating relationships between grit, resilience, GPA, and likelihood of considering dropping out of college. Further, we were able to identify the factors cited by participants as being most likely to lead to dropping out of college. These results will be important to colleges and universities as they consider retention strategies. Finally, we encourage anyone concerned with recruitment and retention in higher education to consider the importance of establishing supportive relationships with students. Wangrow et al. (2022) and Toutkoushian (2025) are among the authors who have noted the importance of this type of support. Studies have found that strong relationships and perceived support are associated with greater academic motivation (Moreno Murcia & Corbi, 2021) and persistence towards degree completion (Xu, 2018). Additionally, friendships with other students may foster a sense of belonging (Davis et al., 2019) and a decreased chance of dropping out (Morelli et al., 2023). We include this information to emphasize that colleges and universities that work to support students with lower levels of grit and resilience may see additional benefits simply from the relationships that could be formed with their students. Future studies could investigate the development of relationships during these supportive activities and the potential interactions with increased grit and resilience.
References
Bittmann, F. (2021). When problems just bounce back: About the relation between resilience and academic success in German tertiary education. SN Social Sciences, 1(2), Article 65. https://doi.org/10.1007/s43545-021-00060-6
Bowman, N. A., Hill, P. L., Denson, N., & Bronkema, R. (2015). Keep on truckin’ or stay the course? Exploring grit dimensions as differential predictors of educational achievement, satisfaction, and intentions. Social Psychological and Personality Science, 6(6), 639–645. https://doi.org/10.1177/1948550615574300
Cain, E. J., & Class, S. (2023). Exploring the college enrollment of students from rural areas: Considerations for scholarly practitioners. Georgia Journal of College Student Affairs, 39(1), 1–24. https://doi.org/10.20429/gcpa.2023.390101
Campion, L. L. (2020). Leading through the enrollment cliff of 2026 (Part I). TechTrends: Linking Research & Practice to Improve Learning, 64(3), 542–544. https://doi.org/10.1007/s11528-020-00492-6
Carsone, B., Bell, J., & Smith, B. (2024). Fostering academic resilience in higher education. Journal of Perspectives in Applied Academic Practice, 12(1), 1–9. https://doi.org/10.56433/jpaap.v12i1.598
Copley, P., & Douthett, E. (2020). The enrollment cliff, mega-universities, COVID-19, and the changing landscape of U.S. Colleges. CPA Journal, 90(9), 22–27. Cross, T. M. (2013). Staying the course: Grit, academic success, and non-traditional doctoral students (Unpublished doctoral dissertation). Pepperdine University. Retrieved from https://digitalcommons.pepperdine.edu/etd/369/ Davis, G. M., Hanzsek-Brill, M. B., Petzold, M. C., & Robinson, D. H. (2019). Students’ sense of belonging: The development of a predictive retention model. Journal of the Scholarship of Teaching and Learning, 19(1), 117–127. https://doi.org/10.14434/josotl.v19i1.26787
Duckworth, A. L., Peterson, C., Matthews, M. D., & Kelly D. R. (2007). Grit: Perseverance and passion for long-term goals. Journal of Personality and Social Psychology, 92(6), 1087–1101. https://doi.org/10.1037/0022-3514.92.6.1087
Edge Research. (2022). Exploring the exodus from higher education. Findings from focus groups and a survey of high school graduates who have not completed college. https://d1y8sb8igg2f8e.cloudfront.net/HCM-EDGE-Research.pdf
Findeisen, S., Brodsky, A., Michaelis, C., Schimmelpenningh, B., & Seifried, J. (2024). Dropout intention: A valid predictor of actual dropout? Empirical Research in Vocational Education & Training, 16, Article 10. https://doi.org/10.1186/s40461-024-00165-1
García-Martínez, I., Augusto-Landa, J. M., Quijano-López, M. I., & León, S. P. (2022). Self-concept as a mediator of the relation between university students’ resilience and academic achievement. Frontiers in Psychology, 12, Article 747168. https://doi.org/10.3389/fpsyg.2021.747168
Gonzalez, B., Mendes, T. P., Pinto, R., Correia, S. V., Albuquerque, S., & Paulino, P. (2025). Predictors of higher education dropout intention in the postpandemic era: The mediating role of academic exhaustion. PLOS ONE, 20(7), e0327643. https://doi.org/10.1371/journal.pone.0327643
Grawe, N. D. (2018). Demographics and the demand for higher education. Johns Hopkins University Press.
Kannangara, C. S., Allen, R. E., Waugh, G., Nahar, N., Khan, S. Z. N., Rogerson, S., & Carson, J. (2018). All that glitters is not grit: Three studies of grit in university students. Frontiers in Psychology, 9, 1–15. https://doi.org/10.3389/fpsyg.2018.01539
Lam, K. K. L., & Zhou, M. (2019). Examining the relationship between grit and academic achievement within K-12 and higher education: A systemic review. Psychology in the Schools, 56(10), 1654–1686. https://doi.org/10.1002/pits.22302
Lam, K. K. L., & Zhou, M. (2022). Grit and academic achievement: A comparative cross-cultural meta-analysis. Journal of Educational Psychology, 114(3), 597–621. https://doi.org/10.1037/edu0000699
López-Angulo, Y., Cobo-Rendón, R., Sáez-Delgado, F., Mella-Norambuena, J., PérezVillalobos, M. V., & Díaz-Mujica, A. (2024). Cognitive motivational variables and dropout intention as precursors of university dropout. Frontiers in Education, 9, Article 1416183. https://doi.org/10.3389/feduc.2024.1416183
Lorenzo-Quiles, O., Galdón-López, S., & Lendínez-Turón, A. (2023). Factors contributing to university dropout: A review. Frontiers in Education, 8, 1–13 https://doi.org/10.3389/feduc.2023.1159864
Luthar, S. S., Cicchetti, D., & Becker, B. (2000). The construct of resilience: A critical evaluation and guidelines for future work. Child Development, 71(3), 543–562. https://doi.org/10.1111/1467-8624.00164
Morelli, M., Chirumbolo, A., Baiocco, R., & Cattelino, E. (2023). Self-regulated learning self-efficacy, motivation, and intention to drop-out: The moderating role of friendships at University. Current Psychology, 42(18), 15589–15599. https://doi.org/10.1007/s12144-022-02834-4
Moreno-Murcia, J. A. M., & Corbi, M. (2021). Social support by teacher and motivational profile of higher education students. Psychology, Society & Education, 13(1), 9–25. https://doi.org/10.25115/psye.v10i1.2658
Muenks, K., Wigfield, A., Yang, J. S., & O’Neal, C. R. (2017). How true is grit? Assessing its relations to high school and college students’ personality characteristics, self-regulation, engagement, and achievement. Journal of Educational Psychology, 109(5), 599–620. https://doi.org/10.1037/edu0000153
National Center for Education Statistics. (2022). Undergraduate retention and graduation rates. U.S. Department of Education, Institute of Education Sciences. https://nces.ed.gov/programs/coe/indicator/ctr National Center for Education Statistics. (2023). Educational attainment in rural areas. U.S. Department of Education, Institute of Education Sciences. https://nces.ed.gov/programs/coe/indicator/lbc
National Student Clearinghouse Research Center. (2024). Persistence and retention. https://nscresearchcenter.org/persistence-retention/ Nunnally, J. C., & Bernstein, I. H. (1994). Psychometric theory (3rd ed.). McGraw-Hill. Pidgeon, A. M., Rowe, N., Stapleton, P. B., Magyar, H. B., & Lo, B. C. Y. (2014). Examining characteristics of resilience among university students: An international study. Open Journal of Social Sciences, 2(11), 14–22. https://doi.org/10.4236/jss.2014.211003
Radhamani, K., & Kalaivani, D. (2021). Academic resilience among students: A review of literature. International Journal of Research and Review, 8(6), 360–369. https://doi.org/10.52403/ijrr.20210646
Reysen, R., Reysen, M., Perry, P., & Knight, R. D. (2019). Not so soft skills: The importance of grit to college student success. Journal of College Orientation, Transition, and Retention, 26(2), 1–13. https://doi.org/10.24926/jcotr.v26i2.2397
Saunders-Scott, D., Braley, M. B., & Stennes-Spidajl, N. (2018). Traditional and psychological factors associated with academic success: Investigating best predictors of college retention. Motivation and Emotion, 42(4), 459–465. https://doi.org/10.1007/s11031-017-9660-4
Schuette, A. (2023). Navigating the enrollment cliff in higher education. Trellis Company. https://files.eric.ed.gov/fulltext/ED628984.pdf
Sharma, G., & Yukhymenko-Lescroart, M. A. (2022). Life purpose as a predictor of resilience and persistence in college students during the COVID-19 pandemic. Journal of College Student Retention: Research, Theory & Practice, 26(2), 334–354. https://doi.org/10.1177/15210251221076828
Smith, B. W., Dalen, J., Wiggins, K., Tooley, E., Christopher, P., & Bernard, J. (2008). The brief resilience scale: Assessing the ability to bounce back. International Journal of Behavioral Medicine, 15(3), 194–200. https://doi.org/10.1080/10705500802222972
Stinebrickner, R., & Stinebrickner, T. (2008). The effect of credit constraints on the college drop-out decision: A direct approach using a new panel study. American Economic Review, 98(5), 2163–2184. https://doi.org/10.1257/aer.98.5.2163
Tormon, R., Lindsay, B. L., Paul, R. M., Boyce, M. A., & Johnston, K. W. (2023). Predicting academic performance in first-year engineering students: The role of stress, resiliency, student engagement, and growth mindset. Learning and Individual Differences, 108, Article 102383. https://doi.org/10.1016/j.lindif.2023.102383
Toutkoushian, R. K. (2025). Student compositional diversity and college retention and graduation rates. Journal of Diversity in Higher Education, 18(1), 97–109. https://doi.org/10.1037/dhe0000491
Véliz Palomino, J. C., & Ortega, A. M. (2023). Dropout intentions in higher education: Systematic literature review. Journal on Efficiency and Responsibility in Education and Science, 16(2), 149–158. https://files.eric.ed.gov/fulltext/EJ1394964.pdf
Wangrow, D. B., Rogers, K., Saenz, D., & Hom, P. (2022). Retaining college students experiencing shocks: The power of embeddedness and normative pressures. The Journal of Higher Education, 93(1), 80–109. https://doi.org/10.1080/00221546.2021.1930839
Wolters, C. A., & Hussain, M. (2015). Investigating grit and its relations with college students’ self-regulated learning and academic achievement. Metacognition and Learning, 10(3), 293–311. https://doi.org/10.1007/s11409-014-9128-9
Xu, Y. J. (2018). The experience and persistence of college students in STEM majors. Journal of College Student Retention: Research, Theory & Practice, 19(4), 413–432. https://doi.org/10.1177/1521025116638344
Yoon, S., Sattler, K., Knox, J., & Xin, Y. (2023). Longitudinal examination of resilience among child welfare-involved adolescents: The roles of caregiver-child relationships and deviant peer affiliation. Development and Psychopathology, 35(3), 1069–1078. https://doi.org/10.1017/S0954579421000924
Resilience, and Dropping Out | Lockridge, Hammonds, Mariano, Figliano, and Davis
Author Note.
Frank Hammonds https://orcid.org/0009000496426678
Abigail Lockridge played a lead role in conceptualization, research design, data collection, and substantive original writing and a supporting role in data analysis and interpretation. Frank Hammonds played a lead role in conceptualization, research design, data collection, and substantive original writing and a supporting role in data analysis and interpretation. Gina Mariano
played a supporting role in literature review, writing, and editing. Fred Figliano played a supporting role in literature review, writing, and editing. Kirk Davis played a lead role in data analysis and interpretation and a supporting role in research design and substantive original writing.
Correspondence concerning this article should be addressed to Frank Hammonds, 339 Hawkins Hall, College of Education and Behavioral Sciences, Troy University, Troy, AL 36082. Email: hammonds@troy.edu
CORRECTION
Correction to Fedak and Langlais (2024)
Regarding the article, “TikTok Too Long? Examining Time on TikTok, Psychological Distress, and the Moderation of TikTok Motivations Among College Students” by Veronica von Fedak and Michael Langlais ( Psi Chi Journal of Psychological Research , 2024, Vol. 29, No. 2, pp. 129–139.
https://doi.org/10.24839/2325-7342.JN29.2.129), the authors have corrected an error identified in the abstract regarding directionality of results along with a few other minor table statistic detail omissions. The corrected version of the article is now available on the Psi Chi Journal website and should be used in all citations and references moving forward.
https://doi.org/10.24839/2325-7342.JN2026.043
Publish Your Research in Psi Chi Journal
Undergraduate, graduate, and faculty submissions are welcome year round. Only one author (either first author or coauthor) is required to be a Psi Chi member. All submissions are free. Reasons to submit include
• a unique, doctorallevel, peerreview process
• indexing in PsycInfo, EBSCO, Web of Science's Emerging Sources Citation Index, and Crossref databases
• free access of all articles at psichi.org
• our efficient online submissions portal
View Submission Guidelines and submit your research at https://www.psichi.org/page/JN_Submissions
Become a Journal Reviewer
Doctorallevel faculty in psychology and related fields who are passionate about educating others on conducting and reporting quality empirical research are invited become reviewers for Psi Chi Journal. Our editorial team is uniquely dedicated to mentorship and promoting professional development of our authors—Please join us!
To become a reviewer, visit https://www.psichi.org/page/JN_BecomeAReviewer
Resources for Student Research
Looking for solid examples of student manuscripts and educational editorials about conducting psychological research? Download as many free articles to share in your classrooms as you would like.
Search past issues, or articles by subject area or author at https://www.psichi.org/journal_past
Learn About Psi Chi
Psi Chi is the International Honor Society in Psychology. Membership is primarily open to undergraduates, graduate students, transfer students, fulltime and parttime faculty members, and alumni.
See membership benefits and a link to apply at https://www.psichi.org/page/member_benefits
Register an account: https://pcj.msubmit.net/cgi-bin/main.plex