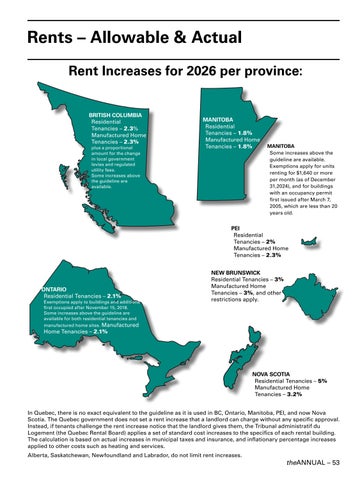
Rent Increases for 2026 per province:
BRITISH COLUMBIA
Residential Tenancies – 2.3% Manufactured Home Tenancies – 2.3% plus a proportional amount for the change in local government levies and regulated utility fees. Some increases above the guideline are available.
ONTARIO
Residential Tenancies – 2.1%
Exemptions apply to buildings and additions first occupied after November 15, 2018. Some increases above the guideline are available for both residential tenancies and manufactured home sites. Manufactured Home Tenancies – 2.1%
MANITOBA
– 1.8%
– 1.8%
MANITOBA
Some increases above the guideline are available. Exemptions apply for units renting for $1,640 or more per month (as of December 31,2024), and for buildings with an occupancy permit first issued after March 7, 2005, which are less than 20 years old.
PEI
Residential Tenancies – 2%
Manufactured Home Tenancies – 2.3%
NEW BRUNSWICK
Residential Tenancies – 3%
Manufactured Home Tenancies – 3%, and other restrictions apply.
NOVA SCOTIA
Residential Tenancies – 5% Manufactured Home Tenancies – 3.2%
In Quebec, there is no exact equivalent to the guideline as it is used in BC, Ontario, Manitoba, PEI, and now Nova Scotia. The Quebec government does not set a rent increase that a landlord can charge without any specific approval. Instead, if tenants challenge the rent increase notice that the landlord gives them, the Tribunal administratif du Logement (the Quebec Rental Board) applies a set of standard cost increases to the specifics of each rental building. The calculation is based on actual increases in municipal taxes and insurance, and inflationary percentage increases applied to other costs such as heating and services. Alberta, Saskatchewan, Newfoundland and Labrador, do not limit rent increases.
Rents – Allowable & Actual
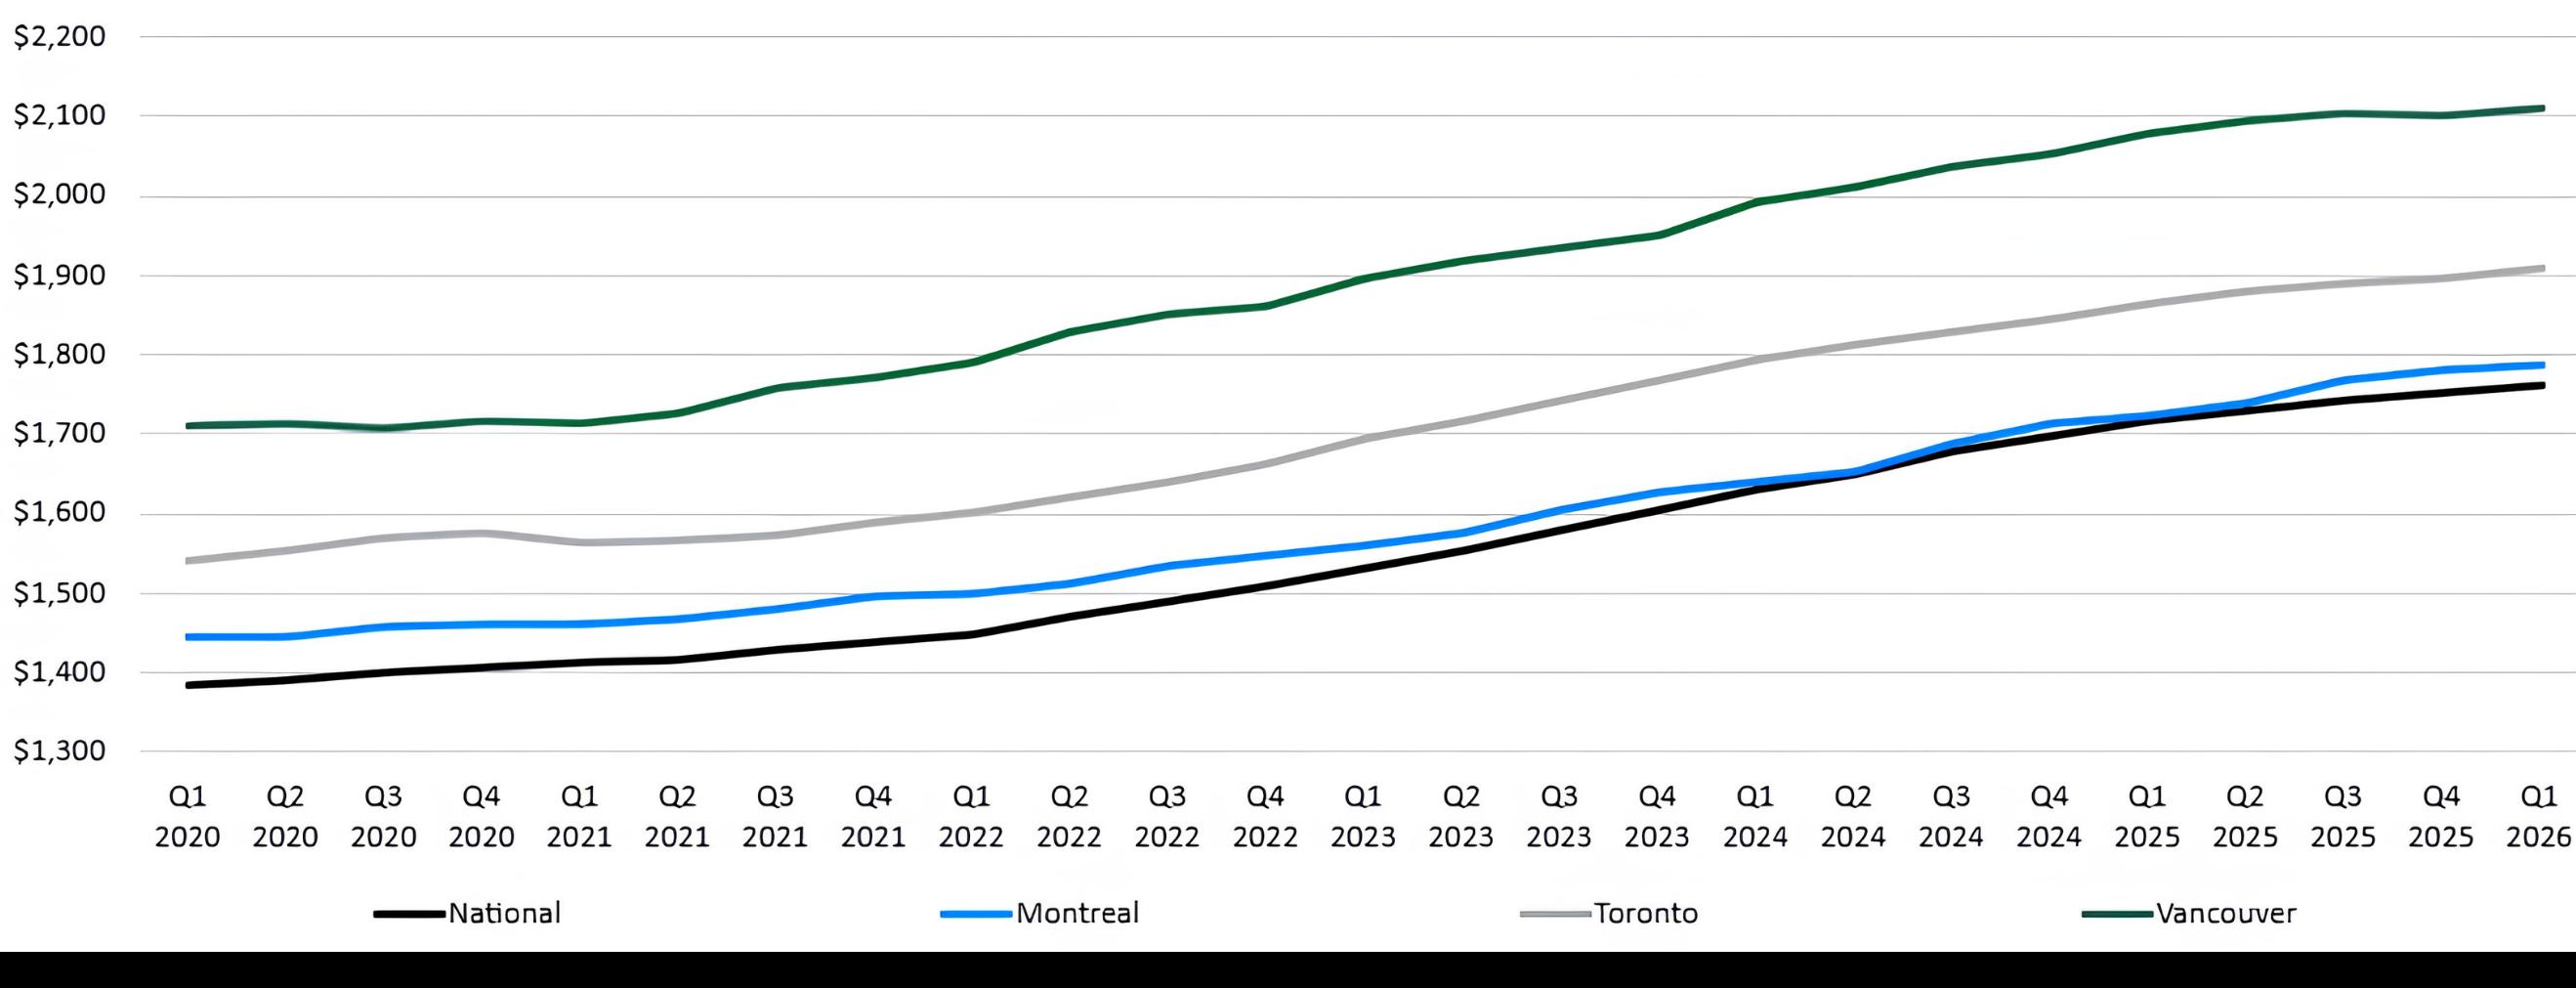
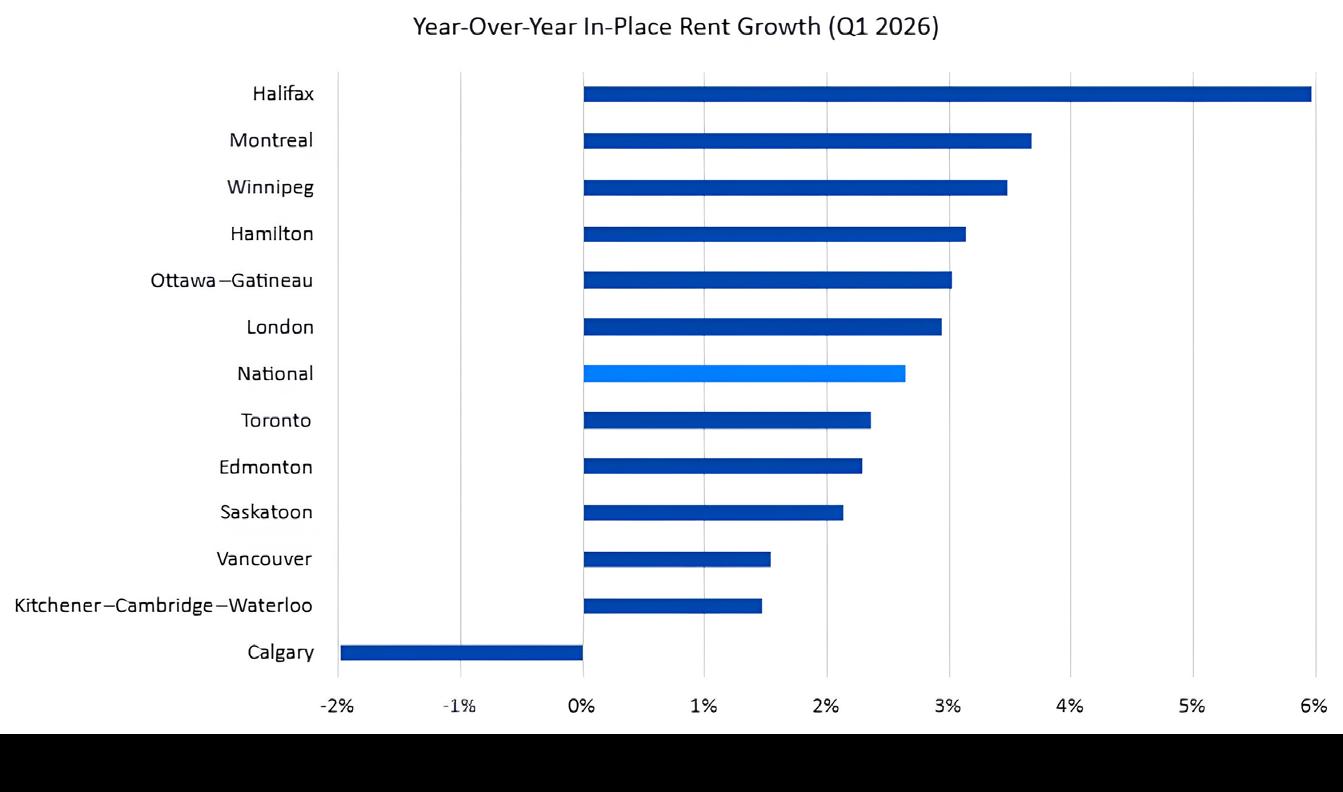
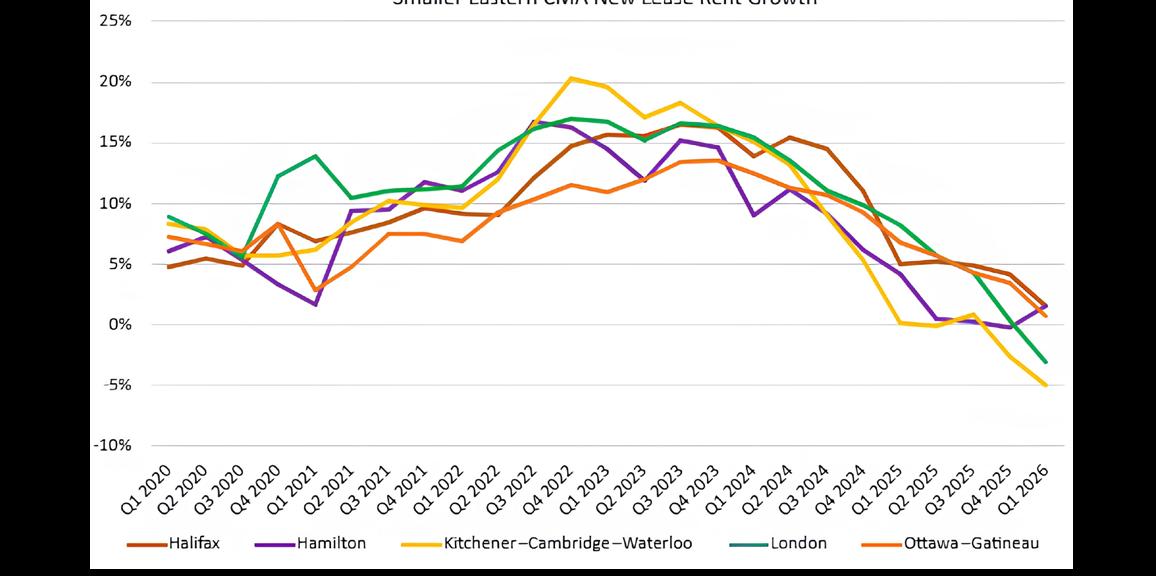
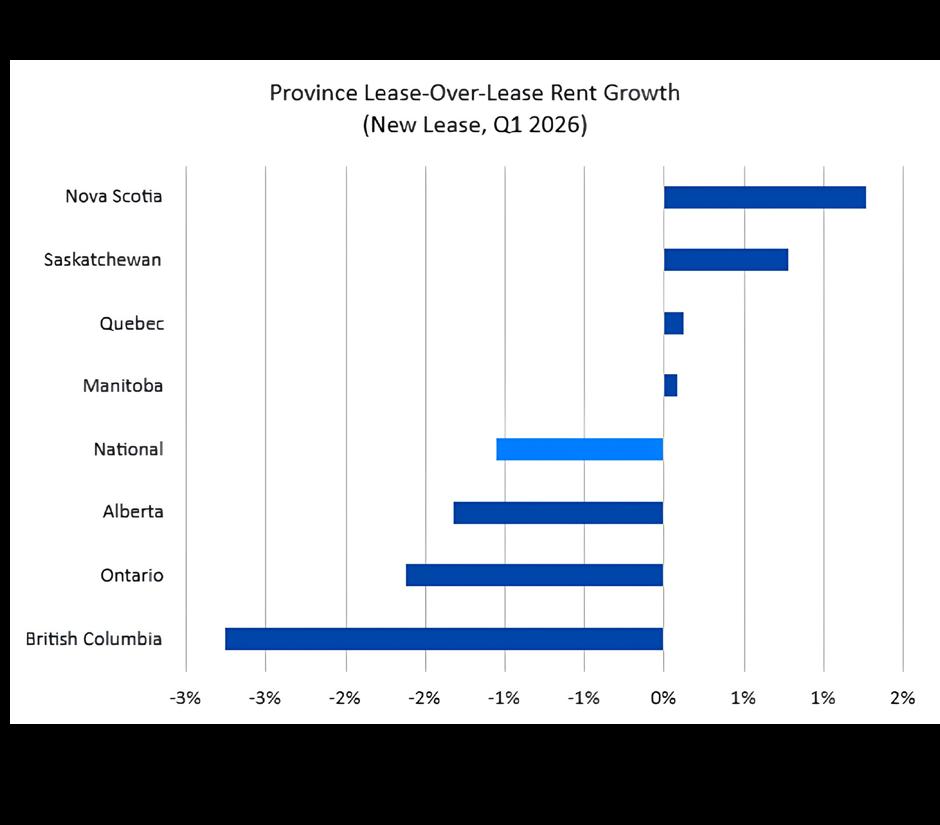
Multifamily rents in Canada continue to increase, but the growth rate is slowing significantly. The average national in-place rent increased $8 in Q1 2026 to $1,761, while annual growth declined to 2.7%, the lowest level in four years. In-place rents represent an aggregation of all rents in a given Census Metropolitan Area (CMA), including those for new leases, renewals and existing leases. With new lease rates turning negative in many markets, rent growth is increasingly being driven by renewal activity rather than new leasing.
Rents – Allowable & Actual
Rent Growth
Year-Over-Year In-Place Rent Growth
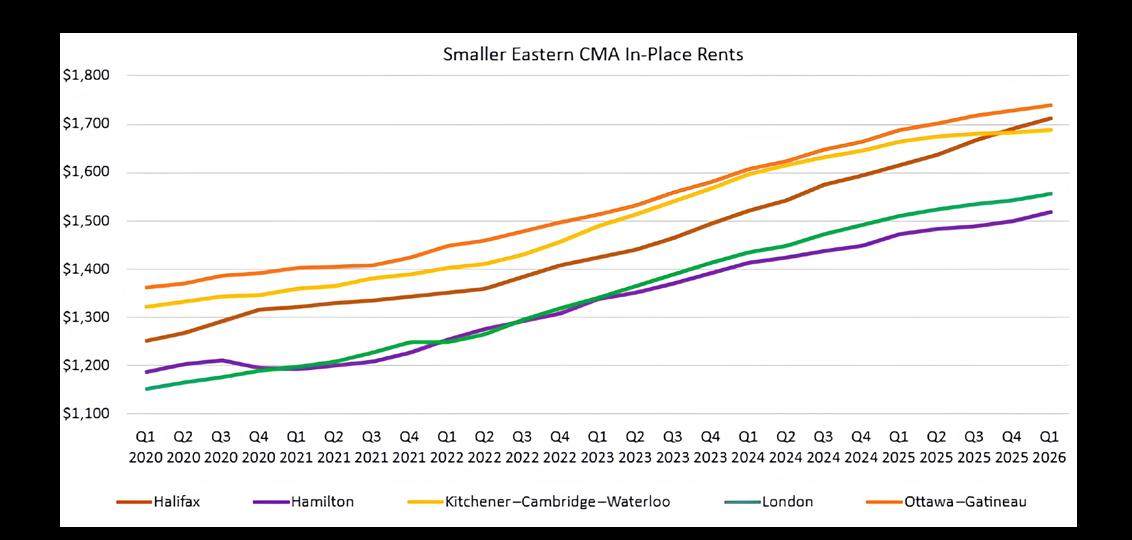
Smaller Eastern CMA Averages
Conclusion
National & Major Averages
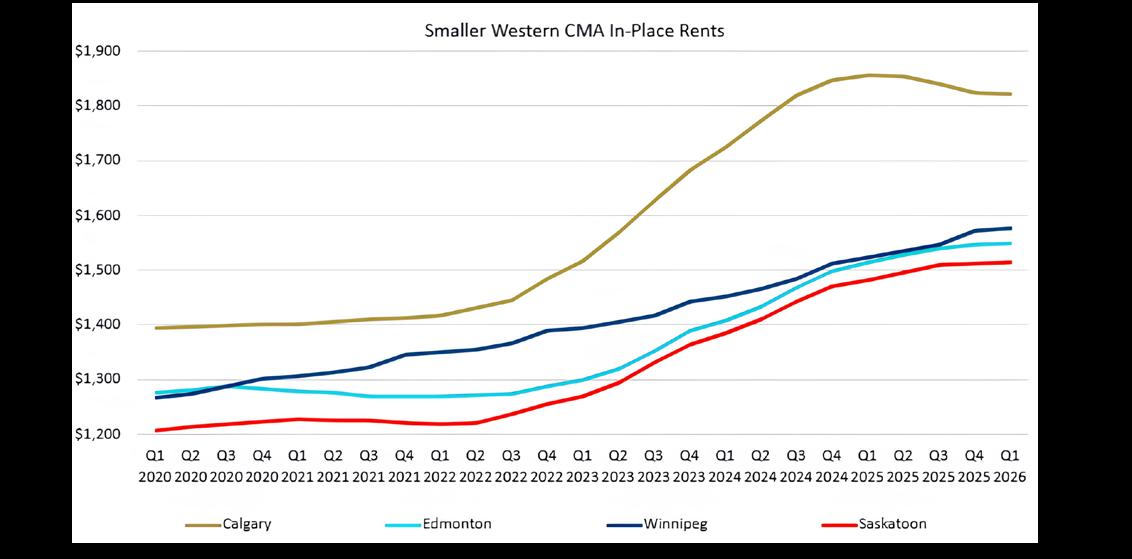
Smaller Western CMA Averages
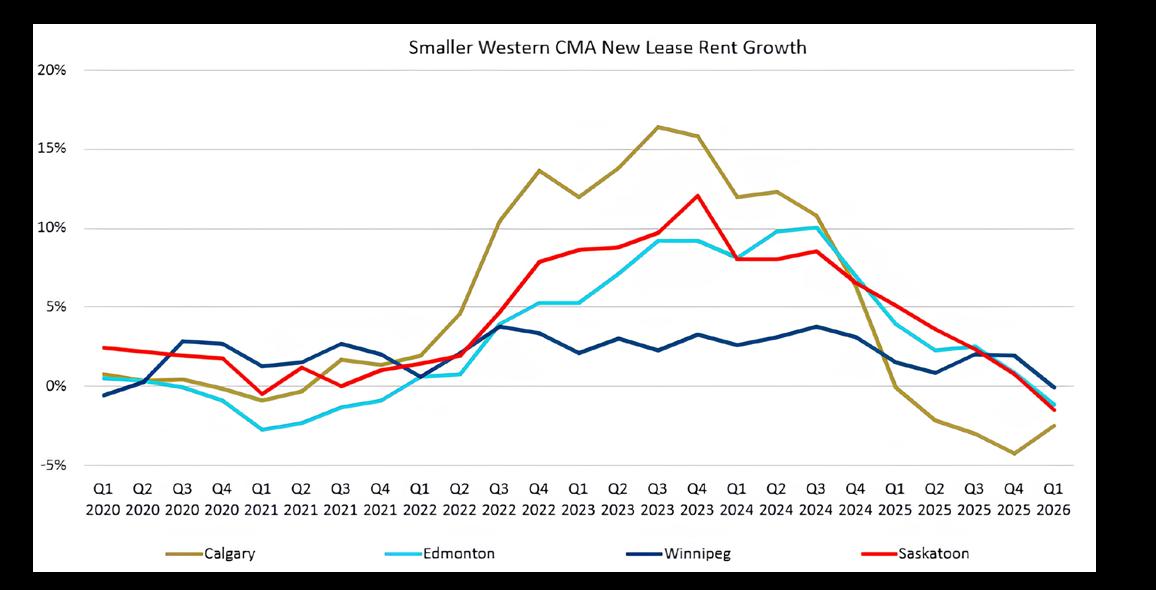
Canada’s rental market continues to expand, but growth is no longer uniform. In Q1 Halifax (6.0%), Montreal (3.7%) and Winnipeg (3.5%) led year-over-year in-place rent growth, while major markets such as Toronto (2.4%), Vancouver (1.6%) and Kitchener-Cambridge-Waterloo (1.5%) lagged. Calgary (-2.0%) was the only CMA to post negative growth. With national vacancy rising to 5.1% and new lease rates declining, the market is shifting into a more balanced phase. Rent growth is increasingly driven by renewals and localized demand conditions, reinforcing a clear trend: performance is diverging across regions rather than moving in lockstep.
Yardi Canadian Multifamily Report Quarterly insights on rent growth, vacancy, turnover and digital demand across major Canadian CMAs. info.yardi.com/multifamily-market-reports-for-canada/