

December 2025
Governance, Entrepreneurship, and Job Creation in Kenya: Strategies for Unlocking Productivity and Growth
Cover photo from Pexels, used under Creative Commons License
December 2025
Governance, Entrepreneurship, and Job Creation in Kenya: Strategies for Unlocking Productivity and Growth
Authors
Daniel Bosa Rincon, Sarah Bryant, Samantha Churchill, Benton Coblentz, Jessica Dunphy, Mahnoor Kashif, Bryan Manoo, Mohamad Moslimani, Ana Maria Perez, Hana Rajap
Faculty Advisor Professor Mark A. Dutz
January 2026
(This page intentionally left blank)
The authors extend our gratitude to the individuals who contributed to the findings of this report. We are grateful for the technical guidance, vision and mentorship of our faculty advisors, Professors Mark A. Dutz with support from Izak Atiyas. The World Bank Outcomes Department, World Bank and International Finance Corporation (IFC) Kenya country teams and other collaborators also played an essential role in providing contacts, ideas and feedback throughout the drafting process.
Our fieldwork in Nairobi would not have been possible without the support of Dr. Miriam Omolo and her team at the Strathmore Institute of Public Policy and Governance. Their partnership and advice were invaluable to the development of the report.
We also express sincere gratitude to the experts, policy practitioners, and business leaders who shared their time and perspectives with us and greatly shaped our understanding of the issues discussed in this report. The contents of the report do not necessarily reflect the views of the interviewees or their organizations. The organizations or individuals we interviewed are listed alphabetically below.
• Africa Economic Research Consortium (AERC)
• British Chamber of Commerce
• Professor David Khaoya
• Electricity Sector Association of Kenya
• Energy and Petroleum Regulatory Authority
• Ethics and Anti-Corruption Commission (EACC)
• Financial Sector Deepening Kenya (FSD-K)
• Francis Wang’ombe Kariuki, Senior Competition policy Advisor, Bowmans Law and former Director-General of CAK
• Inter-Region Economic Network (IREN)
• Kenya Association of Manufacturers (KAM)
• Kenya Coffee Traders Association
• Kenya National Chamber of Commerce and Industry (KNCCI)
• M-KOPA
• Osprey Renewables
• Public Procurement Regulatory Authority
• State Department of Parliamentary Affairs
• Tegemeo Institute
• The Institute for Social Accountability (TISA)
• The World Bank
• Professor XN Iraki
• Watu Kenya
AG Attorney General
ANM Agent network manager
BRS Business Registration Service
BTI Bertelsmann Transformation Index
CA Communications Authority of Kenya
CAK Competition Authority of Kenya
CBA Commercial Bank of Africa
CBK Central Bank of Kenya
CC Control of corruption
CMA Capital Markets Authority
DCE Departmental Committee on Energy
DCI Directorate of Criminal Investigations
DSS Direct Settlement System
EAC East African Community
EACC Ethics and Anti-Corruption Commission
ECX Ethiopian Commodity Exchange
e-GP Electronic government procurement
EPRA Energy and petroleum Regulatory Authority
ERB Electricity Regulatory Board
ERC Energy Regulatory Commission
FIT Feed in Tariffs
GDC Geothermal Development Company
GDP Gross Domestic Product
IIAG Ibrahim Index of African Governance
IPP Independent Power Producers
JFSRF Joint Financial Sector Regulators Forum
KENGEN Kenya Electricity Generating Company
KES Kenyan Shillings
KETRACO Kenya Electricity Transmission Company
KIPPRA Kenya Institute for Public Policy Research and Analysis
KNCCI Kenya National Chamber of Commerce and Industry
KNEB Kenya Nuclear Energy Board
KPI Key performance indicator
KPLC Kenya Power and Lighting Company
KPCU Kenya Planters’ Cooperative Union
KRA Kenya Revenue Authority
NCE Nairobi Coffee Exchange
LCPDP Least Cost Power Development Plan
MAPS Methodology for Assessing Procurement Systems
Acronyms and Abbreviations
MNCs Multi-national corporations
MoALD Ministry of Agriculture and Livestock Development
MoE Ministry of Energy
MSME Micro, small, and medium-sized enterprises
MTP Medium-Term Plan
NCE Nairobi Coffee Exchange
NKPCU New Kenya Planters Cooperative Union
NPS National Payment System
NuPEA Nuclear Power Regulatory Authority
ODPC Office of the Data Protection Commissioner
PPA Power purchase agreement
PPRA Public Procurement Regulatory Authority
PSP Payment service provider
REA Rural Electrification Authority
REI4P Renewable Energy Independent Power Producer Procurement Programme
REREC Rural Electrification and Renewable Energy Company
SBR State-business relationship
SIPPG Strathmore Institute of Public Policy and Governance
SOE State-owned enterprise
USSD Unstructured supplementary service data
V2030 Kenya Vision 2030
WB World Bank
WGI Worldwide Governance Indicators
Facing weak productivity growth, tight fiscal constraints, and growing youth unemployment, Kenya—like many lower middle income countries (LMICs) undergoing demographic change—is grappling with the challenge of generating more and better jobs.
This report hypothesizes that state policies and governance arrangements shape the intensity and quality of market competition—through the government’s role as policy architect, market regulator, and market developer—thereby influencing productivity and job creation across the Kenyan economy. Whether these functions strengthen or weaken competition depends on governance conditions including credible policy commitment, transparency, checks on discretion, and public accountability. The report explores this hypothesis by leveraging a mix of literature reviews, quantitative data analysis, and stakeholder interviews.
On aggregate indicators of governance—including measures of the control of corruption—Kenya underperforms many peers in the East African Community and globally. Nonetheless, the average experience of countries at higher levels of integrity of public resource use, suggests that if Kenya were to improve its performance in this domain, its entrepreneurial dynamism may dramatically improve. This aligns with firm-level data that indicates younger and more innovative firms with higher labor productivity growth report more bribery requests and greater difficulty accessing essential business services.
To illustrate how these governance constraints related to state-business relations (SBRs) materialize in practice, the report examines three sectors with strong job creation potential. The electricity industry demonstrates how non-competitive contracting and opaque policy processes create economy-wide costs. The digital financial services industry illustrates the interaction between innovation and market concentration, creating opportunities and challenges to unlock consumer gains from technological advances. The coffee industry has strong potential for competitive entry but faces persistent governance challenges.
Overall, enabling more and better-paid jobs will require more than regulatory and rule changes to increase market competition. Policymakers must identify specific governance and SBR mechanisms that impact entrepreneurship and competition. The report identifies several key barriers to job creation:
• The disconnect between potential high-growth firms and access to essential business services must be solved through a business-friendly, level playing field so all productive entrepreneurs can enter and expand.
• Gaps in regulatory oversight must be closed to stimulate competition and job growth.
• Redundancies between and within different levels of government must be resolved to minimize barriers to entry, innovation, and increased production.
• Where the government has stakes in private enterprises, publicly owned firms must be structured to avoid stifling new entrants and innovation.
• Where implementation of good governance policies like transparent procurement is incomplete, the Kenyan government must finalize reforms to encourage public trust and job formalization.
• Governance challenges specific to each individual industry must be identified, addressed and monitored—with learnings applied to improve implementation in these industries as well as other industries.
Specific recommendations for each industry, as well as across the Kenyan economy are summarized in the Summary Table.
Summary Table. Summary of Recommendations
Section Recommendations
Electricity Clarify and streamline institutional mandates MoE, EPRA, KETRACO, KPLC, IPP Office
Prioritize critical grid upgrades
Digital Finance
KETRACO, KPLC, National Treasury, MoE Short-term
Finalize full transmission unbundling KETRACO, KPLC Medium-term
Empower the IPP Office as the central procurement authority Parliament, MoE, IPP Office, AG’s Office Medium-term
Professionalize recruitment and leadership in the IPP Office
MoE, IPP Office, Public Service Commission
Implement the Renewable Energy Auction Policy MoE, EPRA, IPP Office
Strengthen national demand forecasting MoE, KETRACO, EPRA Medium-term
Strengthen regulatory coordination CA, CBK, CAK Short-term
Cap peer-to-peer mobile money fees CBK Short-term
Mandate full interoperability
Implement open finance and data portability
Push for full structural separation of M-Pesa
CBK, CAK Medium-term
CBK, OPDC, JSFRF Medium-term
National Parliament, CBK, CAK, Treasury Long-term
Coffee Simplify and streamline licensing CMA, Coffee Board, county governments Short-term
Increase transparency in licensing decisions CMA Short-term
Monitor market concentration annually CMA, Coffee Board Short-term
Develop contestability safeguards to prevent re-emergences of dominant state-owned or politically connected firms CMA, Coffee Board Medium-term
Enhance DSS transparency and usability NCE, Coffee Board Short-term
Support cooperatives and farmers’ participation in direct sales NCE, Coffee Board, counties Short-term
Use DSS and auction data to track farm-gate income trends NCE, Coffee Board, MoALD Short-term
Pilot a calibrated value-sharing mechanism Coffee Board, MoALD Medium-term
* Timeframe estimates are based on global experiences with similar reforms and synthesis of stakeholder suggestions. Reforms that are more complex, require many actors, and confront more powerful interest groups are classified as longer-term priorities.
Section continued Recommendations continued
Coffee continued Establish an inter-agency coordination platform
Provide targeted governance support to cooperatives and factories
Build county-level capacity for extension and quality upgrading
Responsible Actors continued Timeframe continued
CMA, Coffee Board, county governments, MoALD Short-term
Coffee Board, counties, MoALD Short-term
Coffee Board, counties, MoALD Medium-term
EconomyWide Policy Recommendations
Public procurement: Leverage MAPS assessment to benchmark procuring entities
Public procurement: Partner with the private sector on a market perceptions survey
PPRA Short-term
PPRA, business associations Medium-term
Sub-national licensing and regulation: Fully implement County Licensing Regulations Trade Ministry Short-term
Sub-national licensing and regulation: Improve inter-county trade efficiency
Sub-national licensing and regulation: Unify county business environment assessments
Transparent and participatory policymaking: Adopt and enforce a standard consultative process for inclusive engagement in regulatory and legislative policymaking
KNCCI, Council of Governors, Trade Ministry Medium-term
KIPPRA, Trade Ministry Short-term
National Parliament, State Department for Parliamentary Affairs, AG’s Office, Department for Justice Long-term
1.1 Objective and research question
This workshop report explores selected issues at the intersection of governance, productivity, and job creation in Kenya. It offers recommendations to be used by Kenyan stakeholders, multilateral development banks, and other interested entities to accelerate sustainable job creation as a pathway out of poverty. The report’s insights may also be of interest to other countries facing constraints similar to Kenya.
The report is guided by the following research questions: How do state policies and governance arrangements impact productivity and job creation in Kenya? How are these evident in selected industry value chains?
Kenya’s dynamic business landscape and growing youth population make the country an important model for middle-income countries grappling with demographic change and the generation of sufficient “good jobs.” We hypothesize that governance arrangements can either facilitate or impede the creation of more and better jobs.
1.2 Methodology
1. Literature review: We conducted a literature review on competition and entrepreneurship, market failure and industrial policy, and governance and political economy challenges. We consulted sources including academic publications, World Bank (WB) reports, and government documents—including Kenya Vision 2030 (V2030) and related strategic planning documents.
2. Quantitative data analyses: We use the World Bank’s Worldwide Governance Indicators (WGI)—particularly the Control of Corruption (CC) indicator—to assess the evolution of CC in Kenya and selected regional and global comparators. We also use the Bertelsmann Transformation Index (BTI) “resource efficiency” measure which relies on structured qualitative assessments by in-country and international experts on efficient use of public assets, policy coordination, and anti-corruption policy. We compare the BTI and its relationship
with income levels and political participation across comparator countries. The report also utilizes the most recent round of the World Bank Enterprise Survey for the formal sector in Kenya, conducted in 2018.1 We use both the raw microdata and the available indicators database to conduct correlational analysis to understand Kenyan firms’ perceptions of corruption and the business environment, and how they correlate with firm characteristics, innovation, and labor productivity growth. We do not conduct causal analysis, but our correlational analysis provides suggestive evidence with implications for job growth in Kenya.
3. Stakeholder interviews: We conducted in-person interviews with key Kenyan stakeholders during one week of fieldwork in Nairobi in October 2025, and virtual interviews with individuals who were unavailable during our travel to Kenya. The WB Kenya team and SIPPG were instrumental in connecting us with individuals from the government, regulatory agencies, academia, civil society, business associations and private firms. A full list of interviewees can be found in the Acknowledgements section of this report.
The report first presents an analytical framework relating to governance quality, market competition, and productivity and employment outcomes. Next, it provides by a brief background on Kenya’s political economy and aggregate analyses of governance and related indicators. Grounded in this context, the report turns to case studies of Kenya’s electricity, digital finance, and coffee industries—exploring opportunities to enhance transparency and accountability in state-business relations (SBRs). We conclude with economy-wide recommendations to further align policymaking with the public interest and unlock greater productivity and job growth in Kenya.
The functioning of markets depends on government policies and governance arrangements, which shape the rules, incentives, and constraints that guide firms. Well-designed policies promote competition, innovation, resource efficiency, and output growth, creating more and better jobs. Conversely, distorted policies, weak accountability, corruption, or policy capture, hinder competition—leading to resource misallocation, reduced innovation, and stagnant productivity. The analytical framework underlying this report emphasizes the relationship between government policy choices, governance quality, and market competition as key factors influencing productivity and employment outcomes. This framework helps assess whether Kenya’s governance and policy context acts as a facilitator or barrier to inclusive economic growth.
2.1 Government policies, governance issues, and market competition
This section explores how governments influence the intensity and quality of market competition through both policy design (de jure) and governance practices (de facto).
2.1.1 Government policies that foster competition
Governments can influence markets in the public interest through three roles that directly affect competition:2,3
• As policy architects they set the overall strategic direction for markets—ensuring coherence across industrial, trade, and competition policies whilst establishing the institutional mechanisms that coordinate them.
• As market regulators they define and enforce the “rules of the game” that govern firm behavior, market entry, and fair competition.
• As market developers they allocate public resources to build enabling infrastructure, correct coordination failures, and promote competitive, well-functioning markets.
These functions interact dynamically: effective
policy design provides direction and coherence, regulation translates those objectives into enforceable market rules, and resource allocation operationalizes them through investment and incentives. Table 1 illustrates the main instruments governments use under each role to foster market contestability and efficiency.
2.1.2 Governance issues that affect competition
While formal policies and regulations set the rules, their success relies on how they are put into practice. Even the most well-designed legal frameworks in the public interest can fail to promote competition if governance conditions are weak. Such weaknesses manifest in inconsistent rule application, untrustworthy commitments, or vulnerability to capture by vested interests, among other symptoms.
Governance quality determines whether public actions serve collective goals or private interests. Effective SBRs are characterized by credibility, transparency, reciprocity, and coordination— qualities that foster trust and predictability between the public and private sectors.4 Conversely, when incentives lead—allowing state and business officials to generate, preserve, and share rents— and corruption and institutional fragmentation dominate, SBRs become collusive, policies in the public interest lose credibility, and competition is undermined.5,6
Thus, the interaction between policy and governance determines whether the state acts as an enabler or inhibitor of market competition. Four main governance factors influence competitive outcomes:
• Credible commitment and policy stability: Foster competition by providing predictable market rules. Stable regulation in the public interest and consistent enforcement reduce uncertainty, which encourages firms to plan, enter markets, and innovate.7,8 Policy reversals, exemptions, or uncertain enforcement weaken confidence—favoring incumbents. Credibility underpins strong competition;
Policy architect
• National competition policy frameworks that embed competition principles across industrial, trade, and innovation policies.
• Trade and investment policies that determine exposure to international markets through tariff structures, bilateral agreements, and regional agreements.
• Regulatory impact assessments that identify potential anticompetitive effects of new laws and regulations.
• Inter-agency coordination mechanisms or competition councils that align economic policies and avoid contradictory incentives.
• Strategic industrial or productivity roadmaps that set long-term priorities while preserving market neutrality.
Market regulator
Market developer
• Competition and antitrust policies that prevent cartels, abuse of dominance, and anticompetitive mergers.
• Industry regulations that ensure open access and fair pricing in network industries (e.g., telecoms, transport, and energy) and finance.
• Licensing and market-access regimes that promote contestability through transparent, non-discriminatory, and proportionate entry requirements.
• Standards and consumer-protection rules—including product labeling, quality certification, and transparency requirements—that reduce information asymmetries.
• Oversight of market conduct through independent competition authorities and judicial review.
• Competitive public procurement and Public-Private Partnership frameworks that promote efficiency and entry.
• Time-bound industrial and innovation incentives (e.g., Research & Development, Small and Medium Enterprise support) designed to avoid market distortion.
• Governance of State-Owned Enterprises that ensures transparency and competitive neutrality.
• Public finance and subsidy instruments (e.g., tax incentives, credit guarantees or state aid) implemented with proportionality and sunset clauses.
• Public investment in enabling infrastructure and access to finance programs that lower entry barriers.
Source: Authors’ creation based on Tirole, 2016; Rodrik, 2004; Sen, 2015; OECD,2021; Licetti et al., 2023; World Bank, 2025
without it policies falter and market vitality suffers.9
• Transparency in policymaking: Reduces preferential treatment by elites by ensuring firms have equal access to rules, procedures, and opportunities.10 Clear information flows improve policy design and compliance. In contrast opacity distorts competition by raising costs and enabling rent-seeking.
• Checks and balances on government discretion: Independent oversight, judicial review, and legislative scrutiny prevent regulatory abuse and help maintain competition. Autonomous competition authorities, audits, and courts limit arbitrary
actions and policy capture11,12—boosting government coordination, accountability, and market trust. Conversely, concentrated power or weak independence fosters market-distorting favoritism.
• Accountability to the public: Conflictof-interest rules, transparent lobbying, and accountability address risks of elite capture and corruption by aligning state and business officials’ incentives with economic efficiency. When elites influence policy for private gain, competition suffers. Incumbents lobby to block new entrants, and politicians trade favors for support.13 This collusion leads to rent-seeking and resource misallocation, which lower productivity.14
2.2 Competition is essential for productivity, growth, and more and better jobs
2.2.1 Competition and productivity
Productive SBRs and competition-enhancing policies are key determinants of economic growth and structural transformation.15 When governments design sectoral and industrial policies that preserve or strengthen competition, they channel resources toward more dynamic industries and firms, thereby accelerating productivity growth.16 Competition raises productivity through four key reinforcing channels:
• Productive efficiency: Competitive pressure forces firms to innovate, adopt new technologies, and optimize processes to remain viable.17
• Allocative efficiency: Competition levels the playing field, which ensures that capital and labor flow toward firms and industries where they are used most productively, thus maximizing overall output.18
• Market selection: Competition strengthens the process of “creative destruction” by forcing less efficient firms to exit and enabling more efficient ones to grow and gain market share.19
• Entrepreneurial direction: The institutional rules of the game determine whether entrepreneurial effort is directed toward productive innovation or unproductive rent-seeking. In well-regulated competitive markets entrepreneurs are rewarded for creating value; in distorted markets they compete to capture rents or relocate to more productivity-supporting business environments, limiting innovation and dynamism.20
2.2.2 Competition and more and better jobs
Competition not only drives productivity, but also shapes the quantity and quality of employment. In competitive environments, firms have stronger incentives to expand output, invest, and hire, which lead to higher labor demand and broader employment opportunities.21 However, the magnitude and distribution of these employment effects depend on the nature of market reforms and their interaction with labor market policies. Competition improves labor market outcomes through four main channels:
• Investment and firm expansion: Competitive pressure pushes incumbent firms to become more efficient and invest in productivity-enhancing technologies,
new productive entrepreneurs to enter and expand, and unproductive firms to exit and release their resources to more productive entrants and incumbents. These, in turn, raise firms’ capacity to increase output and thereby create jobs.
• Wage and job quality improvements: Firms exposed to greater competition have stronger incentives to retain skilled workers, train their less-skilled workers, and invest in learning and upgrading for all workers. These actions lead to higher wages, better working conditions, and reduced informality.22
• Innovation and entrepreneurship: By rewarding efficiency and innovation, competition encourages entrepreneurs to allocate their talent to developing new products, services, and technologies. This expands employment across industries, rather than to unproductive rent-seeking activities or more rewarding business environments in other countries.23
• Economic diversification and resilience: Competitive markets promote entry and diversification across industries, creating more adaptable economies that can generate employment even amid structural shifts.24
Thus, competition acts as a catalyst for job creation and upgrading by aligning firm incentives with productivity and efficiency, expanding production of goods and service and thereby generating more jobs. Therefore, economies that foster open and contestable markets are better positioned to achieve both faster growth, as well as more inclusive and higher-quality employment outcomes.
In the 63 years since Kenya gained independence, its economy has grown from less than USD 1 billion to more than USD 124 billion in goods and services produced.25 Yet, fewer than 40% of Kenyans are in wage and salaried work,26 for which the average annual income is approximately USD 2,000. Tracing Kenya’s political and economic development over the past century provides important context for this outcome and the policies this report discusses.
3.1 Kenya’s political history
Kenya was under British colonial rule for nearly 70 years before gaining independence on December 12, 1963. Before independence, British authorities had established a settler colony that operated a highly centralized and statist government.27 The British seized land from locals, structured the economy around the production and export of cash crops, and leveraged fiscal, monetary, and labor policies to enhance their narrow economic interests—impoverishing most Kenyans in the process.28 This colonial legacy still directly impacts Kenya through structural constraints like underinvestment in human capital and growthoriented infrastructure, as well as inherited policies including extensive government intervention and administrative controls in industry.29
After independence, Kenya’s first president, Jomo Kenyatta, introduced land reforms to transfer land from departing white settlers to African smallholders.30 However, rather than expropriating the land, transfers were based on a willing-buyer willing-seller model. Consequently, redistribution was highly unequal and further entrenched an emerging class of local political and economic elites. The inequalities and government distrust propagated by this reform continue to impact land rights and Kenyan politics generally.31
Kenya has also long suffered from extensive patronage networks, though the form of patronage has shifted over time. Under President Daniel arap Moi, governmental institutions were eroded in favor of a loyal network of administrators, and corruption and rent-seeking rapidly became ubiquitous.32 When the opposition rose to power in 2002, patronage networks were sustained under President Mwai Kibaki despite additional attention
to technocratic governance.33 The persistence of patronage networks under successive regimes entrenched the idea that benefits from governance were a zero-sum game for different parties and ethnic groups.34
Kenya also suffered from a stagnating economy in the late 20th century. At 4.2%, annual growth was already slow in the late 1970s relative to its potential for faster economic catch-up. But by the 1990s it had slowed to 1.9%—falling far behind population growth, and leading to rapidly rising unemployment and underemployment alongside an expansion of informal employment.35 During this period, Kenya entered into structural adjustment programs with the WB and IMF that required Kenya to liberalize markets and trade, reduce government spending, and privatize parastatals and civil service functions. Despite implementing such reforms, job growth remained weak.
In 2010, following a deadly dispute over President Kibaki’s re-election, Kenya drafted a new constitution.36 The constitution consolidated Kenya’s democratic transition and enshrined “good governance, integrity, transparency and accountability” as principles of governance.37 The constitution also devolved many state powers to county governments, reversing the previous constitution’s focus on the centralization of power.38 Since the adoption of this constitution, Kenya has made great progress in establishing a legal and institutional framework to increase transparency and combat corruption. However, enforcement has remained highly uneven in practice, with selective enforcement buttressing existing political power and patronage networks.39
Kenya’s economy has changed significantly over the past few decades. The share of labor working in agriculture declined from approximately 70% to a slightly more than 40% between 1990 and 2018, as the employment shares of manufacturing and services expanded.40 Such structural transformation is usually accompanied by strong aggregate productivity growth as workers move from low to high productivity activities. However, in Kenya’s case, structural transformation has dragged
on aggregate productivity growth (Figure 1). Highly productive activities have failed to expand employment, while less productive activities have held on to workers. By contrast, several of Kenya’s EAC peers have benefitted more from structural transformation—with the exception of Ghana, which has compensated for its lack of reallocation with stronger within-sector productivity growth.
Within industries, Kenya’s labor productivity growth has been particularly weak in manufacturing. According to the University of Groningen Economic Transformation database, manufacturing labor productivity in 2018 was only two-thirds of its level in 2000 (Figure 2). Thus, the increase in employment in manufacturing appears to primarily have resulted from the growth of jobs in the less productive informal sector.41
Low growth in labor productivity was accompanied by almost no growth in total factor productivity. This indicates that the efficiency of all inputs used in production—including physical and knowledge capital and how they are combined to generate increased production—did not increase significantly either.42 Weak productivity growth has also coincided with declining external competitiveness. Kenya’s exports have been falling as a share of GDP over time and are overwhelmingly agricultural, with limited value-added exports like merchandise goods or services (Figure 3). This has widened Kenya’s current account deficit and increased pressure on its foreign reserves, whilst precluding otherwise dynamic sources of job growth.
Since its launch in 2008 by President Kibaki, V2030 has guided the country’s economic agenda. The stated aim of V2030 is to “create a globally competitive and prosperous country with a high quality of life by 2030.” V2030 was built on three pillars—economic, social, and political—and is being implemented through a series of five-year MediumTerm Plans (MTPs). The blueprint followed Kibaki’s 2003–2007 Economic Recovery Strategy, which was intended to restore growth and emphasized wealth and employment creation.43
The plan—now on the fourth MTP—provides an overarching, flagship-project-heavy framework with the stated goal of moving Kenya into middleincome status. Subsequent administrations retained V2030 as the official long-term planning anchor while adjusting emphasis via their MTPs. The most significant reframing arrived under President William Ruto, who directed that the fourth MTP be re-aligned to complement his Bottom-up Economic Transformation Agenda44—focusing on job creation, inclusion, and core pillars (agriculture; micro, small, and medium-sized enterprises [MSME] economy; housing; healthcare; digital/creative) meant to drive an economic turnaround and job growth.45 The plan frames transformation in human capital, markets, domestic resource mobilization, and digital evolution as necessary to avoid a “middleincome trap.”46
Figure 1. Decomposition of labor productivity growth, 2000-2018
Contribution by component, 2000 to 2018
Source: Authors’ calculations using the University of Groningen Economic Transformation Dataset
Year
Source: Authors’ calculations using the University of Groningen Economic Transformation Dataset
3.4 Challenges to Kenya’s economic progress
3.4.1 Tight fiscal space
Kenya’s public debt is 68% of GDP, and more than 5% of GDP is spent on interest payments.47 This leaves the government little room to make large new investments towards economic development and puts pressure on it to raise additional tax revenue. Average inflation has been above the target range, while investment and savings rates are below V2030 benchmarks—headwinds that slow capital formation and formal job expansion. Additionally, as a member of several regional organizations, Kenya has limited scope to unilaterally adjust its trade and export promotion strategies to boost revenues.
Figure 3. Exports of goods and services (% of GDP), 1960-2020
Exports as a percentage of GDP
Source: World Bank
3.4.2 Large informal sector and governance barriers to formality
Over 80% of Kenya’s jobs are informal; the informal sector has been responsible for about 90% of job growth in recent years. The “hustler economy” is often spoken about with pride in Kenya, and indeed the informal sector provides many Kenyans with earning opportunities that they would not otherwise have. However, these jobs often offer low wages, limited benefits, and little opportunity for sustainable growth. Furthermore, most informal businesses are subsistence micro-enterprises with no plan to transition to the formal economy48 often citing high and unpredictable taxation, excessive and opaque regulatory requirements, and widespread petty corruption as reasons for remaining informal. Heavy reliance on the informal sector also limits Kenya’s ability to expand its tax base, further exacerbating its fiscal crunch.
3.4.3 Unrealized implementation of good governance frameworks
On paper, Kenyan laws are widely recognized as a robust framework for good governance, accountability, and transparency. But in practice, these measures have not been robustly implemented due to vested interests and a lack of political will. For example, in 2025 Kenya rolled out a new government e-procurement portal which aims to make procurement more accessible, fair, and transparent.49 However, stakeholders have cited concerns about MSMEs still being left behind and continued opacity in the selection process. Consequently, political barriers to full implementation of existing policies must be addressed to fully realize the goals of V2030.
While the 2010 constitution vested political power in 47 discrete counties, it is often unclear how duties and other revenue-raising fiscal instruments are divided between federal and local governments. Due to underdeveloped tax structures, many counties have limited ability to generate their own revenue, which exacerbates inequalities across counties. Furthermore, weak administrative capacity means that public services and projects often suffer from poorly executed procurement and budgeting practices as well as a lack of coordination across counties.
Additionally, devolving political power to local governments has not solved the issue of vast patronage networks and rent-seeking behavior. Instead, it has extended the problem from the national to the local level. For example, stakeholders, complain of having to pay multiple bribes every time they cross into another county. The fragmented regulatory system can also make it difficult for businesses to extend their operations and sales across county lines.
High youth unemployment makes the accomplishment of Kenya’s V2030 goals more challenging. Based on formal metrics, Kenya’s workforce has grown increasingly educated in recent years: 80% of young adults hold at least a secondary school qualification, and over 30% have post-secondary qualifications.50 However, high youth unemployment betrays the fact that many Kenyan youth are unable to fully utilize the skills that their education provides. Without finding productive placements for its youth, Kenya may not be able to see productive benefits from its prime age work force.
Conversely, the agricultural workforce is rapidly aging; relatively few young people are seeking out work in the sector.51 The lack of a reliable flow of new entrants, threatens the sector’s long-term sustainability and growth.
To better understand the effects of Kenya’s policy implementation, this section draws on World Bank Worldwide Governance Indicators (WGI)—particularly the control of corruption (CC) indicator—to assess whether Kenya’s government efforts to address corruption have yielded the desired results. The analysis is complemented by data from the 2018 World Bank Enterprise Survey, which provides insights into business environment challenges faced by Kenyan firms in the formal sector. In recent years, Kenya’s CC indicator has been largely stagnant, indicating that the country is falling behind on the implementation of anticorruption policies. It is important to understand Kenya’s performance in addressing corruption because challenges stemming from corruption may create obstacles that prevent businesses from operating at full potential. This section also investigates Kenya’s capacity to boost its entrepreneurial dynamism; findings suggest considerable potential in this regard.
4.1.1 Evolution over time
The WGI indicators are each aggregated over a large number of individual variables based on data sources produced by 35 think tanks, international organizations, nongovernmental organizations and surveyors of private firm responses around the world. They are reported in their standard units, ranging from approximately -2.5 to 2.5 (the measures are normalized to have zero mean and unit standard deviation based on the unobserved components statistical model).52 WGI reports six governance indicators: CC, political stability, regulatory quality, rule of law, government effectiveness, and voice and accountability.
A review of CC levels reveals Kenya has made limited progress since 2005, remaining largely stagnant. Kenya performs worse in the indicator compared to other East African Community (EAC) countries, including neighboring Rwanda and Tanzania. Within Sub-Saharan Africa Kenya only outperforms Burundi, the Democratic Republic of Congo, Somalia, South Sudan, and Uganda across not just CC but all WGI governance indicators (with the exception of Uganda showing slightly
more progress in the political stability indicator). Compared to other regional partners and other international comparison countries, Kenya’s performance is relatively weak on average, at the bottom over time together with Bangladesh.
This report also leverages the Bertelsmann Transformation Index (BTI) “resource efficiency” indicator—measuring “integrity of public resource use”—as an alternate indicator of corruption, to explore associations with national income, political participation, and entrepreneurial dynamism. The indicator is henceforth referred to as “Integrity” to better reflect what it captures relative to this report’s focus on SBRs.
WGI’s CC indicator, includes 51 separate variables such as whether corruption is prevalent in the health care and education systems and the police force, and the frequency of household bribery across six distinct entities (e.g., education, medical, police). In contrast, BTI’s Integrity indicator consists of only three sub-indicators based on detailed, structured assessments by confidential in-country and international experts. The first subindicator concerns “efficient use of public assets” including the extent to which there are rising public wage bills in State-Owned Enterprises (SOEs) and civil service positions created as a means of political reward, expanding networks of patronage and clientelism in new ministries and county government departments, and politically-motivated private debt write-offs. The next sub-indicator concerns “effective policy coordination” including the extent to which hierarchical-bureaucratic coordination is undermined by personal networks and political appointments. The final sub-indicator concerns “anti-corruption policy” including the extent of conflicts of interest and whether highlevel individuals involved in large-scale corruption are prosecuted as often as low-level offenders.
Kenya’s performance on the Integrity indicator relative to EAC comparator countries is weak, with a marked downturn between 2022 and 2024. Kenya performs weakly across all sub-indicators, with public resources frequently diverted to nonproductive uses at both national and county levels, informal networks undermining institutional coordination, and anti-corruption efforts
remaining largely ineffective.53 These weaknesses constrain the government’s ability to channel resources toward infrastructure development, other productive investments, and employmentenhancing programs.
Kenya performs relatively well in terms of political openness but weaknesses in coordination, public financial management, and corruption control prevent the government from translating participation into entrepreneurial dynamism and positive perceptions of economic opportunities including jobs. Regressing the Integrity indicator against 2024 per-capita income (in current purchasing power parity terms) for countries below USD 30,000 found that on average, higher-income countries have higher Integrity scores (Figure 6). Kenya lies slightly below the regression line, suggesting its integrity of public resource use is lower than expected given its per-capita income.
Plotting the Integrity indicator against political participation54 for a global sample of countries, finds countries with more open political systems tend to use public resources with greater integrity (Figure 7). However, Kenya lies considerably below the regression line, indicating its integrity of public resource use is lower than expected given its political participation score.
Figures 8, 9 and 10 explore how Kenya’s entrepreneurship performance aligns with integrity of resource use. The first figure shows that Kenya’s increase in new entrepreneurs has been relatively stable over recent years compared to more dynamic Morocco and Rwanda.55 The second figure shows that Kenya’s entrepreneurship ecosystem is more dynamic than its income level would suggest. However, the third figure suggests that if Kenya were able to improve the integrity of its public resource use, its entrepreneurial ecosystem may dramatically improve—as Kenya is positioned at the cusp of a take-off of entrepreneurial dynamism based on the average experience of other countries at higher levels of integrity of public resource use.56
Interestingly, public perceptions of anti-corruption policies in Kenya are correlated with public perception of economic opportunities. Data from the Ibrahim Index of African Governance (IIAG), shows a continued decrease in both the public perception of anti-corruption and the public perception of economic opportunities since 2014 (Figure 11).57 This aligns with the literature on anti-corruption measures and their impact on economic growth: Xu et al. (2025)58 find that anti-corruption campaigns in Chinese provinces with higher pre-existing levels of corruption led
in those provinces.
Figure 5. Integrity Indicators across comparator countries
Source: Bertelsmann Transformation Index
Similarly, Colonneli et al. (2021)59 find that in Brazil, firms that were exposed to anti-corruption measures such as audits experienced an increase in employment and size. Trends in perceptions of anticorruption seem to mirror BTI’s Integrity indicator and the WGI CC indicator. For instance, the BTI Integrity indicator decreases from 2022 to 2024 while the WGI CC indicator decreases from 2019 to 2020 and from 2021 to 2022. Similarly, the IIAG indicator shows a decrease in the public perception of anti-corruption measures from 2019 to 2020.
We analyze the latest available round of the World Bank Enterprise Survey for the formal sector in Kenya, conducted in 2018. For purposes of exploring associations with corruption-related indicators, the relatively minor changes between 2018 and 2024 in WGI’s CC indicator and BTI’s Integrity indicator strongly support the relevance of using 2018 Enterprise Survey data as a meaningful complementary source of data for analysis. Given that the new round of the Enterprise Survey will only be released in 2026, this report presents the most timely comparative snapshot from representative enterprises.
We use both the raw microdata and the available indicators database to conduct correlational analyses to gain insight into Kenyan firms’ perceptions of corruption and the business environment, in particular how they correlate with firm characteristics, innovation and labor productivity growth. The difference between the microdata and the indicators database is that the latter contains aggregated, averaged or summarized variables (or indicators) based on the former. Our analysis is based on a representative sample of 1,001 Kenyan firms. Although we do not conduct causal analysis, our correlational analysis provides suggestive evidence that may indicate
potential implications for job growth in Kenya. The data suggest that by easing access to essential business services and lowering bribery occurrences, Kenya could experience more entry of young and innovative firms with higher labor productivity growth—offering a possible link to more and better jobs. However, it is important to consider our findings may be subject to reverse causality.
4.2.1 Young firms to face greater challenges in accessing essential business services
Access to essential business services may vary by firm characteristics such as firm age, size, and ownership type. Recent global research confirms that firm age rather than size is a critical determinant of innovation and dynamic job creation. Younger firms are key engines of job growth since they tend to be established with newer technologies and employ more productive processes. They tend to adopt better technologies and innovate at a faster rate, and are more likely to integrate into global value chains.60 Younger firms in Kenya, however, are also more likely to experience constrained access to essential business services—partially foreclosing their output expansion, or at least making entry into new markets more difficult. Exploring correlations between firm characteristics and various corruption indicators reveals a negative association between older firms and constrained access to essential business services. The constructed “foreclosure of essential business services” index captures the extent to which electricity, transport, access to land, access to finance, tax administration, and business licenses and permits, are obstacles to the firms’ operations. It also plausible that older firms are more experienced in dealing with these constraints, including how to manage potentially collusive SBRs—having acquired said experience over time.
Figure 7. Evolution of
Source: World Bank
Figure 6. Lowess regression line of Resource Efficiency on GDP per capita (below 30K USD)
Source: Bertelsmann Transformation Index and World Bank World Development Indicators
Figure 8. Regression of New Business Density on GDP per capita (below 25K USD)
Source: World Bank Entrepreneurship dataset and World Development Indicators
Figure 9. Regresion of New Business Density on Integrity of Resource Efficiency
Source: World Bank Entrepreneurship dataset and Bertelsmann Transformation Index
Figure 10. Regression of Resource Efficiency on Political Participation
Locally
Source: Bertelsmann Transformation Index
Source:
Firm size also matters. Results indicate smaller firms’ access to essential services is more hindered than that of larger firms. Additionally, firms with foreign ownership are less constrained than those with domestic ownership; this may be partly driven by having better access to finance, by virtue of being more connected to international financial markets, which may enable them to more easily circumvent essential business service constraints. The negative correlation between firms that have at least 10% foreign ownership and the foreclosure of essential business services index lends credence to this hypothesis (see Table A1 in the Appendix).
4.2.2 Hindered access to essential business services is associated with innovative firms
Firms that are more constrained and may be at least partially foreclosed by lack of access to essential business services are the types of firms that are more innovative and productive; they are the likely drivers of more output and jobs if constraints were reduced. When analyzing correlations between selected firm innovation metrics and corruption indicators, conditioned on firm size, age, industry and region, the key pattern that emerges is that firms facing constrained access to essential business services are also more likely to have introduced a new product in the last three fiscal years, offered formal training, or invested in research and development over the previous fiscal year. Similarly, firms reporting corruption as a very severe or major constraint to current operations are also more likely to invest in innovation. An alternative interpretation could be that firms facing greater hindered access to essential business services and higher levels of corruption may engage in more creative and innovative ways of keeping the firm afloat. However, panel data are required to explore this question. Future research should explore whether such investments positively impact firm productivity, and if so, whether the impact is large enough to offset the potential resourcedepleting effects of corruption. It should also
explore whether these relationships vary by firm size and age, among others.
Firms whose senior management spends more time dealing with government regulations (referred to as the “time tax” since it requires investment of time to advance firm objectives) and firms that devote a larger proportion of their sales to giving gifts and making informal payments to public officials (referred to as the “bribery tax” since it requires spending financial resources)61 are also those that undertake more product and process innovation (see Table A2 in the Appendix). This supports the hypothesis that if they were liberated from these constraints, they would have even more time to innovate, expand production, and create more jobs. An alternate hypothesis is that time and bribery taxes on firms throw sand into the wheels of firm output expansion, necessitating innovation to increase production and firm profitability.62 Again, panel data are required to explore this question. Furthermore, receiving a bribery request is also positively correlated with the offer of formal training, process innovation and research and development spending.
4.2.3 Firms experiencing at least one bribery request are associated with higher labor productivity growth
Conditional correlations between bribery incidence and selected metrics of firm performance indicate labor productivity growth over the past three fiscal years is positively associated with receiving a bribery request (see Table A3 in the Appendix). One possible interpretation of this finding is that firms targeted for bribery requests are those that could—if less constrained—achieve even higher productivity growth and translate these gains into output and job expansion. This aligns with findings from complementary studies which suggest that bribery requests may be intentionally targeted towards firms showing signs of increased productivity or profitability, and that corruption might be more harmful to such firms since, in the absence of corruption, they would likely enjoy better access to essential business services.63
Moreover, it is plausible that receiving bribery requests could drive productivity improvements, if firms implement more efficient processes and enhance their performance to counteract the negative effects of corruption. This could include adopting better management practices, investing in technology, or streamlining operations to maintain competitiveness despite the additional burdens of bribery.
Looking within specific value chains helps us better understand how governance and SBRs affect productivity and job creation in Kenya. While aggregate indicators reveal broad challenges in competition, control of corruption, and job growth, the mechanisms through which governance arrangements impact efficiency and employment are most visible at the industry level. Value chains consist of a series of separate value-adding activities, creating multiple points at which the state can either enable the creation of more and better jobs through transparency and fair access, or restrict it through market foreclosure, discriminatory pricing, and other anticompetitive practices. Examining specific industries lets us observe these dynamics concretely and determine where governance reforms could unlock higher productivity growth and more inclusive labor market outcomes.
The nature of governance challenges varies across industries depending on the underlying technology and market structure. In some value chains such as electricity transmission and mobile telecommunications networks, underlying technology costs create natural monopolies or highly concentrated industry segments. Here, competitive outcomes depend on whether access to essential infrastructure is provided on transparent and inclusive terms. Poorly designed or implemented policies governing power purchase agreements (PPAs) or digital payment services can foreclose efficient entrants and result in higher costs for both business and end-use consumers, holding back higher output and job levels. Other value chains such as coffee are characterized by successive segments where multiple firms can compete. Here, vertical integration can generate efficiency gains by providing farmers with credit, training, and quality inputs but can also stifle competition by limiting access to the market if not effectively regulated.
This report explores three industries that illustrate the varied mechanisms through which governance and SBRs shape market competition and job creation: electricity, digital financial services, and coffee. These industries were selected because they:
• Play a key role in Kenya’s economic landscape;
• Exhibit clear upstream-downstream linkages where government policy, market structure, and private sector incentives interact; and
• Offer instructive contrasts in how market competition and job growth can be promoted or undermined.
We draw on lessons from these industries to suggest reforms aimed at promoting competitive markets as well as dynamic and inclusive job creation in Kenya.
5.1.1 Why study Kenya’s electricity industry?
V2030 identifies modern reliable power as a cornerstone of industrialization, making the electricity industry a strategic case study for how state actions enable or constrain growth. Industry dynamics clearly reflect how governance shapes economic performance: procurement rules, regulatory design, and oversight structures determine costs, reliability, and access. This illustrates the core insight of our analytical framework: de jure rules interact with de facto governance to shape market contestability. State policies governing this industry shape energy constraints. As electricity is a critical input across the economy, these constraints define firms’ ability to expand production, innovate, and hire—directly influencing productivity and the ability to create more and better jobs.
5.1.2 Structure of the electricity industry
Institutions that govern policymaking, regulation, and implementation:64
• Ministry of Energy (MoE): Develops and implements national energy policy, planning, and long-term strategy for the industry— ensuring an enabling environment for investment and alignment with V2030.
• Energy and Petroleum Regulatory Authority (EPRA): Autonomous independent regulator; enforces regulations, licenses operators, and sets tariffs across the value chain.
• Rural Electrification and Renewable Energy Corporation (REREC): Manages the expansion of electricity access in rural and off-grid areas, promotes renewable energy use, and oversees the rural electrification fund.
SOEs that form the operational core of the electricity industry:
• Kenya Electricity Generating Company (KENGEN): Leading electricity generator, which provides approximately 60% of the nation’s electricity. KENGEN is 70% government owned.65
• Kenya Power and Lighting Company (KPLC): Owns and operates most electricity transmission and distribution assets in Kenya. Serves as the national off-taker and sole electricity distributor. 50.1% of shares are held by the government.66
• Kenya Electricity Transmission Company (KETRACO): De-merged from KPLC in 2008; plans, constructs, and maintains the national transmission grid.
Private capital:
• Independent Power Producers (IPPs): Private companies that develop, finance, and operate power plants and sell electricity via long-term Power Purchase Agreements (PPAs) with KPLC.
The Kenyan state has played a central role in liberalizing the electricity industry through reforms that increased competition and diversified participation. The Electric Power Act (1997) unbundled generation from transmission and distribution, opened generation to IPPs, and created an independent regulator. Nonetheless, the incumbent retained a monopoly on transmission and distribution.67 Subsequent reforms created specialized agencies such as KETRACO and REREC which reduced the concentration of power in KPLC.68
Sustained public investment and planning amplified gains from liberalized participation. Programs like the Last Mile Connectivity Project and REREC’s initiatives connected millions of rural households—driving rapid expansion in electricity access from approximately 5% in the 1990s to nearly 80% by 2023. 69 Here, the state acted as a market developer, expanding access faster than grid modernization alone would have allowed. Concurrently, Kenya’s commitment to renewable energy—anchored in V2030 and the Least Cost Power Development Plans (LCPDPs)—encouraged public and private investment in geothermal, wind, and solar power, substantially increasing renewable generation capacity. 70 This reflects the state’s role as a policy architect setting long-term industrial
roadmaps that shape investment incentives.
The state has also been receptive to continued reforms that foster economic competition. The 2021 Presidential Taskforce on PPAs reviewed existing contracts to curb high costs and improve governance—signaling a willingness to correct inefficiencies and maintain investor confidence. Liberalization reforms through the Energy Act (2019)71 and the Energy (Electricity Market, Bulk Supply and Open Access) Regulations (2024)72 also opened theoretical competition in the transmission and distribution segments.
Implementation of open access regulations remains in the early stages. Existing PPAs with KPLC complicate matters, as their fixed costs would need to be recovered even if rival suppliers enter the market.73 Stakeholders mentioned that opening competition too quickly could destabilize KPLC if industrial consumers switch to new suppliers, causing the financial collapse of the sole buyer and compromising the entire market.
These risks are compounded by the persistence of several market-foreclosure mechanisms: control over an essential facility (grid access, discriminatory or unclear access terms (absence of open-access pricing and wheeling charges for electricity transmission through a third-party interconnecting network), and regulatory delays that stall the implementation of pro-competition rules. Stakeholders stressed that the constraint is not the transmission monopoly itself, but the lack of
implemented open-access regulations, incomplete transition of KETRACO as the transmission system operator, and opaque or overlapping approval processes. These governance gaps reduce contestability and reinforce incumbent advantages. Thus, despite efforts to increase competition, SOEs remain the main players in each segment of Kenya’s electricity value chain.
While KENGEN remains the dominant actor in generation—supplying 59% of national electricity in 2024/25—IPPs supply approximately 35% of electricity and sell exclusively to KPLC under a single-buyer model.74 This structure could foster competition if procurement is transparent and competitive, but Kenya’s experience has departed sharply from this ideal.
This aligns with Gregory & Sovacool’s argument that the main constraints in Kenya’s electricity industry are institutional and financial risks embedded in how power projects are approved and financed. They highlight that governance-driven investment risks raise project costs and delay financial closure. Projects appear viable on paper but become unattractive once investors factor in opaque processes hindering market entry.75
Against this backdrop, concerns over PPAs with IPPs have triggered multiple state-mandated investigations over the past decade.76 Drawing on
their findings, we identify three key procurementrelated concerns.
1. Non-competitive procurement and regulatory gaps
Most Kenyan IPPs feature take-or-pay clauses, which require KPLC to pay for contracted capacity regardless of utilization—creating substantial fixedcost burdens when demand is low, and resulting in higher tariffs for IPPs compared to KENGEN plants. Moreover, Kenyan PPAs often lock in tariff rates for 20-25 years—compared to 10-15 in other jurisdictions—limiting KPLC’s ability to shift to cheaper technologies as they emerge.77
These terms reflect developers’ preference for long-term dollar-denominated contracts to secure returns and protect against exchange-rate volatility. They also reveal how the absence of competitive procurement—given most Kenyan PPAs originated from unsolicited proposals and subsequent bilateral negotiations—can undermine price discovery and weaken KPLC’s negotiating position.78 Moreover, key documents such as cost-comparison analyses could not be found for several PPAs,79 which raises questions about whether selected projects were the least-cost option for the power system.
The opacity of procurement processes appeared to emerge from an exploitation of regulatory gaps.80 There was no standardized procurement framework governing the evaluation of IPPs when PPAs were awarded. Ad hoc negotiations that emerged within this vacuum created space for arbitrary decision-making and rent-seeking behaviors, which may explain discrepancies in the favorability of tariff terms across PPAs. Such regulatory gaps extend beyond procurement. The 2024 report by the Departmental Committee on Energy (DCE) identified multiple IPPs that secured mid-contract amendments that raised tariffs or extended capacity charges, without public disclosure or clear justification.81
2. Potential conflicts of interest and opaque beneficial ownership
Opaque ownership structures and revolving doors between state institutions and IPPs compounded these risks. The DCE report identified potential conflicts of interest implicating former public officials and IPPs. This included a potential revolving door where an official whose division pushed for the implementation of a specific power station subsequently served as the director of the affiliated corporation.82 Independent reporting has reinforced these concerns. Africa Uncensored (2025) revealed overlaps between former parastatal staff and IPP directors83—suggesting insider relationships may have shaped contracting decisions and negotiations. This could reflect a form
of market foreclosure wherein non-competitive procurement and non-transparent negotiations drive preferential access to government contracts, resulting in the exclusion of more efficient entrants in favor of politically connected firms.
Conflicts of interest are further obscured by limited transparency in beneficial ownership, particularly for companies incorporated abroad. While the Business Registration Service (BRS) provided the DCE with a list of IPP shareholders, the majority listed foreign corporations, leaving the ultimate beneficial owners unknown.84
This opacity reflects a governance gap tied to weak de facto enforcement of de jure rules. As of 2017, the Companies Act (2015) requires all companies— including those registered in other jurisdictions—to disclose their beneficial owners to BRS. However, BRS has indicated that the framework remains only partially implemented.85 Similarly, while Section 27(1)(d) of the new Conflict of Interest Act (2025)86 explicitly prohibits former public officers from taking up employment with “a private entity with which... [they] had significant official dealings during the period of two years immediately preceding the termination of [their] service,” this was already in Section 27 of the Leadership and Integrity Act (2012).87
Full enforcement of both the Companies Act and the Conflict-of-Interest Act could mark a turning point for mitigating conflict of interest risks in the electricity industry. However, the feasibility of such reforms remains doubtful unless underlying institutional weaknesses and incentives that have impeded enforcement thus far are explicitly identified and addressed.
The 2021 Presidential Task Force on the Review of PPAs found that state institutions and parastatals were performing overlapping roles in the procurement and approval of PPAs.88 In several instances, the problem stemmed from institutional overreach. For example, the MoE had invited and evaluated bids for energy projects, only involving KPLC—the legally mandated contracting entity— after selection,89 limiting its ability to negotiate commercially sound terms or ensure alignment with system needs. Such overlaps weaken checks and balances and raise discretion risks. By creating multiple avenues for rent-seeking—including those outside official mandates—these patterns risked compromising transparency, cost-effectiveness, and accountability in PPA procurement.
During the development of this report, the Parliament of Kenya lifted a moratorium on signing new PPAs that had been in place since 2018.90 Notably, the DCE’s final recommendations91 reflected a more limited form of legislative involvement than initially proposed in 2024.92
Parliament is no longer recommended to approve PPAs but retains a broad ex-post oversight role— receiving semi-annual reports on all amendments, monitoring reform implementation, reviewing audit findings, approving land acquisition frameworks, and providing legislative accountability across the industry. This is a positive shift, as it reduces the risk of procurement becoming a politicized process.
The DCE’s conditions also assign a formal legalreview role to the Attorney General (AG), requiring them to:
• review and provide legal advice on all new PPAs prior to execution;
• review every amendment or variation to existing PPAs, regardless of size or materiality; and
• issue this legal advice within 30 days of document receipt—creating a binding procedural deadline.
Effectively, the AG becomes a gatekeeper for contractual legality, parallel to—but different from— the technical and financial due diligence roles of EPRA, the MoE, and the new IPP office proposed to oversee all future PPA procurements. The decision adds an additional layer, which increases the possibility that market entrants will face procedural delays given the volume of contracts and amendments expected in the coming years in a key industry for V2030.
While these changes aim to depoliticize the process by creating the new IPP office, they do not eliminate underlying governance risks in the industry. For example, our field work interviews revealed that while technical engagement with technocrats is straightforward, interactions with the legislators and political appointees are opaque and often politicized. Stakeholders noted that it is not uncommon for the regulator to receive calls from politicians seeking particular decisions, which undermines regulator independence and predictable competition rules.
The creation of the IPP office is not a silver bullet. In South Africa, Eskom’s politically motivated refusal to sign auction-winning PPAs between 2015 and 2017 stalled around USD 4 billion in investment and cost thousands of jobs.93 Kenya risks similar
delays by adding legal layers beyond technical merit.
Legislators’ proposal to cap wholesale power prices at USD 0.07 per unit as a condition to lift the moratorium would be an additional layer of political interference.94 Interviewees in our field work noted tariffs are a recurring point of political contestation that undermines predictability for investors. Thus, maintaining regulatory autonomy without parliamentary micromanagement is essential for credible tariff reviews and investment stability.
Uncertainty remains as the IPP office must translate de jure intentions to de facto results. Field interviews underscored that frequent fiscal, licensing, and policy shifts compound investor risk. As Kenya competes regionally for limited private capital, slow approvals may divert funds to peers like Tanzania or Uganda. Hence, Kenya’s evolving framework reveals a tension between accountability and autonomy. Expanding AG powers may strengthen scrutiny but risk duplicating regulatory roles and slowing decision-making.
The key is to strengthen and depoliticize regulators through structural reforms95. Kenya could empower an independent regulator—the IPP office—and make AG intervention temporary until the new office the role of technical decisionmaker. Kenya can learn from South Africa’s experience, which showed that renewable energy auctions only work when the procurement unit is insulated from political interference, and that the IPP office’s success is contingent staffing it with experienced technical professionals rather than political appointees.96
While the updated DCE recommendations removed the most problematic forms of parliamentary involvement, they do little to reduce the broader policy uncertainty that continues to constrain competition and downstream job creation. Kenya must follow its LCPDP, expand transmission, and limit political interference to avoid repeating crisisdriven, high-cost procurement.
The PPA moratorium was a defining symbol of Kenya’s policy uncertainty and failure to credibly commit to fostering competition. For seven years, investors lacked clarity about why it remained or what conditions would guide its removal. Even now, there is no transparent explanation for either decision. This opacity raises concerns about the risk of future reversals; a policy that can be imposed and lifted without clear criteria can also be reinstated under similar or other political pressures.
Stakeholders emphasized that such unpredictability undermines confidence in long-term planning, especially for capital-intensive generation projects
that depend on regulatory stability over decades. Thus, the moratorium signaled to the market that Kenya’s procurement framework is vulnerable to political dynamics rather than grounded in transparent and rule-based processes.
The moratorium foreclosed the market for new entrants, delayed projects, and constrained supply growth. These delays have jeopardized Kenya’s ability to meet the generation and renewable energy targets set under V2030 and successive LCPDPs, which assume a steady pipeline of competitively procured projects. The lost investment momentum also weakened job creation, industrial competitiveness, and the green-growth agenda. Lifting the moratorium is only a first step: Kenya must prevent the re-emergence of politically driven freezes and institutionalize a credible, transparent, and autonomous procurement process.
Field interviews indicated that uncertainty in the industry also stems from institutional complexity beyond national-level actors. Kenya’s 2010 Constitution devolved critical energy functions to counties. This has led to regulatory fragmentation: procedures for business licensing, taxation, and land acquisition differ widely across counties, raising transaction costs for developers operating in multiple jurisdictions. This weakens coherent policy architecture and lowers incentives for entry. Volkert and Klagge (2022) also highlight how lags in the development of critical roadmaps such as county-level energy plans, coupled with limited institutional capacity and expertise could stymie the development of projects in the electricity industry.97
5.1.7 Structural constraints: operational inefficiencies and market distortions
Persistent inefficiencies in Kenya’s electricity network including high system losses, unreliable service, and deferred maintenance, illustrate how technical weaknesses translate into market distortions. 24.2% of the energy purchased by KPLC was lost in transmission and distribution during the first half of the 2024/2025 financial year, exceeding the regulatory threshold by 6.7 percentage points.98 These losses—driven by aging lines, overloaded transformers, and unmetered connections—undermine the utility’s financial viability and inflate end-user tariffs. Reliability indicators have also deteriorated; on average, customers experience 9.15 hours of outages and 3.57 service interruptions per month.99 Such underinvestment in maintenance and modernization imposes costs on consumers and reduces Kenya’s industrial competitiveness by increasing input costs and production risks. This results in a marketdeveloper failure embedding inefficiency in tariffs.
The Kenya National Energy Compact (2025–2030) recognizes these operational failures as part of a
wider governance challenge. Its targets to reduce transmission and distribution losses by 2030 reflect an understanding that network degradation constrains both reliability and competition.100 Aging assets and deferred maintenance limit the grid’s capacity to accommodate new IPPs and increase the likelihood of curtailment and higher marginal costs of supply. These structural weaknesses create implicit barriers to entry, since new producers face higher connection costs and uncertain evacuation reliability. They also distort tariff structures by embedding inefficiencies into pricing rather than addressing them through network reform. In this way, the condition and management of the grid reinforce KPLC’s dominance and restrict the emergence of a more efficient and diversified electricity industry.
In the short-term:
1. Clarify and streamline institutional mandates across the industry
Clearly define what each institution does, including the MoE, KPLC, EPRA, KETRACO, the IPP office. Eliminating overlapping responsibilities will reduce confusion, limit political interference, and improve transparency across the industry.
2. Prioritize critical grid upgrades
Complement governance-related reforms by upgrading outdated grid infrastructure to ensure end-consumers benefit from increased electricity generation.
• Leverage Independent Transmission Projects where possible to ease financing constraints KETRACO would face if required to shoulder the entire cost.
In the medium-term:
3. Finalize full transmission unbundling
Complete the transfer of all transmission system operations and planning responsibilities from KPLC to KETRACO, to eliminate lingering vertical integration and strengthen competitive procurement.
4. Empower an Independent IPP Office as the central procurement authority
Grant the IPP office statutory authority to make final decisions on PPA procurement, evaluation, and amendment.
• The current requirement for AG approval can operate as a transitional safeguard. Once the IPP Office is fully established with
strong technical capacity, AG sign-off should be phased out to prevent unnecessary political or administrative bottlenecks.
5. Professionalize recruitment and leadership selection in the IPP Office
Establish clear minimum educational and technical qualifications for all professional staff, and require open, competitive recruitment for director-level positions.
• The Head of the IPP Office should serve a single, non-renewable five-year term, with the start date set to avoid alignment with presidential and parliamentary election cycles. This reduces incentive compatibility with political actors and preserves the independence of procurement decisions.
• CVs of all professional staff should be published on the office’s webpage for public transparency.
6. Implement the common framework for PPA procurement (Renewable Energy Auction Policy)
Accelerate adoption of a unified, competitive auction framework for new renewable PPAs— including dedicated rounds for technologies such as battery energy storage systems and hybrid renewable-storage solutions.
• Standardized documentation, transparent evaluation criteria, fixed procurement timelines, and finalized contract terms should be published publicly for transparency.
• In line with the DCE recommendation, PPAs should be limited to entities that have fully disclosed beneficial ownership in compliance with the Companies Act.
7. Strengthen national demand forecasting
• Modernize demand forecasting models to align procurement with realistic future load growth.
• Require that all future procurement decisions be tied to updated LCPDP forecasts.
5.2.1
M-Pesa is Kenya’s preeminent mobile money platform. It was launched in March 2007 by Safaricom, Kenya’s largest mobile network operator and a parastatal enterprise.101 M-Pesa has experienced explosive growth: by 2012 it had 20 million customers, meaning one third of global mobile money users were Kenyan.102 Today M-Pesa boasts over 87 million customers and over USD 314 billion in transactions annually;103 it remains the dominant player in Kenya’s mobile money market (Figure 13).
M-Pesa’s backbone is its network of agents— businesses ranging from small shops to large commercial banks that allow customers to convert cash to e-money and vice versa. The ubiquity of these service points enabled mobile money’s explosive growth by providing customers with secure storage and reliable access to their funds. As of 2025, M-Pesa has over 456,000 agents, and as early as 2019 over 86% of Kenyans lived within 5 km of an agent. In the 12 years following M-Pesa’s launch, the share of Kenyan adults participating in formal financial services increased from 27% to 83%, and preference for informal instead of formal finance fell from 32% to 6%.104
While M-Pesa started as a money transfer service that was largely detached from the formal banking sector, Safaricom products have become an important part of Kenya’s broader digital finance ecosystem (Figure 14). In 2012, Safaricom partnered with the Commercial Bank of Africa (CBA) to launch M-Shwari, which allowed M-Pesa users to access savings accounts and short-term loans from the bank.105 Other M-Pesa services include Lipa Na M-Pesa, a merchant payment service that holds funds in partner banks, and provides direct microloans to users by allowing for overdrafts in both personal and business accounts.106 These financial services were previously dominated by traditional banks or generally undersupplied.
Digital lending outside of banking and mobile money has also increased. As of 2024 the Central Bank of Kenya (CBK) had licensed 85 Digital Credit Providers.107 Two of the most popular non-bank providers are apps—Tala and Branch—that provide
small digital loans that are distributed through M-Pesa wallets. These app-based lenders compete directly with loans from Safaricom products like M-Shwari and only constitute about 10% of the digital loan market.108
5.2.2 Government regulation and its impact on market structure
The CBK Act (2004) established CBK oversight of financial infrastructure to promote financial stability. However, when mobile money gained popularity it was unclear how the mandate applied to this new market.109 The power to regulate mobile money operators was later formally vested in the CBK under the National Payment System (NPS) Act (2011)110 and operationalized under the NPS Regulations (2014). This established an application process for the authorization of payment service providers (PSPs), and mandated that PSPs submit to oversight and record-keeping requirements. PSPs must also make their systems capable of interoperability with other payment networks. The CBK Amendment Act (2021) extended the CBK’s authority over digital credit providers, allowing the CBK to license and oversee a previously unregulated group—digital lenders that were not deposit-holding institutions,.
The NPS regulations played a critical role in precipitating interoperability in mobile money. In early 2018 Safaricom, Airtel, and Telkom— the owners of the three largest mobile money providers in Kenya—rolled out person-to-person interoperability, which allowed users of one service to directly transfer funds to users of another without requiring cumbersome intermediate steps.111 Merchant and bill pay interoperability were launched in 2022, which allowed end users to make payments to vendors and other service providers like schools and utilities, regardless of which payment provider they use.112 Airtel has gained market share due in part to lower transaction prices, agent growth, and increased interoperability, which erodes the network effects that helped M-Pesa to maintain dominance (Figure 13).113 In 2025 Safaricom also announced a major upgrade to its platform infrastructure called Fintech 2.0, a cloud-native platform that will enhance transaction capacity, network resilience, and customer
Note: Market share is based on share of mobile money subscriptions; data is at the quarterly level - months displayed are the last month of the relevant quarter
Source: Kenyan Wall Street114 and Communications Authority of Kenya159
security.114 Safaricom is expected to spend USD 309 million on this upgraded platform to improve its product amid rising competition from Airtel.115
The NPS regulations also increased consumer protection by mandating that customer funds be stored in a trust with an established bank and isolated from the payment providers’ own funds.116 Regulations like this are the reason that M-Pesa— though still owned and operated by Safaricom— maintains customer funds completely separately. Airtel on the other hand, responded to CBK regulations by fully separating Airtel Money (now owned by Airtel Money Kenya) from Airtel Networks Kenya, though both remain subsidiaries of Airtel Africa (Figure 14).
While the CBK is the primary regulator of mobile money providers, the Competition Authority of Kenya (CAK), which has a mandate to promote and protect competitive markets, is also involved.117 In addition to regulating digital finance, the CAK has regulated the telecom companies that own mobile money platforms, including barring them from charging higher prices to competitors that use their digital infrastructure.118 The Communications Authority of Kenya (CA) also has purview over the telecommunications companies that provide mobile money services.119
In 2022, the CBK released the National Payments Strategy which outlined objectives for Kenya’s payment schemes through 2025. These objectives include increasing financial inclusion, enhancing payment security, encouraging innovation through
industry collaboration, and creating a more robust regulatory framework.120
The digital finance industry is an upstream enabler of job growth in Kenya. Although the industry generates some jobs directly, its greater potential lies in its indirect effect on productivity and livelihoods by transforming how individuals and small businesses access capital and manage day-today transactions.
5.2.3.A Poverty reduction and financial inclusion
Research shows that access to M-Pesa increased per capita consumption levels and lifted 2% of Kenyan households out of poverty. This effect was driven by increased financial resilience and saving and changes in occupational choice (e.g., from agriculture to business), allowing a more efficient allocation of labor.121 By connecting previously unbanked Kenyans to formal financial flows, digital finance unlocked tools for saving securely and building a credit profile to access loans and other services.
5.2.3.B
In 2024, Kenyans moved KES 21 billion (USD 162.5 million) every day via mobile money.122 With digital transfers, this high volume of transactions can occur instantaneously, saving time that might otherwise be spent on cash-based transactions. Moreover, the integration of M-Pesa with the national tax system has made it easier for small, informal enterprises to meet their tax obligations by eliminating the burden of having to go in-person to the Kenya Revenue Authority office and interact with tax agents who could extract bribes or other rents.123 In this way, mobile money facilitates expansion of the tax base and encourages formalization of small businesses.
5.2.3.C
The ubiquity of mobile money in Kenya has attracted an array of fintech start-ups, including those that offer financing services for small-scale entrepreneurship. Pay-as-you-go smartphone financing pioneered by fintechs like M-KOPA and Watu Kenya, enables customers to access connectivity and digital tools at an affordable price, with direct effects on livelihood opportunities and income generation. M-KOPA’s typical customer— anecdotally—is an entrepreneur who finances a smartphone and builds a credit record that enables her to access insurance and digital cash loans. With greater access to credit, she can expand her business and employ another young woman full-time.124 By removing financial barriers, digital services help channel entrepreneurship toward
productive economic activities and job creation.
In Kenya, increased access to mobile money service points is associated with an increase in local economic performance.125 Research has also shown that economic growth is expanded when labor can shift from low-productivity to high-productivity activities.126 This shift requires an expansion of productive enterprises and a flexible workforce that is able and willing to adapt to growing industries. Given the potential for digital finance to enhance firm productivity, and Kenya’s young and industrious work force, the country is well positioned to leverage its robust digital finance infrastructure to promote jobs and growth. However, to fully take advantage of this potential, the government must continue updating not only its de jure regulations but also their de facto enforcement to match market evolution and reevaluate inefficient governance arrangements.
5.2.4
The Kenyan government’s hands-off approach to regulation in the early days of digital finance enabled M-Pesa’s rapid growth and innovation on the back of a first mover advantage.127 For example, the NPS Act (2011) was not fully operational until 2014, seven years after Safaricom was allowed to launch its services. The Act’s mandate for platform interoperability did not come into effect until April 2018.128 Efforts to lower mobile termination rates
or allow number portability—crucial measures to reduce the anti-competitive effects of first mover advantages—were also subject to delays. These delays allowed Safaricom to establish dominance in mobile telephony, which in turn reinforced its dominance in mobile money. Efforts to declare Safaricom dominant in the sense of competition law, so that competition-enhancing obligations could be imposed on it, were not successful. The resulting market dominance of Safaricom and M-Pesa in the mobile money and digital lending space has reinforced governance arrangements that restrict entry to the industry and prevent consumers and businesses from fully realizing the benefits of digital payments for productivity and job growth.
The rapid growth of Kenya’s digital industries posed a challenge for regulators, who could not rely on traditional measures of competition and consumer welfare for market evaluations.129 Digital services function in multi-sided markets, with firms acting as platforms that sell different products to different groups of consumers—illustrated by the web of connections between commercial banks, mobile money platforms and users, telecom companies, and fintechs that rely on mobile money “rails” to provide their services.130 This presents an inherent challenge to measuring market power and promoting competition in the digital economy, which in Kenya’s case was exacerbated by the rise of a dominant market player and its interactions
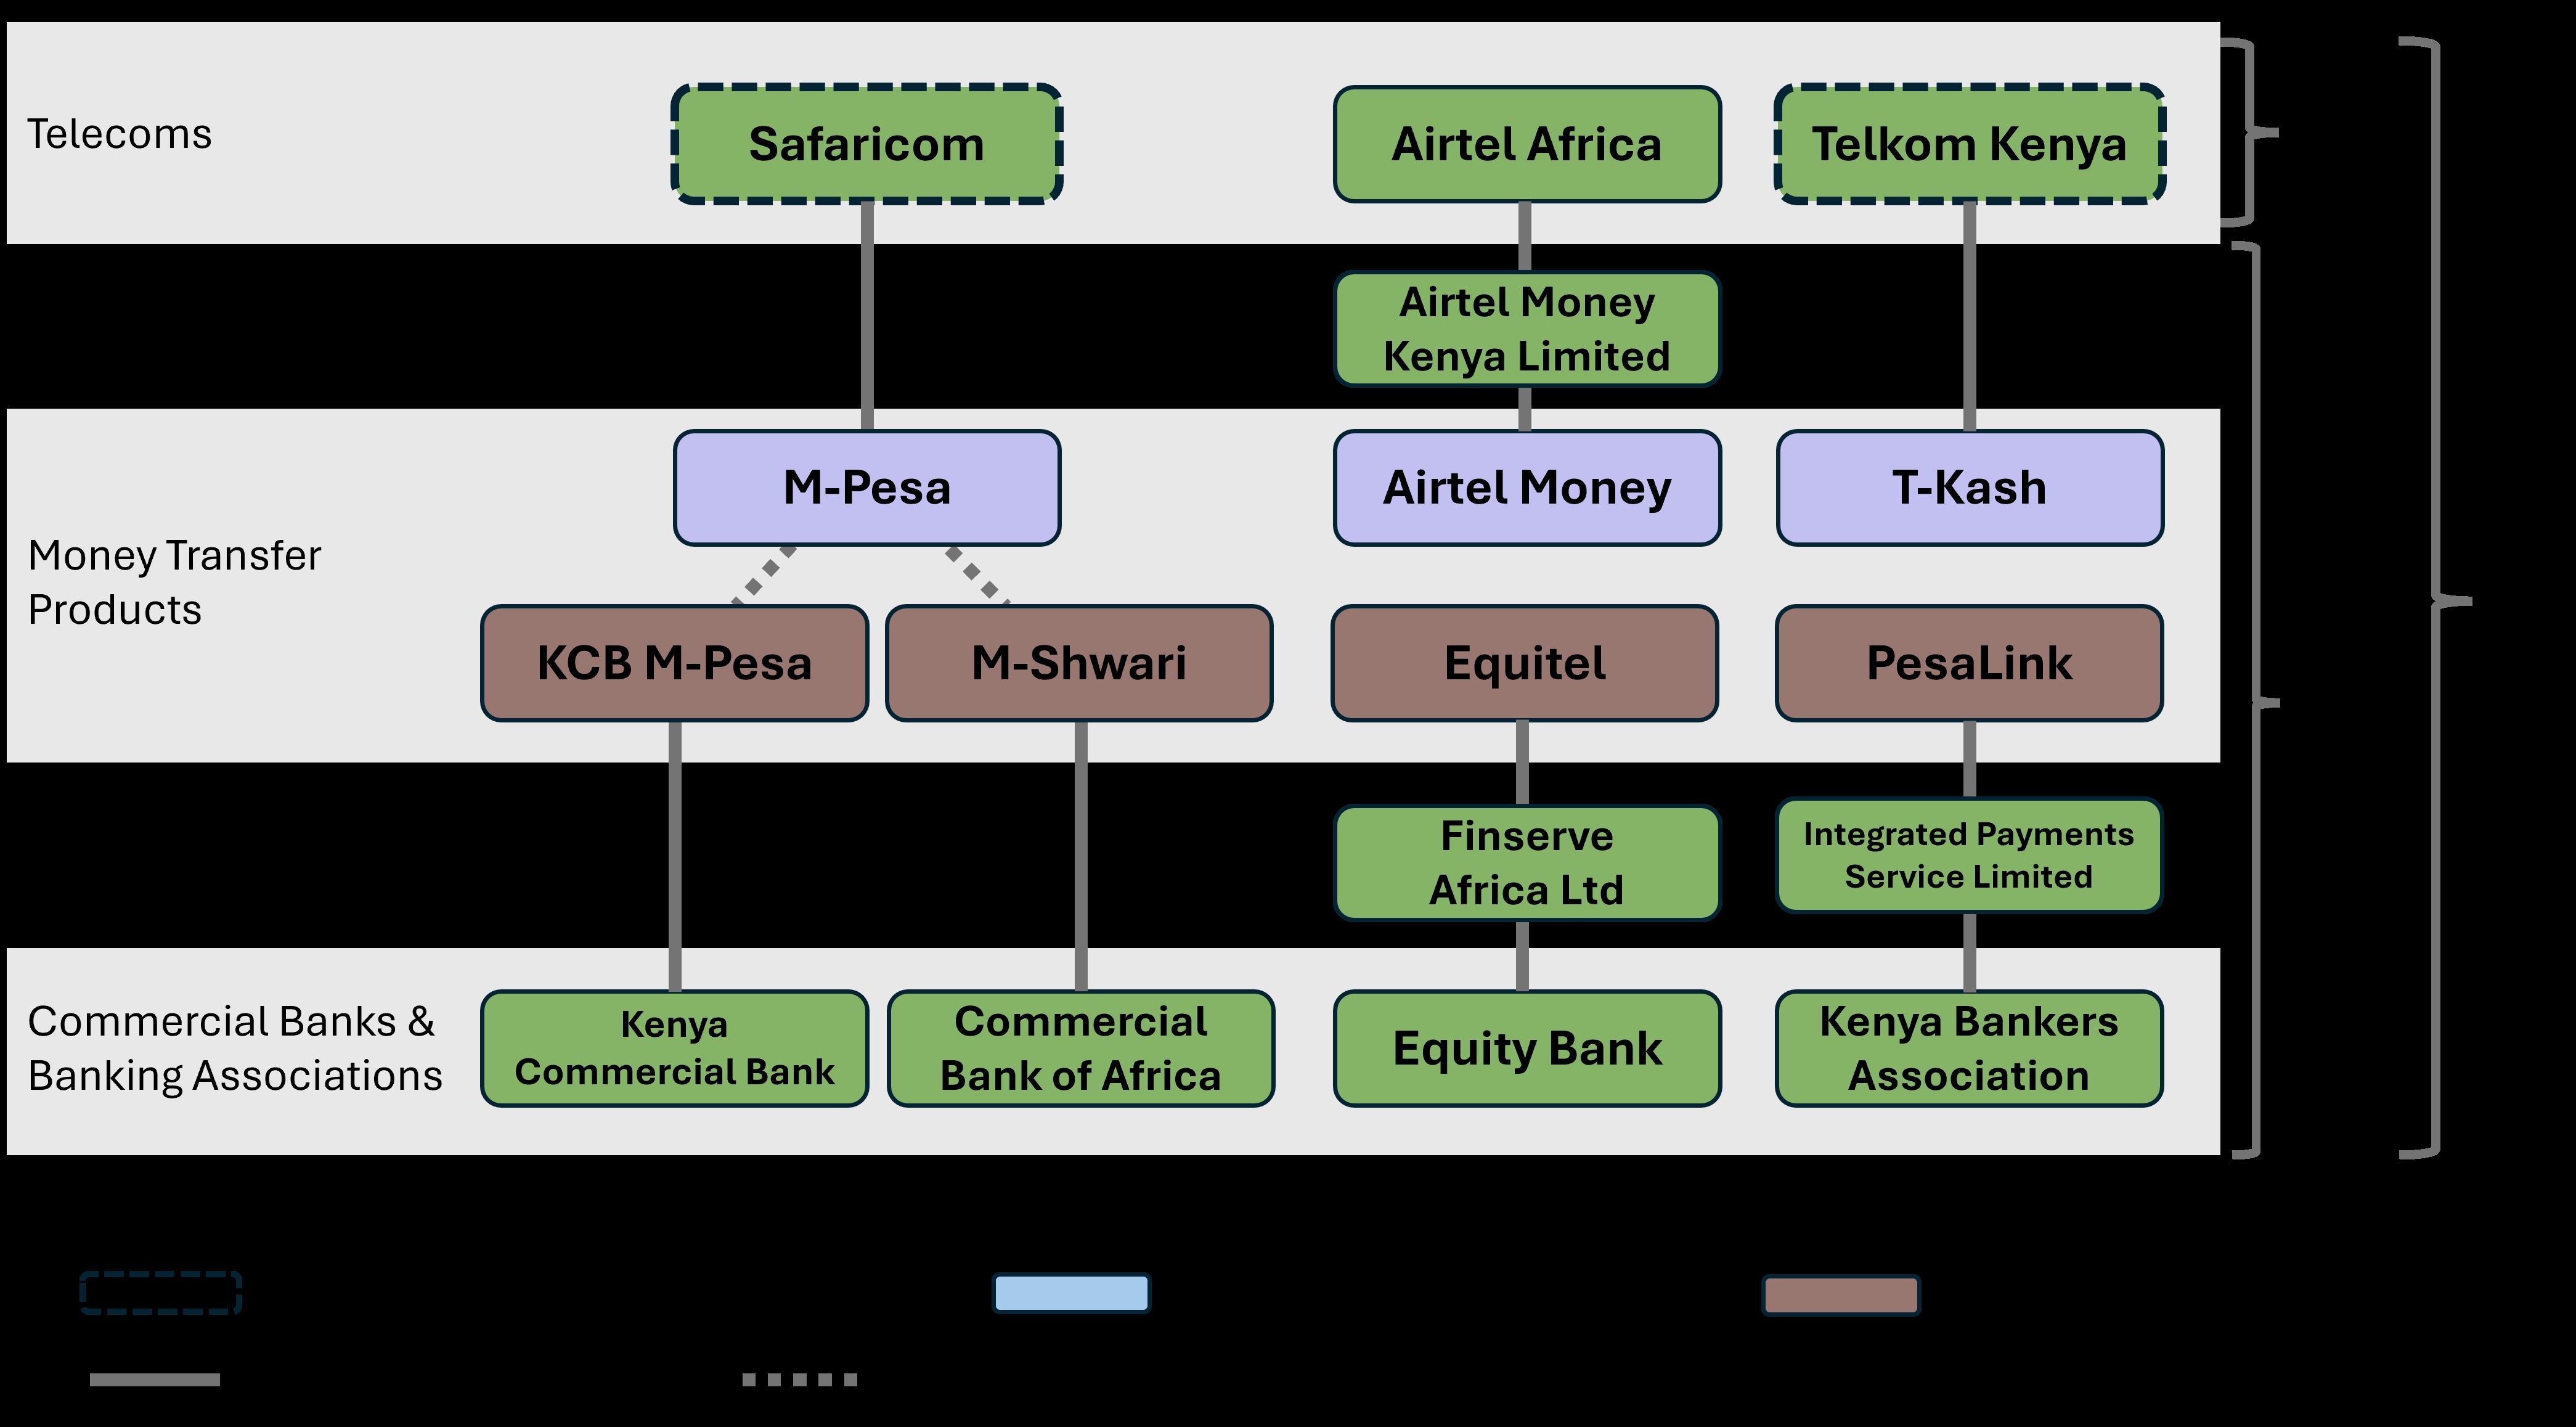
with the state. In the absence of regulation, markets like mobile money naturally tend towards monopoly due to network effects and the large digital infrastructure investments required.131
The overlapping authority of the CA, CBK, and CAK over the digital finance industry slowed the response to new innovations and opened the door to regulatory arbitrage. In 2007, the CBK issued a letter of no objection allowing Safaricom to launch M-Pesa under CAK supervision while a regulatory framework for payment service providers was developed.132 Since then, the CBK has exercised increased oversight of payment services and digital lenders,133 but coordination challenges remain. For example, the CAK deferred to the CBK and CA on mobile money interoperability rather than enforcing it directly—delaying implementation.
Some researchers and Kenyan stakeholders attribute the slow introduction of regulation and limited enforcement by the CAK, to Safaricom’s political influence and use of state networks to resist competition.134 Safaricom’s political importance is undeniable. As of November 2025, it was the government’s largest taxpayer and accounted for nearly 5% of national GDP—not to mention the dividends paid out from the government’s share in the company.135 Kenyan stakeholders affirmed that Safaricom’s political insider status has cemented its dominance. The perception of a closed regulatory space—that Safaricom is “too big to be challenged” under the current system—disincentivizes the entry of new players that could spur greater innovation and drive down prices for mobile money users.
On one hand, M-Pesa’s market dominance enabled Kenya to lead the region in financial inclusion— empowering more Kenyans than ever before to access credit and payment services and creating a sense of community through its agent networks. There is a level of trust in Safaricom products that new entrants struggle to match, especially when marred by reports of predatory lending practices.136
On the other hand, the extent of market concentration in digital financial services has come with welfare and efficiency costs. Since non-bank financial service providers (i.e., fintechs) do not participate in the mobile payments system, their customers must rely on banks or mobile money providers to settle payments.137 This creates an ecosystem that is heavily reliant on M-Pesa for a wide range of economic activities. This overreliance on a single provider also enables excessive pricing on transactions and has delayed achieving full interoperability. Addressing these concerns could enable Kenya to fully unlock the benefits of digital services for livelihoods and job creation.
Excessive pricing of mobile money transfers is a key challenge for Kenya’s digital finance industry. The average cost of a peer-to-peer transfer is KES 23 and can reach up to 6.9% of the transfer value.138 High transaction costs are prohibitive for low-income users, especially when switching across platforms or accessing cash-out services.139 Industry stakeholders affirmed that Kenya’s fees are high relative to other countries in sub-Saharan Africa, such as Nigeria, and that all players would be better off with lower prices. The CBK has also acknowledged this concern, warning that mobile money adoption has begun to level off and that growth in new users is hampered by high fees.140
Evidence from Ghana suggests that competition among mobile money agents can reduce the costs associated with mobile money accounts. A field experiment found that fees decreased after new vendors entered local markets with low competition at baseline.141 In Kenya, however, new market players have been unable to gain footing despite launching their own digital payment products at cheaper price points.
Before interoperability was enforced, Safaricom’s high charges for transfers to other networks disincentivized customers from switching to a new provider. Today, customers are unable to migrate their payment history from one provider to another, incentivizing them to remain with incumbent providers even when cheaper options exist.142 Thus, market concentration has a self-reinforcing effect, both creating the conditions for the dominant firm to set excessive prices and foreclosing the entry of new firms who could offer the same services at a cheaper price.
The CAK has acted before to increase price transparency and fairness. A 2017 ruling required all mobile money providers to disclose customer fees for unstructured supplementary service data (USSD) based transactions—a payment mechanism that functions without internet access.143 Safaricom then signed an agreement with the CAK to cut its USSD rates in response to concerns over high pricing.
Pricing issues are also present in the mobile investment space. The CAK is currently reviewing a complaint alleging that Safaricom is giving preferential treatment to its new money market product, Ziidi. While Ziidi receives free access to M-Pesa infrastructure for deposits and withdrawals, rival funds are subject to transaction costs that get passed on to customers.144 This highlights the way vertically aligned products gain an edge in the digital finance market, impeding newer entrants.
2. Incomplete interoperability
As with pricing, incomplete interoperability is both a cause and consequence of market dominance. For example, following the launch of M-Pesa, Safaricom signed exclusivity contracts with 80,000 agents, forcing competitors to build their own parallel agent networks. Following complaints by competitors, the CAK banned agent exclusivity in 2014. Safaricom strongly resisted this move, in part on the grounds that its agent network was a sign of its innovation and business success, not an anticompetitive practice.145 This illustrates the trade-offs that can arise between market dominance, innovation, and consumer welfare.
Kenya has yet to implement full agent interoperability, which would allow agents to maintain a single float for customers on different networks rather than maintain separate accounts for each payment service provider.146 This fragmented agent model creates inefficiencies in digital payment access. In rural areas, fewer agents serving a limited number of providers leads to poor service coverage and reliability.147
High concentration in Kenya’s digital finance industry is self-reinforcing and impedes dynamic entry of new providers. Fragmentation and political capture in early stages of the regulatory process have allowed Safaricom to largely dictate who participates in the market as a mobile money competitor, digital lending partner, or user of the rails. Greater customer choice, access, and affordability of mobile money would unlock livelihood opportunities for underserved parts of the economy, including the agriculture sector, small businesses, and informal enterprises.148
5.2.5 Policy opportunities
Increased competition in upstream digital finance markets can generate economy-wide benefits for Kenya by reducing costs for both consumers and businesses that rely on digital payment services. Building on progress that is already underway, the following reforms would optimize the governance environment to support productive entrepreneurship and job creation.
1. Strengthen regulatory coordination
To address regulatory overlap we recommend formalizing inter-agency communication in the digital finance industry, by either creating a new inter-agency digital finance oversight body, or expanding Kenya’s Joint Financial Sector Regulators Forum (JFSRF) to include the CA and the Office of the Data Protection Commissioner (ODPC). The JFSRF is mandated to develop a “robust regulatory framework” through information sharing and coordination across agencies involved in the
Figure 15. M-Pesa transfer charges (on net) for the values equivalent to USD amounts
US$ 5 (KSh 101-500)
US$ 15 (KSh 1001-1500
US$ 25 (KSh 1501-2500)
Source: Paelo and Roberts, 2025160
financial sector. The Forum already includes the CBK, the CAK, and other authorities involved in regulating various digital financial products. Folding in the CA and the ODPC would allow for easier coordination across agencies that already monitor digital finance.
New digital finance providers often face an extensive and confusing permitting process, so we recommend the JFSRF focus on streamlining regulatory requirements and creating clear steps for the certification of new providers.149
2. Cap peer-to-peer mobile money fees
Mobile money fee caps would boost market competitiveness and reduce costs for downstream digital financial service users. The CBK should fully implement its proposal to reduce the average peer-to-peer transaction fee by 57% by 2028 to make digital finance more accessible to all Kenyans and spur uptake of services beyond basic money transfers. Lower fees would restrict Safaricom’s revenue, but would also push the company to innovate and grow into new business areas such as lending and savings.150 Reigning in Safaricom’s pricing advantage would help competitors gain ground in the market. Evidence suggests that a fee cap would also accelerate financial inclusion by making mobile money services more affordable: when the CBK introduced a mobile money fee
waiver during the COVID-19 pandemic, transaction volumes increased by 87%.151
3. Mandate full interoperability
Implementing full interoperability across mobile money platforms, banks, and fintechs will eliminate operational redundancies and lower the cost to consumers and businesses of switching and transacting between platforms. The CBK should designate a National Payments Switch to facilitate all domestic digital payments, similar to India’s UPI model and Brazil’s PIX. A centralized net settlement system can significantly lower interoperability costs and streamline the payment process by eliminating the need for reconciliation between mobile money providers prior to final settlement.152
Kenya could also take a cue from Nigeria’s “super-agent” model wherein third parties are authorized the Central Bank to manage and monitor agent networks on behalf of multiple financial institutions.153 Establishing shared services and shifting agent recruitment away from providers, ensures full agent interoperability and lowers barriers to entry for new firms.Deepening interoperability may also have indirect price effects as competition increases, allowing mobile money transaction fee caps to be phased out over time. The removal of agent exclusivity in 2014, coupled with the anticipated (and actual) entry of Equitel in 2015, corresponded to a steep reduction in price for low-value M-Pesa transfers (Figure 15). To the extent they remove barriers to entry and reduce transaction costs, digital finance industry reforms may have a positive reinforcing effect.
4. Support robust rollout of open finance
Open finance refers to a reliable and secure mechanism for financial service providers to share a user’s financial data with other institutions upon customer request. Since access to financial services like credit lines is often based on financial history, open finance makes it easier for users to switch between or utilize products from multiple financial service providers, while promoting innovation and competition.154 The CBK’s ongoing rollout of an open banking framework lays the foundation for a more robust open finance system.155 Increased financial dynamism can both increase jobs in the financial sector and drive down costs for young businesses across the economy.
5. Push for full structural separation of M-Pesa
The Kenyan government has publicly advocated for breaking up Safaricom. A Treasury proposal would make M-Pesa an independent financial services company under the CBK’s direct supervision, strengthening regulatory oversight and consumer protection. As a true digital financial rails company,
M-Pesa could price independently, partner more widely, and innovate without the restraints of a bundled telecom structure.156 Kenyan stakeholders affirmed that the structural separation of M-Pesa would reduce Safaricom’s gatekeeping power over the fintech industry and facilitate the implementation of other competition-enhancing reforms.
Calls for separating M-Pesa are not new, but reform efforts have consistently stalled due to resistance from Safaricom and lack of political will to overcome it. Safaricom would likely suffer revenue losses and a large tax liability, which could dampen its role in expanding digital finance throughout the region—though it could also incentivize it and competitors to introduce more innovative products.157 Moreover, a standalone M-Pesa could compete with commercial banks instead of relying on them to deliver its loan products. Current partner banks get most of their digital loan revenue from M-Pesa linked projects.158 Despite these difficulties, the CBK and Treasury should continue to advocate for a transparent, phased restructuring and incorporation of M-Pesa under proper financial institution governance by the CBK.
Coffee has played a defining role in the crafting of Kenya’s global image. Its prominence, however, is not matched by its productivity. While coffee remains one of Kenya’s leading exports— constituting around 4% of its export volume in dollars161—the 2023-24 crop was equivalent to just 40% of production in 1988 (Figure 16).162 In recent years, the Kenyan government has taken major steps to reform the industry and reshape the roles of its key participants, with the stated aim of reversing this trend.
Coffee was introduced as a commercial crop to Kenya by British authorities, who identified it as a major source of export revenue. Until 1933, there were severe legal restrictions on coffee cultivation outside settler-owned plantations. Even after restrictions were relaxed, colonial policies maintained Europeans’ dominance through marketing boards and centralized cooperative structures.163 Many of the institutions that govern the industry today—including producer cooperatives, the Coffee Board of Kenya, and the Kenya Planters’ Cooperative Union (KPCU)— originated in this period and reflected a top-down, state-led model designed to serve settler export interests.
After independence, land reforms under President Jomo Kenyatta enabled African farmers to enter coffee production, accelerating the rise of smallholders.164 However, the transition retained many features of the colonial system. Coffee production increased through the 1980s, but the industry was devastated when International Coffee Agreement—which set quotas for coffee producing countries to maintain coffee prices—collapsed in 1989.165 As global coffee prices dropped, 166 production in Kenya began a precipitous decline that has yet to be fully reversed.167
The 1990s saw a push toward liberalization of the Kenyan coffee industry, encouraged by the World Bank and IMF. In 1993, the government withdrew its control of the Coffee Board of Kenya,168 relaxed its control over farmer cooperatives, and licensed private millers—breaking the KPCU’s monopoly on milling. The Coffee Act (2001) limited the Coffee
Board of Kenya’s power to regulatory oversight and created the system of marketing agents and brokers. In 2013, the Coffee Board of Kenya was officially merged into the Agriculture and Food Authority.169
Over the past decade, the government has pursued a new direction for reforms. The government under President Uhuru Kenyatta established the New Kenyan Planters’ Cooperative Union (NKPCU) in 2019 after its predecessor was liquidated due to mounting debt and governance issues.170 The NKPCU was founded to administer the Coffee Cherry Advance Revolving Fund, which provides advance payments to “members of a registered cooperative society or a smallholder estate affiliated to NKPCU.”171 It also owns mills throughout the country and provides marketing services to farmers and collectives.
Most Kenyan coffee growers are small shareholder farms that must join cooperative societies to access economies of scale in primary and secondary coffee processing and sell in final markets. By contrast, larger farms (i.e., estates) typically control more of the value chain. After harvesting and wet milling, coffee cherries are sent to dry mills for secondary processing. To sell their processed coffee beans, growers or cooperatives must either have a marketing license or contract a marketing agent/ broker. Marketers/brokers facilitate sales through the Nairobi Coffee Exchange (NCE)—the centralized auction system that handles the majority of Kenya’s coffee trades—or through direct agreements with buyers, which are less common. Regardless of the channel, buyers must have a dealer license. While buyers can vary from multinational corporations (MNCs) to individual specialty coffee brands, they are overwhelmingly foreign due to Kenya’s low domestic coffee consumption.
Competition and productivity issues have long plagued the industry. At the farmer level, growers maintain ownership of their produce until it is sold to a final buyer, meaning they bear all the risk if their coffee is damaged or pilfered at any point in the value chain. The opacity of upstream and downstream relationships makes it difficult
Kenya's Coffee Production 1962-2023
Source: Agriculture and Food Authority Coffee Year Books
for farmers to mitigate this risk. Cooperatives typically enjoy geographic monopolies due to the transaction costs of travel; this, combined with poor information-sharing, can limit farmers’ ability to select into high-performing cooperatives. Governance issues, including corruption allegations, also undermine cooperatives’ effectiveness. For example, in the lead up to the reforms, there were reports of marketing agents bribing cooperative leaders in exchange for discounted coffee to sell to their associated buyers.172 Mandates requiring farmers to sell through licensed marketers (rather than directly themselves) created a complex intermediary system that further eroded farmers’ share of value-add—reducing farmers’ earnings and contributing to the steady decline in area under coffee cultivation.
173
In 2023, the Government initiated reforms purportedly aimed at reversing the long-term decline of the coffee industry by increasing national productivity,174 improving farmers’ earnings, and raising the industry’s contribution to Kenya’s economy.175 While the 2023 Coffee Bill is still pending Senate approval,176 several core provisions are already being implemented, effectively reshaping the industry. Three reforms are particularly consequential:
• Dismantling of the vertical integration structure across the coffee value chain. The government began enforcing the 2019 “single-license” requirement, prohibiting firms from operating across multiple segments of the value chain (e.g., milling, marketing, and buying).177 This led to the revocation of licenses held by vertically integrated firms. Political leaders justified the policy by describing the market as dominated by ‘cartels’ and promising higher incomes for farmers.178 Put simply,
the policy aims to increase contestability in milling and marketing. The exception to this rule appears to be the NKPCU, which—as a state-owned entity—is allowed to serve multiple roles in the industry.
• Introduction of the Direct Settlement System (DSS). The DSS changes how farmers are paid by routing auction and direct-sale proceeds directly into farmers’ bank accounts or mobile wallets. By bypassing cooperatives, marketing agents, and brokers, the system aims to eliminate long payment delays, reduce leakages, and improve farmers’ liquidity. Faster and more predictable payments are intended to reduce reliance on high-interest seasonal loans and strengthen incentives to remain in coffee production.179
• Modernization of the NCE. Reforms to the NCE focus on digitizing auctions, improving traceability, and standardizing reporting requirements for brokers. These changes aim to strengthen price discovery, increase transparency, and improve market efficiency while supporting compliance with evolving international sustainability and due-diligence standards.180
Together, these reforms illustrate how government actions—through market design, regulation, and enforcement—can, in principle, reshape competitive conditions along a value chain. Their effectiveness ultimately depends not on institutional design alone, but on whether these policy and governance changes translate into de facto stronger competition, higher productivity, and sustained welfare gains.
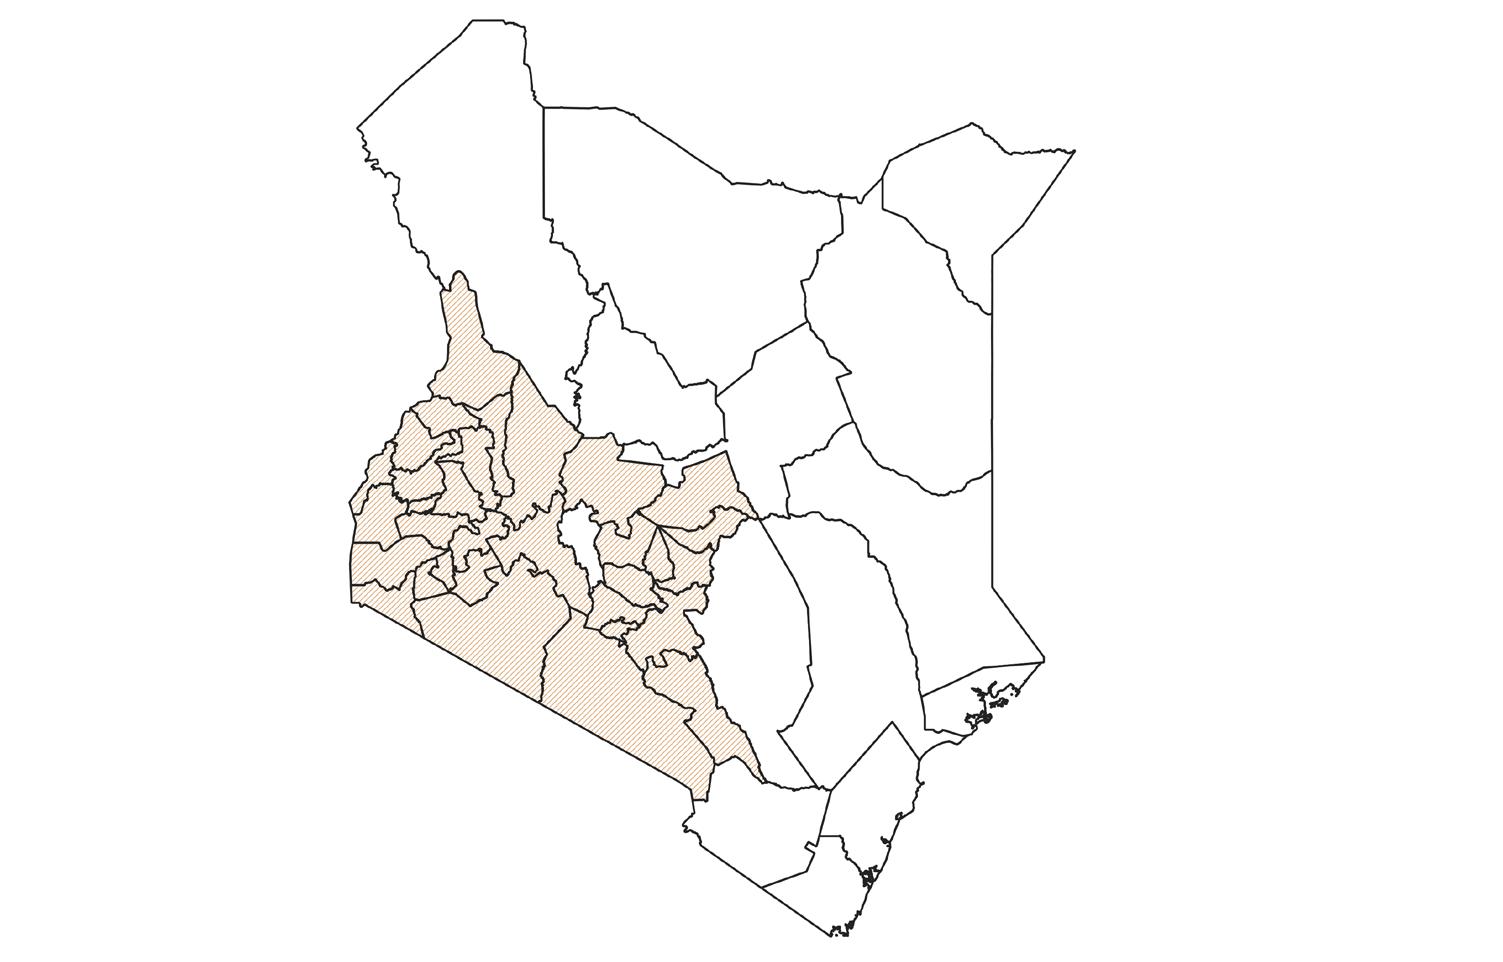
Source: Agriculture and Food Authority Coffee Year Books
Source: Authors’ creation, adapted from Kinyua, 2025
5.3.4
In practice, the key immediate impact of the reforms came from the enforcement of the single license requirement. MNCs, which had previously operated across the secondary processing, marketing, and buying segments, had to relinquish their (or their subsidiaries’) miller and market licenses to maintain their primary role of purchasing and exporting coffee. This drastically changed segments’ dominant players (Table 2). Previously, MNC affiliates accounted for the top three firms in milling and marketing, capturing around 60% of each segment’s market. Post-reform, these firms exited both markets. All other private millers also had their licenses revoked and were required to re-apply, exacerbating upheaval in the market. The NKPCU was the only remaining miller with significant processing capacity, and rose to a 22% market share from less than 3% in 2021/22. It was only surpassed by one firm—a new entrant— Alliance Berries Limited, whose CEO had previously advised on the coffee reforms, creating concerns around conflicts of interest.181 Overall, these market shares suggest the reforms changed which firms control each market, but not the issue of market control itself (see Figure 20 in Appendix for further market concentration data). This may be why the Government continues to discuss “cartels” in the industry, even after the exit of MNCs.182
Another key aim of the reforms was boosting farmers’ earnings. While only one season’s worth of post-reform data is currently available, so far, reforms do not appear to have boosted farmers’ profits (Figure 19). The prices farmers receive
for their cherries have increased alongside global coffee prices, but these increases appear to have disproportionately benefited larger higherproductivity growers. Lower-productivity small shareholders, who produce the bulk of Kenya’s coffee, are yet to realize returns in line with their pre-reform earnings. This may reflect the fact that MNC-affiliated marketers often secured modestly higher average prices for their clients’ coffee in 2021/22, countering suggestions that collusion suppressed farmers’ earnings.183 Data from the 2024/25 and subsequent growing seasons will be important in determining whether reforms benefit small growers as intended.
Given the limited data available to evaluate the impact of these reforms so far, the experiences of other coffee-producing countries may provide useful lessons for Kenya. Below, we explore three policy issues using Rwanda, Costa Rica, Colombia, Brazil, and Ethiopia as case studies. A consistent theme emerges: the effectiveness of market reforms depends critically on the strength of the institutions and their implementation effectiveness.
5.3.5.A Implications of banning vertical integration
Rwanda illustrates how competition reforms can unintentionally harm the coffee value chain, especially when mills rely on relational contracts like credit, inputs, extension services, and quality support to motivate farmers. This can occur because competition reduces the rents and predictability needed for cooperation.184 A simulation exercise for Costa Rica shows similar
Segment
Growers & wet millers
1. Co-operative societies 70%
2. Estates 30%
Dry millers 1. NKG Millers 25%
2. Central Kenya Coffee Mill Ltd 18%
3. Kofinaf 15%
Marketers/ brokers
1. Tropical Farm Management Ltd 28%
2. Coffee Management Services 25%
3. Sucastainability Ltd 14%
Buyers/ exporters
1. Ibero (Kenya) Ltd 16%
2. Tropical Farm Management Ltd 11%
3. C Dorman SEZ Ltd 10%
1. Co-operative societies 71%
2. Estates 29%
1. NKPCU 36% (for Sagana, Dandora & Meru combined)
2. Kirinyaga Union County Coffee Mill 11%
3. Umoja Specialty Millers 10%
1. Alliance Berries Ltd 29%
2. NKPCU PLC 22%
3. Kirinyaga Slopes Coffee Brokerage Co. Ltd 18%
1. C Dorman SEZ Ltd 21%
2. Ibero (Kenya) Ltd 18%
3. Kenyacof Ltd 13%
Source: Authors’ calculations from Agriculture and Food Authority Coffee Year Books
results: banning vertical integration—as in Kenya— raised farmgate prices but lowered farmer welfare, as mills provided essential auxiliary services.185
Relevance for Kenya: Removing integrated firms may increase contestability on paper, but unless alternative institutions supply the supplementary services those actors once provided, overall farmer welfare may stagnate or decline. The early service gaps mentioned during field interviews—like loss of credit and weaker technical support—mirror the mechanisms identified in Rwanda. This helps explain why Kenya’s reforms have not yet translated into improved market performance or increased farmers’ wellbeing. This suggests restructuring market power without parallel institutional strengthening (through counties or cooperatives with capacity to replace the lost services) can weaken the relationships that sustain quality and productivity.
5.3.5.B Revenue-sharing and institutional arrangements to preserve farmer value
Countries that maintained or restructured vertical integration without harming farmers did so by implementing clear, enforceable revenue-sharing policies or institutional mechanisms that ensured farmers received a transparent share of export value. In Costa Rica, revenue-sharing formulas protect farmers from rent extraction and ensure they get a predictable share of export prices, even when mills retain some profits.186 Colombia’s
programs use explicit formulas supported by the farmers’ union to pass export premiums to farmers.187 Brazil relies on strong producer organizations, transparent systems, and technology to help farmers capture quality premiums.188 These examples show that value-sharing institutions— not market structure alone—determine reforms’ success in improving farmer welfare. However, it is important to exercise caution in the design of the revenue-sharing model. If the share is too high, it can reduce mills’ margins and undermine their ability to provide services, enter new markets, or invest in quality upgrading.
Relevance for Kenya: This suggests that a balanced revenue-sharing framework—whether through transparent premium pass-through formulas, quality-based payments, or cooperative governance standards—could serve as a valuable complementary policy option. The DSS guarantees that payments go directly to farmers, but does not define how much of the export price those farmers receive. This mechanism could complement the DSS by ensuring both the route and the amount of value transmitted to farmers.
5.3.5.B Market design and auction systems
When Ethiopia centralized coffee trading under the Ethiopian Commodity Exchange (ECX) in 2008 it improved transparency but not traceability. As exporters could no longer credibly assign coffee lots to specific cooperatives or origins, specialty
Figure 19. Farmers’ profit margins versus global coffee prices, pre- and post-reform
unlock investment, upgrading, and job creation
Competition in milling, brokerage, and marketing determines whether productivity-enhancing investments (i.e., new mills, quality upgrading, logistics, and specialty exports) translate into employment along the value chain. Without contestability, rents accrue to a few actors rather than expanding output and labor demand. Therefore, Kenya’s reforms should aim not only to restructure market roles but also to encourage new private entrants and investment, rather than replace multinational actors with a single dominant state-owned entity. To maintain a competitive and investable market structure, Kenyan policymakers should consider the following:
Short-term priorities:
* Farmers’ margins calculatued for traditional varities only
Source: Agriculture and Food Authority Coffee Year Books and Federal Reserve Economic Data
buyers exited the market, reducing export value. In 2012, Ethiopia reversed the ECX requirement, allowing direct sales and rebuilding traceability. This improved its exports, quality, and market share in specialty coffee.189
Relevance for Kenya. NCE modernization must do more than digitize trading; it must preserve quality incentives, protect traceability, and support buyer-producer coordination. Expanding farmers’ access to direct sales is a meaningful step and mirrors Ethiopia’s actions. However, direct sales remain underused, possibly due to lack of familiarity with how to access buyers, suggesting stronger incentives, support, and capacity-building are required for cooperatives and farmers to participate.
Drawing on early evidence from Kenya’s coffee reforms, cross-country experiences, and interviews with industry stakeholders, three policy priorities emerge to ensure that reforms translate into tangible gains. Whether these reforms translate into more and better-paid jobs depends on the ability to sustain competitive entry and investment; raise farm-gate incomes and productivity; and strengthen governance and accountability across the value chain. The recommendations below prioritize actions that can be implemented in the short term under the current institutional framework, while distinguishing them from medium-term reforms that require broader consensus or capacity-building.
• Simplify and streamline licensing across CMA, Coffee Board, and counties, with published timelines and clear criteria for millers and brokers that meet quality and traceability standards. This lowers entry barriers for private firms, encourages investment, and supports job creation in processing and services.
• Increase transparency in licensing decisions by publishing approved licenses, renewal and new applications, and outcomes and reasons for rejection. This reduces discretion, improves investor confidence, and encourages entry by smaller domestic firms.
• Monitor market concentration annually of millers, brokers, and buyers, and publicly report indicators of dominance. This allows early corrective action before concentration undermines competition and employment.
Medium-term priorities:
• Develop contestability safeguards (e.g., market-share thresholds or access rules) to prevent the re-emergence of dominant state-owned or politically connected intermediaries that could crowd out private investment and job creation.
2. Strengthen farmers’ value capture to raise incomes and retain labor
Low and volatile farm incomes are the main reason farmers exit coffee production, reducing labor demand and weakening the industry’s labor force. Improving value transmission raises farm earnings, stabilizes livelihoods, and sustains rural employment. To ensure that reforms translate into higher welfare gains for farmers, policymakers
should reinforce and expand mechanisms that allow farmers to capture a greater share of export value.
Short-term priorities:
• Enhance DSS transparency and usability by giving farmers a clear, detailed payment statement that shows prices, deductions, and timelines. Complement this with training for farmers and cooperatives to ensure they know how to use the DSS properly. This boosts trust, avoids disputes, and encourages continued coffee farming.
• Support cooperatives’ and farmers’ participation in direct sales through targeted technical assistance (i.e., buyer identification, contract negotiation, quality preparation, traceability compliance). In addition, remove restrictions or procedural bottlenecks that limit the share of coffee that can be marketed through direct contracts outside the NCE. Expanding direct sales can generate higher margins and stabilize incomes, supporting on-farm employment and cooperative jobs.
• Use DSS and auction data to track farm-gate income trends in coffeegrowing counties as a proxy for livelihood outcomes.
Medium-term priorities:
• Pilot a calibrated value-sharing mechanism (e.g., transparent premium pass-through rules for specialty and direct-sale coffee). Such a mechanism should protect farmers’ income gains while preserving incentives for private investment and for mills and exporters to provide services.
3. Strengthen governance, transparency, and accountability across the value chain
Stronger governance and accountability across all actors are essential to reinforcing trust in the reformed system, improving service delivery, and ensuring that Kenya’s coffee industry can achieve the existing productivity and job creation goals.
Short-term priorities:
• Establish an inter-agency coordination platform among the CMA, Coffee Board, and county governments to harmonize standards on inspections, quality, traceability, and reporting. Better coordination reduces regulatory uncertainty and supports private investment and employment.
• Provide targeted governance support to cooperatives and factories, focusing on financial management, transparency, innovation, and member accountability. Stronger cooperatives improve productivity and sustain local jobs.
Medium-term priorities:
• Build county-level capacity for extension and quality upgrading, ensuring devolution translates into productivity gains rather than regulatory fragmentation. Over time, this supports higher yields, better-quality coffee, and more sustainable rural employment.
If implemented effectively, these recommendations can help Kenya’s coffee reforms translate into higher farm incomes, stronger incentives to remain in coffee production, and expanded employment along the value chain—from farming and processing, to logistics and specialty marketing. In the short term, faster payments, clear licensing, and improved transparency can stabilize livelihoods and reduce income volatility. Over the medium term, sustained competition and better value sharing can support productivity upgrading, higher wages, and more resilient rural jobs.
The electricity, digital finance, and coffee industries illustrate some of the challenges and opportunities that emerge from SBRs and governance arrangements. They also point to broader areas in which policy implementation can be better aligned with the public interest in Kenya. Although these challenges and policy options are well known, they bear repeating when opportunities arise to overcome the political constraints that block reform. Economy-wide governance reforms are essential to close the gap between policy mandates and practice and enhance transparency, autonomy, and accountability in economic policymaking across state entities and levels of government.
6.1 Public procurement: closing the gap between policy and practice
Kenya has made great strides in establishing public management and anti-corruption legislation and institutions. Kenyan stakeholders from both government and civil society spoke highly of Kenya’s 2010 constitution and recent legislation including the Public Finance Management Act (2012), the Conflict of Interest Act (2025), and the draft Whistleblower Protection Bill. However, measures that look good on paper have not yet fully translated into practice, illustrating that transparency without accountability is insufficient.
Fewer than half of Kenyans express confidence in key government and political institutions.190 This lack of trust stems from gaps in policy implementation, whilst further entrenching these gaps. For instance, officials from the Ethics and Anti-Corruption Commission (EACC) explained that low trust in the government makes people hesitant to report violations. The EACC has a strong mandate to investigate corruption, but its enforcement power is limited in the absence of a national culture of accountability.
This challenge is also present in public procurement. The rollout of electronic government procurement (e-GP) in 2025 is a positive development for transparency, anti-corruption, and efficiency in public resource management.191 The next step is to ensure the e-GP system is fully implemented and utilized appropriately. Challenges
to date include resistance from county governors192 due to lack of consultation, technical issues, and Parliament’s rejection of multiple circulars related to e-GP implementation.193 The Public Procurement Regulatory Authority (PPRA) must also build on the Access to Government Procurement Opportunities program to ensure that diverse suppliers are educated on and have access to the e-GP process.
As the e-GP roll-out continues, PPRA should take the following steps to increase the competitiveness of tenders, promote accountability, and build trust in the procurement process:
1. Leverage MAPS assessment to benchmark procuring entities
PPRA officials shared that Kenya is currently undergoing a Methodology for Assessing Procurement Systems (MAPS) assessment, a globally recognized standard for evaluating public procurement systems housed at the Organization for Economic Cooperation and Development.194 Once finalized and published in 2026, PPRA should use the assessment to benchmark procuring entities at the national and county levels against international best practices. Publicly highlighting both areas for improvement and positive results will enhance public accountability, lend legitimacy to entities that are performing well, and provide a baseline for measuring the effect of future reforms.
2. Partner with the private sector on a periodic market perceptions survey
When businesses in Uganda received reliable information about the integrity of procuring entities, based on a survey of “market perceptions” of integrity from more than 2,000 firms, they submitted more bids and won more contracts. This highlighted that e-procurement on its own, with its timely and accessible information on tenders, did not translate into higher participation. Integrity perceptions, however, are a more binding constraint, with peer-based information more effective than government audit data.195 PPRA should partner with Kenyan business associations to roll out a similar private sector market perceptions survey to assess the level of transparency and
fairness of procuring entities and publicize the results. By providing peer feedback on entity integrity, this intervention reduces information asymmetries for investors and encourages greater participation and competition in public procurement. In the Uganda case, the most pessimistic firms— who perceived the system as rigged and overly dependent on personal connections to public officials—increased their participation the most, suggesting that they adjusted their beliefs while becoming more engaged in procurement. This could spur a virtuous cycle, with more productive firms participating and investing in more job-creating projects, and public entities also changing their behavior to attract higher levels of productive investment.
During our fieldwork, several academic and private sector stakeholders identified excessive licensing requirements and long processing times as key barriers that foreclose entry of new firms in various industries. One business association leader noted that a typical firm in the tea industry could require over 50 licenses to operate, with opportunities for rent-seeking by public officials at each interaction. It takes some companies up to two years to receive a single license. This challenge is exacerbated by inconsistent and repetitive permitting requirements across Kenya’s 47 counties, creating a logistical and financial hurdle for prospective entrepreneurs.
This regulatory burden is driven in part by the incentives created by devolution. County governments have experienced a mismatch between resources and mandate: countylevel revenues and transfers from the central government have not kept up with their expanded responsibilities. According to Kenyan stakeholders, business licensing fees are often used to generate budget revenue in a tight fiscal environment. There are several steps the government can take to change these incentives and streamline the regulatory environment.
The County Licensing (Uniform Procedures) Regulations (2025) aim to dismantle bureaucratic barriers by granting automatic approval for business licenses if a county government fails to process the application within 28 days. The regulations will also merge several county permits into a single license.196 Kenya’s Ministry of Trade, Investment and Industry should ensure these reforms are fully implemented across the country and reinforced by standardization of application procedures. This harmonization of requirements across counties could significantly reduce compliance costs for businesses, freeing up
resources for more productive purposes.
The Kenya National Chamber of Commerce and Industry (KNCCI) should leverage its ongoing cooperation with the Council of Governors to push for a removal of inter-county trade barriers, including interstate commerce fees.197 This should be accompanied by the digitization of businessrelated services, which some counties have already begun to implement. By lowering the cost of doing business within and across counties, these reforms will increase economic activity and ultimately expand county revenue collection, easing resource constraints.
Under the new County Licensing regulations, the trade ministry will periodically publish a County Competitiveness Index to benchmark each county’s economic performance.198 Since 2019, the Kenya Institute for Public Policy Research and Analysis (KIPPRA) has also periodically published a County Business Environment for MSEs index, which includes indicators on infrastructure, market environment, financial inclusion, technical capacity, governance, and risk preparedness.199 Collaboration between KIPPRA, the trade ministry, and other government entities that undertake similar assessments should ensure their complementarity. They should also publish synthesized findings to guide investors, encourage public accountability, and inform county-level industrial policy.
6.3
During field interviews, Kenyan stakeholders raised concerns not only about the content of government policies, but also the process by which these policies are made. Policy unpredictability undermines the ability of businesses to plan for future investment. For example, multiple businesses and industry associations cited tax regime volatility as a major concern. With a new Finance Bill passed every year, sometimes a standard is changed or contradicted before the former one has been fully implemented. One business decided to expand their operations based on a value-added tax exemption that was put up for repeal just a few months later. Other times, the private sector doesn’t hear about a regulatory change until it is published and underway.
Although some level of policy uncertainty is natural in a multiparty democracy, establishing a participative and transparent policymaking procedure would create a more predictable business environment and support more open and productive SBRs. The right to public participation
is enshrined in Kenya’s constitution, but there has been no clear guidance for how such participation should be conducted. This is a legislative gap that has limited meaningful citizen engagement with policymaking.200 Where legislation does exist at the sub-national level, guidelines can be unclear, and implementation is inconsistent across departments. For instance, despite the existence of a Public Participation Act for Nairobi County, there is no structured mechanism for the private sector to engage with the county government.201 Other stakeholders explained that although some consultation processes are in place, many private sector actors either don’t know they are happening or assume their comments will have no impact.
The Kenyan government should adopt and enforce a standard consultative process for inclusive engagement in regulatory and legislative policymaking. Such a process may involve several important steps. Especially for significant changes in policy, the first step should be to prepare an analysis of the main problems and proposed solutions, a document often called a “white paper.” The purpose of the white paper is to justify the proposed policy and present an analysis of the likely impact. The white paper should be made available to the general public, discussed with stakeholders and used to solicit comments. Once the proposed legislation is prepared it should be made available online and key stakeholders should be allowed to provide comments within a reasonable time frame. In principle the comments should also be made available online. Clearly establishing the autonomy of regulatory agencies and channels of accountability will also help ensure that, once passed, legislation is appropriately implemented and enforced.
The Public Participation Bill (2025) currently under consideration by the National Parliament provides a key opportunity to institutionalize transparent and accountable engagement. The bill establishes a minimum legal framework for public participation, vests oversight in a Public Participation Registrar, and creates standards for public participation plans, reports and feedback mechanisms. Public authorities can be fined for non-compliance.202 The timely passage of this bill and full implementation will help the government build credibility, demonstrate robust policymaking, and build trust between the private sector and the state. This enhanced transparency and accountability in policymaking creates an environment where entrepreneurship can thrive, unlocking job creation and economic opportunity for all Kenyans.
Note: ThistablereportsestimatesofOLSregressionsexamininghowfirmcharacteristicssuchassize,ageandownershiptyperelateto corruption-relatedoutcomesintheKenya2018WorldBankEnterpriseSurveyIndicatorsdatabase.Nocontrolshavebeenincludedin theseregressions.Thedependentvariablesincludeanindexofforeclosureofessentialbusinessservices(theindexisbasedonsixindicator variablesthatcapturewhetherfirmsciteland,finance,transportation,electricity,tax,andlicensingasamajororsevereconstrainttocurrent operationsofthefirm);Corruption(VerySevere/Major)-(indicatorforfirmsviewingcorruptionasamajororverysevereconstraintto currentoperationsofthefirm);CorruptonBiggestObstacle-(indicatorforfirmsindicatingcorruptionasthebiggestobstacleinthebusiness environment);TimeSpent(theaverageshareofseniormanagement’stimedealingwithgovernmentregulations);SalesPaid(indicatorfor firmsreportingthatfirmssimilartotheirsareexpectedtogivegiftsormakeinformalpaymentstopublicofficialstogetthingsdone);and AnyBribe(indicatorforfirmsexperiencingatleastonebribepaymentrequestacross6publictransactionsdealingwithaccesstoanelectrical connection,waterconnection,construction-relatedpermits,taxesandimportingoroperatinglicenses).Independentvariablesincludeasize indicatorwhichiscodedas1formedium/largefirmsand0forsmallfirms,anageindicatorcodedas1forfirmsolderthan10yearsand 0otherwise,andanindicatorcodedas1forforeignownershipand0fordomesticownership.Notethatafirmisconsideredtohaveforeign ownershipifatleast10%ofownershipisheldbyforeigners.Standarderrorsinparentheses.*p < 0.1,**p < 0.05,***p < 0.01.
DependentVariables
FormalIntroIntroRDFormalIntroIntroRDFormalIntroIntroRDFormalIntroIntroRDFormalIntroIntroRD
ForeclosureIndex
(0.012)(0.013)(0.011)(0.015)
SalesPaid -0.0490.115***0.099***0.026 (0.038)(0.039)(0.035)(0.044)
AnyBribe 0.080**0.071*0.095***0.121*** (0.038)(0.039)(0.035)(0.046) Observations
Note: ThistablereportsestimatesofOLSregressionsexaminingtheassociationsbetweenfirminnovationindicatorsandcorruption-related outcomesintheKenya2018WorldBankEnterpriseSurveyIndicatorsdatabase.Weaddcontrolsforfirmsize,age,sectorandregion.The dependentvariablesincludeFormalTraining(anindicatorvariableforfirmsofferingformaltrainingoverthepreviousfiscalyear),Intro Prod.(anindicatorvariableforfirmsthatintroducedanewproductorserviceoverthelast3years),IntroProc.(anindicatorvariable forfirmsthatintroducedaprocessinnovationoverthelast3years),RDSpend(anindicatorvariableforfirmsthatspentonresearchand developmentactivitiesinthelastfiscalyear).Theindependentvariablesincludeanindexofforeclosureofessentialbusinessservices(the indexisbasedonsixindicatorvariablesthatcapturewhetherfirmsciteland,finance,transportation,electricity,tax,andlicensingasa majororsevereconstrainttocurrentoperationsofthefirm);Corruption(VerySevere/Major)-(indicatorforfirmsviewingcorruptionasa majororverysevereconstrainttocurrentoperationsofthefirm);TimeSpent(theaverageshareofseniormanagement’stimedealingwith governmentregulations);SalesPaid(indicatorforfirmsreportingthatfirmssimilartotheirsareexpectedtogivegiftsormakeinformal paymentstopublicofficialstogetthingsdone);andAnyBribe(indicatorforfirmsexperiencingatleastonebribepaymentrequestacross 6publictransactionsdealingwithaccesstoanelectricalconnection,waterconnection,construction-relatedpermits,taxesandimportingor operatinglicenses).Standarderrorsinparentheses.*p < 0.1,**p < 0.05,***p < 0.01.
Performance and Corruption
Kenya 2018
DependentVariables
EmpEmpLabProdLabProdEmpEmpLabProdLabProd GrowthRaw LogGrowthRaw LogGrowthRaw LogGrowthRaw Log (1)(2)(3)(4)(5)(6)(7)(8)
ForeclosureIndex-0.276-0.059*0.125-0.082* (0.514)(0.032)(0.824)(0.044)
AnyBribe -0.6380.0175.468**0.112 (1.590)(0.098)(2.536)(0.136)
Observations824875716787824881711790
ControlMean4.513.19-4.8314.394.663.22-4.8314.38
Note: ThistablereportsestimatesofOLSregressionsexaminingtheassociationsbetweenfirmperformance(employmentandlaborproductivity)andcorruptionindicatorsinthe2018KenyaWorldBankEnterpriseSurveyIndicatorsdatabase.Weaddcontrolsforfirmage,sector andregion.ThedependentvariablesincludeEmpGrowth(averageannualemploymentgrowth,sourcedfromtheIndicatorsdatabase),Emp Raw Log(logoftotalnumberofpermanent,full-timeemployeesattheendofthelastfiscalyear,sourcedfromtherawdatabase),LabProd Growth(averagerealannuallaborproductivitygrowth(pct),sourcedfromtheIndicatorsdatabase)andLabProdRaw Log(obtainedby dividingtotalannualsalesinthelastfiscalyearbytotalfull-time,permanentemploymentinthelastfiscalyearandtakingthelogofthe result,andsourcedfromtherawdatabase).Theindependentvariablesincludeanindexofforeclosureofessentialbusinessservices(theindex isbasedonsixindicatorvariablesthatcapturewhetherfirmsciteland,finance,transportation,electricity,tax,andlicensingasamajoror severeconstrainttocurrentoperationsofthefirm),andAnyBribe(indicatorforfirmsexperiencingatleastonebribepaymentrequestacross 6publictransactionsdealingwithaccesstoanelectricalconnection,waterconnection,construction-relatedpermits,taxesandimportingor operatinglicenses).Standarderrorsinparentheses.*p < 0.1,**p < 0.05,***p < 0.01.
Figure 20. Market concentration in the Kenyan coffee sector
Market Concentration in the Kenyan Coffee Sector* *Volume−based scores; gaps are limits in data availability.
Source: Authors’ calculations from Agriculture and Food Authority Coffee Year Books

Daniel was born and raised in Bogotá, Colombia. He completed both his undergraduate and master’s degrees in economics at the Pontificia Universidad Javeriana in Bogotá. Before attending Princeton, he advanced his career by working at the Central Bank of Colombia, Scotiabank, the Superintendency of Industry and Commerce, and Colombia’s Tax and Customs Authority (DIAN). His professional journey has encompassed a variety of fields, including data science, economic analysis, economic research, antitrust enforcement, and risk management. He is deeply interested in economic development, the application of data science in public policy, and strengthening institutions for sustainable growth. At Princeton, he aims to delve into development and institutional policies that could bolster Colombia. During the summer of 2025, he interned at the Japan Economic Foundation in Tokyo, where he researched trade resilience and the service sector and contributed to the Foundation’s digital outreach strategy. Following his studies at the Princeton School of Public and International Affairs, Daniel aspires to contribute to Latin America’s development policies through short-term roles at the IDB, World Bank, or IMF. In the long term, his ambition is to lead the National Planning Department of Colombia. Beyond his academic and professional pursuits, Daniel is passionate about soccer, electronic music, and enjoys attending festivals and concerts with his friends.


Originally from Nashville, Tennessee, Sarah completed her undergraduate degree in international politics and Latin American Studies at Georgetown University. Before graduate school, she worked for a D.C.-based global strategic advisory firm, where she researched political and economic trends in northern Latin America to provide market risk guidance to corporate clients and advance U.S. commercial diplomacy. Past experience as a research assistant for a database on Latin American institutions and as an intern at a refugee resettlement nonprofit affirmed her passion for public service, migration policy, and Western Hemisphere affairs. After her first year at SPIA, she joined the World Bank’s Social Protection and Labor Global Practice to support a grant program on digital social protection and develop practice-wide portfolio and strategy documents. In her free time, Sarah enjoys running, trying new recipes, and collecting houseplants.
Sam was born and raised in Honolulu, Hawai`i. She moved to Massachusetts to earn her undergraduate degree from Wellesley College where she studied economics and political science. After college, Sam moved back home to work in the housing division of the Legal Aid Society of Hawai`i. There she led the housing test case program –which worked to identify and combat housing discrimination – and assisted with cases of wrongful eviction during the COVID-19 eviction moratoriums. She then moved back to Massachusetts to work as an economic consultant, where she assisted industry and academic experts in analyzing the economic impact of antitrust, labor, and energy cases. This past summer Sam researched monetary poverty at the United Nation’s Economic and Social Commission of Asia and the Pacific.

Originally from Tukwila, Washington, Benton graduated with a degree in economics from the University of Washington in Seattle. During his undergraduate years, Benton focused his studies on the transition from communism and studied abroad in Georgia, Romania, and Russia. After graduation, he worked in local economic development, first for the City of Tukwila and then for the City of Issaquah, where he assisted in the city’s response to the COVID-19 pandemic. He was an active contributor to his community, sitting on the boards of several local community organizations, including as board chair of the Tukwila Pantry, the local food bank in his community. After Russia’s full-scale invasion of Ukraine, Benton went to work for the Atlantic Council’s Eurasia Center, where he facilitated the Center’s work on Ukraine and the wider Eurasia region and actively contributed to the Atlantic Council’s UkraineAlert and New Atlanticist blogs.


Jess is from Brisbane, Australia and graduated from the University of Queensland with first-class Honors in Economics. Before Princeton, she worked as an economist at Australia’s central bank across a variety of roles, most recently in the Domestic Markets Department, where she briefed senior policymakers on financial market developments and produced research on bank funding behaviors. Prior to this, she served in the Macroeconomic Modelling and International Policy teams. There, she contributed to Australia’s economic forecasting during COVID-19, conducted scenario analysis, and briefed executives for G20 and IMF meetings. Her policy research addressed issues such as the unemployment-inflation trade-off and the implications of the rise of bilateral lending to low-income countries. This summer, she worked as a research assistant at the Julis-Rabinowitz Center for Public Policy & Finance, contributing to research projects related to developing countries’ industrial policies; financial institutions in Pacific Island countries; and green investment trends.
Prior to joining SPIA as an MPA student specializing in international development and economic policy, Mahnoor spent six years in the development sector in Pakistan. She worked at the Centre for Economic Research in Pakistan (CERP) and the Lahore University of Management Sciences (LUMS), implementing randomized controlled trials in domains as diverse as education, property taxation, municipal services and air pollution, in collaboration with academics at institutions such as the World Bank, Harvard University and the Massachusetts Institute of Technology. Mahnoor holds a Bachelor of Science in Economics from the Lahore University of Management Sciences. After graduating from Princeton, she looks forward to working on macroeconomic and financial policymaking, particularly in the context of emerging economies.
Bryan is from Mauritius and previously worked as a Senior Research Associate at the International Republican Institute’s (IRI) Center for Insights in Survey Research (CISR). At IRI, he collaborated closely with program teams in emerging democracies to design and conduct public opinion surveys and to produce polling reports for key stakeholders. Bryan was also a member of YOUNGO, where he worked alongside young activists from around the world to amplify youth voices in the fight against climate change. For instance, he used his proficiency in French to support the French translation of the Global Youth Statement presented at COP28. Bryan earned a B.A. in Political Science and Quantitative Economics from Lycoming College. His academic interests focus on the impact of macro-financial policies on economic development and public debt crises in low- and middle-income countries, as well as the role of new technologies in improving public service delivery. After SPIA, Bryan hopes to pursue a career with international financial organizations to support countries in addressing public debt challenges.


Mohamad Moslimani, Field IV – Economics and Public Policy
Mohamad is a graduate of Claremont McKenna College where he majored in Philosophy, Politics and Economics. Throughout his time at CMC, Mohamad volunteered as a facilitator of student activities for various affinity groups. During his bachelor’s, Mohamad also spent a semester studying in Washington, D.C., and working at K&L Gates, where his appreciation for the intricacies of the public policy process began. Mohamad returned to D.C. after his 2021 graduation to work at Pew Research Center on the Race and Ethnicity team where he conducted public opinion polling and demographic analysis. After graduating from Princeton, Mohamad hopes to bring his social science experience to bear on social policy design, implementation, and analysis in the realms of poverty alleviation and social mobility.
Ana Maria Perez Patiño, Field II – International Development
Ana was born and raised in Bogotá, Colombia. Before Princeton, she worked at Instiglio, an international advisory firm, where she supported governments, multilateral agencies, and philanthropies in designing and implementing results-based financing programs in low- and middle-income countries. Through these experiences, she developed a deep interest in migration policy and in making public spending and development aid more effective, sustainable, and impactful, to improve the lives of vulnerable populations. This past summer, she interned at the World Bank’s Development Research Group, contributing to policy research on refugee labor market integration in Ethiopia. Ana holds a B.A. in Economics and a B.A. in Political Science from Universidad de los Andes.
Hana Rajap, Field II – International Development
Born and raised in Colombo, Sri Lanka, Hana holds a B.A. from the University of Chicago, where she majored in political science and psychology. Most recently, she worked as a data analyst at the United Nations Development Programme in Sri Lanka and the Office of the U.N. Resident Coordinator in Sri Lanka, on initiatives to consolidate and analyze risk indicators to inform strategic and programming priorities on social cohesion and peacebuilding. Understanding and addressing the proliferation of hate speech and misinformation has been a recurrent focus in her professional career to date. At Princeton, Hana plans to build skills relevant to the design and evaluation of evidence-based and contextualized approaches to building sustainable peace.
Chapter 1 Introduction
1 “Methodology”, Enterprise Surveys, accessed January 18, 2026. https://www.enterprisesurveys. org/en/methodology
Chapter 2 Analytical Framework
2 Jean Tirole, Economics for the Common Good (Princeton Univ. Press, 2017).
3 World Bank, Competition Policy for Development: Powering Markets for Inclusive Growth (The World Bank, 2025), https://documents1.worldbank.org/ curated/en/099061225204520811/pdf/P179975cd6aae1e-aadf-4da9-93a3-8e0f800fe804.pdf.
4 Kunal Sen, State-Business Relations: Topic Guide (GSDRC, 2015).
5 Diego Restuccia and Richard Rogerson, “The Causes and Costs of Misallocation,” Journal of Economic Perspectives 31, no. 3 (2017): 151–74.
6 Jean Tirole, Economics for the Common Good (Princeton Univ. Press, 2017).
7 World Bank, Competition Policy for Development: Powering Markets for Inclusive Growth (The World Bank, 2025), https://documents1.worldbank.org/ curated/en/099061225204520811/pdf/P179975cd6aae1e-aadf-4da9-93a3-8e0f800fe804.pdf.
8 Kunal Sen, State-Business Relations: Topic Guide (GSDRC, 2015).
9 Jean Tirole, Economics for the Common Good (Princeton Univ. Press, 2017).
10 Kunal Sen, State-Business Relations: Topic Guide (GSDRC, 2015).
11 Kunal Sen, State-Business Relations: Topic Guide (GSDRC, 2015).
12 World Bank, Competition Policy for Development: Powering Markets for Inclusive Growth (The World Bank, 2025), https://documents1.worldbank.org/ curated/en/099061225204520811/pdf/P179975cd6aae1e-aadf-4da9-93a3-8e0f800fe804.pdf.
13 Jean Tirole, Economics for the Common Good (Princeton Univ. Press, 2017).
14 Diego Restuccia and Richard Rogerson, “The Causes and Costs of Misallocation,” Journal of Economic
Perspectives 31, no. 3 (2017): 151–74.
15 Kunal Sen, State-Business Relations: Topic Guide (GSDRC, 2015).
16 Philippe Aghion et al., “Industrial Policy and Competition,” American Economic Journal: Macroeconomics 7, no. 4 (2015).
17 World Bank, The Middle-Income Trap, World Development Report 2024 (World Bank Group, 2024).
18 Ibid.
19 Ibid.
20 William T. Baumol, “Entrepreneurship: Productive, Unproductive, and Destructive,” The University of Chicago Press Journal 98 (October 1990): 893–921. http://www.jstor.org/stable/2937617
21 Seidu Dauda, The Effects of Competition on Jobs and Economic Transformation, Equitable Growth, Finance & Institutions Insights, Trade, Investment and Competitiveness (World Bank Group, 2020).
22 Ibid.
23 William T. Baumol, “Entrepreneurship: Productive, Unproductive, and Destructive,” The University of Chicago Press Journal 98 (October 1990): 893–921. http://www.jstor.org/stable/2937617
24 Martha Licetti et al., The Markets and Competition Policy Assessment Toolkit (World Bank Group, 2025), https://hdl.handle.net/10986/42649.
Chapter 3 Kenyan Policy Context
25 “GDP (current US$) Kenya,” World Bank Open Data, accessed January 18, 2026, https:// data.worldbank.org/indicator/NY.GDP.MKTP. CD?locations=KE
26 “Wage and salaried workers, total (% of total employment) (modeled ILO estimate) Kenya,” World Bank Open Data, accessed January 18, 2026, https://data.worldbank.org/indicator/SL.EMP. WORK.ZS?locations=KE
27 Mueller, Susanne D. “The Resilience of the Past: Government and Opposition in Kenya.” Canadian Journal of African Studies / Revue Canadienne Des Études Africaines 48, no. 2 (2014): 333–52.
28 P. A. Gobo, “Land Alienation in Settler Colonies Compared: Kenya, Zimbabwe and South Africa” (PDF), Social Science Journal for Humanities and Islamic Studies (SSJHIS), 2022, https://ssjhis.org/ wp-content/uploads/2022/06/20.-Land-Alienationin-Settler-Colonies-Compared-Kenya-Zimbabweand-South-Africa.pdf
29 Miatta Fahnbulleh. “In Search of Economic Development in Kenya: Colonial Legacies & PostIndependence Realities.” Review of African Political Economy 33, no. 107 (2006): 33–47. http://www. jstor.org/stable/4007110
30 Karuti Kanyinga. Kenya Experience in Land Reform: The Million-Acre Settlement Scheme. 2007.
31 Catherine Boone, Fibian Lukalo, and Sandra F. Joireman, “Promised Land: Settlement Schemes in Kenya, 1962 to 2016,” Political Geography 89 (2021): 102393. https://doi.org/10.1016/j. polgeo.2021.102393; Ambreena Manji, “Land reform in Kenya: The history of an idea,” Strathmore LJ 5 (2021): 267-278. https:// journal.strathmore.edu/index.php/law/article/ download/151/153/452
32 Eliphas Mukonoweshuro, “Authoritarian reaction to economic crises in Kenya,” Race & Class 31, no. 4 (1990): 39-59. https://journals.sagepub.com/doi/ epdf/10.1177/030639689003100403
33 Tyce, Matthew. 2020. “Beyond the NeoliberalStatist Divide on the Drivers of Innovation: A Political Settlements Reading of Kenya’s M-Pesa Success Story.” World Development 125 (2020): 104621. https://doi.org/10.1016/j. worlddev.2019.104621
34 Mueller, Susanne D., ‘High-stakes ethnic politics’, in Nic Cheeseman, Karuti Kanyinga, and Gabrielle Lynch (eds), The Oxford Handbook of Kenyan Politics, Oxford Handbooks (2020; online edn, Oxford Academic, 2 Apr. 2020), https://doi. org/10.1093/oxfordhb/9780198815693.013.23, accessed 12 Nov. 2025. Mueller, Susanne D. “The Resilience of the Past: Government and Opposition in Kenya.” Canadian Journal of African Studies / Revue Canadienne Des Études Africaines 48, no. 2 (2014): 333–52. http://www.jstor.org/ stable/43860507
35 Rono, Joseph Kipkemboi. “The impact of the structural adjustment programmes on Kenyan society.” Journal of Social Development in Africa 17, no. 1 (January 2002): 81–98. School of Social Work, Harare. https://n2t.net/ark:/85335/ m56t0kz71
36 Nic Cheeseman, “The Kenyan Elections of 2007: An Introduction.” Journal of Eastern African Studies 2 (2): 166–84. https://doi. org/10.1080/17531050802058286
37 Constitution of Kenya, Article 10, National Values and Principles of Governance. Promulgated 27 August 2010; revised as of 2022. Accessed January 19, 2026. https://www.klrc.go.ke/index.php/ constitution-of-kenya/108-chapter-two-the-republic/176-10-national-values-and-principles-of-gov-
ernance; The Institute for Social Accountability (TISA). Living Accountability: The Cultural Roots of Governance and Utu in Kenya. March 26, 2025. Accessed January 19, 2026. https://tisa.co.ke/ living-accountability-the-cultural-roots-of-governance-and-utu-in-kenya/
38 Constitution of Kenya, Chapter Eleven: Devolved Government. Promulgated 27 August 2010; revised as of 2025. Accessed January 19, 2026. https://www.klrc.go.ke/index.php/constitution-ofkenya/138-chapter-eleven-devolved-government
39 UNCAC Coalition & Transparency International Kenya. 2025. Kenya Civil Society Parallel Report on UNCAC Implementation. Washington, DC: UNCAC Coalition/Transparency International.
40 University of Groningen, “Economic Transformation Database,” University of Groningen, February 4, 2021, http://www.rug.nl/ggdc/structuralchange/ etd/.
41 One way to gauge the increase in informal jobs is to compare jobs in manufacturing from the UNIDO database, which is often seen as a measure of the formal sector, with that in the Groningen database. According to this, the share of formal jobs in Kemya manufacturing dropped from 17 percent in 1998 to 13 percent in 2018. See UNIDO, “Databases | UNIDO Statistics Portal,” 2025, https://stat.unido. org/data/table?dataset=indstat&revision=4#databrowser
42 World Bank, Beyond the Budget : Fiscal Policy for Growth and Jobs - A Public Finance Review for Kenya (2025), https://documents.worldbank. org/en/publication/documents-reports/ documentdetail/099052625064075957.
43 Kenya Vision 2030 (Popular Version) | Kenya Vision 2030. n.d. Accessed November 11, 2025. https:// vision2030.go.ke/publication/kenya-vision-2030popular-version/
44 “Our Vision 2030 and beyond is on course, President Ruto.” The Official Website of the President of the Republic of Kenya, n.d. Accessed November 11, 2025. https://www.president.go.ke/ we-are-rolling-out-programmes-designed-toaccelerate-economic-growth-president-ruto/
45 “Government Effectively Implementing Beta to Enhance the Livelihoods of Kenyans | Government Advertising Agency.” Accessed November 11, 2025. https://www.mygov.go.ke/government-effectivelyimplementing-beta-enhance-livelihoods-kenyans.
46 World Bank. “World Development Report 2024: The Middle-Income Trap.” Text/HTML. Accessed November 11, 2025. https://www.worldbank.org/ en/publication/wdr2024
47 The World Bank. Central government debt, total (% of GDP) – Kenya. World Development Indicators. Accessed January 19, 2026. https:// data.worldbank.org/indicator/GC.DOD.TOTL. GD.ZS?view=map-JM&locations=KE
48 Federation of Kenyan Employers and International Labour Organization. The Informal Economy in
Kenya Geneva: International Labour Organization, March 2021. Accessed January 19, 2026. https:// www.ilo.org/sites/default/files/wcmsp5/groups/ public/%40ed_emp/%40emp_ent/documents/ publication/wcms_820312.pdf
49 E-Government Procurement (e-GP) System Roll out by July 1, 2025, Kenya Law Reform Commission (KLRC) media release, July 1, 2025, accessed January 19, 2026, https://www.klrc.go.ke/index. php/media-center/738-e-government-procuremente-gp-system-roll-out-by-july-1-2025
50 Afrobarometer. Most Kenyan Youth See Government as Failing on Their Top Priorities: Afrobarometer Dispatch No. 988. May 23, 2025. Accessed January 19, 2026. https://www.afrobarometer.org/wpcontent/uploads/2025/05/AD988-Most-Kenyanyouth-see-government-as-failing-on-their-toppriorities-Afrobarometer-23may25.pdf
51 Food and Agriculture Organization of the United Nations (FAO). Rural Youth Employment and Agri-Food Systems in Kenya: A Rapid Context Analysis. Rome: FAO, 2019. Accessed January 19, 2026. https://openknowledge.fao.org/ handle/20.500.14283/ca7341en
Chapter 4 Aggregate Analyses
52 “Documentation | Worldwide Governance Indicators” World Bank Group, accessed January 19 2026. https://www.worldbank.org/en/publication/ worldwide-governance-indicators/documentation.
53 BTI’s summary assessment on Kenya’s anticorruption policies is that “the battle against corruption is primarily a superficial endeavor used to pacify the public”. See BTI, 2024 Country Report – Kenya, pp37-8.
54 BTI’s “political participation” indicator is made up of 4 sub-indicators that cover the extent to which political representatives are determined by free and fair elections, the extent to which democratically elected political representatives have the effective power to govern or the extent to which there are veto powers and political enclaves, the extent to which individuals form and join independent political or civic groups that can operate and assemble freely, and the extent to which citizens, organizations and the mass media express opinions freely.
55 New business density is the number of newly registered limited liability companies normalized by each country’s adult working age population (those aged 15-64). Data for Kenya is only available for 2017-20. See https://www.worldbank. org/en/programs/entrepreneurship for the World Bank’s entrepreneurship database that collects administrative data from business registries and statistics agencies.
56 The BTI integrity indicator is available for 2018 and 2020, among other years. Data from 2018 are used given that integrity levels in a given year are expected to be associated with new firm creation in subsequent years.
57 The public perception of anti-corruption indicator is composed of 3 sub-indicators, namely the perceived integrity of public officials, the perceived freedom from paying bribes for administrative services, and satisfaction with fighting corruption. The public perception of economic opportunities indicator is composed of 2 sub-indicators, namely the extent to which citizens feel the government is doing well at creating jobs as well as citizens’ perceptions of the country’s present economic condition. Both indicators are collected by Afrobarometer. See https://iiag.online/
58 Xiangbing Xuu, Nanyan Dong, Chengzhang Wu, and Sicheng Luo, “The employment effects of anticorruption: Evidence from China,” Emerging Markets Review 66 (2025): 101290. https://doi. org/10.1016/j.ememar.2025.101290
59 Emanuele Colonnelli , Spyridon Lagaras, Jacopo Ponticelli, Mounu Premd, and Margarita Tsoutsoura, “Revealing corruption: Firm and worker level evidence from Brazil,” Journal of Financial Economics 143, no. 3 (2022): 1097-1119 https://static1.squarespace.com/ static/5596b3d9e4b0dd603214b252/t/61e02e83 2cb3fc2df3705948/1642081924861/CLPPT_JFE_ Published.pdf
60 Arti Grover, “Which Firms Create More and Better Jobs?”, IFC Emerging Market Insights (August 2025)
61 Mohammad Amin and Victor Motta, “The Impact of Corruption on SMEs’ Access to Finance: Evidence Using Firm-Level Survey Data from Developing Countries,” Policy Research Working Paper No. 9812 (World Bank Group, October 2021), Open Knowledge Repository
62 Donato De Rosa, Nishaal Gooroochurn, and Holger Görg, Corruption and Productivity: Firm-level Evidence from the BEEPS Survey, Policy Research Working Paper, no. 5348 (Washington, DC: The World Bank, 2010). https://openknowledge.worldbank.org/entities/publication/4c078555-b280-5d2f8aab-0a55cf192873
63 Mohammad Amin and Victor Motta, “The Impact of Corruption on SMEs’ Access to Finance: Evidence Using Firm-Level Survey Data from Developing Countries,” Policy Research Working Paper No. 9812 (World Bank Group, October 2021), Open Knowledge Repository
Chapter 5 Industry Case Studies
Section 5.1 Electricity
64 M. Volkert and B. Klagge. “Electrification and Devolution in Kenya: Opportunities and Challenges.” Energy for Sustainable Development 71 (2022): 541-553. https://doi.org/10.1016/j esd.2022.07.005.
65 “Ministry of Energy”, KenGen, accessed December 31, 2025, https://www.kengen.co.ke/index.php/ our-company/ministry-of-energy.html
66 “About Us”, Kenya Power, accessed December 12, 2025, https://www.kplc.co.ke/aboutus#:~:text=The%20Government%20of%20 Kenya%20(GoK,interests%20with%20global%20 best%20practices.
67 Electricity Act, No. 11 of 1997 (Kenya), accessed December 12, 2025, https:// kenyalaw.org/kl/fileadmin/pdfdownloads/Acts/ ElectricPowerActCap314.PDF
68 Catrina Godinho and Anton Eberhard, Learning from Power Sector Reform: The Case of Kenya, Policy Research Working Paper 8819 (Washington, DC: World Bank, 2019), https://documents1. worldbank.org/curated/en/451561555435655366/ pdf/Learning-from-Power-Sector-Reform-The-Caseof-Kenya.pdf
69 Max Roser, “From 5% to 76% in 30 years: Kenya has made substantial progress in providing access to electricity,” Our World in Data, October 22, 2025, https://ourworldindata.org/data-insights/ kenya-has-made-substantial-progress-in-providingaccess-to-electricity.
70 International Energy Agency, “Kenya’s energy sector is making strides toward universal electricity access, clean cooking solutions and renewable energy development,” IEA News, April 14, 2025, https://www.iea.org/news/kenyas-energy-sectoris-making-strides-toward-universal-electricityaccess-clean-cooking-solutions-and-renewableenergy-development
71 United Nations Economic Commission for Africa (UNECA) and RES4Africa Foundation, Regulatory Review of the Electricity Market in Kenya: Towards Crowding-in Private Sector Investment (Addis Ababa: UNECA and RES4Africa, 2022). https:// res4africa.org/wp-content/uploads/2023/04/ RegulatoryReviewofElectricityMarketinKenya.pdf
72 International Energy Agency, “Kenya’s energy sector is making strides toward universal electricity access, clean cooking solutions and renewable energy development,” IEA News, April 14, 2025, https://www.iea.org/news/kenyas-energy-sectoris-making-strides-toward-universal-electricityaccess-clean-cooking-solutions-and-renewableenergy-development
73 International Energy Agency. Kenya 2024: Energy Policy Review. Paris: IEA, 2024, 29. https://iea. blob.core.windows.net/assets/98bc7ce1-b22d48c9-9ca2-b668ffbfcc4b/Kenya2024.pdf
74 Catrina Godinho and Anton Eberhard, Learning from Power Sector Reform: The Case of Kenya, Policy Research Working Paper 8819 (Washington, DC: World Bank, 2019), https://documents1. worldbank.org/curated/en/451561555435655366/ pdf/Learning-from-Power-Sector-Reform-The-Caseof-Kenya.pdf .
75 Ryan Gregory and Benjamin K. Sovacool, The Financial Risks and Barriers to Electricity Infrastructure in Kenya, Tanzania, and Mozambique (Brighton: University of Sussex, Science Policy Research Unit (SPRU), 2019). https://doi.
org/10.1016/j.enpol.2018.10.026
76 National Assembly, Departmental Committee on Energy, Report on the Inquiry into the Matter of the Reduction of Electricity Costs in the Country (November 25, 2024), Library, Parliament of Kenya, https://libraryir.parliament.go.ke/items/20ccd752c0db-4cb1-b9fc-01a85197d6bb.
77 Ibid.
78 Ibid.
79 Ibid.
80 Ibid.
81 Ibid.
82 Ibid.
83 Thomas Mukhwana, “Conflict of Interest: The Insider Deals and Offshore Companies Behind Kenya’s High Energy Costs, Part 1,” Africa Uncensored, May 5, 2025, https:// africauncensored.online/blog/2025/05/05/powerplays-the-insider-deals-and-offshore-companiesbehind-kenyas-high-energy-costs/
84 Ibid.
85 National Assembly, Departmental Committee on Energy, Report on the Inquiry into the Matter of the Reduction of Electricity Costs in the Country (November 25, 2024), Library, Parliament of Kenya, https://libraryir.parliament.go.ke/items/20ccd752c0db-4cb1-b9fc-01a85197d6bb
86 Conflict of Interest Act, No. 11 of 2025. Laws of Kenya. Assented July 30, 2025; commenced August 19, 2025. https://new.kenyalaw.org/akn/ke/ act/2025/11.
87 Leadership and Integrity Act, Cap. 185C. Laws of Kenya. Assented August 27, 2012. https://new. kenyalaw.org/akn/ke/act/2012/19
88 Presidential Taskforce on the Review of Power Purchase Agreements (PPAs), Report of the Presidential Taskforce on the Review of Power Purchase Agreements (PPAs) (Nairobi: Government of Kenya / Kenya Power, 2021), https://www.kplc. co.ke/storage/01J6V8AZ8F20NK3EJ8W48S8ZN7.pdf
89 Ibid.
90 John Mutua, “MPs lift freeze on new power purchase deals to avert crisis,” Business Daily, November 12, 2025, https://www.businessdailyafrica.com/bd/ corporate/industry/mps-lift-freeze-on-new-powerpurchase-deals-to-avert-crisis-5262458
91 National Assembly of Kenya, Departmental Committee on Energy. Report of the Departmental Committee on Energy on the Inquiry into the Matter of the Reduction of Electricity Costs in the Country. Nairobi: Parliament of Kenya, November 2025. Accessed November 2025. https://www.parliament. go.ke/sites/default/files/2025-11/Report%20of%20 DC%20Energy%20on%20inquiry%20into%20 the%20matter%20of%20the%20reduction%20 of%20electricity%20costs%20in%20the%20
and
country.pdf
92 National Assembly, Departmental Committee on Energy, Report on the Inquiry into the Matter of the Reduction of Electricity Costs in the Country (November 25, 2024), Library, Parliament of Kenya, https://libraryir.parliament.go.ke/items/20ccd752c0db-4cb1-b9fc-01a85197d6bb.
93 Thomas Garner. 2025. “Political Interference Nearly Crippled South Africa’s Energy Landscape.” Daily News (Durban), August 6, 2025. https://dailynews. co.za/business-report/opinion/2025-08-06-politicalinterference-nearly-crippled-south-africas-energylandscape/.
94 John Mutua. “MPs Propose to Cap Wholesale Power Prices at Sh 9 per Unit.” Business Daily Africa, November 16, 2024. Accessed November 19, 2025. https://www.businessdailyafrica.com/bd/economy/ mps-propose-to-cap-wholesale-power-prices-atsh9-per-unit-5218188.
95 Ishmael Ackah and Rushaiya Ibrahim-Tanko. 2025. “Flipping the Switch: How Regulatory Institutions Can Improve Power Deals Through Transparency and Standardization.” Energy for Growth Hub, June 4, 2025. https://energyforgrowth.org/article/ flipping-the-switch-how-regulatory-institutions-canimprove-power-deals-through-transparency-andstandardization/.
96 Anton Eberhard, James Leigland, and Joel Kolker, South Africa’s Renewable Energy IPP Procurement Program (Washington, DC: World Bank Publications, 2014). https://openknowledge.worldbank.org/ entities/publication/141693cf-1ed8-587d-9f300a7ef30c4998
97 Marie Volkart and Britta Klagge. “Electrification and devolution in Kenya: Opportunities and challenges.” Energy for Sustainable Development 71 (2022): 541-553. https://doi.org/10.1016/j. esd.2022.10.022
98 Energy and Petroleum Regulatory Authority (EPRA), Bi-Annual Energy & Petroleum Statistics Report, Financial Year 2024/2025 (Nairobi: EPRA, 2025), 10. https://www.epra.go.ke/sites/ default/ files/2025-09/Statistics-Report-June-2025Web.pdf
99 Energy and Petroleum Regulatory Authority (EPRA), Bi-Annual Energy & Petroleum Statistics Report, Financial Year 2024/2025 (Nairobi: EPRA, 2025), 10–12. https://www.epra.go.ke/sites/default/ files/2025-09/Statistics-Report-June-2025-Web.pdf
100 Republic of Kenya, Kenya National Energy Compact (2025–2030) (Nairobi: Ministry of Energy and Petroleum, 2025), 12–13. https://energy. go.ke/sites/default/files/Kenya%20National%20 Energy%20Compact%20Draft%20%202.pdf
Section 5.2 Digital Finance
101 Isaac Mbiti and David N. Weil. 2014. “Mobile Banking: The Impact of M-Pesa in Kenya.” NBER Working Paper, June 2014. Cambridge, MA: National Bureau of Economic Research. https:// www.nber.org/system/files/chapters/c13367/
revisions/c13367.rev1.pdf
102 Wolfgang Fengler, “How Kenya Became a World Leader for Mobile Money.” World Bank AfricaCan, July 16, 2012. https://blogs.worldbank.org/en/ africacan/how-kenya-became-a-world-leader-formobile-money.
103 Central Bank of Kenya. n.d. “Mobile Payments.” Accessed November 15, 2025. https://www. centralbank.go.ke/national-payments-system/ mobile-payments/. Vodafone Group. n.d. “M-PESA.” Accessed November 15, 2025. https://www. vodafone.com/about-vodafone/what-we-do/mpesa.
104 Central Bank of Kenya. n.d. “Mobile Payments.” Accessed November 15, 2025. https://www. centralbank.go.ke/national-payments-system/ mobile-payments/; and Ndung’u, Njuguna S. 2021. “A Digital Financial Services Revolution in Kenya: The M-Pesa Case Study.” Nairobi: African Economic Research Consortium. https://aercafrica.org/oldwebsite/wp-content/uploads/2021/03/AERC-MPesaCase-Study.pdf.
105 Alliance for Financial Inclusion. 2012. “Safaricom, CBA Launch Groundbreaking Mobile Banking Service M-Shwari.” Alliance for Financial Inclusion, November 28, 2012. https://www.afi-global.org/ news/safaricom-cba-launch-groundbreakingmobile-banking-service-m-shwari/.
106 KCB Group. “Safaricom and KCB Launch Fuliza Ya Biashara Overdraft.” May 4, 2023. https:// ke.kcbgroup.com/about-us/news-room/business/ safaricom-and-kcb-launch-fuliza-ya-biasharaoverdraft
107 Central Bank of Kenya. “Twenty Seven More Digital Credit Providers Licensed.” Accessed December 1, 2025. http://centralbank. go.ke/2024/10/01/10799/
108 Making Digital Credit Truly Responsible: Insights from Analysis of Digital Credit in Kenya. Center for Financial Inclusion, 2019. https://www. centerforfinancialinclusion.org/wp-content/ uploads/2024/02/Digital-Credit-Kenya-Final-report. pdf
109 Central Bank of Kenya. “National Payments System.” Accessed December 1, 2025. https:// www.centralbank.go.ke/national-payments-system/
110 The National Payment System Act, 39 (2011). https://www.centralbank.go.ke/wp-content/ uploads/2016/08/NATIONAL-PAYMENT-SYSTEMACT-No-39-of-2011-21.pdf
111 Juliet Mburu. “The Rise of a New Dawn in Kenya’s Payments System.” FSD Kenya, April 26, 2018. https://www.fsdkenya.org/blogs-publications/blog/ why-is-mobile-money-interoperability-importantfor-kenya/.
112 Central Bank of Kenya. Press Release: Launch of Mobile Money Merchant Interoperability. April 8, 2022. Accessed January 19, 2026. https://www.centralbank.go.ke/uploads/ press_releases/1691854698_Press%20
Release%20-Mobile%20Money%20Merchant%20 Interoperability.pdf; and Central Bank of Kenya. Press Release: Full Interoperability of Mobile Money Operators Becomes Effective. April 11, 2011. Accessed January 19, 2026. https://www.centralbank.go.ke/uploads/press_ releases/1178640578_Press%20Release%20-%20 Full%20Interoperability%20of%20Mobile%20 Money%20Operators%20Becomes%20Effective. pdf
113 Harry Njuguna, “Airtel Money Gains Ground as M-Pesa Market Share Falls Below 91%,” The Kenyan Wall Street, July 1, 2025, https://kenyanwallstreet. com/airtel-money-gains-ground-as-m-pesamarket-share-falls-below-91.
114 Safaricom PLC. Safaricom Announces Largest M-PESA Upgrade Yet, Ushering in the Next Generation of Innovation. September 19, 2025. Accessed January 19, 2026. https://www. safaricom.co.ke/media-center-landing/pressreleases/safaricom-announces-largest-m-pesaupgrade-yet-ushering-in-the-next-generationof-innovation; and Tech in Africa, “Safaricom Unveils Fintech 2.0, Revolutionizing M-PESA with AI-Enhanced Capacity and Future-Ready Infrastructure,” Tech in Africa, September 19, 2025, accessed January 19, 2026, https://www. techinafrica.com/safaricom-unveils-fintech-2-0revolutionizing-m-pesa-with-ai-enhanced-capacityand-future-ready-infrastructure/.
115 Harry Njuguna, “Airtel Money Gains Ground as M-Pesa Market Share Falls Below 91%,” The Kenyan Wall Street, July 1, 2025, https://kenyanwallstreet. com/airtel-money-gains-ground-as-m-pesamarket-share-falls-below-91
116 The National Payment System Act, 39 (2011). https://www.centralbank.go.ke/wp-content/ uploads/2016/08/NATIONAL-PAYMENT-SYSTEMACT-No-39-of-2011-21.pdf; and GSMA. “Kenya’s New Regulatory Framework for E-Money Issuers.” GSMA Mobile for Development, June 14, 2025 (originally published August 21, 2014). Accessed January 19, 2026. https://www.gsma.com/ solutions-and-impact/connectivity-for-good/mobilefor-development/country/kenya/kenyas-newregulatory-framework-for-e-money-issuers/.
117 “Welcome to Competition Authority of Kenya,” Competition Authority of Kenya, accessed December 1, 2025, https://www.cak.go.ke/
118 Lilian Ochieng’, “CAK Orders Safaricom to Open up M-Pesa,” Daily Nation, June 29, 2010, https:// nation.africa/kenya/business/CAK-ordersSafaricom-to-open-up-M-Pesa/996-239963269n55oz/index.html
119 “What We Do,” Communications Authority of Kenya, accessed December 1, 2025, https://www.ca.go. ke/what-we-do.
120 Central Bank of Kenya, National Payments Strategy 2022-2025, Central Bank, 2022, https://www. centralbank.go.ke/wp-content/uploads/2022/02/ National-Payments-Strategy-2022-2025.pdf
121 Tavneet Suri and William Jack, “The long-run poverty and gender impacts of mobile money,” Science 354, no. 6317 (2016): 1288, https://doi. org/10.1126/science.aah5309
122 Adonijah Ndege, “Why Kenya wants to cut M-PESA, Airtel Money transaction fees,” Techcabal, September 9, 2025, https://techcabal. com/2025/09/29/why-kenya-cut-m-pesa-airtelmoney-fees/
123 Njuguna S. Ndung’u, “Digitalization in Kenya,” in Digital Revolutions in Public Finance, ed. Sanjeev Gupta, Michael Keen, Alpa Shah, and Genevieve Verdier (International Monetary Fund, 2017), https://doi.org/10.5089/9781484315224.071.
124 M-KOPA staff, interview by SPIA Policy Workshop team, October 24, 2025.
125 Raisa Fabregas and Tite Yokossi, “Mobile Money and Economic Activity: Evidence from Kenya,” World Bank Econ Rev 36, vol. 3 (May 2022): 734-756, https://doi.org/10.1093/wber/lhac007.
126 Margaret S. McMillan and Dani Rodrik, “Globalization, Structural Change, and Productivity Growth,” National Bureau of Economic Research, Working Paper 17143 (June 2011), https://www. nber.org/system/files/working_papers/w17143/ w17143.pdf.
127 Matthew Tyce. “Beyond the neoliberal-statist divide on the drivers of innovation: A political settlements reading of Kenya’s M-Pesa success story,” World Development 125 (2020): 9, https:// doi.org/10.1016/j.worlddev.2019.104621.
128 Juliet Mburu, “The rise of a new dawn in Kenya’s payments system,” FSD Kenya, April 26, 2018, https://www.fsdkenya.org/blogs-publications/blog/ why-is-mobile-money-interoperability-importantfor-kenya/.
129 Former Competition Authority official, interview by SPIA Policy Workshop team, October 16, 2025.
130 OECD, Rethinking Antitrust Tools for Multi-Sided Platforms (OECD Publishing, 2018), https://doi. org/10.1787/a013f740-en.
131 Michael Katz and Carl Shapiro, “Network Externalities, Competition, and Compatibility,” The American Economic Review Vol. 75, No. 3 (June 1985): 424-440, https://idv.sinica.edu.tw/kongpin/ teaching/io/KatzShapiro1.pdf.
132 Matthew Tyce. “Beyond the neoliberal-statist divide on the drivers of innovation: A political settlements reading of Kenya’s M-Pesa success story,” World Development 125 (2020), https://doi. org/10.1016/j.worlddev.2019.104621
133 “The CBK (Digital Credit Providers) Regulations – 2022,” CIS Kenya, published August 1, 2022, https://ciskenya.co.ke/the-cbk-digital-creditproviders-regulations-2022/.
134 Matthew Tyce. “Beyond the neoliberal-statist divide on the drivers of innovation: A political settlements reading of Kenya’s M-Pesa success
Governance, Entrepreneurship, and Job Creation in Kenya
story,” World Development 125 (2020), https://doi. org/10.1016/j.worlddev.2019.104621
135 Benadeta Mwaura, “Safaricom Eyes KSh 150 Billion Earnings Surge in FY26 as Data and M-Pesa Lead Growth,” Dawan, November 5, 2025, https://www. dawan.africa/news/safaricom-eyes-ksh-150-billionearnings-surge-in-fy26-as-data-and-m-pesa-leadgrowth
136 Financial services think tank staff, interview conducted by SPIA Policy Workshop team, October 16, 2025.
137 Central Bank of Kenya, National Payments Strategy 2022-2025, Central Bank, 2022, https://www. centralbank.go.ke/wp-content/uploads/2022/02/ National-Payments-Strategy-2022-2025.pdf
138 Central Bank of Kenya, National Financial Inclusion Strategy (2025-2028), CBK, 2025, https://www. centralbank.go.ke/wp-content/uploads/2025/09/ Kenya-National-Financial-InclusionStrategy-2025-2028.pdf.
139 Judith Mwangoe and Njeri Macharia, “The next chapter in Kenya’s digital payment revolution,” MicroSave Consulting, July 8, 2025, https://www. microsave.net/2025/07/08/the-next-chapter-inkenyas-digital-payment-revolution/
140 Adonijah Ndege, “Why Kenya wants to cut M-PESA, Airtel Money transaction fees,” Techcabal, September 9, 2025, https:// techcabal.com/2025/09/29/why-kenya-cut-m-pesaairtelmoney-fees/
141 Francis Annan, “Randomized Entry: The Equilibrium Effects of Entry in Digital Financial Markets,” National Bureau of Economic Research, Working Paper 33134 (October 2024): 1-90, https://www. nber.org/system/files/working_papers/w33134/ w33134.pdf
142 Central Bank of Kenya, National Payments Strategy 2022-2025, Central Bank, 2022, https://www.centralbank.go.ke/wpcontent/uploads/2022/02/ National-PaymentsStrategy-2022-2025.pdf.
143 Maria Nkhonjera, “Competition Authohrity of Kenya (CAK) rules on USSD pricing,” Center for Competition, Regulation, and Economic Development Quarterly Review, April 12, 2017, https://www.competition.org.za/ccred-blogcompetition-review/2017/4/12/competitionauthority-of-kenya-cak-rules-on-ussd-pricing.
144 Ken Abuya, “Safaricom’s Ziidi money market fund on the spot over anti-competitive behavior,” Techcabal, June 17, 2025, https://techcabal. com/2025/06/17/safaricom-ziidi-on-the-spot-overanti-competitive-behaviour/
145 Matthew Tyce. “Beyond the neoliberal-statist divide on the drivers of innovation: A political settlements reading of Kenya’s M-Pesa success story,” World Development 125 (2020): 10, https://doi. org/10.1016/j.worlddev.2019.104621
146 Juliet Mburu, “The rise of a new dawn in Kenya’s
payments system,” FSD Kenya, April 26, 2018, https://www.fsdkenya.org/blogs-publications/ blog/ why-is-mobile-money-interoperability-importantfor-kenya/
147 Judith Mwangoe and Njeri Macharia, “The next chapter in Kenya’s digital payment revolution,” MicroSave Consulting, July 8, 2025, https://www. microsave.net/2025/07/08/the-next-chapter-inkenyas-digital-payment-revolution/
148 Kenya Open Finance Initiative, Unlocking open finance in Kenya: Opportunities for Kenya’s financial sector, FSD Kenya, July 2025, https:// www.fsdkenya.org/wp-content/uploads/2025/09/ Unlocking-open-finance-in-Kenya-Opportunities-forKenyas-financial-sector.pdf
149 Radha Upadhyaya, Keren Weitzberg, and Linda Bonyo, “Digital Credit Providers, Regulatory Frameworks, and Structural Power: A Case Study of Digital Microcredit Regulation in Kenya,” Finance and Society 11, no. 2 (2025): 186–208, https:// doi.org/10.1017/fas.2025.4.
150 Steve Mbego, “Kenya Plans Cut in Mobile Money Fees to Drive Digital Finance” CIO Africa, September 29, 2025, https://cioafrica.co/kenyaplans-57-cut-in-mobile-money-fees-to-drive-digitalfinance/
151 Mwakaneno Gakweli, “Kenya’s Central Bank Announces Expiry of Waiver for Mobile Transactions, Kenyan Wall Street, December 17, 2020, https:// kenyanwallstreet.com/expiry-of-waiver-for-mobiletransactions
152 Luca A. Ricci et al., “Digital Payment Innovations in Sub-Saharan Africa,” International Monetary Fund Vol. 2025, no. 004 (June 2025), https://doi. org/10.5089/9798400232220.087.
153 Mehmet Kerse, Patrick Meagher, and Stefan Staschen, The Use of Agents by Digital Financial Services Providers, CGAP, February 2020, https://documents1.worldbank.org/curated/ en/854171625139317535/pdf/The-Use-of-Agentsby-Digital-Financial-Services-Providers-TechnicalNote.pdf.
154 Organisation for Economic Co-operation and Development (OECD). 2024. Open Finance and Open Banking in sub-Saharan Africa. Paris: OECD. https://www.oecd.org/content/dam/ oecd/en/topics/policy-sub-issues/digital-finance/ Open-Finance-in-Africa-and-Open%20 Banking-in-sub-Saharan-Africa.pdf.
155 Burite, Joseph. 2025. “Kenya Open Banking 2026: CBK Timeline, API Rules, Who’s Ready.” Africa Biz News (Kenya), November 21, 2025. https:// africabiznews.com/ke/policy/kenya-open-banking2026-cbk-timeline-api-rules-whos-ready
156 Nathan Davids, “A forced unbundling of Safaricom PLC to (1) core telco, (2) towers, and (3) M-PESA Africa would be the single biggest restructure in Kenya’s digital economy since mobile money was born,” LinkedIn, September 2025, https://www.linkedin.com/ posts/nathan-davids-164753102_a-forced-un-
bundling-of-safaricom-plc-into-activity-7365971288781201408-zvYo/.
157 Adonijah Ndege, “South Africa’s Vodacom Resists Kenyan Push to Split M-Pesa from Safaricom,” Techcabal, November 12, 2025, https://techcabal. com/2025/11/12/vodacom-rejects-kenyas-pushspin-off-m-pesa-safaricom/.
158 Lennox Yieke, “Is Safaricom’s M-Pesa Ready and Able to Go it Alone?” African Business, https:// african.business/2024/05/technology-information/ is-safaricoms-m-pesa-ready-and-able-to-go-italone.
159 Communications Authority of Kenya. Fourth Quarter Sector Statistics Report for the Financial Year 2024/2025 (1st April – 30th June 2025). Nairobi: Communications Authority of Kenya, June 30, 2025. Accessed January 19, 2026. https://www.ca.go. ke/sites/default/files/2025-09/Sector%20Statistics%20Report%20Q4%202024-2025_1.pdf
160 Paelo, Anthea, and Simon Roberts. “Competition and Regulation of Mobile Money Platforms in Africa: A Comparative Analysis of Kenya and Uganda.” Review of Industrial Organization 60, no. 3 (2022): 463–489. https://doi.org/10.1007/s11151-022-09858-x
Section 5.3 Coffee
161 OEC World, “Kenya (KEN) Profile,” accessed December 17, 2025, https://oec.world/en/profile/ country/ken
162 Agriculture and Food Authority (AFA), Coffee Directorate. Coffee Year Book 2023/24. Nairobi: Agriculture and Food Authority, 2025.
163 Carolyn Barnes, “An Experiment with Coffee Production by Kenyans, 1933–48,” The Journal of Developing Areas 6, no. 3 (April 1972): 365–81, https://www.jstor.org/stable/3601565
164 Library of Congress – Federal Research Division, Country Profile: Kenya, June 2007, PDF, accessed December 17, 2025, https://tile.loc.gov/storageservices/master/frd/copr/Kenya.pdf
165 World Bank, Commodity Markets (January 2022), PDF, accessed December 17, 2025, https://thedocs. worldbank.org/en/doc/b4ff84b2d5dc4d0963a5 074102460cc1-0350012022/original/CommodityMarkets.pdf
166 World Bank, Commodity Markets Outlook –Historical Data Annual, PDF, accessed December 17, 2025, https://thedocs.worldbank.org/en/ doc/762021467756367813-0050022016/render/ CMOHistoricalDataAnnual.pdf
167 Agriculture and Food Authority (AFA), Coffee Directorate. Coffee Year Book 2023/24. Nairobi: Agriculture and Food Authority, 2025.
168 Food and Agriculture Organization of the United Nations (FAO), OpenKnowledge FAO bitstream document, PDF, accessed December 17, 2025, https://openknowledge.fao.org/server/api/ core/bitstreams/939ddc6a-5fff-4fcd-aae8-
3f9d152a848b/content
169 BFAP (Bureau for Food and Agricultural Policy), Coffee Deep Dive Report, March 2023, PDF, accessed December 17, 2025, https://www.bfap. co.za/wp-content/uploads/2023/03/Coffee_Deep_ Dive_Report.pdf
170 Mungai v. Kenya Planters Cooperative Union Limited (In Liquidation) & 2 others (Environment & Land Case 8 of 2018) [2024] KEELC 7448 (KLR) (Judgment of November 7, 2024), New Kenya Law, https://new.kenyalaw.org/akn/ke/judgment/ keelc/2024/7448/eng@2024-11-07
171 New Kenya Planters Cooperative Union PLC (NKPCU), “FAQs,” accessed December 17, 2025, https://www.newkpcuplc.go.ke/faqs
172 Christopher Feran, “Kenya and ‘the decline of the world’s greatest coffee’”, Christopher Feran (blog), December 25, 2021, https://christopherferan. com/2021/12/25/kenya-and-the-decline-of-theworlds-greatest-coffee/
173 US Department of Agriculture, Coffee Annual (USDA Foreign Agricultural Service, 2025), https://apps.fas.usda.gov/newgainapi/ api/Report/DownloadReportByFileName? fileName=Coffee+Annual_Nairobi_Kenya_KE20250011.pdf
174 Patrick Nyakundi, “Kenya Sets Ambitious Target to Triple Coffee Production by 2029.” Government Advertising Agency, June 27. https://www.mygov. go.ke/kenya-sets-ambitious-target-triple-coffeeproduction-2029
175 Ministry of Agriculture and Livestock Development of Kenya. 2024. Coffee Development and Marketing Strategy. https://kilimo.go.ke/wp-content/ uploads/2024/10/Final-Draft-Coffee-Developemntand-Marketing-Strategy-27-Jan-2024-1.pdf
176 The Coffee Bill, 2023, No. 10 (2023). https:// www.parliament.go.ke/sites/default/files/2024-07/ The%20Coffee%20Bill%20%28Senate%20Bill%20 No.%2010%20of%202023%29.pdf.
177 Kenya, Ministry of Agriculture, Livestock, Fisheries and Irrigation. The Crops (Coffee) (General) Regulations, 2019. Kenya Gazette Supplement No. 100, Legal Notice No. 102 (1 July 2019). Nairobi: Government Printer.
178 Peter Gakuo, “Reforms Hope to Change Kenyan Coffee for the Better.” Coffee Inteligence, September 13. https://intelligence.coffee/2023/09/ reforms-kenyan-coffee/.
179 Nairobi Coffee Exchange. 2024. The (Nairobi) Coffee (Exchange Trading), Rules, 2024. Nairobi, Kenya. https://www.nairobicoffeeexchange.co.ke/ downloads/ncetradingrules2024finaldraft/20
180 United Nations Industrial Development Organization, Kenya Coffee Value Chain Analysis, (UNIDO, n. d.).
181 Boniface Gikandi, “Coffee Reforms Standoff Persists as CS Appoints Transition Team.” Standard Media,
Governance, Entrepreneurship, and Job Creation in Kenya
December 11, 2023. Accessed January 19, 2026. https://www.standardmedia.co.ke/business/ business/article/2001487061/coffee-reformsstandoff-persists-as-cs-appoints-transition-team
182 Sacco Times, “Coffee Cartels on Edge as Kenya Prepares to Launch Global Online Auction,” Sacco Times, October 6, 2025, https://saccotimes.co.ke/ coffee-cartels-on-edge-as-kenya-prepares-tolaunch-global-online-auction/
183 Kenya Agriculture and Food Authority, Coffee Year Books 2021/22 (AFA, 2022), https://www.afa. go.ke/download/3192/?tmstv=1749542569
184 Rocco Macchiavello and Ameet Morjaria. 2020. “Competition and Relational Contracts in the Rwanda Coffee Chain.” Oxford University Press.
185 Fabrizio Leone, Rocco Macchiavello, Josepa MiquelFlorensa, and Nicole Pavanini. 2025. Market Structure, Vertical Integration and Farmers’ Welfare in Costa Rica Coffee Industry. No. 11776. Cesigo Working Papers.
186 Ibid.
187 Antonella Samoggia and Andrea Fantini. 2023. “Revealing the Governance Dynamics of the Coffee Chain in Colombia: A State-of-the-Art Review.” Sustainability.
188 Caldarelli, Carlos Eduardo, Leandro Gilio, and David Zilberman. 2018. “The Coffee Market in Brazil: Challenges and Policy Guidelines.” Revista de Economia 39 (69). https://revistas.ufpr.br/ economia/article/view/67891/38882
189 Willem Boot, “Chapter 27: Ethiopia.” In Coffee: A Comprehensive Guide to the Bean, the Beverage, and the Industry. Rowmand & Littlefield.
Chapter 6 Economy-Wide Policy Recommendations
190 Oscar M. Otele, Samuel Balongo and Daniel Iberi, “AD1052: In Kenya, public trust in institutions and leaders is on a downward slide,” Afrobarometer, September 26, 2025, https://www.afrobarometer. org/publication/ad1052-in-kenya-public-trust-ininstitutions-and-leaders-is-on-a-downward-slide/.
191 “E-Government Procurement (e-GP) System Roll out by July 1, 2025,” Kenya Law Reform Commission, accessed December 18, 2025, https:// www.klrc.go.ke/index.php/media-center/738-egovernment-procurement-e-gp-system-roll-out-byjuly-1-2025.
192 “Governors Demand Review of E-Government Procurement Rollout,” Capital News, September 29, 2025, https://www.capitalfm.co.ke/news/2025/09/ governors-demand-review-of-e-governmentprocurement-rollout/
193 Edwin Mutai, “MPs again reject e-procurement order by National Treasury, Daily Nation, October 21, 2025, https://nation.africa/kenya/business/ mps-again-reject-e-procurement-order-bynational-treasury--5238252#storyhttps://www. mapsinitiative.org/en.html
194 “About MAPS,” Methodology for Assessing Procurement Systems, accessed December 18, 2025, https://www.mapsinitiative.org/en.html
195 Emmanuele Colonnelli, Francesco Loiacono, Edwin Muhumuza, and Edoardo Teso, “Do Information Frictions and Corruption Perceptions Kill Competition? A Field Experiment on Public Procurement in Uganda,” National Bureau of Economic Research, Working Paper 32170 (February 2024): http://www.nber.org/papers/ w32170
196 “New County Licensing Rules Promise Faster Approvals for Businesses Nationwide,” Law Guide, accessed December 18, 2025, https://lawguide. co.ke/new-county-licensing-rules-promise-fasterapprovals-for-businesses-nationwide/
197 “Council of Governors and private sector in plan to boost inter-county trade efficiencies,” Citizen Daily, February 2, 2024, https://www.citizen. digital/article/council-of-governors-and-privatesector-in-plan-to-boost-inter-county-tradeefficiencies-n335983.
198 State Department for Investment Promotion, “Ministry of Investments, Trade and Industry (MITI) Launches County Competitiveness Index to Boost County-Level Investments,” MITI, October 31, 2025, https://www.investmentpromotion.go.ke/ ministry-investments-trade-and-industry-mitilaunches-county-competitiveness-index-boostcounty
199 Githinji Njenga, Samuel Kaunde, Ian Kiprop, and Alfred Otieno, “County Business Environment for Micro and Small Enterprises in Kenya 2024,” Kenya Institute for Public Policy Research and Analysis, Special Paper No. 37 (2024), https://repository. kippra.or.ke/server/api/core/bitstreams/65623250bab8-4232-b2df-7993cb746bbd/content
200 Clarice Wambua and Lauriene Maingi, “Key Highlights of Kenya’s Public Participation Bill, 2024,” CDH, November 13, 2024, https:// www.cliffedekkerhofmeyr.com/en/news/ publications/2024/Practice/Corporate/corporatecommercial-alert-13-November-2024-keyhighlights-of-kenyas-public-participation-bill-2024.
201 “Enhance public participation and civic engagement (KENMS0004),” Open Government Partnership, Accessed December 19, 2025, https://www. opengovpartnership.org/members/nairobi-kenya/ commitments/kenms0004/.
202 Irungu Houghton, “Could the Public Participation Bill Fix Our Current Tensions?” Amnesty International, August 11, 2025, https://www.amnestykenya.org/ could-the-public-participation-bill-fix-our-currenttensions/
(This page intentionally left blank)
