




































































This article considers just how much microplastic pollution really originates from road markings.
Microplastic emissions from road markings are negligible, in both absolute and relative quantities. is is because road markings are protected by glass beads during functional service life and mostly renewed before they can be abraded. e European Union Road Federation combined the position papers of road markers and academic research into this topic – abrasion was consistently estimated at about 5% and not 100%, as has been claimed in some theoretical assessments.
Road markings (in North America called pavement markings) are present on almost all paved roads worldwide. While there is a considerable amount of research related to the visibility of road markings and their impact on drivers[1], they are weakly described from a materials perspective. Road markings are a speci c type of industrial maintenance coatings that are a dual-layer system. e bottom coating layer is protected from abrasion by the top layer of glass beads[2]. e glass beads layer also provides retrore ectivity, which is determining the functional service life of
road markings. Road markings are required to be homologated before their use is permitted; in most cases, the performance parameters that include retrore ectivity (measured through the coe cient of retrore ected luminance, RL) must be maintained throughout the entire service life[3,4]
e coating layer of road markings usually contains polymeric binder; thus, when abraded, it could contribute to microplastic pollution. Typically, microplastics are divided into primary (plastic particles designed in small dimensions) and secondary (resulting from the disintegration of larger polymers) –those originating from road markings clearly belong to the latter.
According to a regulation proposed in the European Union[5], secondary microplastics are de ned as pieces of synthetic polymers, other than liquid or fully biodegradable polymers, with dimensions 0.0001–5mm. Also, if any particle of such dimensions contains more than 0.01% of such polymer, it is to be considered a microplastic in its entirety. While it would be forbidden to sell such microplastics, there would be numerous derogations permitting the vast majority of
the contemporary uses. Nonetheless, excessive reporting would be demanded. Road markings would be within the scope of the proposed legislation.
ere are several reports claiming that road markings contribute about 7% of all microplastics released to the oceans (note that these estimates were not subjected to scienti c peer-review and were not based on eld research). However, the assumptions that permitted for estimating such enormous quantities were fundamentally wrong – the role of glass beads and the renewal procedures were omitted. Because the clear distinction between functional and physical service life of road markings was lost, almost 100% abrasion was assumed, which was plainly incorrect. From the perspective of scienti c integrity, it is quite disturbing that in many cases, despite warnings of uncertainty (like data “almost or completely non-existing and believed essential to know”), the data was considered robust. Overall, the various theoretical emission estimates available in the literature were inconsistent, lacked any scienti c foundation and the absence of knowledge about actual road marking practice was evident[6]
Contrary to the very high estimated contribution of road markings to microplastic pollution, the reports of their identification in the environment were extremely sparse. Pieces of road markings could not be identified in road dust, highway runoff or sludge in wastewater treatment plants - even in road tunnels and snow banks. Unequivocal assignment of fragments of road markings was reported in only a few cases, which could be clearly connected with either grossly negligent maintenance (particles of old paint detached from the roadway) or with special abrasion conditions (the use of studded tyres in Sweden). This obvious incongruity –reported enormous emissions and the lack of positive identification – should have raised concerns.
To elucidate such discord in data, research into this topic was started in cooperation between the industry and academia[7] Researchers went into the field and analysed the abrasion of road markings. Instead of the previously claimed 100% abrasion[8], the measurements on pedestrian crossings (the possible worst-case scenario due to heavy traffic load) found that it was 0.2-22.1%.
Even though the measurements were done in heavily trafficked areas, the observed
abrasion was quite low; consequently, the emissions were calculated to be at least an order of magnitude lesser than previously thought. Hence, it should be claimed that less than 0.7% of microplastics from the considered sectors originates from road markings, not 7%.
On average, the microplastic emissions from road markings were estimated at 0.2–28.2g/person/year (instead of 19.3–121.1g/ person/year, as was previously stated). The calculated potential microplastic emissions are shown in Table 1 (data was adjusted to account for the use of non-polymeric binders in thermoplastic road markings, which was omitted in the original research paper).
The key knowledge gained from that field assessment included the following:
• The end of the functional service life of road markings (defined as a drop of RL below the locally set minimum acceptable value) occurs much earlier than the end of their physical service life (i.e., physical abrasion of the coating layer).
• At the end of functional service life, the coating layer is still protected by a layer of glass beads — because only the glass beads layer provides retroreflectivity, not the coating layer.
• Upon reaching the end of functional service life, road markings are renewed with another layer of the coating and the glass beads, which results in the stacking of layers.
• Within the period of functional service life, and even afterwards, the abrasion of the coating layer is marginal or does not occur. Hence, the thickness of road markings does not change. Considerable abrasion can commence only when the glass beads are physically removed.
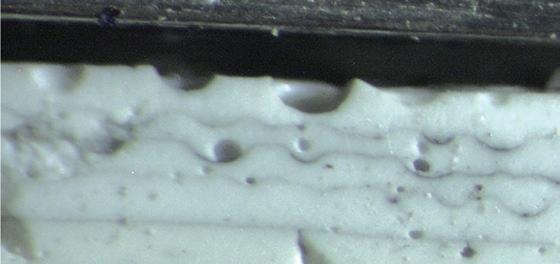
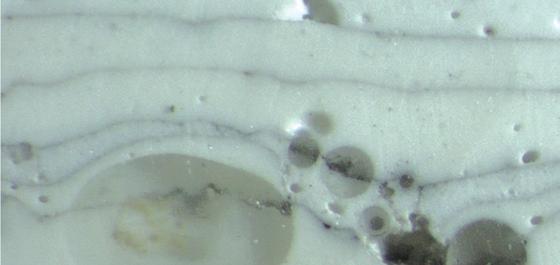
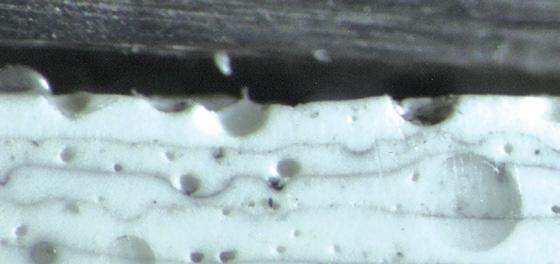
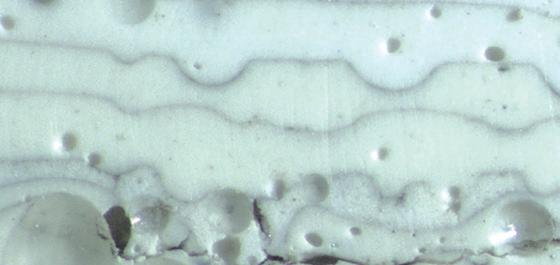
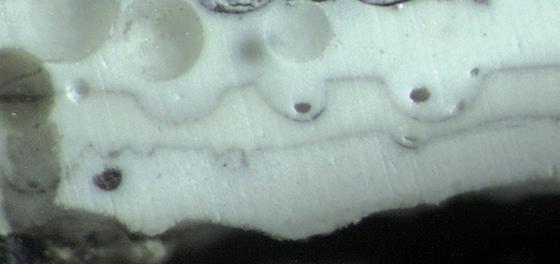
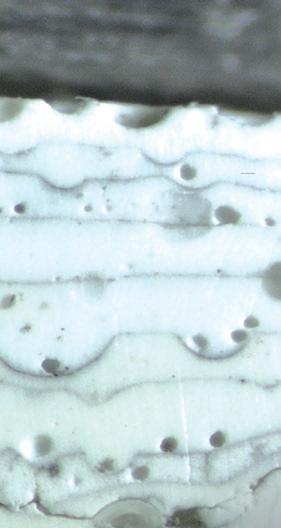
These key points were illustrated through the analysis of samples collected in the field. As can be seen in Figure 1, there were numerous layers of paint. If abrasion were indeed 100%, these would have been converted to dust. Clearly visible are glass beads (or holes from them) at the top of each layer, which indicate that the renewal occurred before abrasion could commence.
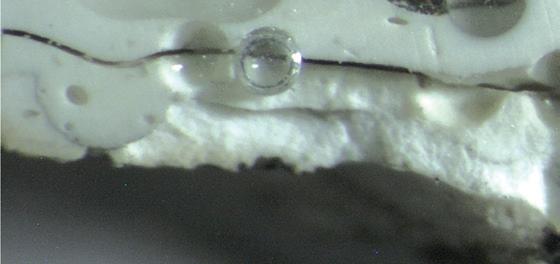
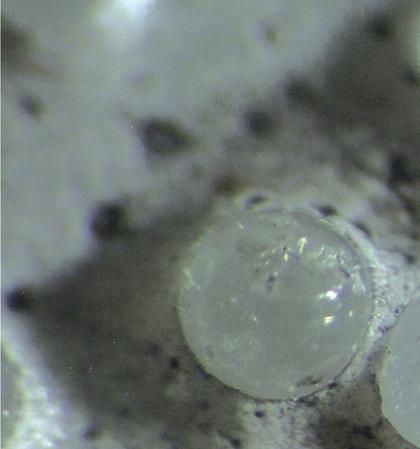
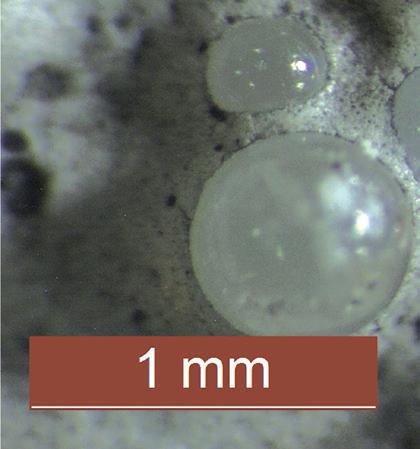
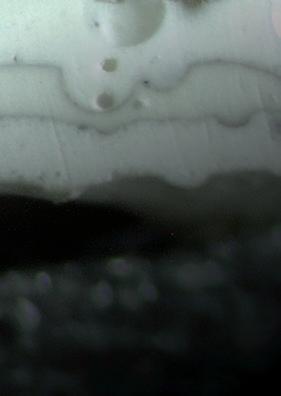
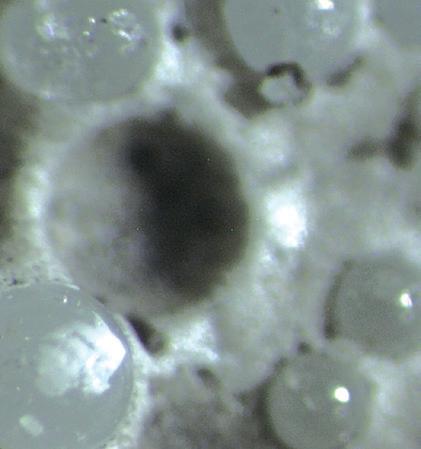
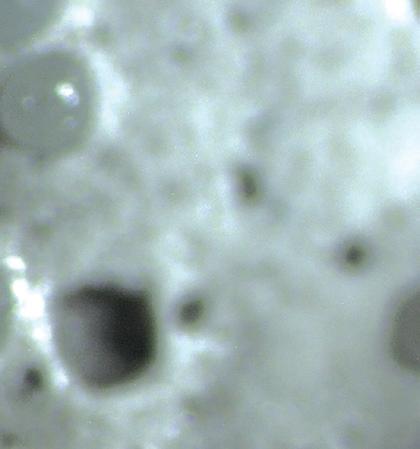
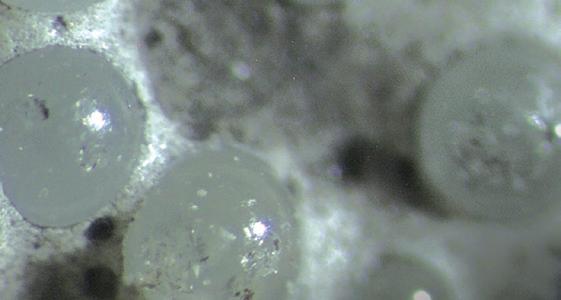
One should also observe that road markings can lose their retroreflective properties due to glass beads being damaged[9], while they are still retained, as shown in Figure 2. Even if some of the glass beads are missing, note that the tyre tread cannot touch the surface of the coating layer – it is physically impossible as the tread is at least 10 times larger than the space between the glass beads.

e most important point is the clear distinction between the functional and physical service life of road markings. Upon wear and tear, RL drops until the end of functional service life is reached; in Europe typically RL>100 mcd/m2/lx is required, despite recommendations from the European Union Road Federation and scientists assessing visual needs of drivers recommending 150 mcd/m2/lx[10]. Until then, the glass beads provide excellent protection against abrasion, so meaningful microplastic emissions are not possible.
Under normal circumstances, at that point, the road markings are renewed with fresh layers of the coating and the glass beads. is stacking of layers was illustrated in Figure 1. ere is a noticeable safe space between the typically set limits for the end of functional service life and the loss of glass beads, so minor further losses of RL do not meaningfully a ect the situation.
Only if road markings are not renewed promptly and the layer of drop-on glass beads is lost, can abrasion of the coating layer commence. is encroachment into physical service life would lead to microplastic emissions. However, such abrasion occurs usually only at relatively small areas that are exposed to extraordinary abrasion conditions, such as caused by:
(a) turning vehicles – because of the torque that accelerates the loss of glass beads; it can be seen at curves;
(b) heavy vehicles – because of their mass that causes damage to the surface;
(c) snow ploughing – because of the blades physically damaging the road markings; (d) the use of studded tyres – because the studs penetrate between glass beads and disrupt the integrity of the underlying coating layer. One could also add grossly inadequate maintenance; however, this is not normal but rather man-made negligence.
e majority of the road marking material remains in place and is over-coated until it is nally mechanically removed and either disposed of appropriately or recycled together with the asphalt, without release to the environment.
One must note that there are commercially available road markings (particularly cold plastic and tapes, but also thermoplastic) with extraordinary resistance to abrasion, even a er the layer of drop-on glass beads is lost and the retrore ectivity parameter

is not maintained. Such road markings are being constantly tested in the eld in the Harz mountains in Germany, where they are subjected not only to approximately 8,000 vehicle passes every day but also to around 300 snowplough passes each winter.
It was shown that some of these materials could withstand a decade of such abrasion, with calculated material loss as low as 1.1% per annum[11]
Another proof of exquisite resistance to abrasion shown by such durable road markings can be found on roads in Austria, where in 1994 yellow centre lines were replaced with white. A er 30 years, the yellow markings remain visible on some roads, even in busy urban areas.

Physically damaged glass beads, not capable of providing retrore ectivity but protecting the coating layer from abrasion. Some glass beads missing.


Given the importance of the microplastics issue and the incorrect prior estimates that unjustly and without proof assigned a very signi cant portion of the pollution to originate from road markings, the European Union Road Federation launched a web page (http://www.erf.be/publications/microplastics) devoted to this topic. In addition to providing scienti c support for the position papers, perspectives from road marking associations were combined. Consistently, based on the professional perspectives from Germany, Austria, Scandinavia, France, Croatia and the United Kingdom, the abrasion before renewal was estimated at 5%. is agrees with the outcome from the reported eld
assessment[7]. It confirms that the share of road markings among all microplastic pollution of the evaluated sectors is less than 0.7%. Of particular interest is the relative contribution of road markings in comparison with other roadway sources. It was reported that tyre wear was contributing to microplastic pollution of 230−-4,700g/year/person[12] and the losses from polymer-modified bitumen were approximately 0.5g of plastic particles per m² of asphalt surface [13]
In comparison, the contribution of road markings was reported to be only 0.2–36g/ person/year. Hence, it could be considered insignificant. The low relative contribution of road markings was also found during unrelated research in Sweden [14]; research of suspended dust samples concurred[15]. The concentration of airborne particles assigned to road markings was about 10 times less than bitumen wear particles and about 30 times less than tyre wear.
Road markings are necessary road safety features, needed equally for human drivers and for driver-assistance systems. As was shown, they are not a meaningful source of pollution. Research has shown that while road markings can and do add to the contamination of the environment with microplastics, this occurs seldomly and only in areas of extraordinary abrasion.
The prior theoretical calculations seldom were shown to be incorrect because of improper assumptions. Importantly, the relative contribution of road markings to microplastic pollution is insignificant in comparison with contamination from other road-related sources. The solution to further minimise such pollution is very simple: maintain road markings at the highest standards and use highly durable solutions –not only the environment would benefit, but foremost the drivers. ■
Authors
Áron Mári
is an environmental engineer at Geveko Markings, specialising in sustainability with experience in life-cycle assessment and microplastic research. His is currently focusing on product life-cycle assessment and environmental impacts while supporting research in the microplastic pollution field. Before this, he developed microplastic analysis methods for advanced techniques, while coordinating microplastic sampling projects.

Tomasz E. Burghardt holds a doctorate in organic chemistry. His work at Swarco Road Marking Systems includes development of various coatings as well as research on sizing for glass. His is currently a research and development project manager, splitting his time between laboratory work and field studies concerning road markings and their impact on the environment and safety.


Alexander Klein holds a PhD in physics and is director of sustainability and technical service for methacrylate resins at Röhm. He is active in various associations in the construction and road-marking industry. His experience of life-cycle assessments has greatly enhanced the environmental aspects of the road-marking industry.
References
[1] Babić, D., Fiolić, M., Babić, D., Gates, T.: Road markings and their impact on driver behaviour and road safety: a systematic review of current findings. Journal of Advanced Transportation, 2020, 7843743; https://doi. org/10.1155/2020/7843743.
[2] Babić, D., Burghardt, T. E., Babić, D.: Application and characteristics of waterborne road marking paint. International Journal for Traffic and Transport Engineering, 2015, 5, 150−169; https://doi. org/10.7708/ijtte.2015.5(2).06.
[3] Zusätzlichen Technischen Vertragsbedingungen und Richtlinien für Markierungen auf Straßen (ZTV-M); 2013. Serie: FGSV, Nr. 341 [in German]. FGSV Verlag: Köln, Germany, 2013.
[4] ONR 22440-1: Bodenmarkierungen. Funktionsdauer – Teil 1: Allgemeines. ONR 22440-2: Bodenmarkierungen. Funktionsdauer –Teil 2: Ortsgebiet [in German]. Österreichisches Normungsinstitut: Wien, Austria, 2018.
[5]D083921/01 (Draft Implementing Act) of Commission Regulation (EU) /…/ amending Annex XVII to Regulation (EC) No 1907/2006 of the European Parliament and of the Council concerning the Registration, Evaluation, Authorisation and Restriction of Chemicals (REACH) as regards synthetic polymer microparticles; https://ec.europa. eu/transparency/comitology-register/screen/ documents/083921/1/consult (accessed 13 December 2022). European Commission: Brussels, Belgium, 2022.
[6] Burghardt, T. E., Pashkevich, A.: Road markings and microplastics – a critical literature review. Transportation Research Part D: Transport and
Environment, 2023, 119, 103740; https://doi. org/10.1016/j.trd.2023.103740.
[7] Burghardt, T. E., Pashkevich, A., Babić, D., Mosböck, H., Babić, D., Żakowska, L.: Microplastics and road markings: the role of glass beads and loss estimation. Transportation Research Part D: Transport and Environment, 2022, 102, 103123; https://doi.org/10.1016/j. trd.2021.103123.
[8] Sundt, P., Schulze, P.-E., Syversen, F.: Sources of microplastics-pollution to the marine environment. Report M 321 2015. Norwegian Environment Agency Miljødirektoratet: Oslo, Norway, 2014.
[9] Wenzel, K. M., Burghardt, T. E., Pashkevich, A., Buckermann, W. A.: Glass beads for road markings: surface damage and retroreflection decay study. Applied Sciences, 2022, 12(4), 2258; https://doi.org/10.3390/app12042258.
[10] Marking a road toward a safer future. An ERF position paper on how road markings can make our road safer; https://erf.be/publications/markingthe-way-towards-a-safer-future (accessed 12 April 2023). European Union Road Federation: Brussels, Belgium, 2015.
[11] Drewes, C.: Average wear of different road marking systems in the test field in the Harz Mountains, Germany; available at https:// dsgs.de/forschungs-untersuchungsberichtestellungnahmen-mitteilungen.html (accessed 7 April 2023). Deutschen Studiengesellschaft für Straßenmarkierungen e. V.: Bad Sachsa, Germany, 2022.
[12] Kole, P. J., Löhr, A. J., Van Belleghem, F. G., Ragas, A. M.: Wear and tear of tyres: a stealthy source of microplastics in the environment. International Journal of Environmental Research and Public Health, 2017, 14(10), 1265; https://doi. org/10.3390/ijerph14101265.
[13] Enfrin, M., Myszka, R., Giustozzi, F.: Paving roads with recycled plastics: microplastic pollution or eco-friendly solution? Journal of Hazardous Materials, 2022, 437, 129334; https:// doi.org/10.1016/j.jhazmat.2022.129334.
[14] Järlskog, I., Jaramillo-Vogel, D., Rausch, J., Perseguers, S., Gustafsson, M., Strömvall, A. M., Andersson-Sköld, Y.: Differentiating and quantifying carbonaceous (tire, bitumen, and road marking wear) and non-carbonaceous (metals, minerals, and glass beads) non-exhaust particles in road dust samples from a traffic environment. Water, Air, & Soil Pollution, 2022, 233, 375; doi: 10.1007/s11270-022-05847-8.
[15] Järlskog, I., Jaramillo-Vogel, D., Rausch, J., Gustafsson, M., Strömvall, A. M., AnderssonSköld, Y.: Concentrations of tire wear microplastics and other traffic-derived nonexhaust particles in the road environment. Environment International, 2022, 170, 107618; https://doi.org/10.1016/j.envint.2022.107618.
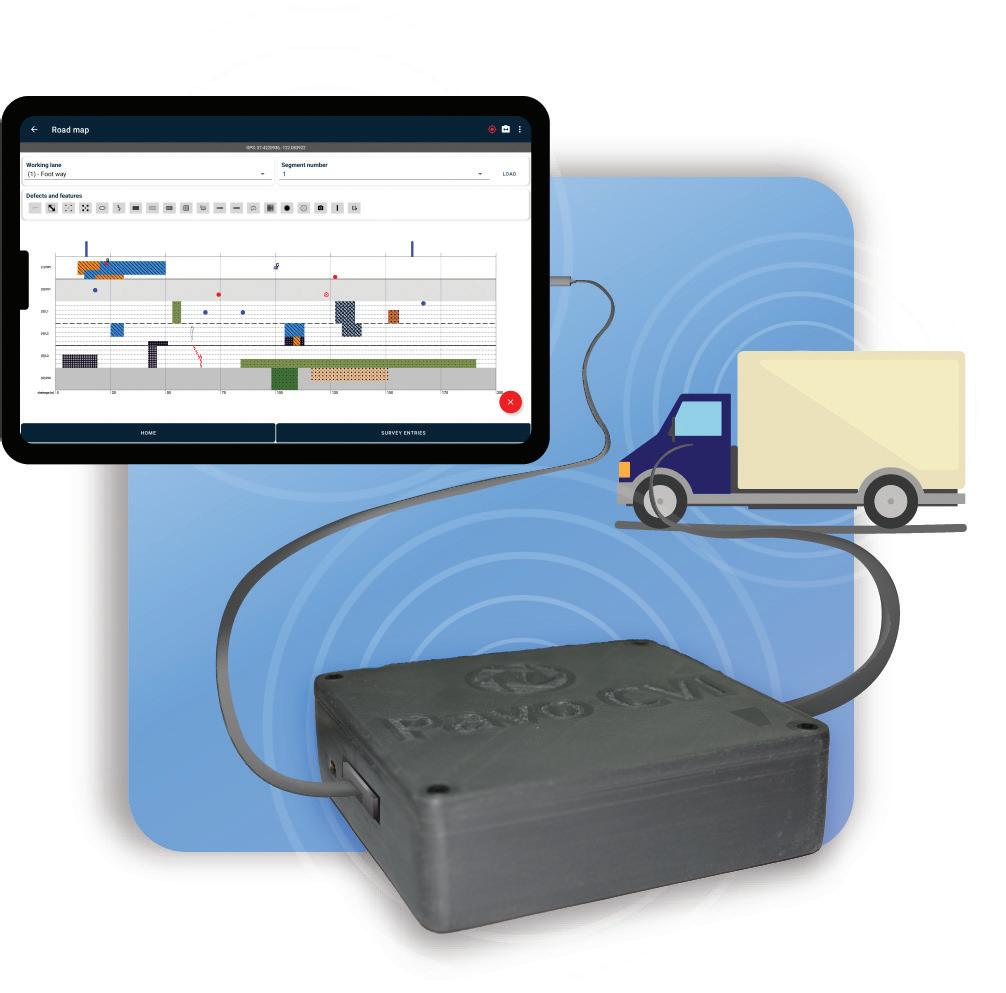
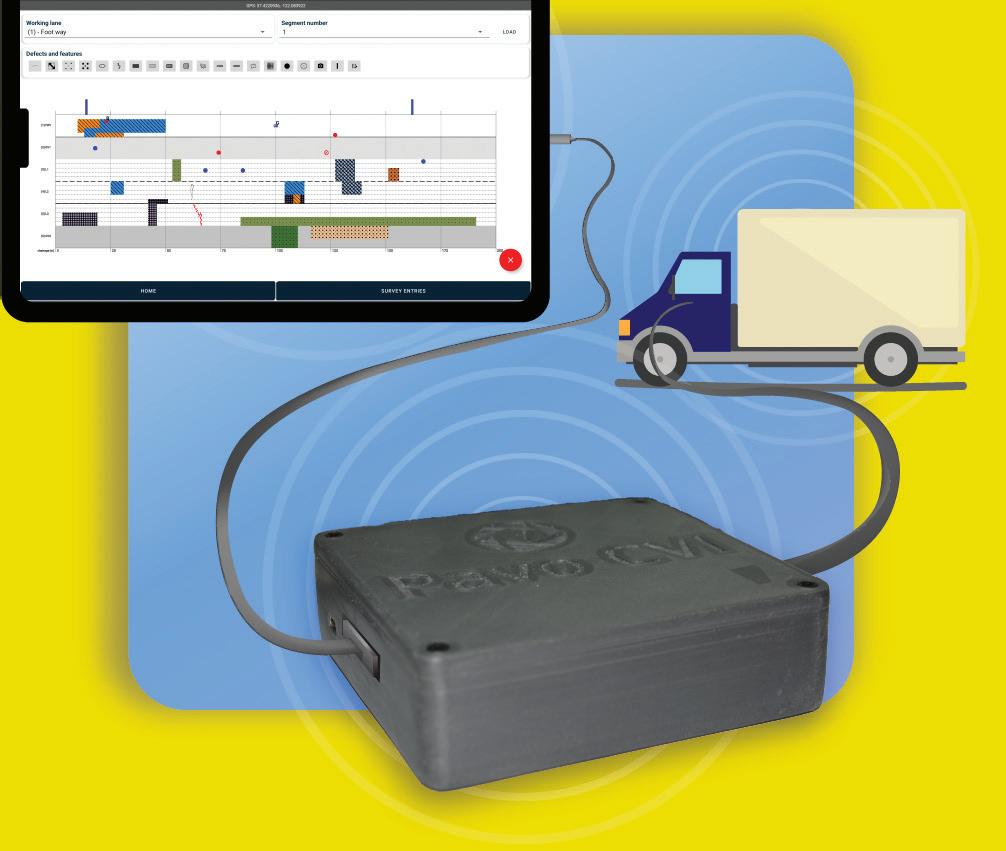
The Pavo CVI (coarse visual inspection), from Strada Imaging, gives a fast, accurate and cost-saving road inspection. The app is presently undergoing extended usertesting at Aston University in England, having already demonstrated significant time savings on roads and in post-processing during its validation testing*.
Strada Imaging recently released Pavo CVI for vehicle-based road inspections. A coarse visual inspection (CVI), as it is called in the UK – or windshield surveys in the USdetails road conditions at the network level.
During such a survey, an inspector sits next to the driver and uses a direct data-capture device (DCD) mounted to the vehicle to input observations. Pavo CVI comes with its own DCD and easy-to-use mobile application so ware. e Pavo product family was originally designed for road inspectors and raters performing detailed visual inspections or DVI as known in the UK (foot-on-ground or walking surveys in the US).
Pavo DVI, the rst product in Strada Imaging’s line-up of road-inspection series, enables direct digitisation in the eld through
a mobile application to produce digital survey maps, formatted data les and reports. Working with the highways maintenance contractor Eurovia UK, Strada Imaging later extended Pavo DVI capabilities by adding local road functionality to the so ware that was originally built for highways.
Despite the arrival of expensive automated road-inspection technology, observations performed by experienced personnel from moving vehicles remain a robust, fast and cost-e ective approach. Previous studies involving vehicle-based surveys have shown a high degree of inter- and intra-inspector repeatability and correlation[1]
A survey among North American road authorities found that manual inspection is used equally as any other automated and semi-automated method for cracking,
raveling, bleeding, patching and potholes[2]. For certain other defect types, such as weathering, manual surveying remains the predominant method of inspection.
Although automated road-inspection systems have been widely available for more than a decade, local authorities in the developed world are still struggling with their inability to specify defect de nitions for automated inspection.
A lack of customisation possibilities with automated road-inspection systems is another concern. e scope of manual inspection is far greater in the developing world, where automated inspection has not gained much traction due to cost, regulatory and capability constraints. is is the global market that the Pavo product line targets.













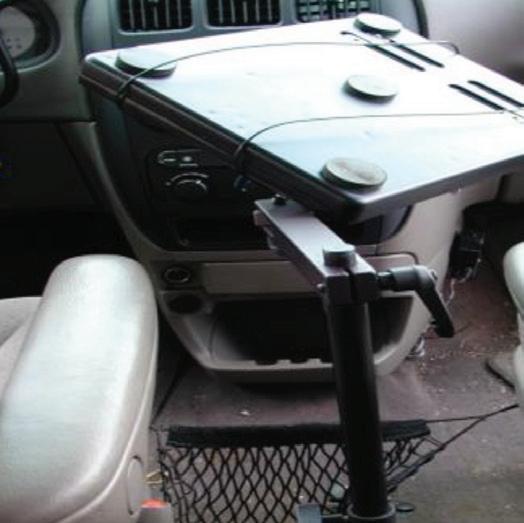

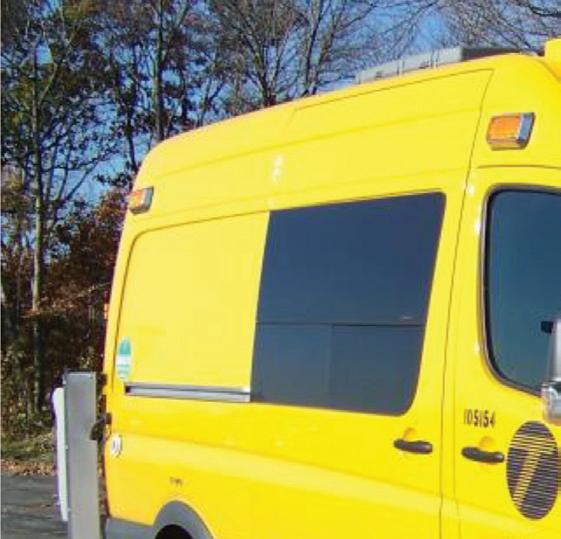
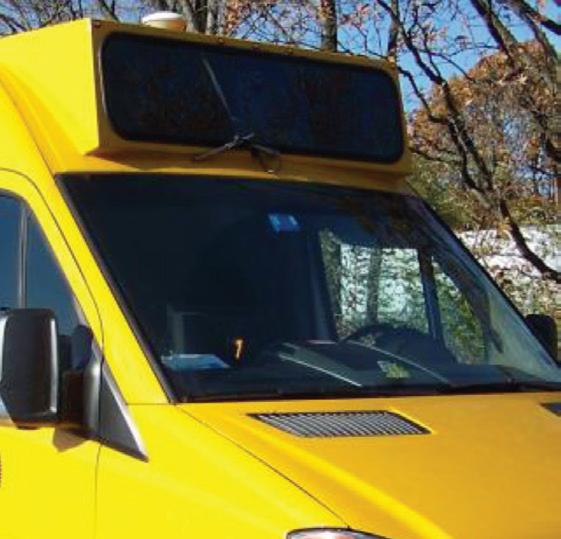
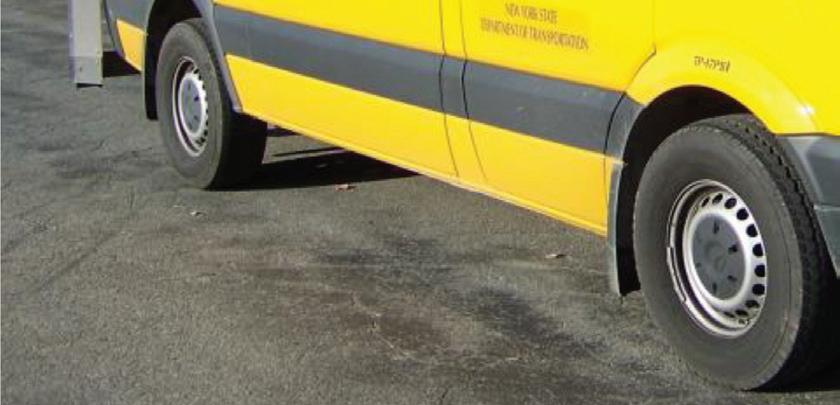
As mentioned earlier, vehicle-based road surveys provide a fast and e ective way to determine the condition of a network. Such a survey typically involves a driver-inspector duo driving and gathering data in a high-up driving position vehicle. In addition to being responsible for safe navigation, in the US the driver also performs a visual survey of the road. During the survey, the vehicle is driven at, or under, highway speeds - in the UK this can be 15-40kph - and the general condition of an entire road section is observed.
For highly defective sections, it is normal to drive at very slow speeds or to stop altogether and perform a walking inspection. In the UK, the entire carriageway is assessed as one, while kerbs, footways and cycleways that are next to the carriageway are inspected separately.


e collection of data concerning defects by CVI involves identifying the start and the end chainages of a defect – for example, the exact location of a defect – along the survey direction.
is is done typically with the aid of an odometer. Odometers count wheel rotations and, therefore, allow for inferring the distance traversed. is enables the inspector to mark the start and end chainages of defects. Live odometer readings are available via a standard electronic interface in all modern vehicles.
In addition to wheel rotations, the distance travelled by a vehicle is also a ected by factors such as its wheel diameter, tyre tread wear and tyre pressure. Some of these parameters can change with time. Hence, a calibration relating the distance travelled by
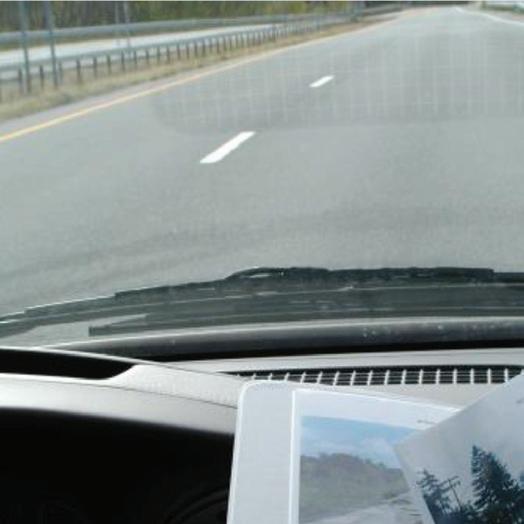


the vehicle per odometer count is performed periodically.
Every recorded defect is de ned by the actual start and end chainages. In the UK, these are called variable chainage-related defects, de ned by their start and end chainages. However, a defect is bound by the highway section in which it lies, i.e., if a continuous defect spans two successive sections, it will be recorded as two defects instead of one.
e UK system uses the so-called minimal (simple) cross-section position method, and the full cross-section position (XSP) method for classi ed roads. A conceptually similar, segment-based rating is used in the US, where the rater provides a condition score for a segment based on the frequency and severity of cracking. is is done while also classifying speci c distresses, such as fatigue cracking and spalling, as being isolated, general, low or high[4]. UK surveys di erentiate the crosssection of the road (Figure 3); the XSP method contains much more cross-sectional divisions.
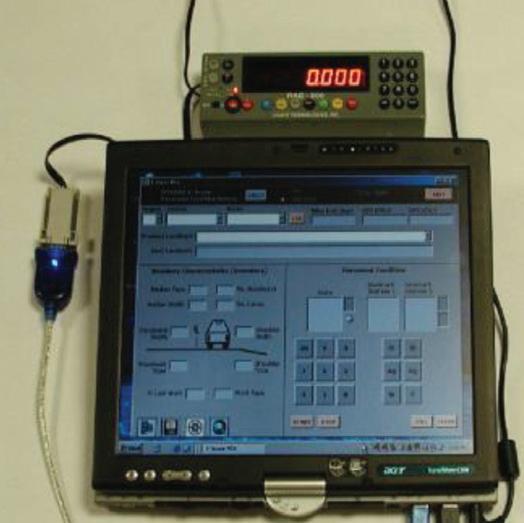
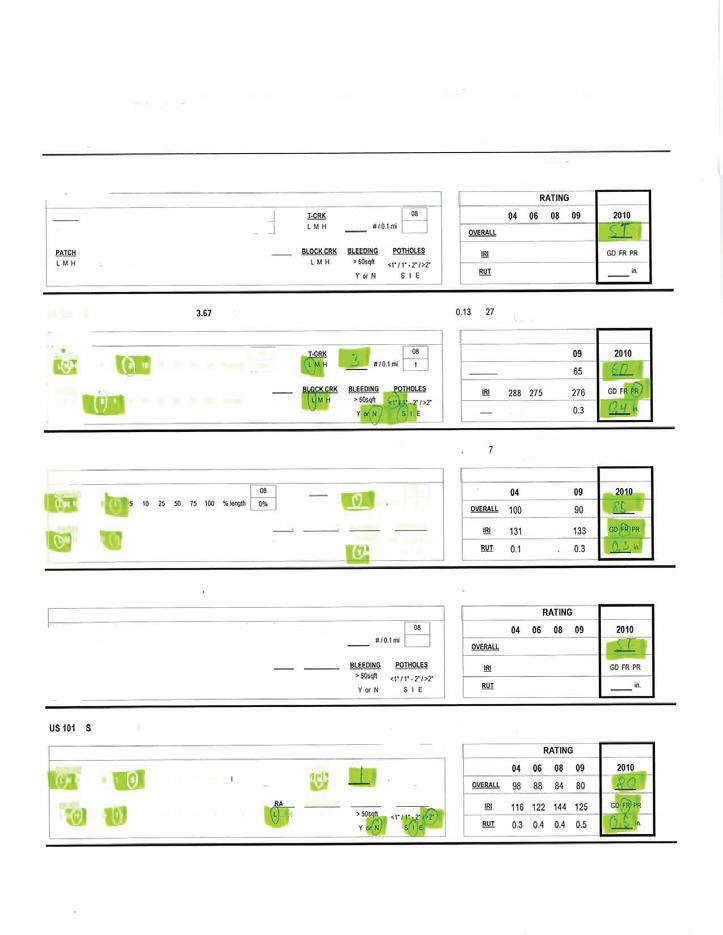
Even today, a signi cant proportion of vehicle-based surveys are paper-based (Figure 4). Here, standard survey templates are printed out and lled out during the survey. Back in the o ce, these handwritten records are converted to a digital format. Hardware and so ware solutions have been available for vehicle-based surveys since the early 2000s. Some local authorities, both in the US and the UK as well as road construction contractors, use special-purpose computers accompanied by proprietary so ware. Others may rely on laptops[6]
A taximeter is placed next to the computer to get distance information (Figure 2, top le ).
Bituminous Footway
Kerb
Bituminous Carriageway
Survey Direction

Edge Defect - No edge restraint present
Paper-based surveys are quite cumbersome. The inspector in a survey vehicle often performs multiple tasks simultaneously, such as handling survey sheets and checking the distance traversed by the vehicle. Sometimes, he or she may be expected to take photographs of the road for future reference. Hence, paper-based surveys are error-prone. Also, paper surveys can be slow since the inspector is often multi-tasking.
Whether paper is used or not, relevant stakeholders keep a digital record of their surveys. Digitising is critical because, in addition to storage considerations, digital survey records are also necessary for pavement-maintenance planning software prevalent in the industry. Often, someone else other than the original inspector - perhaps a younger, less experienced colleague - does the digitising, further aggravating the probability of error.
Direct digitisation solutions have been available for vehicle-based surveys for almost two decades. Some road authorities and contractors use special-purpose computers which come with their own proprietary software. However, the digitisation technology is today stagnant because of multiple reasons.
First, as many of these devices are old and have legacy software (e.g., ones written for old versions of MS Windows) they rarely receive any updates. Second, technical support and product replacement are minimal at best or non-existent. Third, the data-collector device,
its software and vehicle-odometer interface hardware must all be bought together making these inspection systems expensive.
Finally, legacy hardware-software combination, by virtue of being proprietary, also blocks any potential innovation or collaborative development in vehicle-based surveys. For instance, although there is a possibility of exploiting different positioning sensors that are available within modern smart devices to complement vehicleodometer position data for more accurate readings, such a fusion is impossible in legacy inspection systems.
Further, from the usability point of view of a rater, digitisation, as formulated by older road-surveying systems, does not entirely remove all their pain points. An inspector will have to simultaneously use the computer in addition to checking the taximeter interface for distance readouts, all the while taking photographs of the road regularly. They must frequently switch between the different devices, scattering their concentration, leading to productivity loss and increasing data entry errors.
PAVO BENEFITS
Pavo CVI turns the computer-based solution status quo on its head by introducing direct map-based recording. The instantaneous visualisation of data on a roadmap reduces data entry errors.
Basically, Pavo CVI is an Android mobile application presenting an intuitive, easy-touse interface to the inspector. The software
“User ergonomics and efficiency are significantly improved as the user is required to look at just the smart device screen and, of course, the road”
adheres to the latest best practices in software development and distribution, to be made available and updated easily – all from Google Play.
Users are not tied to any archaic, obsolete computers or direct data-capture device (DCD). An Android app brings a clear advantage: the ability to use any Androidcompatible mobile computing device, including smartphones with large screens, as a data-collecting device and user interface.
Strada Imaging designed the vehicleodometer interface hardware that comes with Pavo CVI in which automotive-quality odometer-interface electronics, used in taximeters, is integrated with a bespoke embedded system. This provides a robust road-position estimation solution. It eliminates the need for a separate taximeter and for a rater to look at taximeter displays for every data point entry.
All that an inspector must do with Pavo CVI is tap the touch screen to capture the current vehicle position on the road. Odometer calibration is part of the software and calibration parameters from multiple vehicles can be saved on a given smart device.
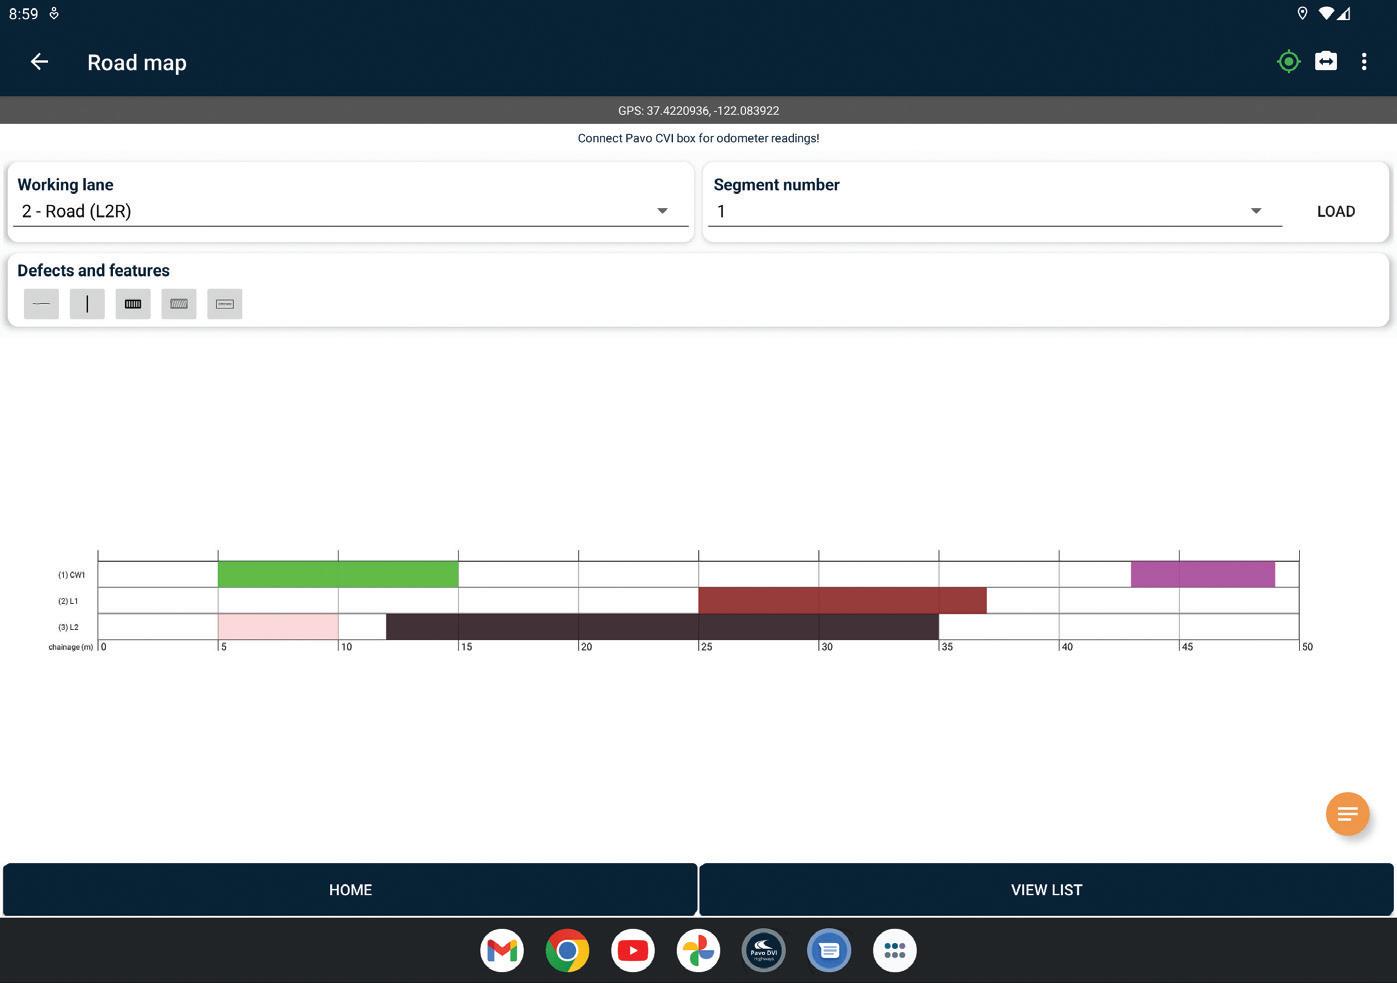
Pavo CVI surveys have road maps as the primary element. Every entry is immediately displayed. Project settings allow for flexible multi-lane configurations to be set up, including cycle tracks and footpaths (Figure 5). In addition to the lane in which the vehicle is driving, Pavo CVI facilitates inspections from adjacent lanes to be entered into the survey with ease.
The app can be used to draw custom shapes, making recording possibilities virtually infinite. Pavo CVI makes it possible to edit and update recorded defects later. Touch-toedit functionality allows ultra-fast operation. For UK surveys, the app is built with five standard UKPMS** CVI defect categories: length, lane length, count, no defect and area.
The software allows the complimentary logging of data from the GPS sensor in the smart device, which can be used to further improve the robustness of measurements. An inspector can take photos from the smart device and attach those to the relevant data entries. Strada Imaging is working on an AIdriven voice-to-text functionality to further speed up the surveys, by reducing touchcentred user interaction and data entry.
User ergonomics and efficiency are significantly improved as the user is required to look at just the smart device screen and, of course, the road. There is no need to attach
taximeters to the DCD, or to carry separate equipment to take road photos.
Pavo CVI does not need an internet connection to work. Data on the DCD gets automatically backed up in the cloud on the availability of an internet connection. Google cloud data storage provides ultimate flexibility, cyber-security, and prevention of loss of survey data. Another critical feature of the app is a remote-viewing functionality that allows a survey to be shadowed remotely, with internet availability. This functionality can be used to train new inspection personnel.
The rater can produce a CSV text file, containing defect details, and a PDF report of the survey at the click of a button. For each defect, the reports also contain a URL to any associated photographs – hence no confusion in matching data to images. Once reports and defect-detail files are generated, they can be conveniently emailed to anyone from the app.
CVI and windshield practice varies between countries and even among different authorities and vendors within a country. Hence it is not possible to cover every variant by one set of features. Strada Imaging can customise the app toward any new function requests. ■
*Strada Imaging is a road asset management surveying company based in the UK. Its business and development partners include Pavement Testing Services, Aston University, Jacobs, Eurovia, Innovate UK, NSK Construction, Axibuild. https://stradaimaging.com
**The standard United Kingdom Pavement Management System is for computer systems that monitor road conditions and help set up scheduled road maintenance, including for footpaths and bicycle paths. UKPMS systems allow local highway authorities to monitor their road network’s linear sections. Local authorities use this condition data to produce ‘best value performance indicators’ as required by the UK central government. There is, however, no single UKPMS. There are a number of software solutions that are recognised as meeting the UKPMS standard.
References
[1] https://rosap.ntl.bts.gov/view/dot/26795
[2] http://nap.naptionalacademies.org/25513/ [3] https://www.dot.ny.gov/divisions/engineering/ technical-services/hds-respository/2019__Hwy_ Data_5_-_Pavement_Condition_and_Score_ Generation_K_Vogel.pdf
[4] https://www.dot.ny.gov/divisions/engineering/ technical-services/hds-respository/2019__Hwy_ Data_5_-_Pavement_Condition_and_Score_ Generation_K_Vogel.pdf
[5] https://www.ciht.org.uk/media/11969/ukpms_ manual_02_07v09.pdf
[6] https://ftp.txdot.gov/pub/txdot-info/cst/raters_ manual-2010.pdf
[7] https://www.oregon.gov/ODOT/Construction/ Documents/gfp_manual.pdf





Researchers at TU Braunschweig in Germany and Italian chemical additives producer Iterchimica show how recycled plastic-based modified asphalt mixtures perform at low temperatures*.
Increasing awareness of environmental issues - apart from the many bene ts of creating a circular economy – is focusing the minds of road engineers on the use of recycled material in pavement layers. In this context, waste plastic has been one of the most used materials in asphalt pavements. To date, much research has been carried out showing di erent types of waste plastic as promising asphalt-mix modi ers.
According to the latest global surveys and investigations[1], the type of waste plastic and how it has been introduced into a bituminous mixture – using either the dry or wet process - can have a huge in uence on an asphalt mixture’s properties. However, regardless of this, almost all literature has consensus on the increment of the sti ness of the mixture, when waste plastic is used[2]
One point of view is that this increment in sti ness provides higher resistance to permanent deformation, making the asphalt suitable for heavy-duty pavement and pavement in hot-climate regions. But another point of view shows there is concern by engineers about the mixture’s lowtemperature cracking tendency and its crack propagation resistance[3]
e following discussion considers two case studies: the low-temperature cracking
resistance and the crack propagation of stone mastic asphalt (SMA) mixtures modi ed with a recycled plastic asphalt modi er were investigated.
RECYCLED SUPERMODIFIER
e asphalt supermodi er used in this investigation is a patented product, called Gipave, a compound of hard plastics - PE, PP and PVB (see box) - and graphene nanomaterials, as well as other active components. It is noteworthy that no lowmelting point plastic (such as water bottles) was included in the composition of the product. Table 1 summarises some of the properties of the asphalt supermodi er. e product is used via dry method and it is added to the hot aggregates before adding the bitumen and ller in the batch. e dosage could vary from 4-10% on the mass of the
Table 1. Some of the given technical properties of the asphalt supermodi er

design bitumen content. It depends on the level of modi cation and design criteria. e dosing of the additive in the asphalt plant could be carried out either by low-melting point bags or any dry dosing systems usually available for dosing the bres.
CASE STUDY 1: RESISTANCE TO LOW-TEMPERATURE CRACKING
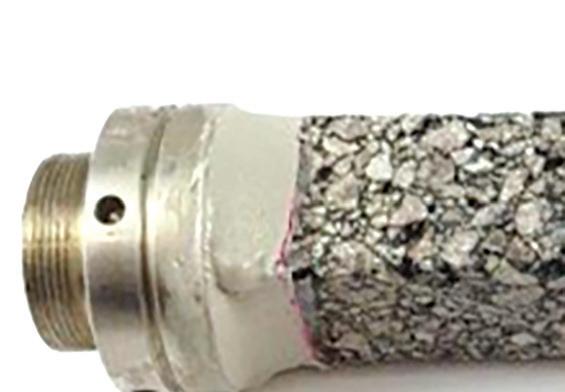
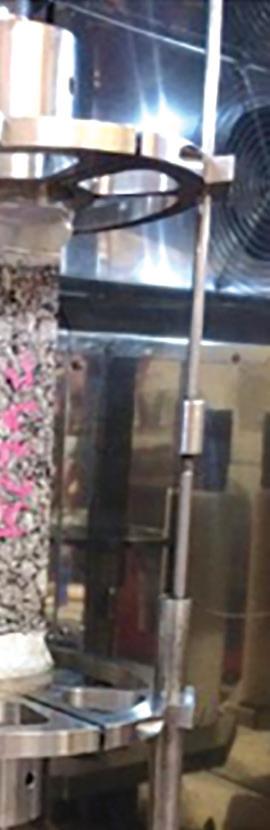
e thermal stress restrained specimen test (TSRST), according to EN 12697-46, was selected to evaluate the low-temperature cracking resistance of asphalt mixtures. In principle, as shown in Figure 1, while the prismatic specimen is kept from the two ends, it is subjected to decreasing temperature from 20°C, with a constant cooling rate of ∆T = -10K/h. Due to the prohibited thermal shrinkage, the specimen is subjected to an increasing (cryogenic) tensile stress. e cracking appears when the cryogenic stress reaches the tensile strength of the asphalt sample.
e experiment, developed at TU Braunschweig in Germany, involved two wearing courses of stone mastic asphalt (SMA) mixtures. e testing mixture contained 50/70 PEN graded bitumen and 5% of the asphalt modi er (in this case, by the weight of bitumen). e control mixture contained 25/55-55 SBS PmB with the same

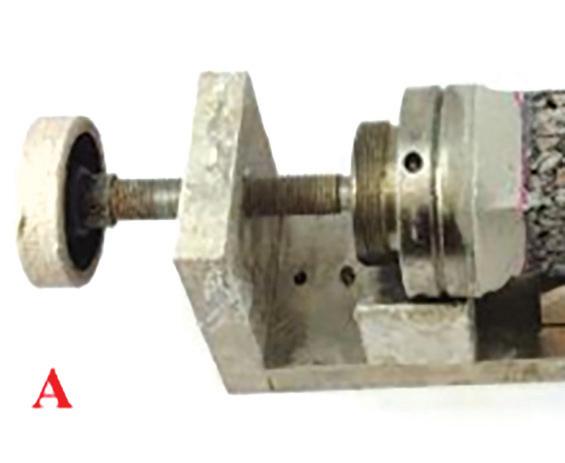
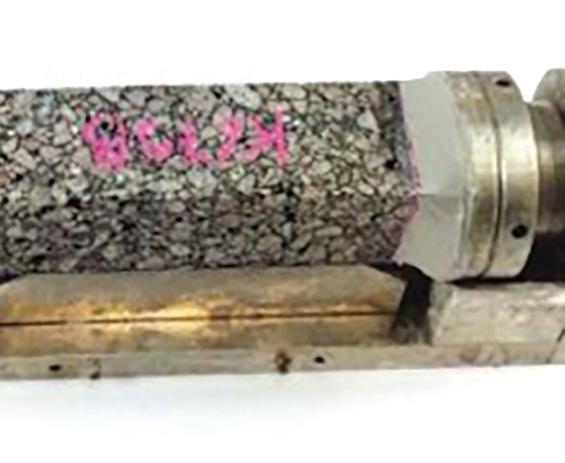
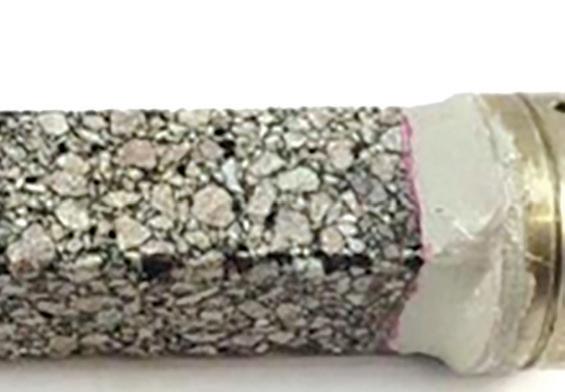


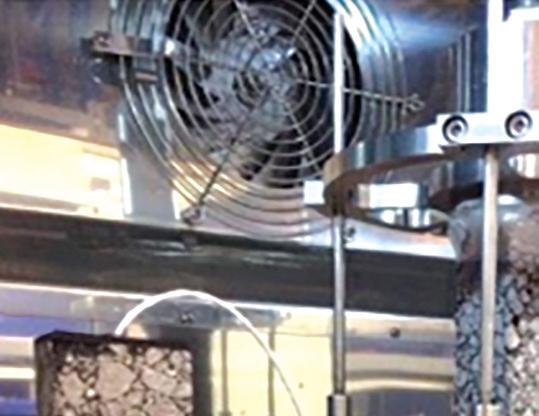
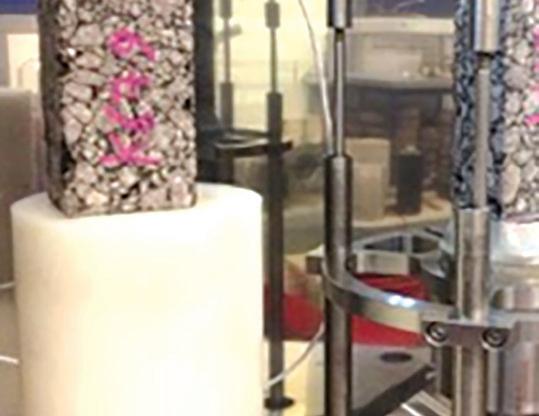

SMA 11mm 50/70 SMA 11mm 50/70 - Cr. Stress
SMA 11mm 50/70 5% Gipave SMA 11mm 50/70 5% Gipave - Cr. Stress
binder dosage to avoid any variable.
According to the results, as shown in Figure 2, the presence of the recycled plastic asphalt supermodi er, has not only worsened the mixtures’ low-temperature performance, but improved it to some extent. As far as the modulus of the mixtures is concerned, the mixture containing the asphalt supermodi er showed a higher sti ness modulus. erefore, it can be deduced that the higher modulus does not necessarily impact the lowtemperature performance.
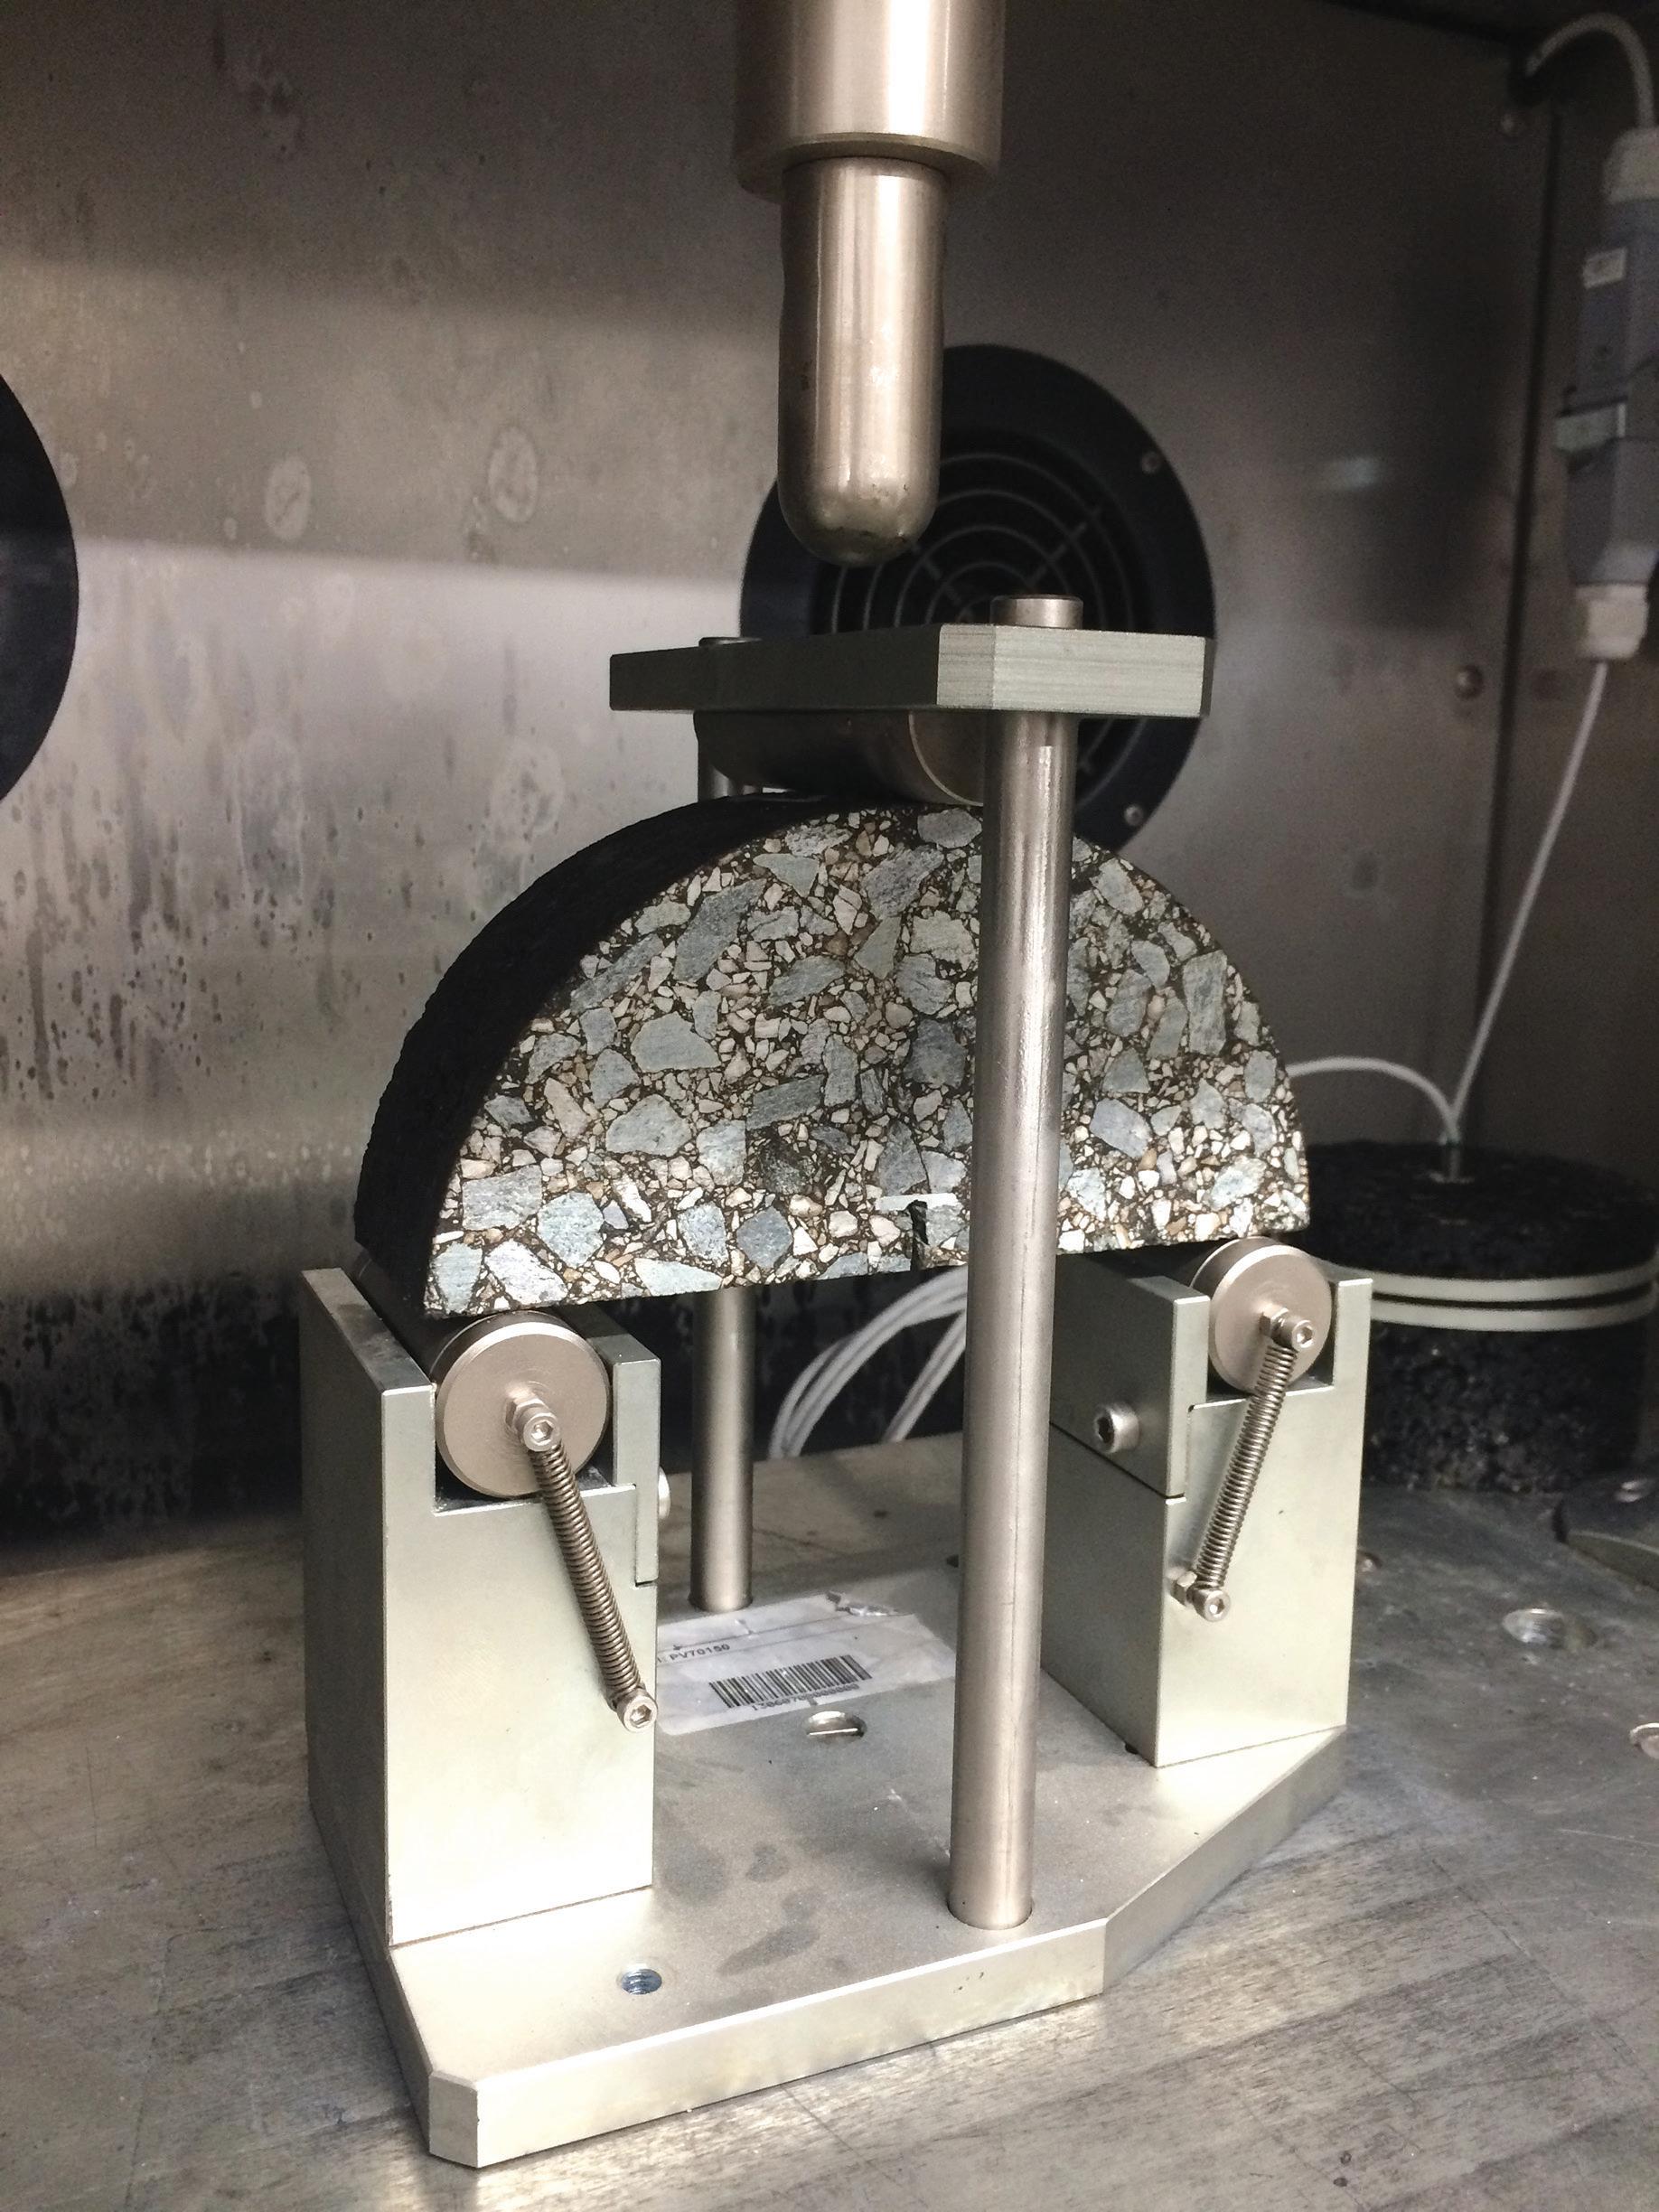
e Semi-circular Bending (SCB) test is commonly used to evaluate the crack propagation resistance of an asphalt mixture.
e SCB test has proven to be adequate for evaluating the fracture properties of both laboratory-compacted samples and eld cores due to simpli ed specimen preparation[4]. As shown in Figure 3, the SCB test includes the testing of a half-cylindrical asphalt concrete specimen with a notch in the centre loaded
PE - Polyethylene or polythene is the most commonly produced plastic. It is a polymer and used primarily for packaging, such as plastic bags, plastic lms, geomembranes and containers including bottles.
PP – Polypropylene, also known as polypropene, is a thermoplastic polymer used in a wide variety of applications. It is produced by chain-growth polymerisation from the monomer propylene. Polypropylene belongs to the group of polyole ns and is partially crystalline and non-polar. Its properties are similar to polyethylene, but it is slightly harder and more heatresistant. It is a white, mechanically rugged material and has a high chemical resistance. Polypropylene is the second-most widely produced commodity plastic after polyethylene.
PVB - Polyvinyl butyral is a resin that is used mostly for applications that need strong binding, optical clarity, adhesion to many surfaces, toughness and exibility. It is prepared from polyvinyl alcohol by reaction with butyraldehyde. The major application is laminated safety glass for automobile windshields. Trade names for PVB lms include KB PVB, Sa ex, GlasNovations, Butacite, WINLITE, S-Lec, Trosifol and EVERLAM.
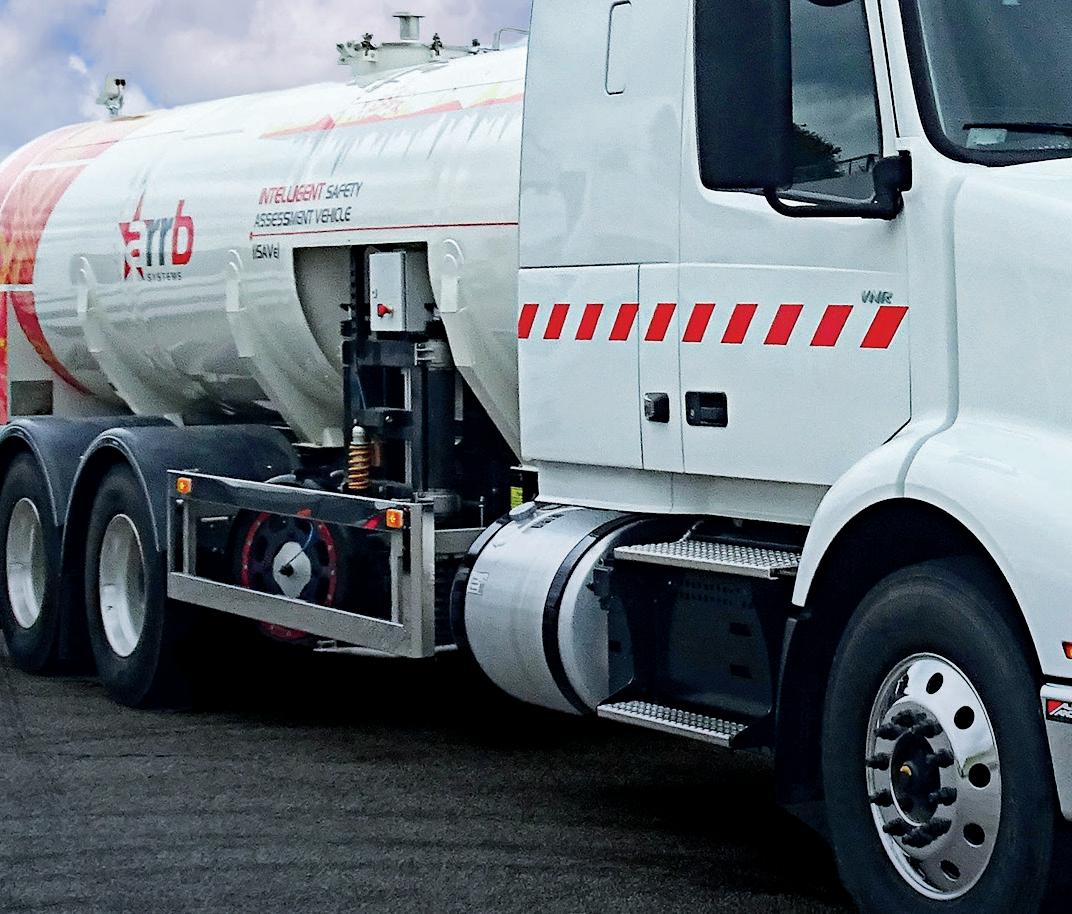




Our innovative solution enables informed road maintenance decisions that enhances road lifespan, saving time, money and lives
INTELLIGENT SAFETY ASSESSMENT VEHICLE iSAVE
ISAVE PROVIDES YOU CUTTING-EDGE DEVELOPMENT IN FRICTION AND INTER-RELATED PAVEMENT MEASUREMENTS USING SIDEWAYS FORCE COEFFICIENT (SFC) ASSEMBLY WHICH MEASURES THE FRICTION OF THE ROAD SURFACE IN THE WHEEL PATHS.


Works continuously at traffic speeds, with an operating speed range of at least 50 to 80 km/h

Friction measurement in both wheel paths simultaneously
Saving Time , Money and Lives



in a way that the middle of the base of the specimen is subjected to a tensile stress. e test results are provided as strain (ε) at the fracture point, representing the sti ness and fracture toughness (KIC), representing the fracture susceptibility of the mixture.
Figure 4 shows the test result of an SMA 11mm mixture with and without the recycled plastic asphalt supermodi er (5% of the weight of bitumen). is case study was carried out at Iterchimica’s facilities and the design was based on the Italian speci cations. For this purpose, the cylindrical specimens were manufactured using 100 gyrations (N2, design level) of gyratory compactor. e resulting air-void content was 4±0.5%.
According to the results, the sti ness modulus of the mixtures containing the recycled plastic asphalt supermodi er was around 25% higher at intermediate temperature than the one without Gipave. It can also be seen that both mixtures showed similar resistance to crack propagation.
From another point of view, considering the strain values, the mixture without the asphalt modi er resulted 21% higher. is is attributed to the sti ness modulus of the mixtures with and without the asphalt modi er, 9001 and 7163, respectively. e same trend has been recorded in several research projects where di erent types of asphalt mixtures were studied.
According to research literature, there is a consensus on the higher sti ness and consequent resistance to rutting of recycled
plastic modi ed asphalt mixtures. However, the low-temperature performance is yet to be con rmed. According to this paper’s two case studies, it can be deduced that:
• in line with the literature, the addition of the recycled plastic asphalt supermodi er increases the sti ness, which is necessary for design targets and resistance to rutting;
• the presence of the recycled plastic asphalt supermodi er would not impact the resistance to low-temperature cracking characteristics and the di erence with the reference mixture is insigni cant. ■
*Shahin Eskandarsefat is a senior researcher at Iterchimica and Chiara Riccardi is a researcher at the University of Pisa. Iterchimica, based in the town of Suisio, near Bergamo, Italy, is a global producer of high-tech additives and sustainable technologies for asphalt pavements. Technische Universität (TU) Braunschweig, in the German city of Braunschweig (Brunswick), is a major research university in the state of Lower Saxony. e university focuses on engineering that addresses global challenges such as those found in mobility, metrology, “city of the future” and global health. https://iterchimica.it/en
References
[1] Willis, R., Yin, F., Moraes R., (2020). Recycled plastics in asphalt part A: state of the knowledge National Asphalt Pavement Association, NAPAIS-142.
[2] Yin, F., Moraes, R., Anand, A., (2020). Recycled plastics in asphalt part B: Literature Review. National Asphalt Pavement Association, NAPA - IS-142.
[3] Movilla-Quesada, D., Raposeiras, A.C., SilvaKlein, L.T., Lastra-González, P., Castro-Fresno, D. (2019). Use of plastic scrap in asphalt mixtures added by dry method as a partial substitute for bitumen. Waste Management 87. https://doi. org/10.1016/j.wasman.2019.03.018
[4] Huang, B., et al. (2013). Using notched semi-circular bending fatigue test to characterize fracture resistance of asphalt mixtures. Engineering Fracture Mechanics 109: 78-88.
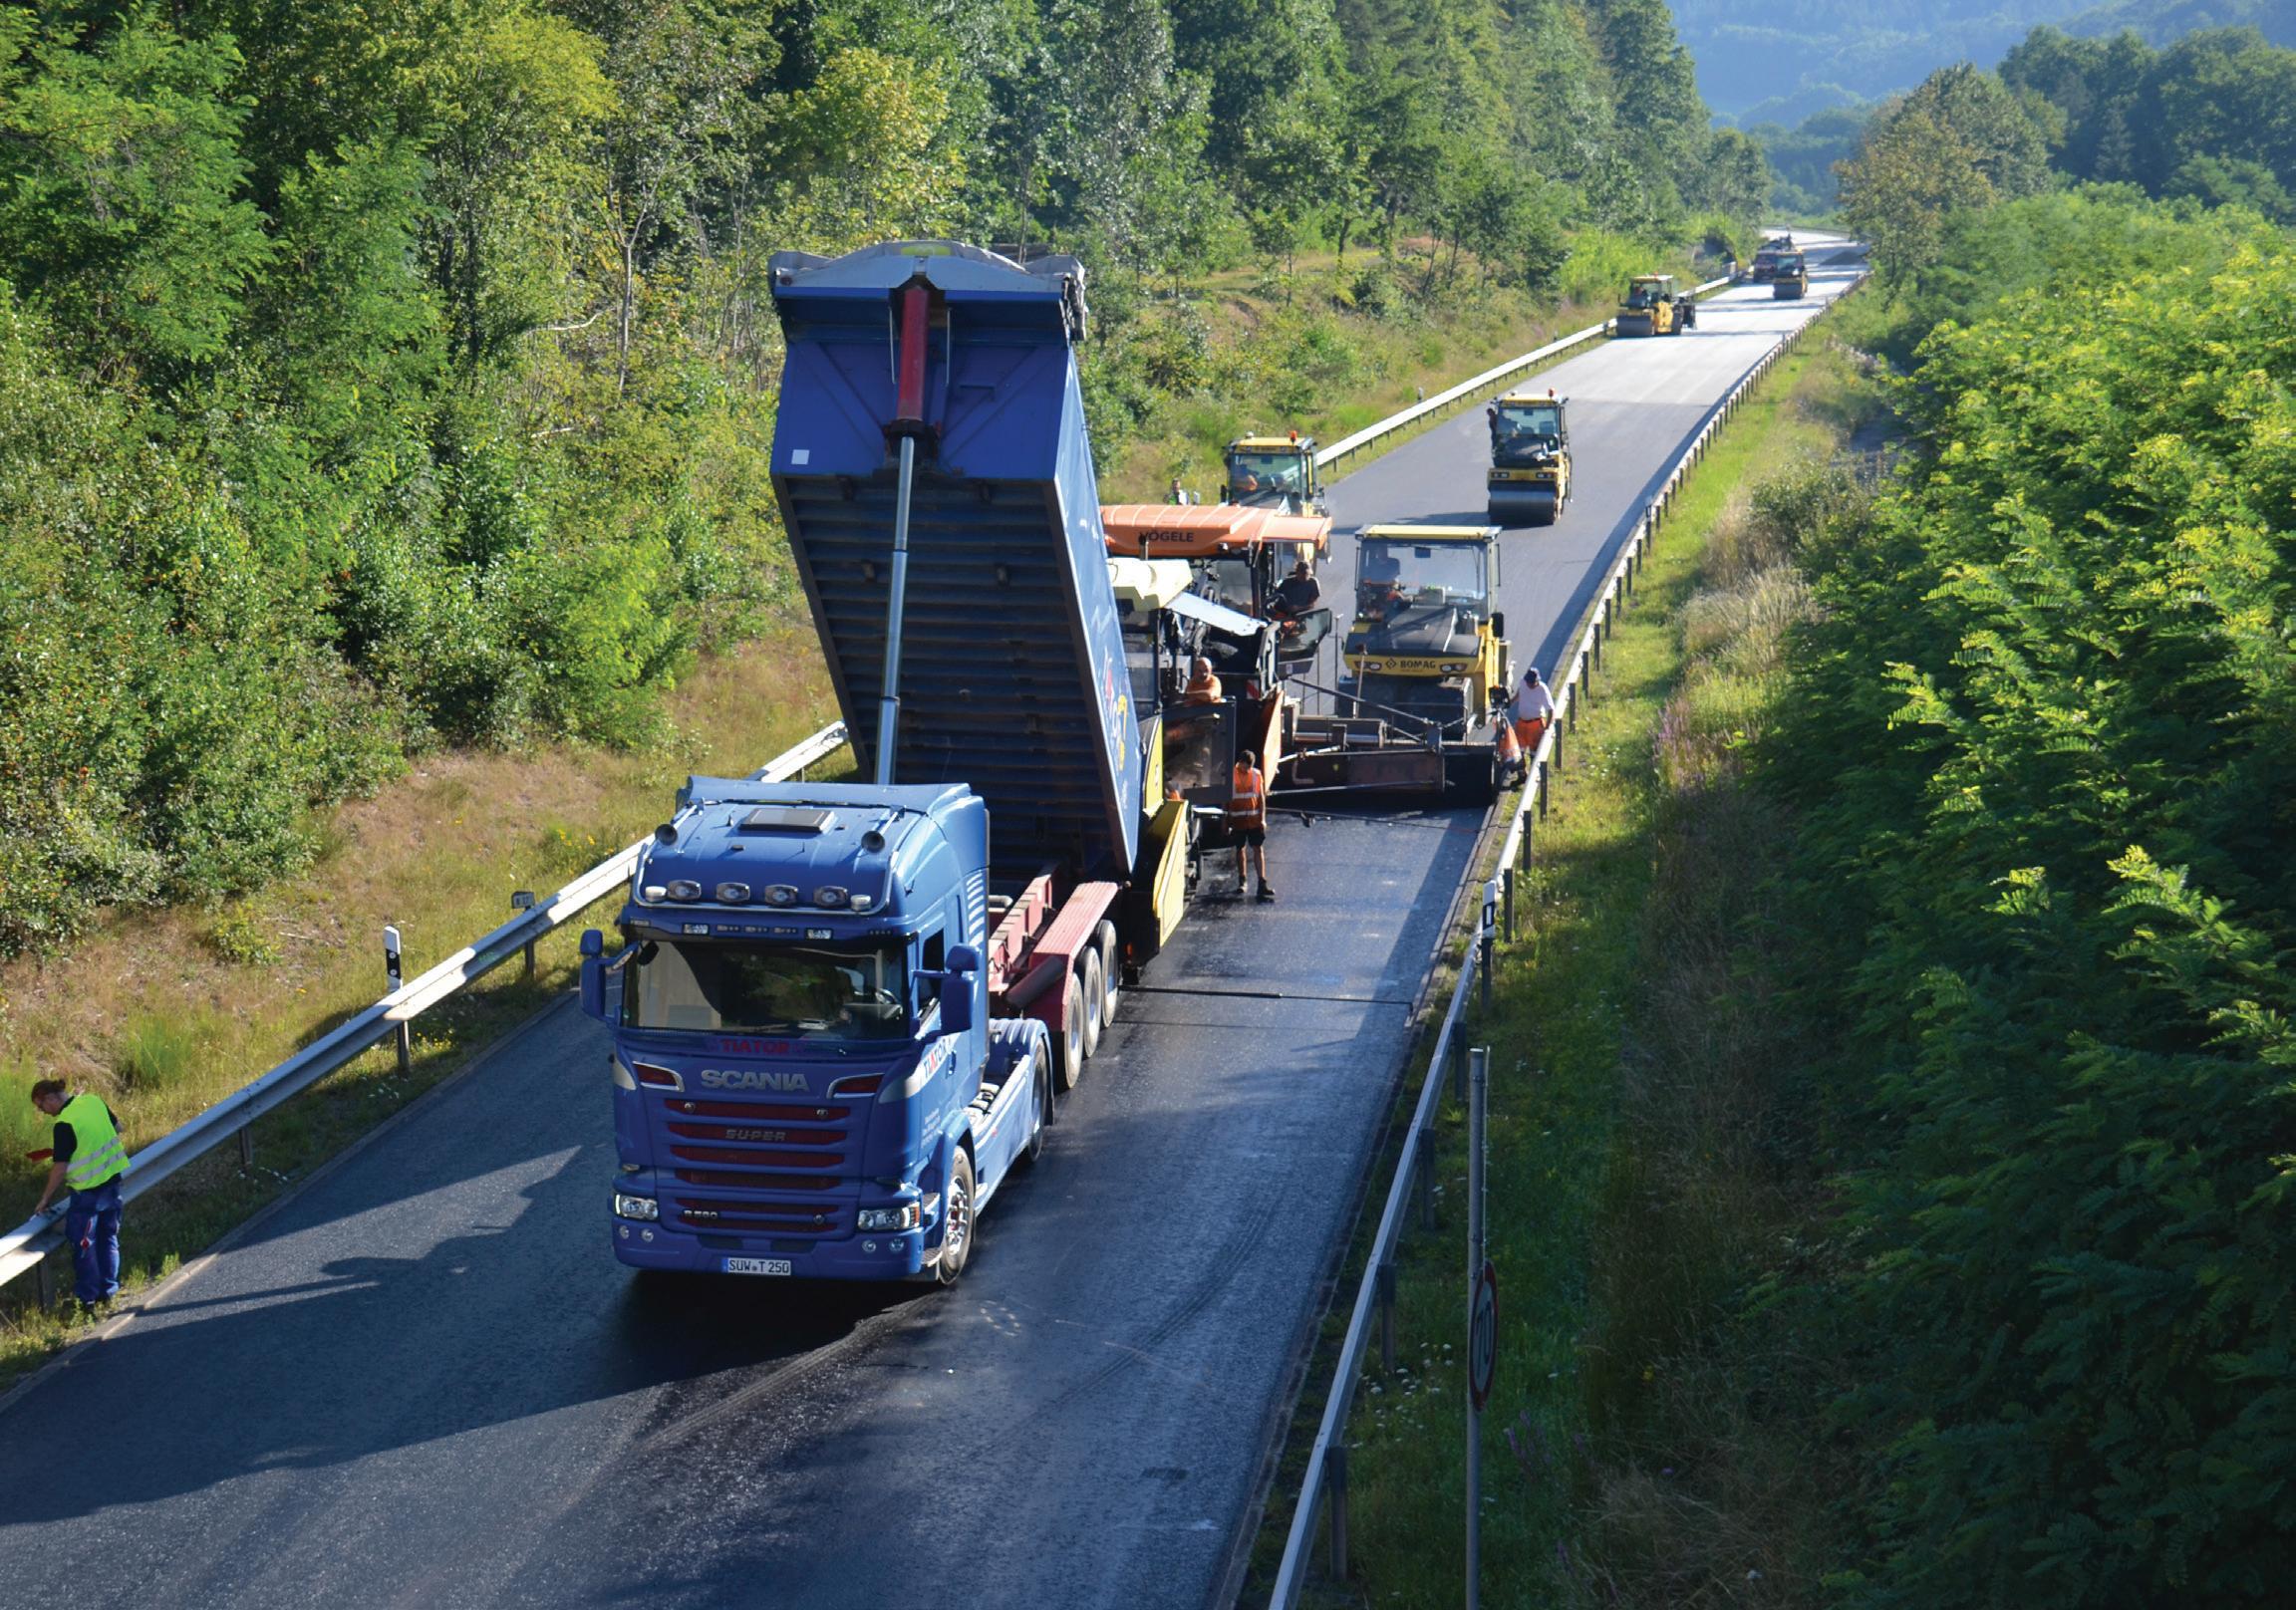
Picture 1: On the B270 in Waldfischbach, Germany, 4,000 tonnes of WMA (warm mix asphalt) for binder (50% RAP - reclaimed asphalt pavement) and top (30% RAP) layers were produced at lower temperature with B2Last (155°C). Laydown was performed in a temperature range of 120°C to 135°C. The pavement with B2Last achieved similar properties to a typical PmB 25/55-55) (image courtesy BASF SE)
Reactive modification of bitumen offers advantages over additives that work physically, such as polymers, zeolites, rubber or some rejuvenators. The B2Last additive from the German chemical company BASF is using this new technology with great success, explains Olivier Fleischel*
BASF developed the B2Last additive to improve the property profile of bitumen using the process of reactive modification; bitumen has a broad spectrum of reactive groups that are available for a chemical reaction. Bitumen naturally contains many reactive groups such as ketones, alcohols, thiols, carboxylic acids, anhydrides and others that are part of bitumen. Additional reactive groups are also formed during short-term ageing processes by the addition of oxygen when the asphalt mix is produced. These chemical groups can also be used for chemical reactions and improve the network density of the resulting polymer based on bitumen constituents. B2Last changes the morphology of bitumen polar moieties at a molecular level to improve its functional characteristics.
Bitumen oxidation occurs during the asphalt production process, creating new
reactive groups. Indeed, the chemical value of oxidised bitumen is higher than virgin bitumen (in terms of number of reactive species embedded into bitumen polarphase structures). Therefore, it could create covalent binding with B2Last. The working mechanism of the new additive has been intensively investigated and verified through preliminary work in the laboratory in collaboration with the Institute of Highway Engineering at RWTH Aachen University in Germany. Another objective was to collect comparative data on existing technologies under real-life conditions. This is the only way for future users to assess the possibilities for using reactive modification.
An additional opportunity to test such reactive modification in practice and compare it directly with polymer-modified bitumen arose again in August 2020 on the B270 in Waldfischbach, Germany. For the trial (Picture 1), a PEN 50/70 binder
was modified with 2.5% by wt. of the additive referred to the total binder content (neat binder and the binder content from reclaimed asphalt). The reference section was paved with a mixture produced with a polymer modified binder. The same neat bitumen PEN 50/70 was used for the polymer modification to fulfill the requirements of a typical PmB 25/55-55.
A temperature reduction is possible thanks to the chemical modification effect occurring during the different stages of the production and construction with B2Last. The viscosity of the mixture based on B2Last modification is similar to the unmodified binder at the beginning of the process. The viscosity will increase slowly as the network density increases over time, but still allows a workable material even at lower temperature. The temperature reduction comes with the added benefit of reducing the binder fumes and aerosols during construction and is - at
least in Germany - of special interest, since the workplace-exposure limit on a job site will be reduced from 10mg/m3 to 1.5mg/m3. This new regulation regarding occupational limit exposure is supposed to come into effect at the end of 2024.
No noticeable difficulties for the B2Lastmodified asphalt were noticed (laydown and compaction at 125°C to 135°C), even if the temperature of the mix went down to 120°C to evaluate the limit with B2Last. The material was still workable and easy to compact in a similar way to PmB-based asphalt at higher temperature (laydown and compaction at >145°C).
Thereafter, binder tests were performed on the bitumen extracted from the asphalt mixture gathered during construction. The asphalt tests were carried out on cores and beams drilled from roller-compacted plates in the laboratory.
Table 1 presents the results of the binder tests. To evaluate the behaviour in the hightemperature range and assess the rutting stability as well as the modification level achieved with B2Last, the following tests were performed: softening point, Binder Fast Characterisation Test (BTSV) and Multiple Stress Creep Recovery Tests (MSCR). First, all variants show a similar softening point. The only exception is the binder from the surface course with B2Last.
The BTSV method delivers two values,
the TBTSV and the δBTSV, which represent the hardness and the modification of the binder, respectively. The TBTSV results show a similar trend to the softening point, where the B2Last-modified surface layer sample strays slightly from the other three. This is supported by the δBTSV, where the modification level of this sample is lower than for the other three (lower phase angle δBTSV corresponds to a higher level of modification).
However, this difference for the surface layer with B2Last is due to a lack of RAP content (only 30% in the surface layers). Indeed, while no significant differences are noticeable for PmB in both layers, B2Last-modified binder and surface layers are showing a larger gap for the softening point and the BTSV values. The lack of RAP is influencing the degree of chemical modification, and this explains the lower value of the softening point for the surface layer with B2Last, as well as the deviation for the BTSV values.
This general analysis is supported by the MSCR results as well. The recovery values (R%) are higher for the polymermodified variants. This can be expected due to the difference between the elastomeric polymers of SBS (Styrene Butadiene Styrene) and the chemical crosslinking of B2Last. Nevertheless, aside from the slight difference with the B2Last-modified surface layer
sample, the binder layer with B2Last shows a similar behaviour.
To assess the behaviour of the binder at low temperatures, the bending beam rheometer (BBR) was used. Table 1 presents the lowtemperature continuous grade calculated using the ASTM D7643-16 Standard. The low-temperature behaviour is clearly dominated by the creep rate. In both cases, the continuous grade is very similar. It also proves that the chemical in-situ crosslinking reaction in bitumen, while stiffening the bitumen binder, is not significantly shifting the low-temperature susceptibility of bitumen. This leads to an increase in the useful temperature interval of bitumen.
Table 2 shows the results of several asphalt tests. To assess the rutting stability, wheeltracking (10,000 rollovers with a rubber wheel at 60°C) and cyclic compression tests (cyclic loading, 10,000 cycles at 50°C) were performed. Both tests show that the B2last-modified asphalt mix has a better performance against rutting than the reference with PmB 25/55-55. The rut depth (RDAir) and the proportional rut depth (PRDAir) are lower for the B2Last sample in both cases.
A similar effect can be seen with the strain and strain rate at the end of the test in the uniaxial cyclic compression test. The strain is lower in both cases, but not the strain rate. The strain rate of the B2Last surface
layer is slightly higher, which correlates with observations on a binder level. Regarding the low-temperature behaviour, the results of the thermal stress restrained specimen test (TSRST) show that all variants should have a similar performance.
Almost three seasons later and both surfaces, with a typical PmB and based on B2Last modification, are showing no premature damage. Both road sections are behaving identically. The profile of the road surface was evaluated using profilographs by Bau Control, in Germany, during the summers 2021 and 2022 ( in the area close to bridges, no significant difference was observed along the entire road section. In order to obtain the approval and certification from relevant local German bodies, the team is now waiting two more years to report five years of in-service road section based on B2Last.
SUSTAINABILITY ASSESSMENT
To be able to perform the sustainability assessment, a prediction of the service life is required. For this purpose, the German mechanistic-empirical design guide for asphalt pavements (FGSV – RDO Asphalt 09)
was followed. According to this standard, the prediction is done by calculating the resulting deformations at the bottom of the base layer, using the linear elastic multilayer theory (or the finite element method), considering
Table 3: Considered information modules for the assessment of an asphalt pavement in accordance with European Standards DIN EN 15804, DIN EN 17392-1 and DIN EN 15643-5
traffic and temperature data. Afterwards, Miner´s Law is applied to predict failure using the fatigue equation of the base layer, which is obtained after thorough laboratory tests.
PmB = Polymer modified Bitumen B = Bitumen ATS = Asphalt Base Course ABS = Asphalt Binder Course ADS = Asphalt Surface Course
For this analysis, the material properties of an unmodified and a B2Last-modified base layer were obtained in the laboratory. Calibrated data from FGSV – RDO Asphalt 09 was used for the surface, binder, frostprotection layers, as well as for the soil. Base layers are usually not mixed with modified bitumen. However, since the only standardised way to predict service life is through the base layer, this method was chosen.
Based on European standards ISO 14040, DIN EN 15643-4, DIN EN 15643-5, DIN EN 15804, DIN EN 17392, ISO 15686-5 and the following references , the asphalt pavement of a fictitious 3km-long and 14.5m-wide motorway was assessed. A period of 60 years and a discount rate of 3% were considered.
During this period, all relevant processes like material extraction, material production, material transport, construction as well as deconstruction were considered to be able to make comparative statements about environmental effects, construction costs and workplace exposure (Table 3). Based on the approaches published by Brzuska et al in 2018, the information modules shown in Table 3 were considered. The details of this life-cycle assessment were presented at the Rilem Conference 2020, held in Lyon, France.
Aside from the material properties, traffic and climatic data had to be considered. For the calculations, these values were the same for both layers. The traffic load chosen was an
AADT (annual average daily traffic) of 42,500, with a 21% share of heavy traffic vehicles (yearly increase 3%). The design period was set to 30 years and the load collective was taken from FGSV – RDO Asphalt 09 for a longdistance federal motorway. This translated to 129.2 million equivalent 10-tonne equivalentsingle-axle-loads. With respect to the climatic data, the frequency distribution of the surface temperature was taken from the standard for Zone 3, which corresponds to the south of Germany.
Variants shown in Table 4 were examined. These differ only in the choice of binder, which affects both the lifetime calculated and the manufacturing temperatures.
It could be demonstrated that B2Last not only saves energy and, therefore, reduces greenhouse gas emissions (Figure 1), but significantly reduces construction costs and exposure of workers to vapours and aerosols during construction. If B2Last is used in all three asphalt layers (Variant 2.1), a total primary energy saving of 41.3%, a reduction in greenhouse gas emissions of 46%, a reduction of 23.7% in construction costs and a reduction of up to two-thirds in the exposure of workers to vapours and aerosols compared to the conventional construction method (Variant 1) can be achieved.
If B2Last is used only in ADS and ABS (Variant 2.2), savings of 12.6% of total primary energy demand, 13.8% of greenhouse gas
emissions and 7.8% of construction costs, as well as a halving in exposure are achieved. e plausibility of these statements could be veri ed by the systematic variation of signi cant parameters (service life of B2Last layers; production temperature of B2Lastmodi ed asphalt; discount rate) within the scope of sensitivity analyses.
e main reasons for using B2Last are the extended service lifespan, the possibility of reducing the asphalt mixing temperature and the fact that conventional polymer modi cation, which is an energy-intensive process, can be dispensed with. e reduction of the asphalt production temperature has the advantage of reducing the energy demand and the resulting greenhouse gas emissions, as well as the reduction of the workplace exposure, thereby reducing the health risk for construction workers.
In conclusion, B2Last brings a new type of science from an engineering perspective. In contrast to products that are blended, B2Last is fully reacted; it becomes one with the asphalt. In contrast to other polymeric additives, it is not a two-part system to be stirred continuously.
B2Last is compatible with most bitumen, so is ideal for new pavement construction. It is designed to increase the useful temperature interval (UTI) of bitumen, maintain workable viscosity levels and reduce stripping of the aggregates. All this leads to a more durable pavement.
In many European countries, an increasing number of road authorities are already taking action to increase the use of WMA and recycling end-of-life pavement to reduce emissions. Consequently, B2Last should be viewed as a new way of improving bitumen properties and, when being used at an asphalt mixing plant, being able to ful ll the requirements to produce warm mix asphalt.
In addition to successful paving operations that have been conducted globally, BASF has partnered with the National Center for Asphalt Technology (NCAT) in Auburn, Texas, to conduct a Phase I study as part of BASF’s ongoing programme of B2Last trial evaluation. ■
*Authors:
Lead author Olivier Fleischel (right) has been EMEA (Europe, Middle East & Africa) business development manager for B2Last since 2020. He currently focuses on product implementation in Europe. He holds a PhD in organic chemistry from the Université de Strasbourg in France and has further developed his knowledge on the chemistry of bitumen through chemical modi cation with reactive crosslinkers.

Antoinette Pretorius is with BTC Speciality Chemical Distribution
Sharon Hayes is with BTC Europe
Nicolas Carreño is with the Institute of Highway Engineering RWTH Aachen
In a new round of trials which started in September 2021, BASF is testing the extremes of asphalt paving with B2Last. The company recently placed a new modi ed asphalt test section at the National Centre for Asphalt Technology’s (NCAT) Test Track in Opelika, Alabama. A test section (S13) was paved with a mixed formulation. The resulting binder reached the Performance Grade 88-22 (neat bitumen 67-22, increase of 21°C of the Useful Temperature Interval - UTI).
The material was applied as part of the phase VIII test cycle and the NCAT track team will run truck cycles for two to three years gathering data. The BASF test section was paved as a complement to the NCAT Additives Experiment Group of test sections. Within the test sections, strain gauges are embedded into the pavement and load plates are embedded into the base and into the bottom of the pavement. These gauges will take readings over the next three years. Full performance pro les of this test section will be available during 2024.

“Functional performance improvement levels can be tailored or made on-demand to meet or exceed exible pavement speci cations,” said Bernie Malonson, B2Last marketing manager for BASF Monomers, North America. “Since B2Last is a liquid, there are no solids to grind or melt, less energy is required to produce modi ed asphalt pavements and it supports the American Association of State and Highway Transportation Of cials [AASHTO] speci cations.”
While speci c states vary their authorised materials, B2Last can support both AASHTO M320 and M332 performance grade (PG) speci cations. In many cases, modi ed asphalt producers have noted that they are able to use less B2Last and simplify their formulations.

References:
[1] e MAK-Collection for Occupational Health and Safety 2019. Weinheim, Germany: Wiley-VCH Verlag GmbH & Co. KGaA; 2019.
[2] Alisov A, Riccardi C, Schrader J, Cannone Falchetto A, Wistuba MP. A novel method to characterise asphalt binders at high temperatures. Road Materials and Pavement Design 2020;21(1):143–55. https://doi.org/10.1080/146806 29.2018.1483258.
[3] C. Holldorb, A. Brzuska, S. Cypra, M. Oeser, N. Carreno, M. Zeilinger, Sustainability assessment of novel performance enhancing chemical bitumen additive, RILEM International Symposium on Bituminous Materials December 14-17, 2020, Lyon, France.
[4] Gesprächskreis Bitumen: Expositionsbeschreibung Herstellung und Beförderung von Asphalt. https://www.bgbau.de/ leadmin/Die_BG_BAU/Gespr%C3%A4chskreis_ Bitumen/ ExpoHerstTranspAsphalt.pdf. Gesprächskreis Bitumen: Expositionsbeschreibung Einbau von Walzasphalt im Straßenbau. https://www.bgbau.de/ leadmin/Die_BG_ BAU/Gespr%C3%A4chskreis_Bi-tumen/ ExpoWalzasphalt.pdf.
[5] Brzuska, A., Cypra, S., Holldorb, C., Stöckner, M.: CO2-Emissionen bei der Straßenerhaltung. Straße und Autobahn (69), 845-853 (2018).
[6] Holldorb, C., Brzuska, A., Cypra, S.: Nachhaltigkeitsbewertung zum Einsatz von B2Lastmodi ziertem Asphalt. University of Applied Sciences, Karlsruhe (2020, unpublished).

e National Centre for Asphalt Technology’s (NCAT) Test Track in Opelika, Alabama (image courtesy NCAT)


Visibility is the key parameter for efficient road markings, needed equally for human drivers and for machine vision*.
Good road marking visibility is achieved through colour contrasting with the road surface.
However, evaluation of at line and structured road markings under wet conditions at night has shown profound di erences between these two types of road markings. Whereas at lines remained submerged and became undistinguishable from the roadway surface, structured markings allowed for moisture drainage and thus their edges remained visible.
e role of road markings as safety enhancers on the vast majority of paved roads and their impact on drivers is well researched.
e same road markings are also necessary for machine-vision equipment used in driverassistance systems[2,3]. e key property for the proper function of road markings is their visibility, which is achieved through colour contrasting with the surrounding pavement, at night enhanced through retrore ectivity.
ere is no consensus, though, as to the level of contrast ratio needed for reliable steering.
Road markings are systems comprising two vastly dissimilar layers – a coating layer and

on top of it a glass-beads layer[4]. e coating layer adheres to the roadway surface and provides colour; the glass beads layer protects the coating from abrasion and furnishes retrore ectivity. Road markings are usually applied in the form of at lines (known as Type 1 in the industry).
Unfortunately, in such cases, all of the glass beads on the surface are exposed to the vehicular tra c, which causes relatively quick deterioration of the retrore ectivity due to physical damage of the glass beads or their extraction from the coating. Furthermore, under wet conditions the surface of such road markings can become submerged, which can reduce their visibility to nil.
To alleviate this issue, structured road markings were developed (known in the industry as Type II). ese structures can be either regular or random and can reach heights of as much as 5mm. e structures provide a vibroacoustic e ect to warn drivers who wander out of their tra c lane, shelter some of the glass beads from direct abrasion to prolong functional service life and also facilitate moisture drainage to enhance
In many publications dealing with the development of machine-vision algorithms road markings are considered as “just part of the road” and the dissimilarities between materials are ignored


visibility during rain. eir durability and capability of delivering excellent retrore ectivity even in the case of yellow markings was recently tested in Texas[5]
In many publications dealing with the development of machine vision algorithms road markings are considered as “just part of the road” and the dissimilarities between materials are ignored. Hence, to demonstrate the di erences in visibility between Type I and Type II road markings, they were applied side-by-side as pedestrian-crossing zebra stripes and tested under various conditions. To quantify the visibility, their contrast ratio was assessed based on pictures obtained from a camera.
Selected results from the experiment presented herein were recently thoroughly described[6]. e outcome was envisaged to show the di erences between materials not only for the bene t of so ware engineers specialising in designing so ware for machine vision, but foremost for road administrators and policymakers seeking easy and inexpensive solutions for increasing road safety.





Patented graphene-enhanced polymeric supermodifier containing recycled plastics for recyclable, safe and sustainable roads
gipave® is a polymeric supermodifier composed of graphene, specific additives and hard plastics, which are reinserted into the production cycle through a new patented selection and recycling process. Thanks to the properties of graphene, gipave® modifies and improves the mechanical properties of all types of bituminous mixes, decreases the deformations and improves the fatigue behaviour due to the repetition of loads. This solution contributes to a substantial increase in the service life of the asphalt pavement compared to both traditional PmB technology (Polymer-modified Bitumen) and those asphalt mixtures that are structurally modified via dry method.
Areas of application
Commercially available materials (sprayed cold plastic for Type I markings and handrolled cold plastic for Type II markings) were applied using standard procedures. For visibility assessment, regions of interest comprising the marked areas and the neighbouring roadway surface as background were selected from the pictures. Using an open-source so ware, luminance histograms for the selected regions of interest were obtained; their comparison permitted for quanti cation of visibility through contrast ratio.
Previous research has shown the advantage of using the equation developed by Michelson to express the contrast ratio. is is because under some conditions the values
were more reasonably expressed than with Weber contrast[6]. Hence, for calculations we used Eq. 1 (below), where CRM – Michelson contrast ratio, Lm – average luminance of the marked area, and Lb – average luminance of the background. e results from the experiment are provided in Table 1 and visualised in Figure 1.
1
Based on the visual assessment (Table 1) of conditions other than wet surface at night, one could consider that Michelson contrast >0.2 should be adequate.





















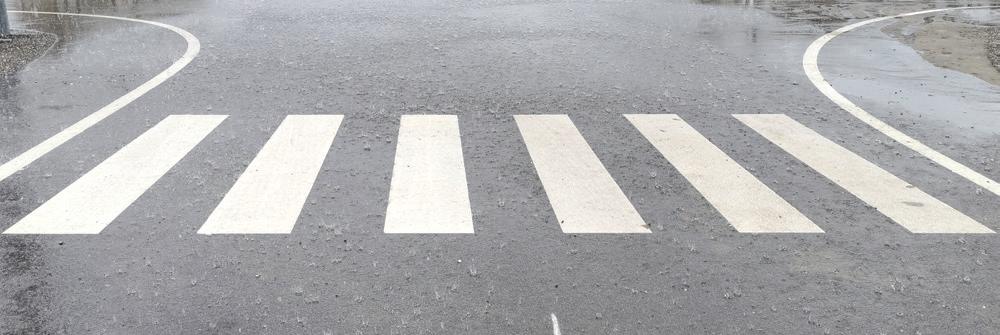
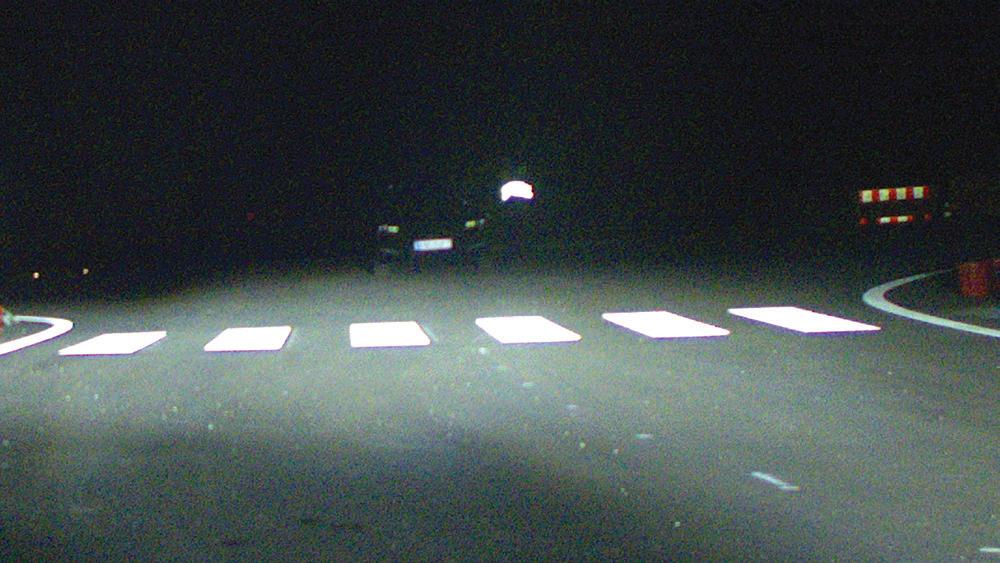
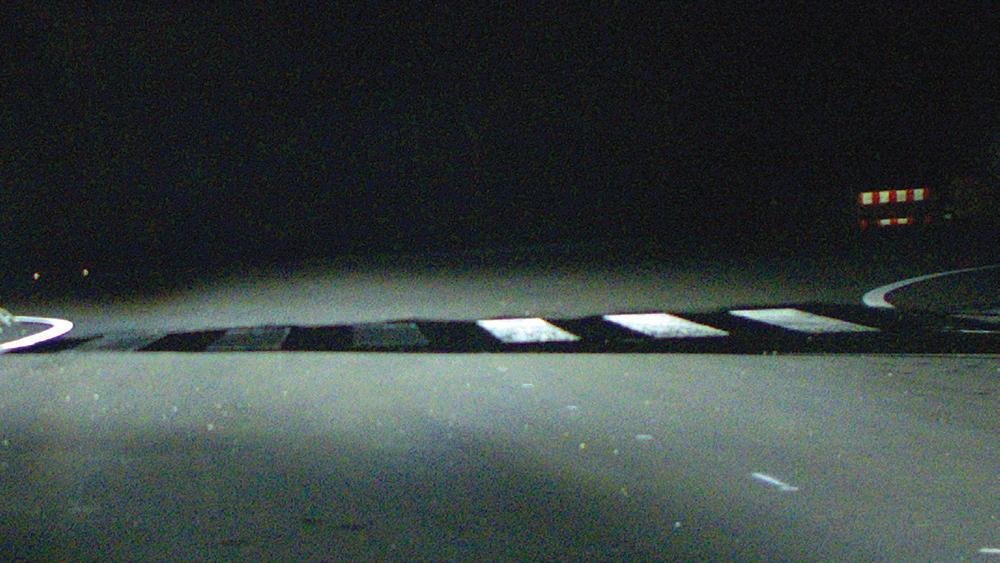
However, if a wet surface at night were considered then that would be inappropriate and misleading.
Under such conditions one could observe the in uence of the roadway surface that became apparently darker. is natural rendering phenomenon would skew the measured outcome[7]. Consequently, despite the contrast ratio being similar to other analysed conditions (Table 1), the at lines were not visible while the structured markings were easy to see.
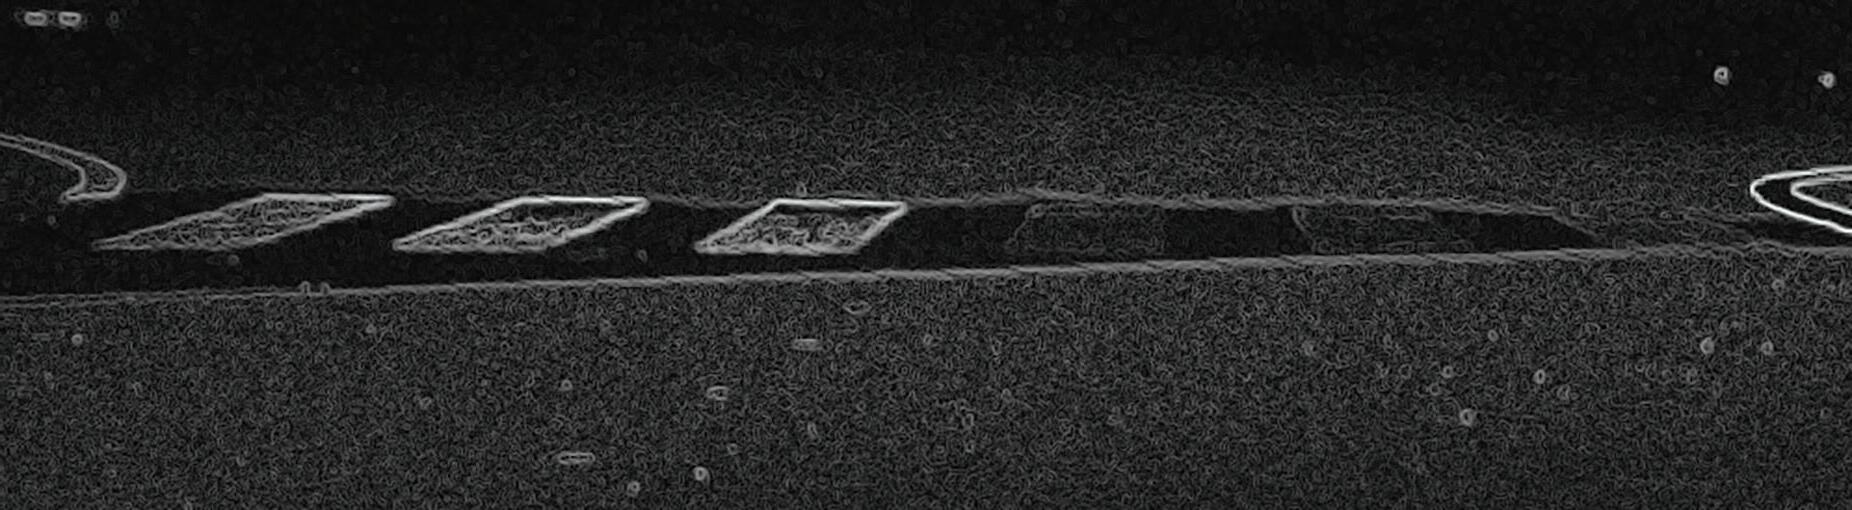
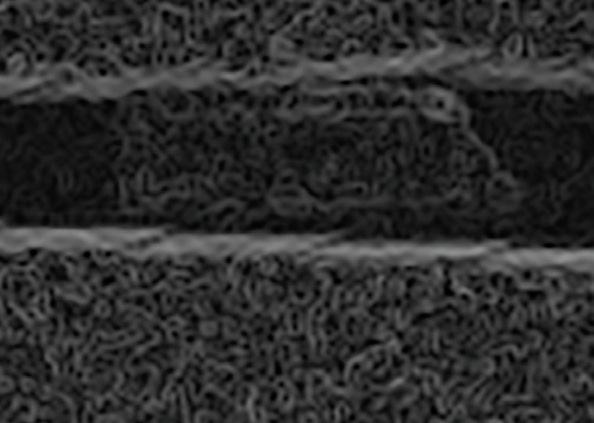
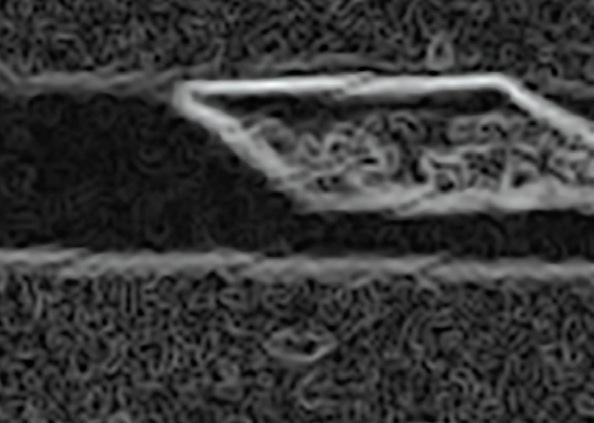
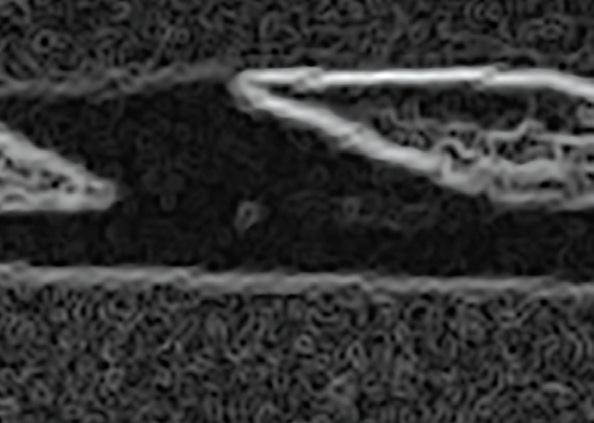
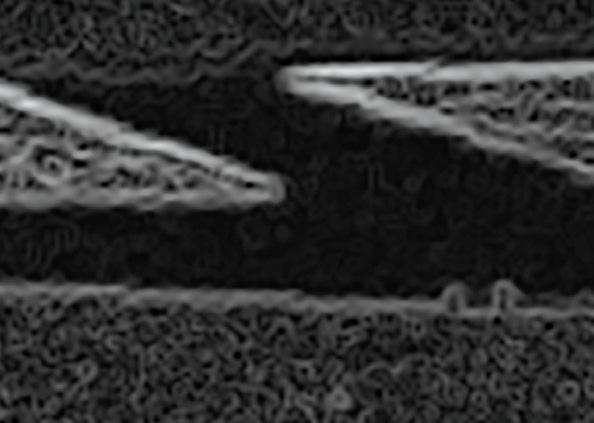
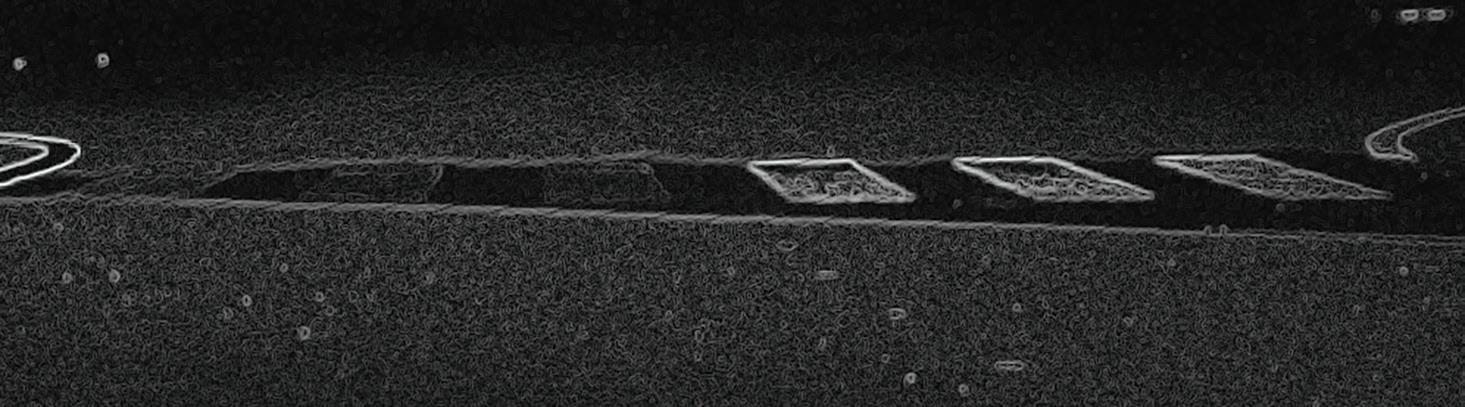
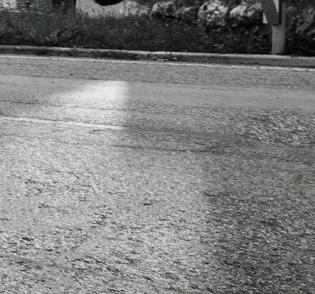
For appropriate evaluation of such cases, one must base the assessment on edge detection. e same image that provided a contrast ratio of 0.33 for the at lines (Type I) and 0.75 for the structured markings (Type II) was subjected to edge detection
lter. e result is shown in Figure 2 A er this transformation, the di erences became obvious – this is what the driver sees and what can be detected by machine vision equipment. Hence, any earlier claims about speci c numerical values of contrast ratio needed for reliable steering appear to have been based on incorrect assumptions that did not properly account for the perceived background luminance change. Further research into this issue, from the perspective of road-marking materials selection, is continuing.
A side-by-side evaluation of road markings has demonstrated an obvious visibility advantage of the structured road markings
at night during rain. While the standard at lines (Type I) could not deliver visibility, the structured markings (Type II) facilitated moisture drainage and remained visible despite ooding. Previous reports related to the required speci c minimum contrast ratio for reliable machine vision recognition (or recognition by human drivers) were shown to inadequately describe the situation. What is necessary is a rather clear distinction of the edges, regardless of the numerical value of the contrast ratio. e improved visibility furnished by structured markings makes driving easier and improves road safety.
It is, therefore, surprising that such road markings are usually not demanded by road administrators. ■


other situations


*Authors Friedrich Wiesinger holds a degree in mechatronic engineering from Johannes Kepler University Linz, Austria. At Swarco, he is team leader of product development for road markings, coordinating development projects of materials and systems as well as scienti c research, including automated driving and tra c safety aspects.

Tomasz E. Burghardt holds a doctorate in organic chemistry. His career experience includes development of various coatings and research on sizing for glass. At Swarco, he is involved with research and their impact on the environment and road safety.
References
[1] Babić, D., Fiolić, M., Babić, D., Gates, T.: Road markings and their impact on driver behaviour and road safety: a systematic review of current ndings. Journal of Advanced Transportation, 2020, 7843743; https://doi.org/10.1155/2020/7843743.
[2] Ran , B., Stiller, C.: e role of machine vision for intelligent vehicles. IEEE Transactions on Intelligent Vehicles, 2016, 1 (1), 8–19; https://doi. org/10.1109/TIV.2016.2551553.
[3] Burghardt, T. E., Mosböck, H., Pashkevich, A., Fiolić, M.: Horizontal road markings for human and machine vision. Transportation Research Procedia, 2020, 48, 3622–3633; https://doi. org/10.1016/j.trpro.2020.08.089.
[4] Pocock, B. W., Rhodes, C. C.: Principles of glassbead re ectorization. Highway Research Board Bulletin, 1952, 57, 32–48.
[5] Burghardt, T. E., Maki, E., Pashkevich, A.: Yellow thermoplastic road markings with high retrore ectivity: demonstration study in Texas. Case Studies in Construction Materials, 2021, 14, e00539; https://doi.org/10.1016/j.cscm.2021.e00539.
[6] Burghardt, T. E., Chistov, O., Reiter, T., Popp, R., Helmreich, B., Wiesinger, F.: Visibility of at line and structured road markings for machine vision. Case Studies in Construction Materials, 2023, 18, e02048; https://doi.org/10.1016/j.cscm.2023.e02048.
[7] Jensen, H. W., Legakis, J., Dorsey, J.: Rendering of Wet Materials. In: Lischinski, D., Larson, G.W. (eds.), Rendering Techniques’ 99, pp. 273–281; https://doi.org/10.1007/978-3-7091-6809-7_24. Springer: Vienna, Austria, 1999
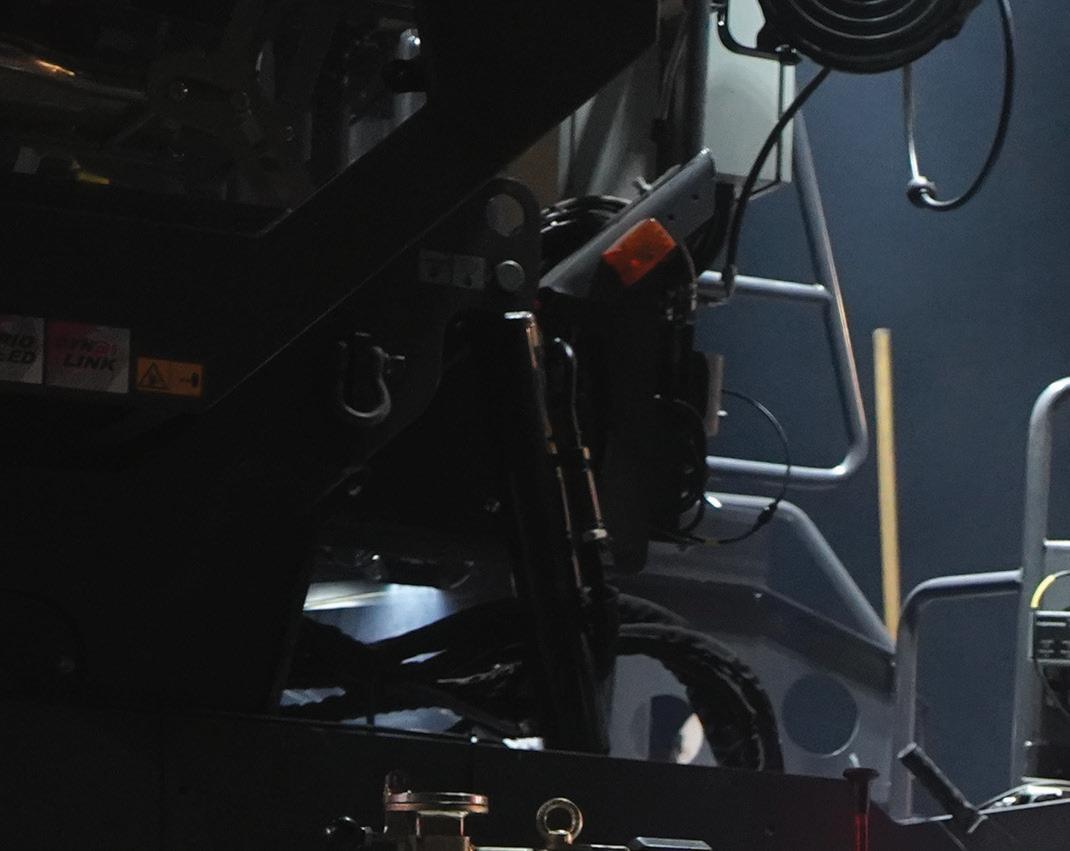
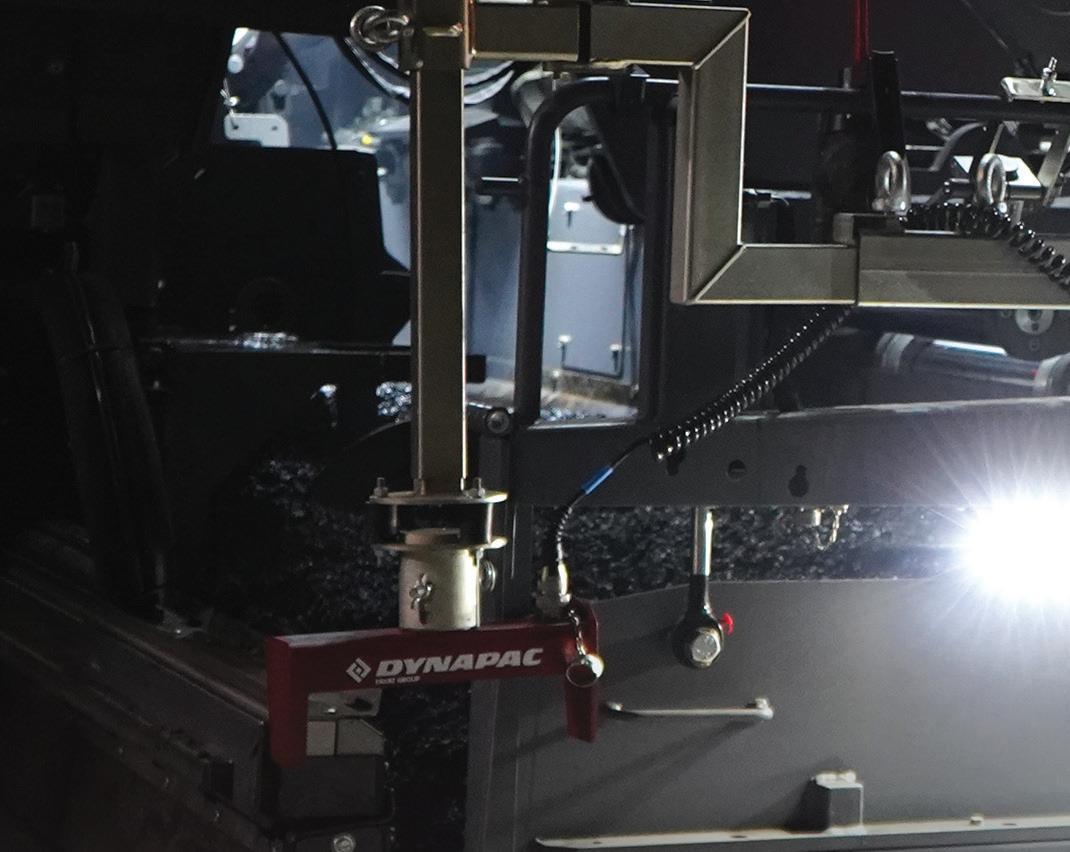


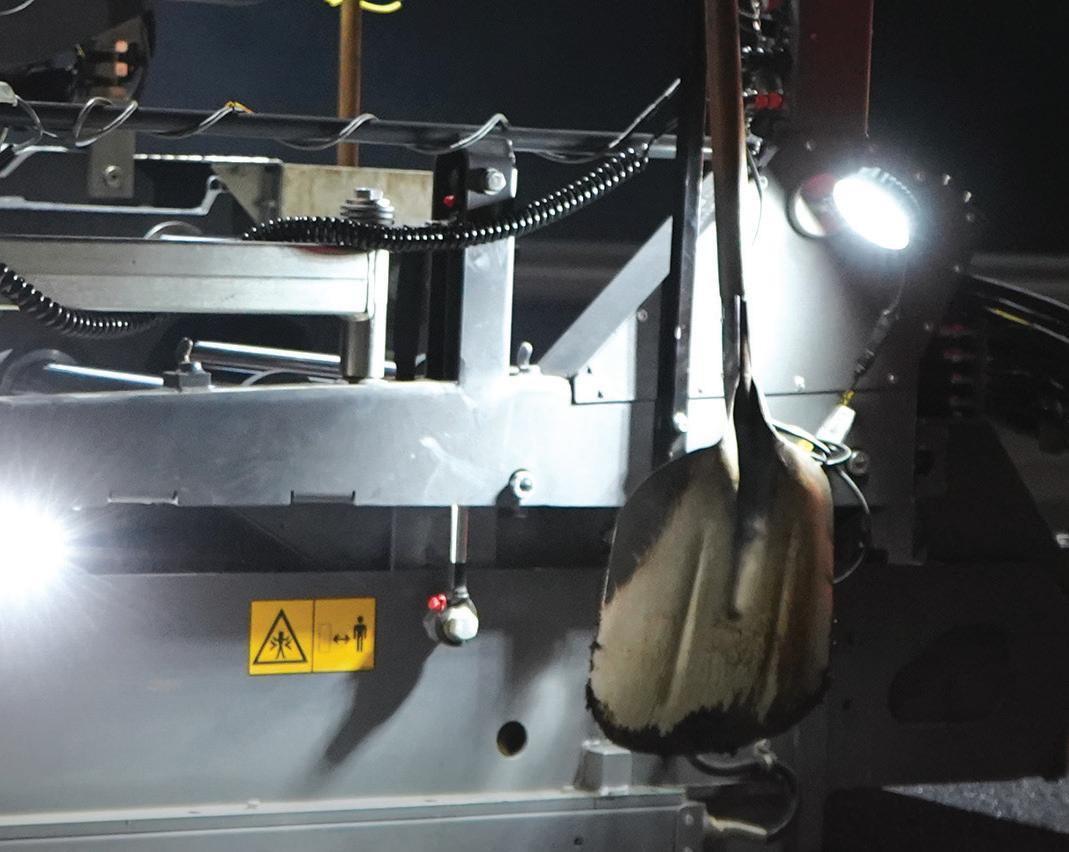
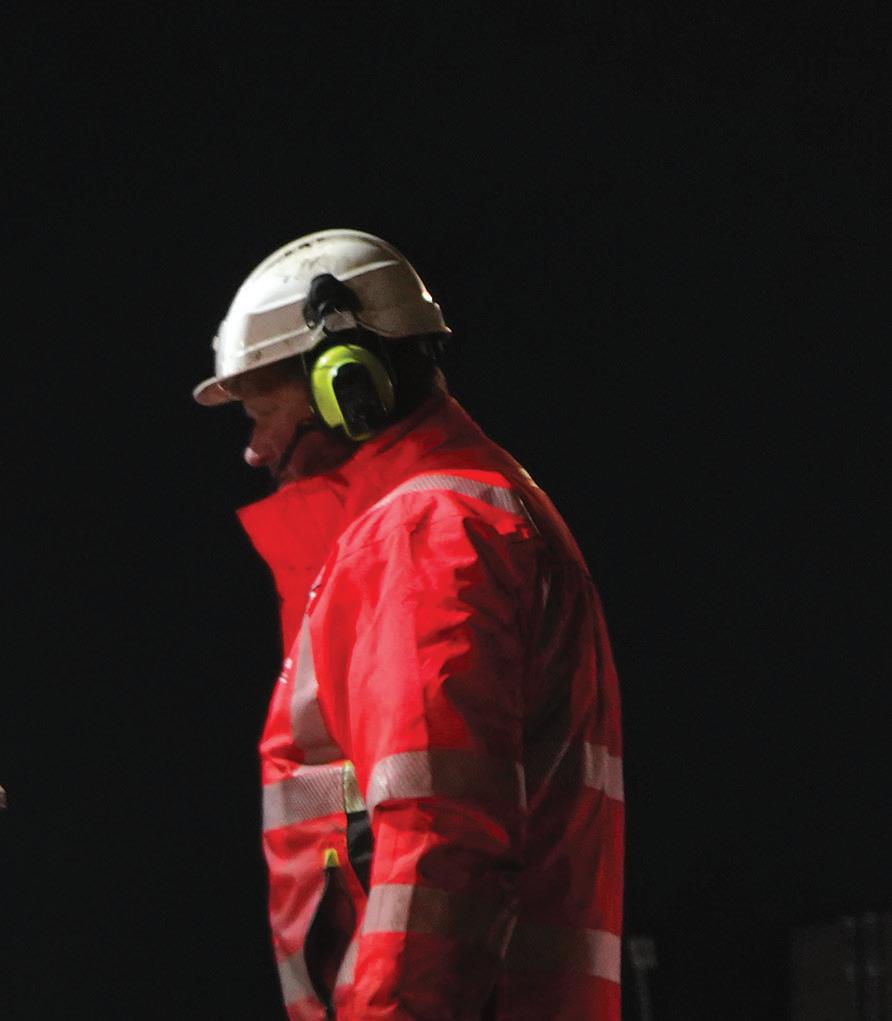

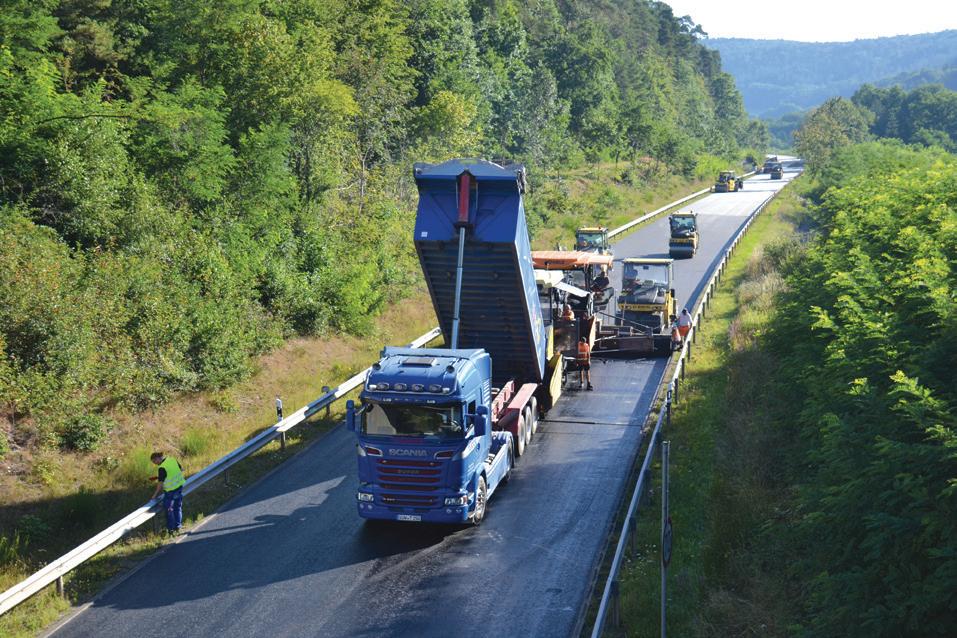
Dynapac’s PROTAC SD2500CS spray paver coupled with its IMIX MF2500CS material feeder proved invaluable for contractor Veidekke Industri on a Norwegian road upgrade.
The nearly 140km-long RV 4 - Norwegian National Road 4runs from the suburbs of Oslo northwards through Innlandet County and close to the town of Gjøvik, From Gjøvik, the road runs along the west side of Lake Mjøsa to the Mjøsa Bridge at Moelv where it joins the pan-European route E6 highway.
Mjøsa is Norway’s largest lake, as well as being the fourth-deepest lake in Norway, averaging a depth of about 150m. As such, and lying close to the populous capital city, it is a popular destination for tourists and weekend sojourns. In 2021, the government began looking at ways to alleviate tra c problems.
At the heart of the road rehabilitation project that took place in May was around 800 tonnes of asphalt for the surface course. In particular, an emulsion rate of 300g/ m2 was applied, resulting in good surface coverage and minimal dispersion of emulsion fumes into the atmosphere.
ENTER VEIDEKKE INDUSTRI
Veidekke Industri, a major player in the Norwegian asphalt industry, has been working on an RV 4 project on the motorway in Raufoss, the administrative centre of Vestre Toten Municipality in Innlandet county. Veidekke is working as a contractor
for the client, Norwegian Public Roads Administration. For the job, Veidekke has been using a Dynapac PROTAC SD2500CS spray paver in combination with a Dynapac IMIX MF2500CS material feeder.
Spray paving is an area in which Veidekke has considerable expertise. e PROTAC spray paver has been an integral part of Veidekke’s arsenal for a long time and has seen much service throughout this year.
“One of the main advantages of the PROTAC machine is its precise and welldocumented adhesive application,” explained Frode Bunes, project manager at Veidekke Norge. “In addition, the machine’s design eliminates the need for extensive spraying over long distances. is reduces the risk of potential supply disruptions due to truck or factory problems.”
e reason for choosing a spray paver for this job lies in the key role played by the tack coats. ese coatings act as a bonding agent, promoting cohesion between existing and new pavement layers which in turn increases the overall strength and durability of the complete pavement structure.
e precision of the spray paver ensures minimal spread of tack coat beyond the intended placement area. Meanwhile, the PROTAC’s spray bars synchronise automatically with the screed’s movement to guarantee complete uniformity and control.
“ e project involves the use of one plant and 12 asphalt trucks, resulting in the transport of 800 tonnes of asphalt on the day,” said Bunes. “Regarding our experience with PROTAC, we tested our prototype during the previous summer and found it to be an excellent machine for our operations. e only problems we encountered were transporting the machine, as it was a little low, and the problem of dust from the spray bar.
“However, the dust problem has been solved and the machine is now running smoothly in this respect. e Public Roads Administration has speci cally requested the use of this type of machine for certain projects,” he said.
SAFETY
Veidekke also has extensive experience working with “warm asphalt” which has its own set of challenges, notes Bunes. Safety is one such challenge. e Dynapac PROTAC played a key role in ensuring strict compliance with safety regulations for this job site and many others like it.
e PROTAC has been designed with careful attention to visibility for the operator. Also, with the operator in mind, Dynapac’s Weather House keeps him or her alert by shielding the person from the elements. is is especially appreciated on those windy and
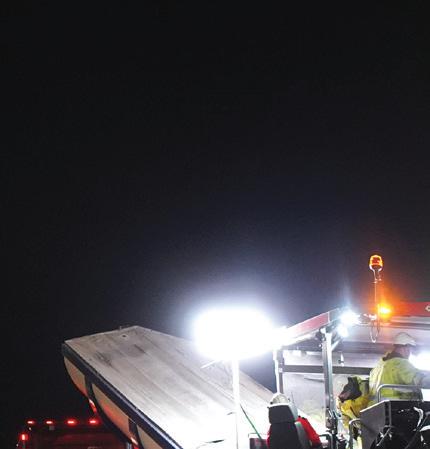
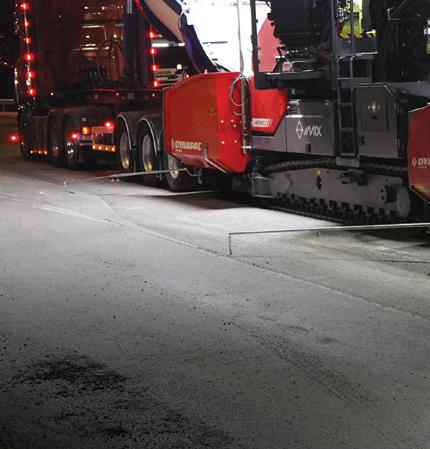
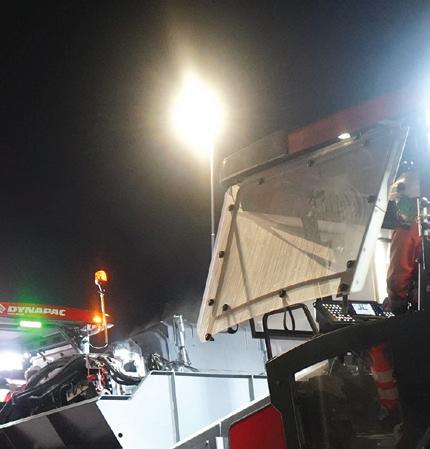
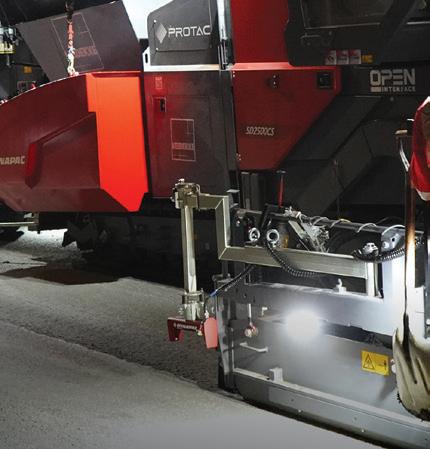
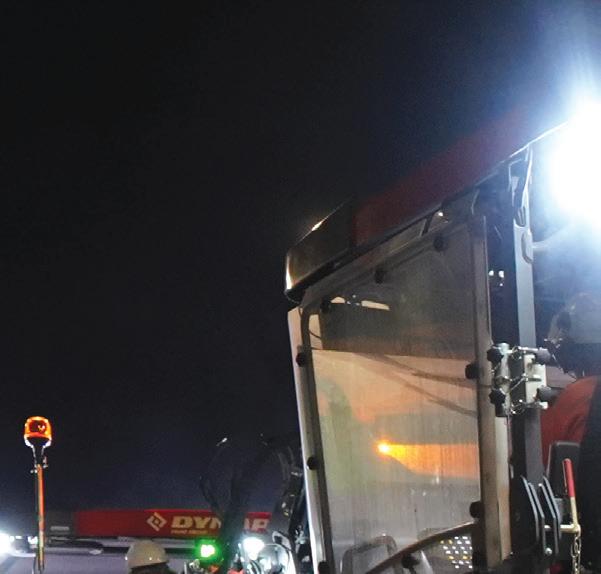
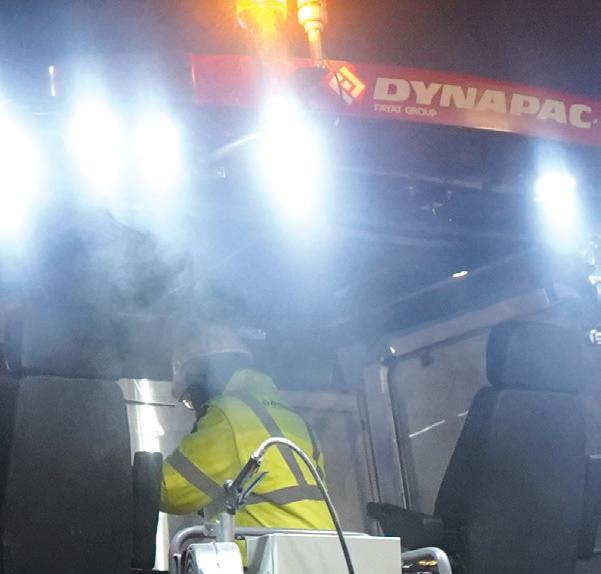
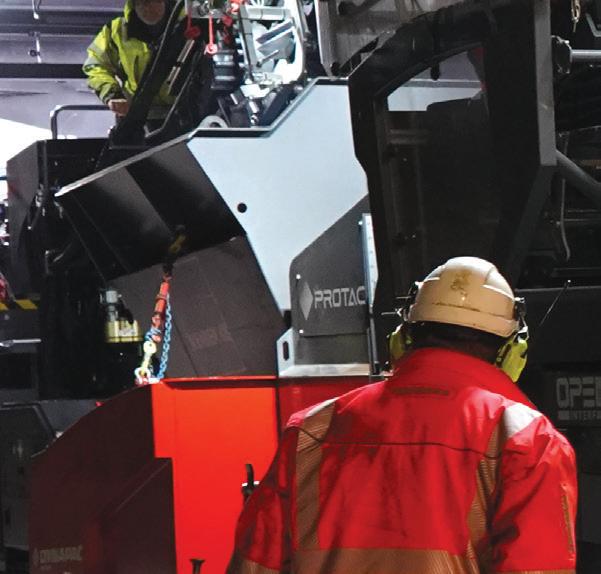
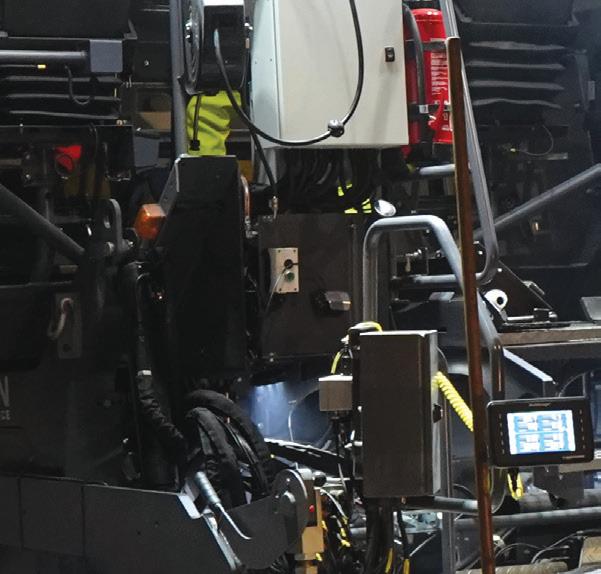
Round-up in Raufoss: a Dynapac PROTAC SD2500CS spray paver working with a Dynapac IMIX MF2500CS material feeder (all images courtesy of Dynapac/Jesper Anhede*)
biting cold nights.
As well, the PROTAC’s Fume Suction System e ectively reduces the dispersion of potentially harmful asphalt fumes within the platform. ese combined features result in a seamlessly safe operating environment.
Another notable bene t of the PROTAC is its potential to deliver signi cant savings


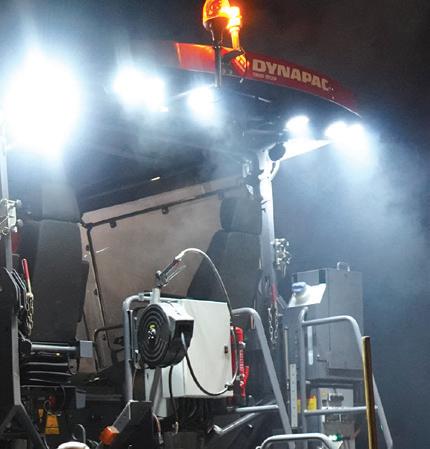


in emulsion consumption. At the start of the Norway project, 2,100 litres of emulsion were loaded into the machine and heated to achieve the optimum working temperature. e con guration of the spray system, which includes critical parameters such as spray rate and automatic controls, has been praised for its user-friendly and intuitive interface.
DYNAPAC’S DYNAMIC DUO
A key objective on site is to limit interruptions to maintain as continuous a work ow as possible. To this end, when it comes to managing project schedules, the twinning of a PROTAC SD2500CS spray paver with an IMIX MF2500CS material feeder has proven to be formidable for Veidekke’s quest to meet deadlines.
e IMIX feeder ensures an uninterrupted and consistent ow of materials. e normal transport width is 2.5m. It has a conveyorbelt lifetime up to 3,000 hours and uses less than 10 litres of fuel per hour.
At the end of on-site work, e cient cleaning of machinery is imperative to maintaining their performance. “While there may be some challenges associated with cleaning a er paving, it’s important to note that this issue is common to all machines and is not unique to our setup,” said Bunes. However, Dynapac has been particularly innovative in this regard.
An advanced cleaning system features an automatic spraying mechanism tailored to the conveyor belt, complemented by an enlarged







release agent hose and strategically positioned hose connections at the front and rear of the feeder.
ese components work in synergy to provide a comprehensive and trouble-free cleaning process.
e heated scraper - an invaluable asset during post-use cleaning routines - ensures quick and e ortless cleaning a er each operating cycle.
Its con guration acts as a safeguard, preventing the build-up of residue or stubborn substances on the machine itself, thereby avoiding potential complications. is design not only improves operational e ciency, but maintains a cleaner and safer working environment.
e adaptability of the heated scraper also adds an extra level of practicality. It can be easily deactivated when handling cold materials, demonstrating the system’s versatility when confronted with varying work scenarios and di erent materials.
“Correct asphalt mixing is essential to prevent segregation,” said Bunes. “We
MASS
Weight (incl. standard screed) - 23.2 tonnes
ENGINE
Cummins QSB6.7-C200, rated 149kW @ 2200 rpm
DIMENSIONS
Front ramp angle - 12°
Working width, max - 9.7m
Spraying width, max - 6.5m
CAPACITY
Paving thickness -min 150mm / max 310mm
MATERIAL HOPPER
Capacity - 6m³
Dumping height - centre 555mm / outside 560mm
Hopper width, internal - 3.29m
TRACTION
Max. paving speed - 28m/min
Max. transport speed - 4km/h
SPRAYING SEGMENT
Emulsion tank capacity – 2,100 litres; electrically heated
Number of nozzles - 25
Number of spray bars - 3
found that the elevated cab of the IMIX is a particularly operator-friendly feature that greatly assists the unit’s performance. It allows the operator to remain stationed at the control panel but maintain a full view of the machine’s operation.”
At the end of the day, achieving a uniform
and even surface was of paramount importance for this project. “ e combination of PROTAC and IMIX units ensures greater consistency in the asphalt paving process,” said Bunes. ■
* More images by Jesper Anhede can be seen on his website: https://anhede.se/





PROTAC SD2500CS SPRAY PAVER Contact us to find the right FAE product for you: info@fae-group.com fae-group.com
Spray rate - min 0.2kg/m² /max 1.6kg/m² (Slidable spray bars automatically follow the screed movement)

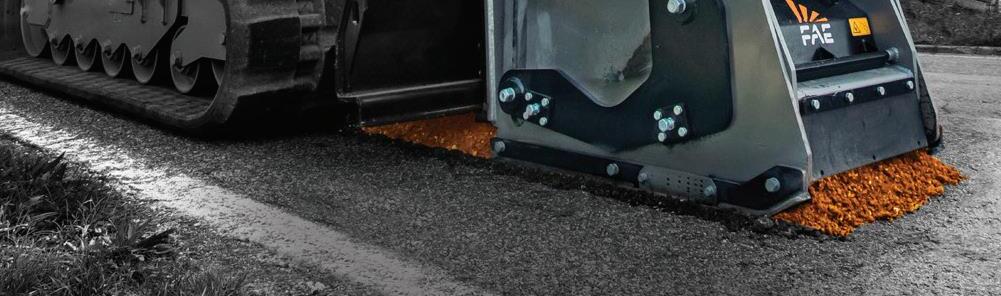
A new era has begun for skid steer and excavator road planers. The FAE RPL/SSL , RPL/SSL/DT, RPM/SSL and RPL/EX are dedicated to resurfacing roads in preparation for laying a new layer of asphalt or concrete. The FAE RWM/SSL , with disc rotor is ideal for creating conduits to lay electrical, water, gas or fiber optic pipelines.





A study into the financial benefit of visual road inspections versus inspections completed with a falling weight deflectometer and a traffic speed deflectometer
Good road asset management relies to a large extent on the accuracy and frequency of road-condition data that is analysed in a PMS (pavement management system). It should rank the condition of the roads to identify appropriate remedial measures for allowing agencies to efficiently use maintenance funding. This paper focuses on the most cost-effective ways to obtain this essential data. It compares the techniques used in South Africa – based mainly on visual condition assessments - with more recently developed methods that enable a much more comprehensive and largely automated data collection.
2) Falling weight deflectometer (FWD) measuring deflection together with automated roughness, rut depth, texture measurements and high-resolution digital imaging from a network survey vehicle (NSV)
3) Traffic speed deflectometer device (TSDD) to capture data including continuous deflection measurements, roughness, rut depth, automatic crack detection, imaging and texture in a single pass at traffic speeds.
The scenarios are compared using the Highway Development and Maintenance Management System (HDM-4) developed by the World Bank for verifying the engineering and economic viability of road investments.
For this study, a 66km simulated “road network” consisting of several roads in the Kwa-Zulu Natal and Eastern Cape provinces was created.
The data required to analyse the economic life cycle in the HDM-4 system is traffic volume, pavement structure, various condition parameters and geometric properties (see Table 1).
The pavement structure and condition of these roads is variable whereas HDM-4 requires uniformity to accurately define and analyse economic life-cycle effects. The process of dividing the road network into uniform sections is discussed in detail later.
Three methods of assessing the condition of the road sections were used. Firstly, by manual visual assessment. Secondly, using a combination of NSV and FWD. Finally, using an iPAVe (intelligent pavement assessment vehicle) TSDD that measures simultaneous and integrated structural and functional condition data.
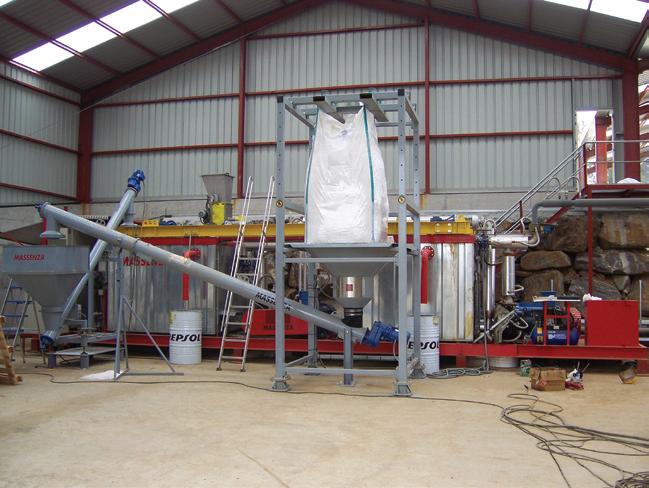
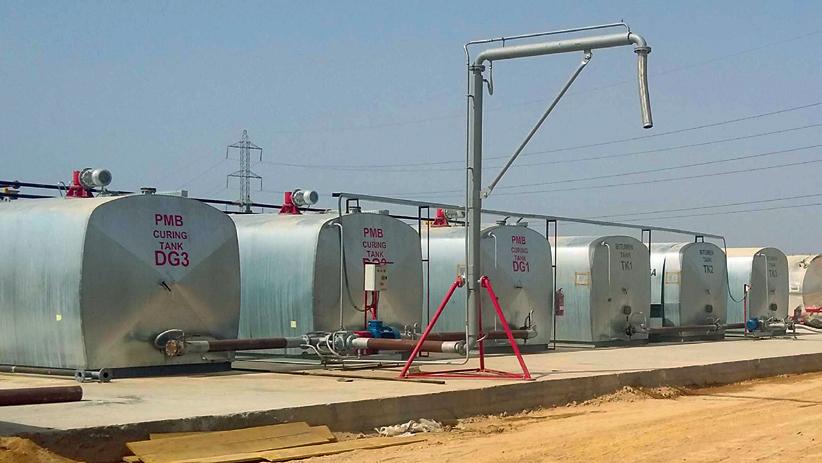
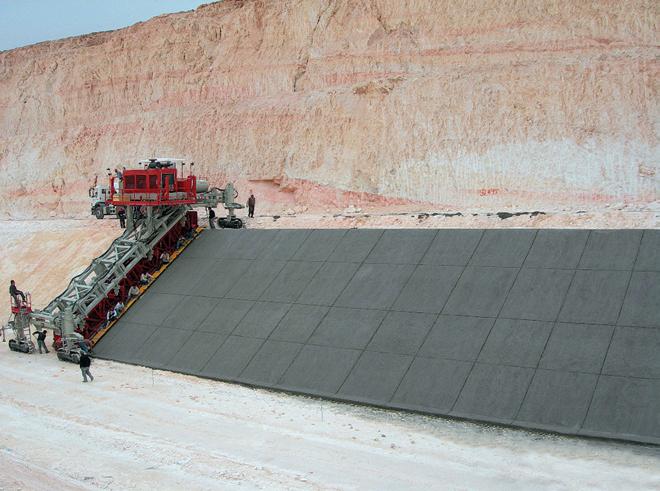
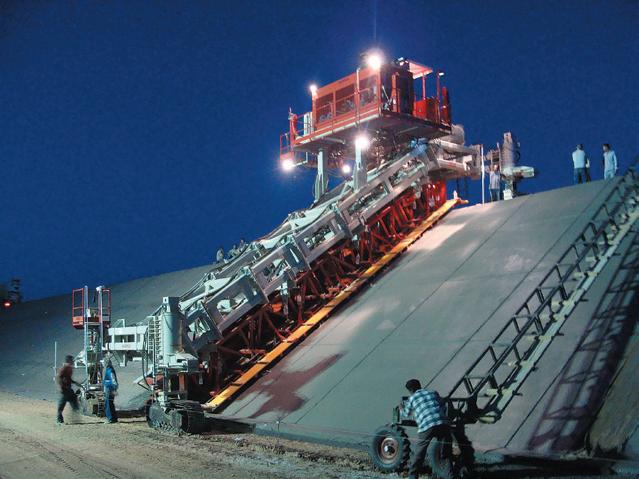
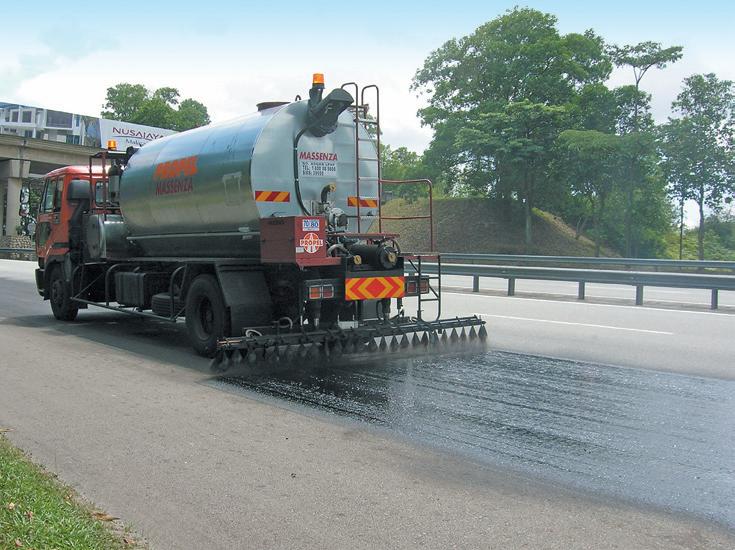
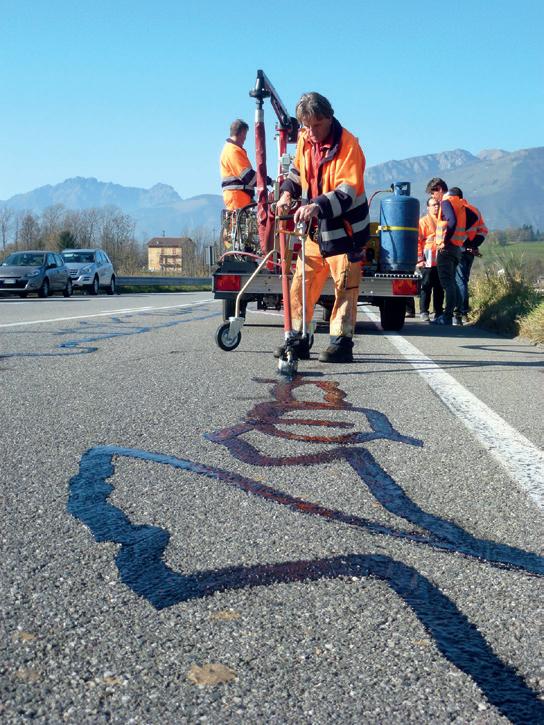



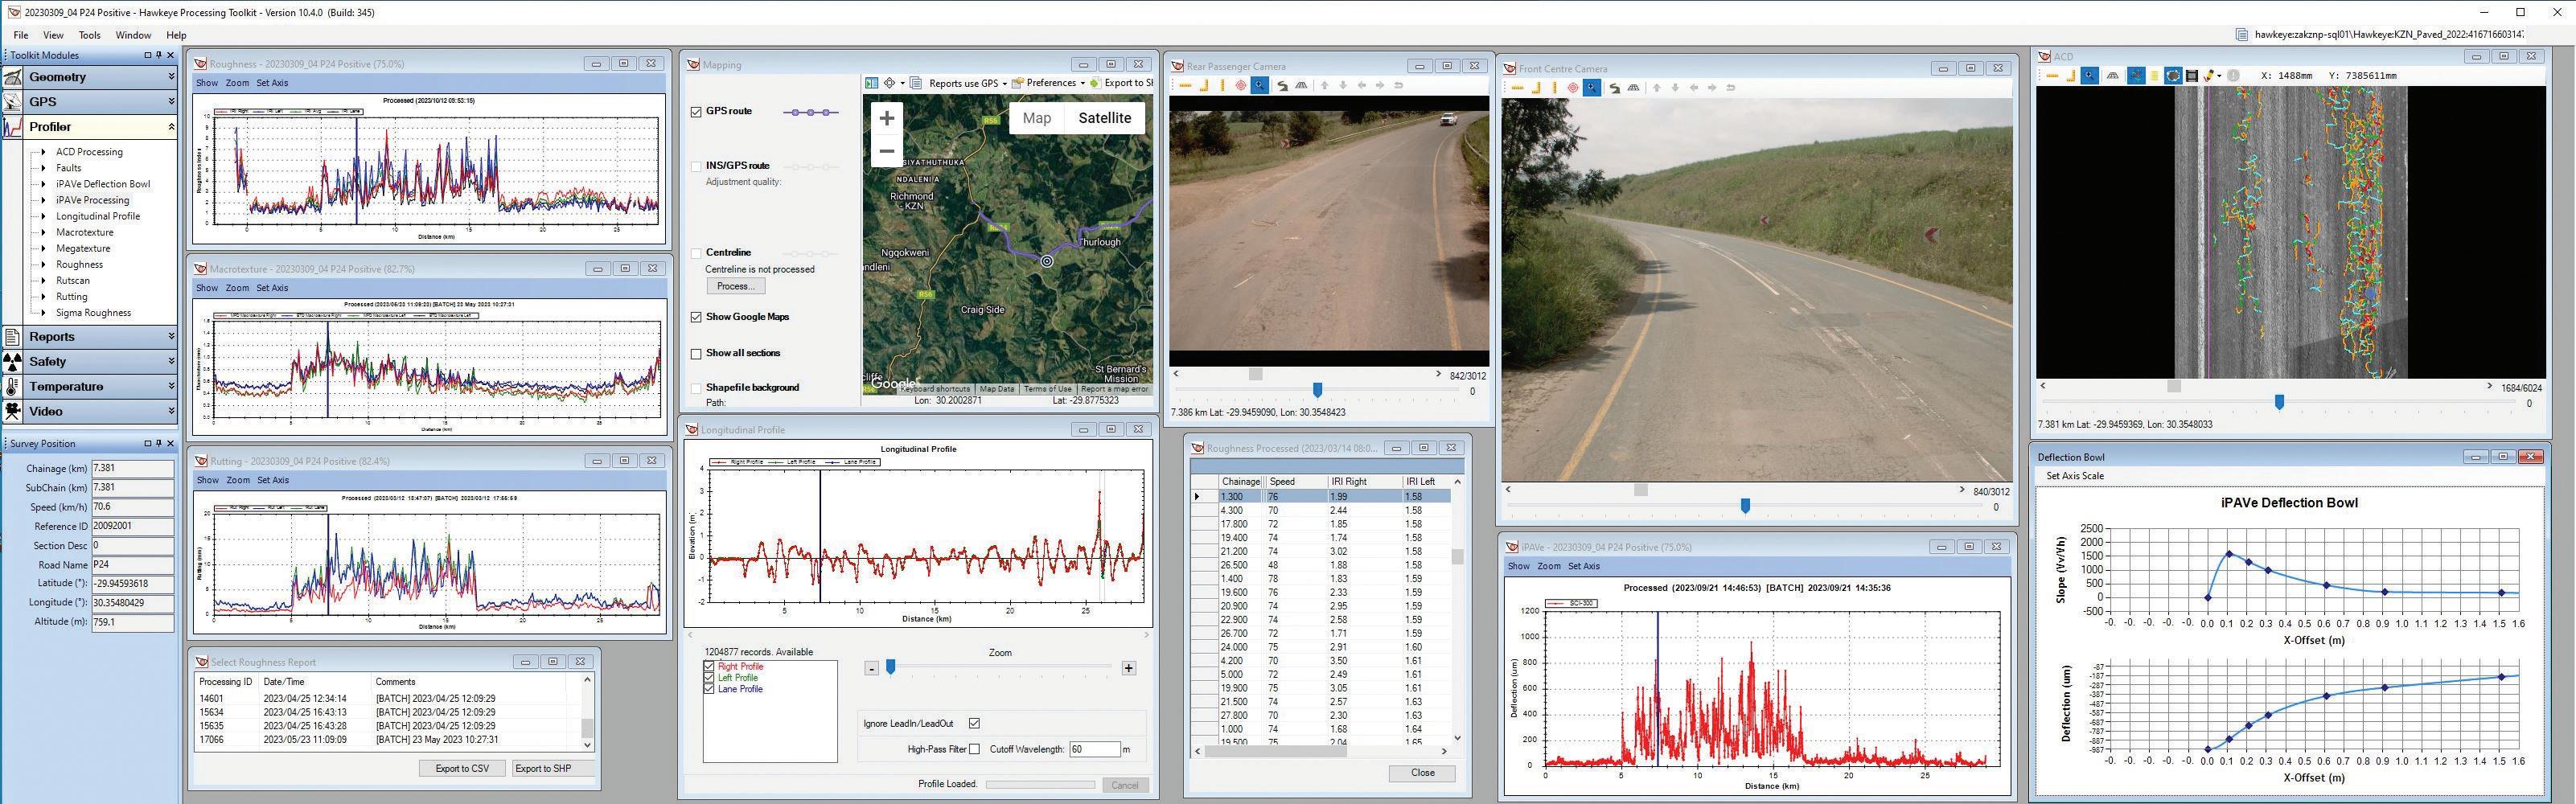
The visual method was based on South African standards in accordance with the COTO TMH9 2016 Part B. This manual provides a standard method for the visual condition assessment of flexible paved roads at network level for use in pavement management systems. Different distress types are classified and detailed descriptions of degree and extent of distress are given. Assessments are based on surface and structural distress descriptions as well as functional items such as assessment of riding quality and drainage, etc.
Modes of distress are defined as deformation, cracking and disintegration of the surfacing. Each of these modes may occur in one (or more) typical manifestations called the various “types” of distress. For example, crocodile (alligator) cracks, surface cracks, block cracks, transverse cracks and longitudinal cracks are included in the cracking mode. Meanwhile, rutting and undulation would be typical deformation modes.
During visual assessment the various types of distress are further defined into “degree” and “extent”. Degree 1 indicates no attention is required. Degree 3 indicates maintenance is required in the near future. Degree 5 indicates immediate attention required. Similarly, “extent” is rated Extent 1 to indicate an isolated occurrence of distress. Extent 3 is intermittent occurrence and Extent 5 is extensive occurrence.
Segment lengths into which the visual assessments are divided may differ. But they are usually regarded as lengths of 5km for rural roads and 2km for peri-urban (an
area immediately adjacent to a city or urban area) roads and freeways with urban roads typically segmented by intersections.
The second method of condition assessment was by analysing data captured by an NSV as well as by the analysis of deflection measurements carried out using an FWD. The NSV collects rut depth, texture depth and roughness data together with digital imaging at traffic speeds. The data is linked to accurate linear measurement systems and GPS coordinates which enables the collection of geometric properties.
The FWD originated in France in the 1960s and is the most widely used deflection measurement device in the world. It simulates a moving wheel load by dropping a short impulse load onto the pavement.
The pavement’s response to the load creates a deflection bowl which is measured by geophones positioned at various distances from the load centre.
Historically, the FWD has generally been considered to be the most suitable device for deflection surveys. However, the stationary testing at each test point raises traffic accommodation and safety concerns. Also, the stop-start nature of the FWD test means that deflections are usually performed at a low frequency – typically at 200m intervals for network-level assessments.
The third assessment method, the TSDD, enables continuous deflection measurements and other condition parameters to be taken at traffic speeds of up to 80km/h. The iPAVe
version of the TSDD uses a Doppler laser beam technology to measure the vertical displacement velocity at various offsets from the loaded wheel. The “area under the curve” method by Muller and Roberts (2013) is used to convert deflection slopes to a deflection bowl. This represents the pavement’s response to the wheel load of the TSDD.
The iPAVe features a 7-laser Doppler beam in front of the left rear wheel. It includes spatially geo-referenced integrated laser crack detection, digital imaging and a Class 1 laser profilometer, in addition to the traffic speed deflectometer used for structural measurements. This allows for a comprehensive pavement assessment that simultaneously provides integrated functional and structural condition data.
Compared to the FWD, the TSDD has the ability to measure a much higher deflection measurement frequency (every 25mm) at traffic speed. This allows for significantly improved production and safety for the road user and operator. The iPAVe TSDD with typical condition assessment output is shown above.
Each of the roads in Table 1 was considered a portion in a road network. In the first scenario, data was limited to visual assessments while driving at 20km/h.
In the second scenario, visual assessments were taken by post-rating high-definition photographs taken by the NSV at 20m-intervals along the selected roads. Visual assessment data was supplemented by FWD deflection measurements every
200m as well as by continuously measured roughness, texture depth and rutting obtained from the NSV.
The third scenario relies on output from the iPAVe and is similar to the second scenario, with the exception of being collected by a single vehicle and being capable of continuous deflection measurements and high-definition automated crack detection. These two properties enable identification of exact areas with structural distress and accurate estimation of cracking type, severity and extent. It thereby provides objective rather than subjective input to the sensitive decision-making algorithms of HDM-4.
The roads listed in Table 1 were further divided into uniform sections for each scenario based on pavement structure and condition data. A uniform section is identified as a section of road that is uniform
3. Inventory of Available Data for Each Scenario
in roughness, deflection measurement and pavement structure. This allows for accuracy in defining each segment of the road network to ensure that the proposed remedial works, as identified in HDM-4, are relevant and applicable to the road condition.
The length and number of each uniform section identified differs for each scenario due to a variable extent of data available for each scenario.
For example, uniform sections for Scenario 1 are based solely on visual assessment whereas those for Scenarios 2 and 3 are based also on deflection, profiling and, for Scenario 3, automated crack detection. The identified uniform sections for the three scenarios are shown in Table 2 and an inventory of condition data is shown in Table 3.
Scenario 1 has a degree and extent rating of various distresses such as cracking
Note: *1 The structural number (SN) is derived from layer thickness and coefficients for Scenario 1 whilst this is calculated from actual data for scenario 2 and 3. *2 Cracking from post-rated visual assessment in Scenario 2 and from automated crack detection in Scenario 3
(crocodile, longitudinal and transverse), ravelling, rutting, potholes, patching, edge break, undulation, binder condition and bleeding. The types of distress required for HDM-4 input include cracking, ravelling, rutting, potholes, texture and edge-break area.
The limitations of using visual condition assessment data, as done for Scenario 1, are that the extent and degree rating (1 to 5) are subjective and do not provide an accurate determination of these distressesas required by HDM-4. A basic estimation method of converting extent and degree into surface area was used to populate and define the HDM-4 road network for scenario 1. These parameters are more accurately estimated for Scenario 2 and 3 using the additional laser equipment and imaging of the NSV and iPAVe.
Scenario 2 and 3 use superior accuracy data collected by the NSV and iPAVe for all the required condition inputs. Scenario 2 makes use of the cracking distress rating obtained from the post-rated visual condition assessment data to estimate cracking input.
In Scenario 3, the automated crack detection functionality of the iPAVe, in combination with the ARRB Systems Hawkeye Toolkit, is used to accurately calculate the cracked percentage of the road from the laser survey. The NSV and iPAVe data used for Scenario 2 and 3 respectively, uses the same technology and equipment that results in similar IRI, texture depth and rutting measurements.
The deflections of the FWD are recorded as a single measurement every 200m (5m per kilometre) which provides a mere 2.5% coverage if 5m coverage per deflection point is assumed. Whereas the iPAVe provides continuous deflection measurements processed to 5m-intervals (200 per kilometre). This allows for 100% coverage and precise identification of locations where changes in structural conditions occur. It also enables localised areas of failure or poor structural condition to be identified. Maximum deflections from the FWD and iPAVe are used to calculate the SN using the built-in HDM-4 functionality.
In Table 4 there is significant discrepancy between the visually assessed rutting and IRI when compared to the measured values. The structural number calculations for scenario 1 are based on assumption rather than measurement as per Scenario 2 and 3, with the difference being significant to the HDM-4 output.





Table 5. Work Standard Alternatives Available for Each Scenario
Better quality and higher accuracy/frequency data used into a PMS allows for more informed maintenance expenditure decisions. An economic analysis and comparison of the three scenarios has been used to quantify the capital and recurring cost over a typical life cycle of the simulated road network. This study assumes, for all three scenarios, a 20-year analysis period and a discount rate of 8%, as per South African standard practice. HDM-4 is used to define the road network, work standards and strategic analysis for each scenario. The programme applies each work standard over the analysis period of each uniform section in order to optimise and determine which work standard is most economical. The work standard alternatives and their maximum intervals used for this study are shown in Table 5.
The unit cost of each alternative was estimated using current industry-related
construction costs. The unit cost of the economically preferred alternative is applied to each uniform section over the analysis period and discounted to a present value. This total discounted cost for each scenario consists of a recurring cost and capital cost. The recurring cost represents the maintenance cost over the analysis period with the capital cost representing the initial cost of the selected remedial intervention that are implemented on the road sections.
The “Maximise Net Present Value” (NPV) optimisation method function in the HDM-4 strategic analysis was used to perform the economic life-cycle analysis on the road network for each of the three scenarios. This optimisation function allows the selection of the most cost-effective set of maintenance and improvement standards over the analysis period.
The important economic indices are the discounted costs of each scenario. These
enable the determination of possible savings in expenditure on the road network. This can be compared to the operational cost of data collection for each alternative. The discounted costs in Table 6 are expressed in South African Rand (ZAR) per km in order to compare with the data collection cost.
The savings per kilometre relative to the total discounted cost for Scenario 1 are R 105,225 per kilometre for Scenarios 2 and R 120,381 per kilometre for Scenarios 3.
The higher cost for Scenario 1 is directly related to the input data collected during visual assessment. These input parameters required by HDM-4 are estimated from degree and extent ratings and are often less accurate (as in Table 4) due to being based on subjective human observation rather than measurement fact. A conservative approach is often followed to counter the risk of inaccurate measurement data leading to either over-expenditure on the road network or, more likely, reduced maintenance if budgets are constrained.
Scenario 2 provides significant discounted cost savings of R 105,225 per kilometre compared to Scenario 1 due to the accurate rutting, IRI, texture and deflection measurements obtained from the FWD and NSV devices. The largest contribution to the cost savings is from recurring cost; this highlights the importance of obtaining accurate instrument data for maintenance decisions at network level.
The discounted cost savings of R 120,381 per kilometre for Scenario 3 is approximately 15% higher than for Scenario 2 with a cost



1
savings of R 105,225 per kilometre. e high accuracy of automated crack-detection laser technology allows for a precise measurement of cracking of the road as well as enabling the percentage of wide cracks to be identi ed - a highly sensitive and critical input for HDM-4.
Based on the ndings of this study, there is a clear and signi cant cost bene t or savings using the latest road condition assessment technology to obtain data for input to PMS. ere is, however, a cost implication if using the NSV, FWD and iPAVe devices.
e cost of data collection for the three scenarios has been estimated using marketrelated prices. Scenario 1 involves two certi ed visual assessors in a passenger vehicle driving at 20km/h. ey occasionally stop to inspect the road and ll in visual assessment forms, either paper-based or electronic. An all-inclusive estimated operational cost of R 163 per km has been calculated for Scenario 1.
e cost for Scenario 2 includes the operation of a FWD and NSV vehicle and involves operators for each device. Due to the stop-start nature of the test, a safety vehicle behind the FWD has been factored into the cost. It also includes a post-rating visual assessment of the road. e total estimated operational cost of Scenario 2 is R 2,250 per km. e production rate of the FWD - the limiting factor for this scenario - is estimated at approximately 200km per day. e FWD test is performed every 200m or ve times per km.

Scenario 3 involves only the iPAVe TSDD and operators. No safety vehicle is needed because of the 60-80km/h testing speed. e total estimated operational cost of Scenario 3 is R 3,500 per km. e production rate of the iPAVe is estimated at approximately 400km per day.
A comparison between discounted cost savings per km and operational cost for each scenario compared to Scenario 1 is listed in Table 7. It is clear that there is a signi cant bene t or saving in road agency expenditure even with the comparatively high cost of the road condition assessment equipment compared to conventional methods.
e bene t or savings for using the iPAVe TSDD is R 13,355 per km more than using the FWD and NSV combination. is is even though the operation cost of the iPAVe is double that of the NSV and FWD combination. If this bene t were applied to the entire South African paved road network, a saving of over R 2 billion would be realised. When compared to manual visual assessment, the use of iPAVe TSDD would return a R 19 billion saving.
In addition to the cost savings, the iPAVe TSDD provides high-frequency de ection measurements that can, in combination with the digital imaging, identify localised failures, locate shallow underground services and roads that are structurally de cient but show no visual distress.
e main conclusion from this study is that

accurate road condition assessment data is crucial for making appropriate expenditure decisions to optimise the life-cycle management of roads. With this in mind, the bene t of using the FWD-NSV combination is clearly shown to save approximately R 103,688 ($7,400) per kilometre and for iPAVe around R 117,043 ($8,400).
Meanwhile, the 100% coverage full spectrum iPAVe TSDD provides superior road condition assessment data compared to the FWD and NSV combination enabling more accurate input to the HDM-4 analysis with resultant cost saving in the order of R 13,355 ($1,000) per km. In addition, the high de ection frequency of the iPAVe eliminates the need for additional routine de ection testing at project level, except for localised investigations.
It is recommended that this limited study be extended to a larger road network which includes a wider variety of road conditions. e use of xed-length segments should be investigated in addition to uniform sections, as is used in this study. ■
www.nexorsa.com
www.arrbsystems.com
*Author:
e author, Simon Tetley, is a civil engineer and director of ARRB Systems, a specialist service provider in road asset/pavement management solutions based at the Exton o ce in Pennsylvania. He is also a group executive for pavement and materials engineering at Nexor Consulting in Cape Town, South Africa.
e new standard (called D8458) will be used to assess the resistance of di erent types of asphalt mixtures to fatigue cracks in road surfaces (image: David Arminas/World Highways)
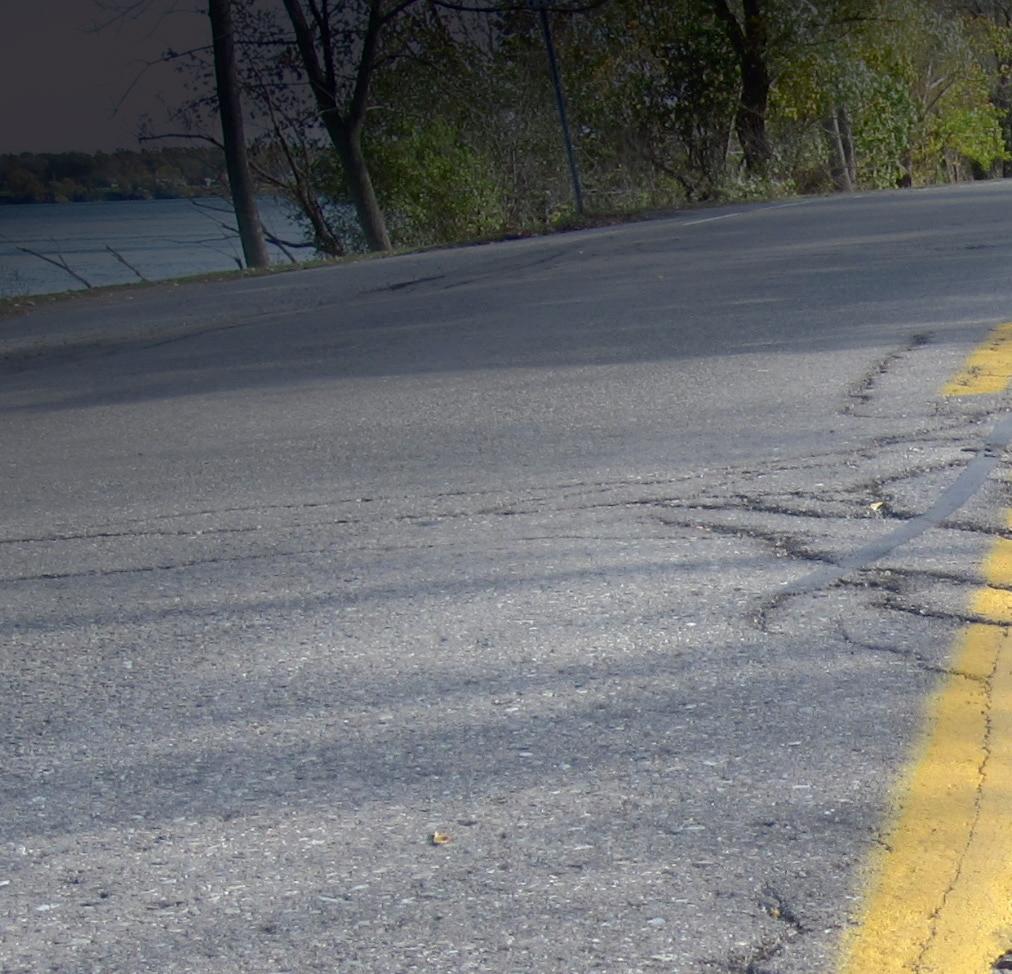
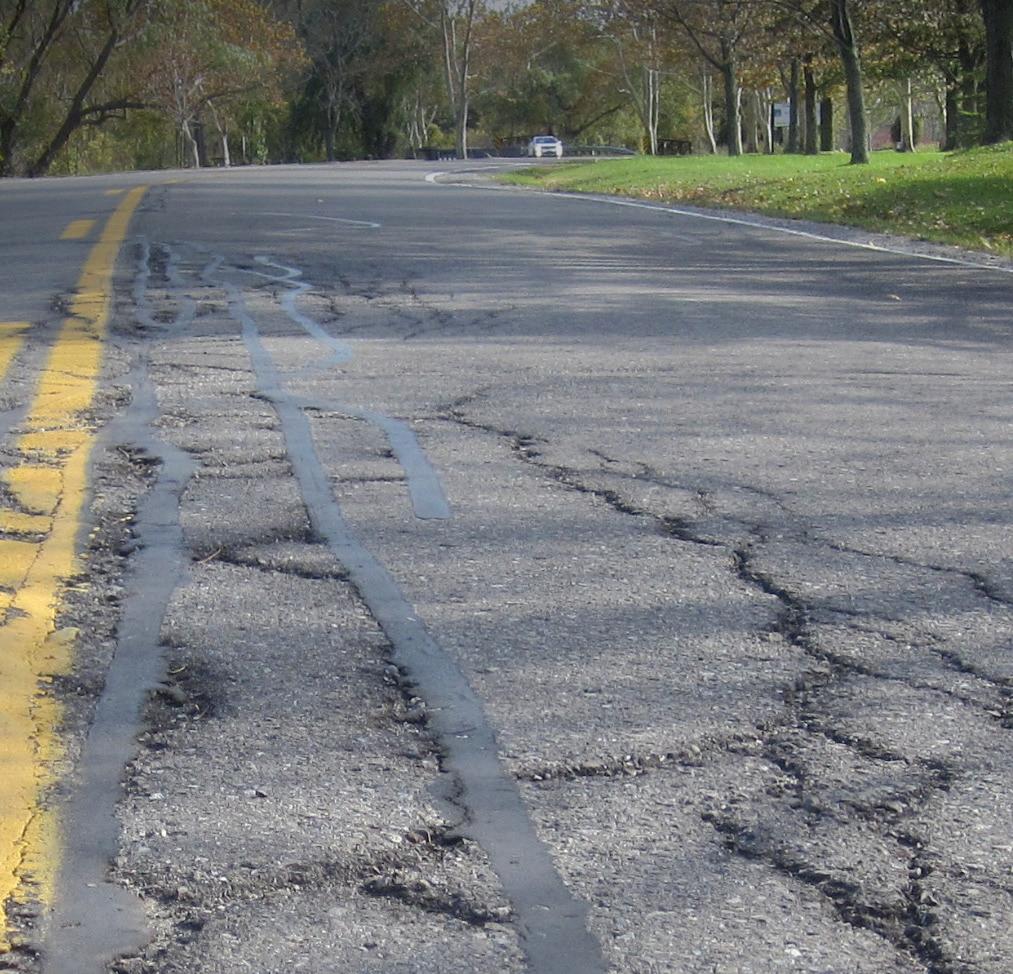
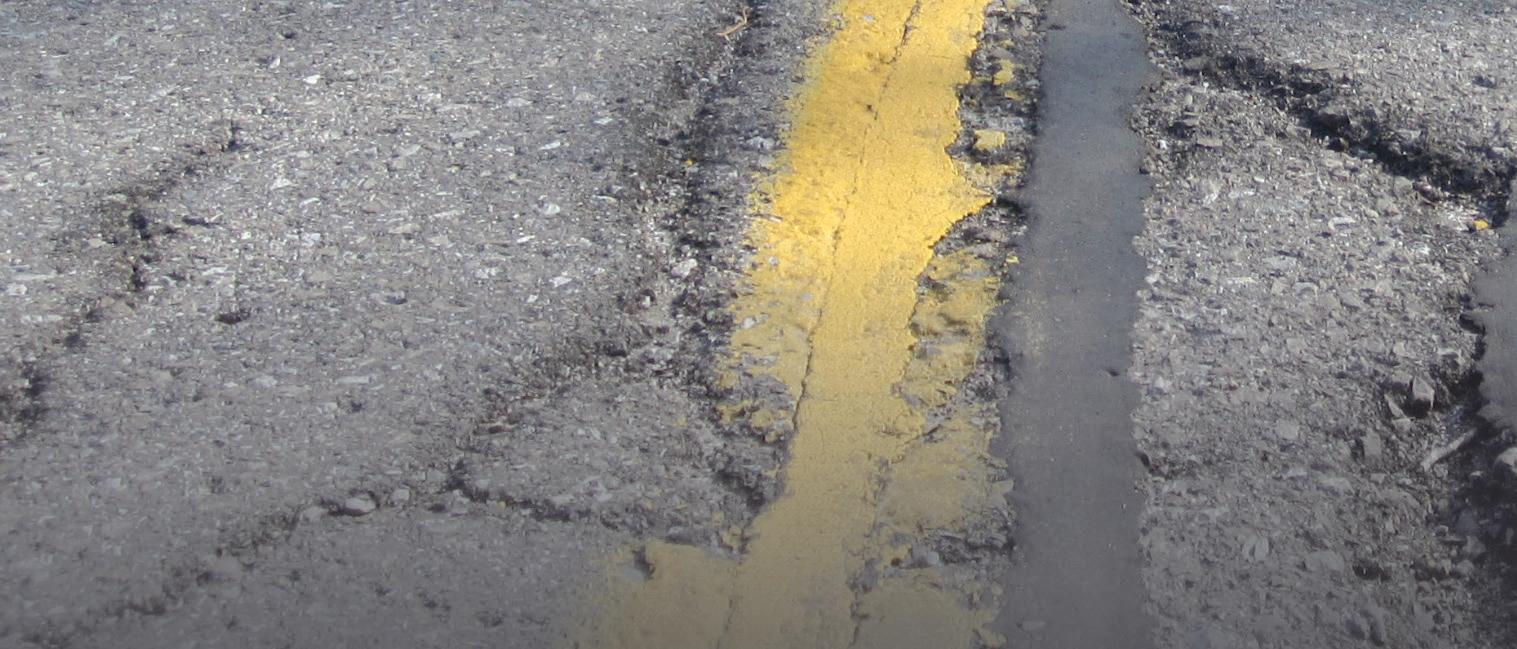


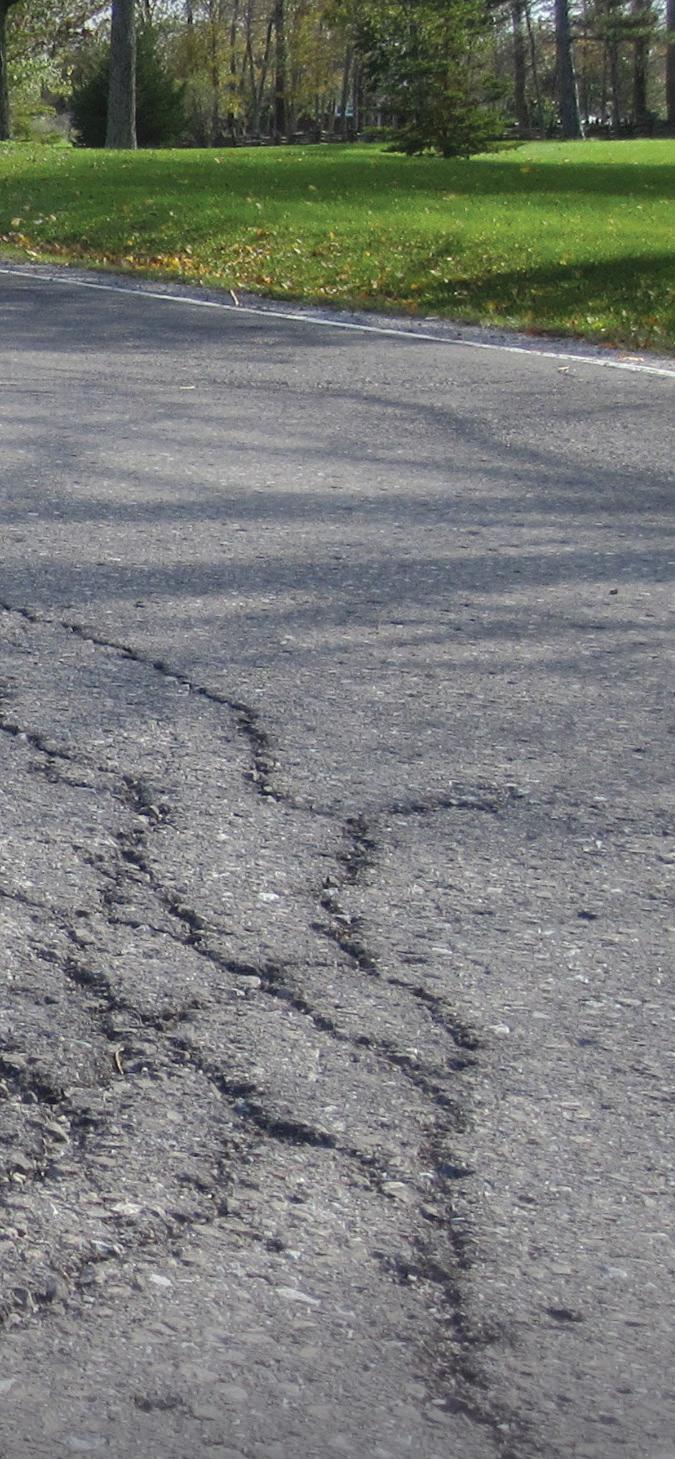
ASTM International* says that the new test method, the Three-Point Bending Cylinder (3PBC) Test, can be used to determine the fatigue resistance of asphalt mixtures.
ASTM member Emin Kutay, who is on the ASTM’s road and pavement committee D04, says the new standard (called D8458) will be used to assess the resistance of di erent types of asphalt mixtures to fatigue cracks in road surfaces.
e full title of D8458 is a “Standard Test Method for Evaluation of Fatigue Performance of Asphalt Mixtures Using the ree-Point Bending Cylinder (3PBC) Test”.
is test method can be used to determine the fatigue resistance of asphalt mixtures. e test method is generally valid for specimens that are tested at intermediate temperatures. e three-point bending cylinder test samples are obtained by coring a 68mm-diameter cylinder from the centre of a 150mm-diameter gyratory compacted sample or horizontal coring from eld cores or slabs cut from eld sections. A er coring, the sample is ready for testing and no further sample
preparation steps are required. e two ends of the 68mm-diameter three-point bending cylinder sample do not need to be sliced.
Highways agencies can make performance-based decisions on types of materials to be used in asphalt pavement to increase service life and reduce lifecycle cost.
“Fatigue cracking occurs due to repeated heavy truck loading,” says Kutay, who is also a professor in the civil and environmental engineering department at Michigan State University. “ is standard will help design better asphalt mixture ingredients to improve asphalt pavement service life.”
He notes that this e ort directly relates to the United Nations Sustainable Development Goal #9 on industry, innovation and infrastructure.
ASTM’s Committee D04 on Road and Paving Materials was formed in 1903 and meets twice a year, usually in June

and December, with about 100 members attending three days of technical meetings.
e committee, with a membership of over 750, has 27 technical subcommittees that have jurisdiction over more than 200 standards, published in the Annual Book of ASTM Standards, Volume 4.03.
e ASTM says that these standards continue to play a pre-eminent role in all aspects of construction and maintenance of highways and other transportation construction. ■
*ASTM International - formerly the American Society for Testing and Materials - is an international standards organisation based near Philadelphia in the US state of Pennsylvania. It develops and publishes voluntary consensus technical standards for a wide range of materials, products, systems and services. Around 12,575 ASTM voluntary consensus standards operate globally. More information is available on the ASTM website: www.astm.org


WARM-MIX ASPHALT WITH AMMANN FOAM TECHNOLOGY
HEATING PROCESS
• Highly efficient heat transfer
• No parasite air
• Optimised regulation burner / drum
BURNER
• Various fuels available
• Ideal combustion process
• Optimised energy consumption
USE OF RAP MATERIAL
• Full range of technical solutions
• Additions of RAP up to 100%
• Industry-leading partner in the use of RAP
BST – BLUE SMOKE TREATMENT
• Captures vapours during loading
• Filters trapped fumes
• Removes oil particles
EMISSIONS
• Lowest VOC (TA-Luft)
• Complete dust suppression
• Odour management solutions
• Noise reduction kits
AVOIDING HEAT LOSS
• High insulation up to 200 mm
• No thermal bridges
• Flaps to close the storage silos
• Reduction of wasted material
AS1 CONTROL SYSTEM
• Wide range of modules for software upgrading
• Expert use of inverter
• New professional and ergonomic user interface
• Energy management of photovoltaic systems
• Automatic burner control ADX