Wodonga Market Update 1 st H a l f 2 0 2 6
FUTURE DEVELOPMENTS
OVERVIEW
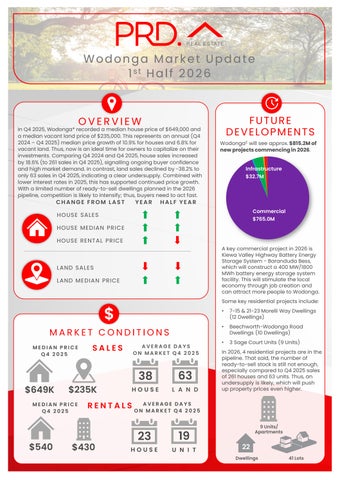
In Q4 2025, Wodonga* recorded a median house price of $649,000 and a median vacant land price of $235,000. This represents an annual (Q4 2024 – Q4 2025) median price growth of 10.9% for houses and 6.8% for vacant land. Thus, now is an ideal time for owners to capitalize on their investments. Comparing Q4 2024 and Q4 2025, house sales increased by 18.6% (to 261 sales in Q4 2025), signalling ongoing buyer confidence and high market demand. In contrast, land sales declined by -38.2% to only 63 sales in Q4 2025, indicating a clear undersupply. Combined with lower interest rates in 2025, this has supported continued price growth. With a limited number of ready-to-sell dwellings planned in the 2026 pipeline, competition is likely to intensify; thus, buyers need to act fast.
CHANGE FROM LAST
YEAR
Wodonga£ will see approx. $815.2M of new projects commencing in 2026. Infrastructure $32.7M
HALF YEAR
Commercial
HOUSE SALE S
$765.0M
HOUSE ME DIAN PRICE HOUSE RE NTAL PRICE A key commercial project in 2026 is Kiewa Valley Highway Battery Energy Storage System - Baranduda Bess, which will construct a 400 MW/1800 MWh battery energy storage system facility. This will stimulate the local economy through job creation and can attract more people to Wodonga.
LAND SALE S LAND ME DIAN PRICE
Some key residential projects include:
$ MARKET CONDITIONS MEDIAN PRICE Q4 2025
$649K
$235K
MEDIAN PRICE Q4 2025
$540
SALES
AVERAGE DAYS ON MARKET Q4 2025
38
63
HOUSE
L A N D
RENTALS
$430
•
7-15 & 21-23 Morelli Way Dwellings (12 Dwellings)
•
Beechworth-Wodonga Road Dwellings (10 Dwellings)
•
3 Sage Court Units (9 Units)
In 2026, 4 residential projects are in the pipeline. That said, the number of ready-to-sell stock is still not enough, especially compared to Q4 2025 sales of 261 houses and 63 units. Thus, an undersupply is likely, which will push up property prices even higher.
AVERAGE DAYS ON MARKET Q4 2025
23
19
HOUSE
U N I T
9 Units/ Apartments
22 Dwellings
41 Lots