
First Home Buyer Assistance In Australia: Policy Effectiveness, Unintended Consequences, and Pathways to Reform.

A comprehensive analysis of the First Home Owner Grant’s impact on affordability, market behaviour, and long - term housing outcomes.
First Home Buyer Assistance In Australia: Policy Effectiveness, Unintended Consequences, and Pathways to Reform.
A comprehensive analysis of the First Home Owner Grant’s impact on affordability, market behaviour, and long - term housing outcomes.
Executive summary.
Home ownership trends in Australia.
What is the First Home Owner Grant?
Case study: impact of First Home Owner Grants in Queensland.
First Home Owner Grant expansions and impacts on home loan finance commitments.
The 'Bring Forward' effect, fighting fire with fire.
Achieving policy purpose (friend).
Policy consequences (foe).
First Home Owner Grants: worldwide.
International case studies. Lessons


This white paper evaluates the effectiveness of Australia’s First Home Owner Grants (FHOGs) and related first-home buyer incentives, exploring their intended benefits, long-term consequences, and broader implications for housing affordability, market stability, and policy design.
Drawing on national statistics, international case studies, and economic modelling, the paper reveals that while the FHOG successfully increases first-home buyer participation in the short term, it simultaneously contributes to price inflation, heightened borrowing levels, and worsening affordability over time.
The paper concludes that while the FHOG is a 'friend' from a policy outcome perspective, it is a 'foe' when the policy consequences are evaluated.
The FHOG was designed to help Australians enter the property market by reducing deposit requirements and accelerating purchase timelines. Since its introduction in 2000, the scheme has evolved into a complex multi-layered system operating across federal, state, and territory jurisdictions.
This white paper examines whether these policies remain fit for purpose in today’s economic environment and whether they deliver sustainable outcomes for current and future home buyers.
The FHOG is an enticing opportunity for first home buyers and has helped many FHBs, but there are several hidden consequences.
In this white paper, we unpack:
• Home ownership trends in Australia.
• State and territory First Home Owner Grant complexities.
• Impact of FHOG on median house prices and first home buyer home loan commitments.
• The bring-forward effect: the consequence of FHOG.
• Achieving policy purpose (friend).
• Policy consequences (foe).
• First Home Buyers Grants worldwide and its impact on the local market.
• International case studies: what lessons can be learned, and can we apply any other FHOG framework to Australia?
• Alternative solutions to housing affordability.

Median house prices across Australia (both capital cities and regional areas) in 2025 were at an all-time high, with many areas still on a growth trajectory.
The gap between borrowing capacity and house prices has widened significantly, resulting in FHBs spending several years saving for a deposit, only to then encounter long-term mortgage stress.
Table 1. First Home Buyer Loan Statistics
As per Table 1, the percentage of income needed for loan repayments increased from 30.9% in September 2016 to 47.0% in September 2025 1. This confirms that wage growth is not comparable to house price growth.
Although the number of FHBs entering the market has increased, the average FHB loan has also increased, from approximately $320K in September 2016 to $560K in September 2025. This demonstrates an increasingly difficult FHB market.
Support deposit savings, meaning a shorter wait time for purchase.
Target different demographics and stock types.
Increase first home buyers’ access to home ownership.
Support the housing supply growth in the long term.
Drive up the demand and property prices in the short term.
Offer no support for repayments and upkeep costs.
Have limited effectiveness without adequate housing supply.
Put first home buyers at risk if the economic conditions change.

Housing Affordability in Australia has weakened over recent decades, with younger cohorts experiencing increasing difficulty entering the house market.
Of those born in the 1987-1991 cohort, 58% owned a house between the ages of 35-39. In the same age bracket, 72% of those born in 1947-1951 owned a house.
There has been a clear shift in the traditional life cycle of property ownership in Australia, evident by declining ownership rates in younger generations, particularly those born post 1996.
These outcomes are reflected in the Home Loan Commitments graph below, where FHB loans still make up the smallest amount.
As of September 2025, total home loan commitments were valued at $98B, with FHB loans at $16.5B3, making up only 16.8% of total loans.
1947-1951 to 1992-1996
Born 1992-1996
Born 1982-1986
Born 1972-1976
Born 1962-1966
Born 1952-1956
In comparison, owner occupier loans were $59.2B (59.3% of the total value which includes $16.5B of FHB loans) and investor loans were $39.8B (40.6% of total value). Owner occupier and investor loans have seen an increase since September 2023.
In contrast, FHB loans have plateaued in growth since September 2023, even with newly introduced FHOGs at both Federal and State Government levels
The share of FHB loan commitments did rise temporarily during the 2020-21 period; however, this is due to historically low interest rates and significant government policy support that occurred postCOVID-19; which was temporary in nature.
Born 1987-1991
Born 1977-1981
Born 1967-1971
Born 1957-1961
Born 1947-1951
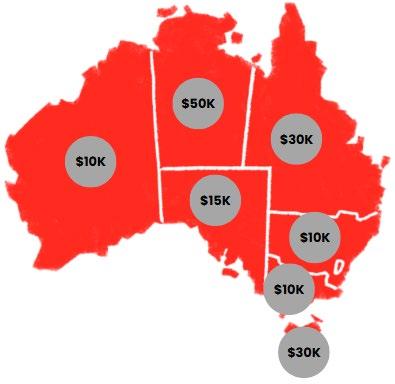
Table 2: FHOG State and Territory Differences 4
• Initially, the grant was created in 2000 to compensate first homebuyers for the added GST tax built into the cost of new housing.
• The grant is a one-off government payment designed to help first home buyers purchase or build a new home.
• The grant is intended to reduce upfront costs, helping FHBs enter the market sooner, while lowering total mortgage size and lowering or avoiding Lenders Mortgage Insurance.
• Each state and territory has its own specific price caps, grant amounts, and eligibility criteria.
• The grant supports construction of new homes, and many states require the grant to be used for new home builds only. This stimulates new housing supply.
• FHOG amount, eligibility, and stock type can change at any time, depending on the government.
$1,200,000
$1,100,000
$1,000,000
$900,000
$800,000
$700,000
$600,000
$400,000 $500,000
$300,000
$200,000
$100,000
$0
2008: Grant increases from $7K to $14K
2012: Grant increases to $15K
2016: Grant increases to $20K
2023: Grant increases to $30K
Queensland has one of the highest FHOG amounts ($30,000). The above graph charts the change in the FHOG amount in Queensland, compared to Greater Brisbane property prices. The graph shows a positive relationship.
From the introduction of the grant in QLD in 2000 at $7,0005, median house and unit prices in Greater Brisbane have trended upwards.
There is a significant price increase from 2023 onwards, when the FHOG is at its highest, of $30,000.
House Unit
The number of FHB loans in QLD was 29,252 in the September quarter of 2025 1, a 0.6% decline in the past 12 months.
Yet the average FHB loan increased from approximately $536K to $560K, meaning an approximate $23.7K increase. This increase almost matches the new FHOG amount ($30K).
It should also be acknowledged that property price increases can be attributed to a wide array of factors, especially in Brisbane where a housing supply crisis is evident.

Source:
ABS housing finance data showed that increases in FHOG have coincided with substantial rises in FHB loan applications at the national level. Following national grant expansions in 2017, owner-occupier FHB loan commitments rose by around 25% within two quarters from 21,311 in June 2017 to 26,555 in December 2017.
Some of these grant expansions included:
• Broadening of the First Home Buyers Assistance Scheme in New South Wales by extending concessions to more people and more types of properties, while maintaining a $10K FHOG 6 (2017).
• Increase in FHOG from $10K to $15K in Western Australia from January 2017 to December 2017 7
• Queensland’s FHOG remained at $20K for longer than expected across 2017 before decreasing in 2018 8
• The doubling of FHOG in regional Victoria from $10K to $20K in July 2017 9
• The extension of the FHOG in Tasmania for another year at $20K from July 2017 to June 2018 10
According to Domain, the median capital city prices in December 2017 saw a 5.0% increase from the previous year 11. This coincided with a significant 25% increase in FHB loan commitments in 2017, providing further evidence of the positive relationship between increased FHB demand and property prices.
• The strongest response to FHOG occurred in 2020–2021, when enhanced state First Home Owner Grants and the temporary HomeBuilder grant were introduced. FHB loan applications increased by almost 80% between June 2020 and March 2021 3 .
• When these grant programs were subsequently scaled back or removed, FHB activity declined.
• While broader economic factors also influence housing demand, the timing and magnitude of these grants, and the direct FHB response after the introduction of the grant cannot be denied.

The “bring forward” effect has been demonstrated across international case studies, in which government grants result in an immediate artificial surge in buyer activity. However, a large proportion of this surge can be attributed to buyers already planning on purchasing within that timeframe12
The issue with the “bring forward” effect is that it results in short-term growth in demand, rather than long-term housing accessibility and affordability.
As seen in the Morgan Stanley graph, sharp spikes in home

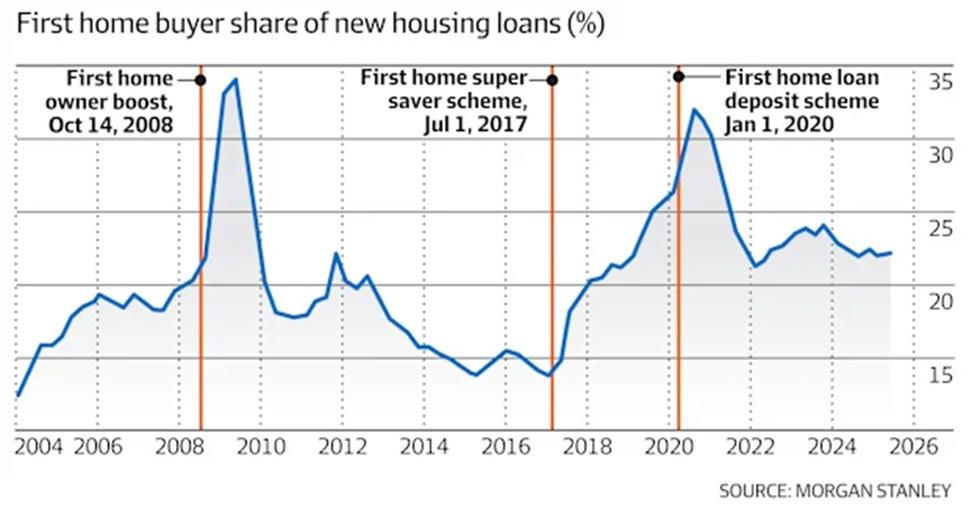
loans appear within a short timeframe of a new FHB scheme being announced. These spikes are followed by a sudden slump (due to buyers purchasing sooner rather than later) 13
This research suggests that FHB grants are often not effective in helping those who would otherwise never have been able to afford a home, whereas the beneficiaries of these grants are usually close to purchasing regardless.
Table 3 shows how the “bring forward” effect can be seen in Queensland and New South Wales.
Table 3. Case Studies of the “Bring Forward” Effect.
QLD 14
NSW (Regional Centre)
• HomeBuilder Grant (the final deadline to submit supporting documents was 30 June 2025).
• The grant was to be used towards building or buying a new home or substantially renovating an existing home as an owner/occupier.
• $25,000 grants available for contracts signed between 4 June 2020 and 31 December 2020.
• $15,000 available for contracts signed between 1 January 2021 and 31 March 2021.
• From 1 October 2025, FHBs can purchase homes with a 5% deposit, and avoid Lenders Mortgage Insurance (LMI).
• No income caps were included in the eligibility criteria (which increases the number of people who can access the grant and redefined the age and profile of who is considered a “first home buyer”).
• Property price caps were raised to $1.5M for Sydney, Illawarra, Newcastle and Lake Macquarie (previously $900k) and $800k for the rest of NSW (previously $750K)15.
• As of September 2025, there were 23,561 grants available in QLD, pending eligibility.
• The grant stunted regular market demand for established (2nd hand houses, placing pressure instead on buying and/or building a new home.
• This impacted construction costs of housing in QLD, as buyers were incentivised to bring forward purchases and/or choosing to renovate an established home.
• From a national perspective, the cost of building a new home rose by 20.7% over the 12 months to September 2022, which can be partly attributed to the FHOG and higher demand.
• The announcement of the 5% deposit scheme had a significant bring forward effect on regional NSW, due to the revision and increase of property price caps and lowering the deposit requirements.
• In November 2025 (1 month after the introduction of the 5% grant), the Illawarra median house price increased by 1.1%, likely due to more properties being eligible. This skewed demand for the region16. Buyers who were considering buying not only had access to more stock but also had the opportunity to enter the market earlier than before, hence the price growth seen in Illawarra.

Did the FHOG achieve its policy purpose? The purpose of the FHOG is to increase the number of FHBs entering the market, by providing a monetary amount that shortens the time needed to save for a deposit. Between September 2016- September 2025, the number of FHOG loans approved did increase by 34.0%. Thus, from the perspective of policy purpose, the FHOG can act as a friend for Australians who are closer to securing their first home, especially those who have been preparing to enter the market for a while.
Deposit assistance/ market entry
• First home buyers have an extra incentive to enter the market sooner rather than later.
• The grant is especially helpful to those who are already saving for a deposit.
Stimulates new supply
Boosts construction industry
• In the medium and long term, the grant stimulates new projects and increases housing supply.
• This benefits the property market overall (for the next generation of FHBs and those renting).
• The grant significantly boosts the construction industry and local economy.
• Can inspire those looking for a career change to move into different industries.
Supports low to middle income buyers/ regional growth & urban sprawl
• The grant encourages buyers to look at new and/or emerging suburbs.
• The grant encourages buyers to consider regional areas to buy.
• Regional growth forces the construction of new infrastructure and commercial projects in otherwise neglected areas. This benefits residents in the area and stimulates economic growth.
• The grant closes the deposit gap for FHBs and allows earlier entry into the market, shortening the time needed to save for a deposit.
• The grant allows FHBs to transition from renting to owning, which can free up a rental home.
• In some cases, the FHOG is only eligible for purchasing or building a new home (for example off the plan projects).
• Thus, new supply is incentivised.
• However, the price point of a new off the plan property can be higher than older stock.
• Given the new build requirements specific to state FHOGs, the construction industry is an essential component for expanding housing supply.
• This will support jobs and local businesses within the construction industry, stimulating economic growth and inspiring new building methods.
• The lower price caps on FHOGs enable low to middle income buyers the opportunity to enter the market in regional locations and emerging suburbs.
• The FHOG property price cap may not be applicable to some capital city suburbs and metro areas, given house prices in these areas.
• This promotes regional growth and the construction of new homes through urban sprawl meaning pressure is eased on metro areas.
• The FHOG led to over 200 new builds in the Northern Territory and contributed to a 23.4% increase in first home buyers in the year to June 2025. These builds supported the local construction industry, housing supply, and buyers 17 .
• The FHOG can be used in combination with existing grants. In 2024 and 2025, South Australian home buyers were given $46.6 million in grant contributions and $73.5 million in stamp duty relief, totalling $120.1 million saved. The existing schemes combined, mean on average, South Australians may be eligible for up to $51,000 towards a new home 18
• From 2021 to 2023, 24,000 households in Queensland were able to receive grant support for purchasing their first home, amounting to $365 million in grants 19

FHOG can be considered a “friend” from a policy purpose perspective. However, is it still a friend from a policy consequence perspective? Policy consequences refers to the unintended multiplier effect that the FHOG might have, from a multifaceted angle such as property prices, the economic wellbeing of the FHB after accessing the FHOG, and its indirect impact on future FHBs. The FHOG benefits only those who are eligible. It can also have several hidden consequences which can make FHOG a foe. This is especially true for FHBs who are relying on the grant to enter the market, meaning a large amount of their deposit is due to the availability of FHOG. Without the FHOG, an FHB would not consider themselves as entrants to the market.
Short-term Support/ Financial Stress
Inflationary Impact On Prices
Sellers & Developers Gain The Real Benefit
Price Caps & Inequality (Regional Vs Metro)
Construction Costs Increase
• The grant offers short-term support only (at the beginning).
• First Home Buyers might experience mortgage stress & default risk should there be changes in their financial situation and the economy in general.
• FHOG can lead to rising property prices, as per the Queensland case study (page 5 of this report).
• FHOG can lead to higher FHB loan debt. Between September 2016 and 2025 FHB debt increased by 75.3%, putting more FHBs at risk.
• Sellers and developers gain a greater benefit than buyers due to rising property values.
• Median house and unit prices in capital cities are far higher than the grant’s property price caps.
• Many FHBs are still “priced out” of their ideal suburbs and are forced to look at properties elsewhere.
• An increase in demand for new builds can increase construction costs for many developers.
• This can further increase property prices for the next generation of FHBs wanting to enter the market (a multiplier effect).
• The FHOG helps with the initial deposit for a new home purchase. However, it does not assist with rising mortgage repayments, council rates, home insurance, maintenance costs, etc.
• Many FHBs are not high-income earners and have capitalised on their borrowing power. A sudden cash rate/interest rate hike may put them at risk and unable to maintain the home.
• Increases in buyer demand without mirrored supply growth lead to inflated house prices.
• Lower to mid priced houses are impacted disproportionately as these are within the FHOG’s price cap. This impact goes against the aims of the scheme, which is to support more affordable housing.
• Research shows that demand side subsidies are often transferred into rising prices, benefitting sellers and developers more so than first home buyers. This benefit goes against the original intention of the grant.
• With property value caps of $750,000 in NSW, QLD and VIC, most capital city / metro area new builds are unlikely to qualify.
• As of January 2026, Greater Brisbane’s median house price was $1.15M and Greater Sydney’s was $1.60M which is above these price caps.
• Increased demand for new builds will put pressure on the cost of labour and materials.
• It can delay the completion timeline of new projects, or worse, increase the risk of new projects being abandoned.
• In the long run this will inflate the costs of building a new home.
Impact On Rental Market/ inequality
• The grant adds increased pressure on rental prices.
Change in timing of home purchases
• Instead of ensuring long term sustainable growth in the number of FHBs, FHOGs can result in a temporary rise in home purchases.
• FHBs in all States and Territories (excluding NSW and Victoria) who access FHOG must live in their home for 6 continuous months. Within 12 months of ownership and settlement they cannot be investors (NSW and Victoria require 12 continuous months of living in the property).
• This decreases the number of properties that can be offered to the rental market.
• When grants are first released, financially secure buyers pounce at the opportunity to purchase a home.
• There is a spike in the number of first-home purchases as a result. However, this is followed by sharp declines when the FHOG ends.
• Short-term demand increases purchasing behaviour, rather than prolonged ownership support.
Very Comprehensive
Moderately Comprehensive
One Incentive/ Indirect

Category
Very Comprehensive Multiple levels, national coverage, ongoing programs, accessible, combination of cash grants/deposit supports/shared ownership and tax relief.
Moderately Comprehensive
One Incentive/Indirect
These schemes do not entirely support FHB due to being narrowly targeted, smaller in scale, harder to access, or rely heavily on loans rather than grants. The half comprehensive countries may not allow for the combination of grants to support FHBs.
These are countries with only one level of support for FHBs that are indirect and cannot be combined. They include schemes such as tax breaks, a savings account, stampduty-style concession and interest rate subsidies for FHBs.
Australia stands out globally as having one of the most comprehensive first-home buyer support systems among both developed and developing economies. Unlike many countries that rely on a single policy level, Australia operates across multiple overlapping mechanisms at the state and federal level. Australia is positioned alongside other developed nations such as Canada and the UK, which view FHB assistance schemes as a structural part of housing policy, rather than a marginal or symbolic intervention.
Some developed nations, such as USA and Japan, fall into the category of “one incentive/indirect”. In some countries, home ownership is viewed as a private financial decision, rather than a social outcome requiring grants.
Countries
Australia, Canada, Singapore, Ireland, UK and Finland.
Portugal, Chile, Norway and Malta.
USA, Japan, Colombia and Spain.
In Japan, home buyers are supported through strong rental protections and policy, which focuses on supply and affordability through construction, rather than grants for home purchasing 21 .
Australia’s highly comprehensive approach reflects several structural factors which differentiates from other developed nations who use a less comprehensive methodology.
In Australia, home ownership is thought to be central to acquiring financial and retirement security. The country’s approach also reflects chronic housing affordability pressures, with different levels of government consistently implementing and updating intervention schemes to support FHBs.
Australia is not alone in its FHB journey, with many others having their own version of FHOG. What do other countries offer, and how can we learn from them? Did their FHOG assist in the short and long term?
Ireland Help to buy (2017 – December 2029) 22
• A refund of income tax and Deposit Interest Retention Tax (DIRT) paid over the last four years, up to A maximum of €30,000 or 10% of the property's value, whichever is less.
New Zealand
First home grant scheme (finished May 2024)
• A $5,000 grant towards existing homes or $10,000 towards A new home24
• This grant assists families of different income levels, as it is based on the amount paid on income tax
• Encouraged new build first homes, therefore increasing housing supply.
• Boosted the construction industry.
• FHBs must have 4 years of income tax prepared.
• Available for self builds, not just off the plan new home projects.
• A long-standing scheme.
• Buyers could choose between existing and new homes, with the new homes incentivised.
• Eligibility required at least 3 years of KiwiSaver contributions which promoted long-term saving habits and financial stability.
• Grants can be doubled for couples ($10K for existing homes and $20K for new builds).
• The grant worked alongside other NZ schemes such as their 5% deposit scheme, which meant FHBs could combine grants and enter the market sooner rather than later.
GST/HST new home rebate (May 2025 – 2036)
• For eligible first home buyers, the federal portion of GST/HST on eligible housing are fully eliminated up to CA $1m26
Danish mortgage model (1850-current with interval changes throughout)
Denmark
• A mortgage model offering interest tax deductions and low risk mortgage structuring
• Mortgages are funded through covered bonds which are safe and illiquid28
• The grant directly reduces overall purchase cost of new homes.
• Does not create additional stress or competition for existing homes.
• The grant applies to a wide variety of housing types and promotes diversified housing.
• For owner-builders, GST and HST can be recovered on materials, labour and contractor charges.
• Supports the construction industry.
• Low historical rates for homeowners due to match funding and balance principal structure, which eliminates interest rate and liquidity risk for lenders.
• Homeowners with fixed rate loans can prepay their mortgage at the market value of the underlying bonds, increasing financial safety.
• Highly transparent system with loan prices directly linked to publicly traded bond yields.
• Reduces mortgage stress.
• House prices are more stable than neighbouring countries Sweden and Norway, due to the system’s strong risk management.
• Price inflation on new builds.
• Related to taxes paid, the lower income buyers benefitted less.
• Favoured developers building within price caps, narrowing supply diversity.
• A third of recipients did not need the Help to buy scheme to meet the 10% deposit requirement. This meant purchasing power was increased, thus inflating prices and creating a deadweight loss23
• House price property caps meant limited access in certain areas.
• Inflation on new build prices.
• People who have taken a break in employment may be ineligible (due to the 3 years of contributions to KiwiSaver).
• Income caps exclude many middle income earners.
• In the 10 year period before KiwiSaver withdrawals were available, the house price growth rate was 7.6% per year. In the period after KiwiSaver withdrawals, it was 9.2%25
• GST relief can vary depending on house value (100% up to $1m and partial up to $1.5m).
• Drives up demand for FHBs to make home purchases, thus leading to price growth.
• Price inflation on new builds.
• Resulted in the “bring forward” effect where temporary demand surges grow, rather than lasting gains in home ownership27
• Denmark has had a very high household debt to income ratio, even though the home loan default rate remains low.
• Higher-income households benefit more because the mortgage interest tax deductions are regressive.
• The model doesn’t necessarily help FHBs enter the market or increase homeownership rates. Instead, it encourages people to buy larger and more expensive homes (hence higher debt).
• The grant doesn’t fix land supply or planning constraints, as there is no preference for new builds.
There are several important lessons that are captured when evaluating the effectiveness of the FHOG:
• The introduction of a grant follows a cyclical pattern, a grant is introduced, FHBs who were thinking of purchasing can do so earlier, demand spikes, prices rise, and the housing affordability market is worse off. The government then takes the “fight fire with fire” approach, creating and/or expanding another FHB grant or scheme.
• FHBs who utilise the grant after the initial “bring forward” effect, are forced to pay a hidden premium on house prices, due to the market heating up in a short period of time. This renders the grant ineffective.
• Price caps significantly limit the accessibility of the grant. Greater Sydney has a median house price of $1.60M, but the grant is limited to a maximum of $750K in NSW. The grant largely excludes capital city dwellers, instead placing pressure on suburbs that are more affordable, new, or are located in regional markets.
• FHOG provides no ongoing support for first home buyers it only assists with the initial deposit amount.
New FHOG is finalised and announced to public
Average loan commitments rise Government reacts by planning a new intervention
Price growth occurs on new builds and existing stock
FHBs begin to plan and excitement builds New FHOG is introduced and can be utilised
The "bring forward' effect occurs and demand spikes
Demand overpowers supply due to surge of new buyers
International case studies demonstrate how FHB schemes around the world often result in inflated housing prices for new builds. This is due to the “bring forward” effect, where spikes in first home purchases appear but long-term ownership is not supported.
Australia could consider a housing approach like Denmark.
• FHBs could access mortgage interest tax deductions and low risk mortgage structuring, thus gaining long term support.
• Mortgages are funded through covered bonds, which are extremely safe and liquid, allowing borrowers to refinance easily if interest rates change. For example, borrowers can buy back their mortgage bonds at market price if there are interest rates rises.
• This addresses one of the main issues of the Australian grants. FHBs are given a grant to cover the hidden cost of increasing house prices, whereby enthusiastic and often young buyers with limited capital are left with high mortgage stress and/or default risk.
It is important to note that this is only one aspect of the FHOG that can be addressed. The root of the problem lies deep within housing affordability issues in Australia, rather than loan serviceability itself.
FHOGs come with hidden consequences that are often overlooked by eager first home buyers. From a policy outcome perspective, it can be argued that FHOGs are a friend. But from a policy consequence point of veiw, the FHOG behaves more like a foe. It is important to support FHBs. The question is, how can we do better? This issue is multifaceted, involving many stakeholders, all with “friend or foe” characteristics. We have seen in our analysis of international case studies that Australia is not alone in facing this issue. Because of these issues, there will never be a silver bullet answer. But what other alternatives can we explore?
Increased supply and innovation in the construction industry
Zoning changes to accommodate population density
• In basic economic theory, increasing housing supply should help lower prices.
• However, the correct housing supply needs to outpace demand on the market. For example, a city could have many houses built, but if the population increased at the same rate, prices would not change.
• There is a need for multiple types of new supply to be added, not just traditional houses and units, but other alternatives already implemented in other countries (for example: modular homes, capsule homes, tiny homes, etc).
• Construction times and costs can be lowered through the adoption of prefabricated, modular, and innovative building methods.
• It is estimated that prefabricated homes are between 10% and 25% cheaper than traditional homes to be built32
• With government approval, these projects can be streamlined, providing greater volumes of housing construction and at a cheaper price for FHBs.
• Zoning constraints have significantly limited the construction of dense housing in inner-city locations, with zone changes having significant costs and time delays.
• Research found that if Sydney was as dense as Toronto within 15km of the CBD, there would be an additional 250,000 homes or approximately 5% of Sydney’s total population29
• Many buildings are vacant or no longer used, however repurposing can be costly, due to the process involved in changing the zoning.
• By limiting SMSFs from purchasing residential property, competition for housing stock can be lowered, increasing accessibility for FHBs.
• As of the June quarter of 2024, residential property held by SMSFs in Australia totalled approximately $55.2 billion, accounting for 5.5% to 6.0% of total SMSF assets.
Limiting Self Managed Super Funds (SMSFs) from purchasing residential property
• This is a 26.4% increase in total residential SMSFs from the June quarter of 202130
• In 2025, residential SMSFs formed approximately 0.5% of the total residential stock in Australia, up from 0.3% in 2013, demonstrating growth in the sector31.
• Due to the investment nature of residential SMSFs, upward pressure is placed on rents and property prices. This is because the stock purchased is being used as an investment rather than a home available for an FHB to purchase.
• SMSF investors on average have higher purchasing power than FHBs (due to the nature of SMSF), which can drive property prices up further.
• Land becomes a form of shared ownership by a not-for-profit legal entity, and the building is owned by an individual on the land.
Community Land Trusts (CLTs)
Increased government subsidised housing
• Prices remain affordable on the CLTs due to resale rules and caps, ensuring affordability for future buyers33
• The stabilised housing market protects communities from rapid gentrification and price spikes, which price low income and FHBs out of the market.
• As in Singapore, FHBs are provided with government grants when purchasing public housing. These houses are built and sold by the government at a subsidised rate.
• These houses have strict price caps applied on resale values, to avoid large capital growth as well as also ensuring affordability for the next generation of FHBs.
• In summary, first home buyers pay lower prices but this does not push private market prices up because supply is controlled and planned.
• First home buyers in the United Kingdom can purchase a portion of a home and pay rent on the rest.
• This allows FHBs to work their way to full ownership over time, while having a safe and guaranteed place to live.
• Housing is sold below market price initially with strict resale rules. These prices also don’t create additional competition for existing homes in the private market.
PRD’s property research division provides reliable and unbiased data, insights and consultancy to clients in both metropolitan and regional locations across Australia.
Our extensive research capabilities and specialised approach ensure our clients can make the most informed and financially sound decisions about residential and commercial properties.
Access to accurate and objective research is the foundation of all good property decisions. PRD shares on-theground experience and decades of knowledge to deliver innovative and effective solutions to our clients.
We take a holistic approach and focus on understanding new issues impacting the property industry, such as the environment and sustainability, the economy, demographic and psychographic shifts, and commercial and residential design, and forecast future implications around such issues based on historical data and facts.
Our in-house research team is skilled in deriving macro and micro quantitative information from multiple credible sources, so we can ensure we provide strategic advice and financially sound direction regarding property and market performance.
Our research services span over every suburb, local government area, and state within Australia. We have the ability and systems to monitor market movements, demographic changes and property trends. We use our knowledge of market sizes, price structure and buyer profiles to identify opportunities for clients and provide market knowledge that is unbiased, thorough and reliable.


Our services include:
• Advisory & consultancy
• Market analysis including profiling & trends
• Primary qualitative & quantitative research
• Demographic & target market analysis
• Geographic information mapping
• Rental & investment return analysis
• Project analysis including product & pricing recommendations

PRD does not give any warranty in relation to the accuracy of the information contained in this report. If you intend to rely upon the information contained herein, you must take note that the Information, figures and projections have been provided by various sources and have not been verified by us. We have no belief one way or the other in relation to the accuracy of such information, figures and projections. PRD will not be liable for any loss or damage resulting from any statement, figure, calculation or any other information that you rely upon that is contained in the material. Prepared by PRD Research 2026 © All medians and volumes are calculated by PRD Research. Use with written permission only. All other responsibilities disclaimed.
1 REIA. (2025). Housing Affordability Report September Quarter 2025. Real Estate Institute of Australia. Retrieved on January 15, 2025, from https://a.storyblok.com/f/224482/x/6647936b74/20251211-reia-housing-affordability-report-september-2025.pdf
2 Australian Government. (2025). Home ownership and housing tenure. Australian Institute of Health and Welfare. Retrieved on December 10, 2025, from https://www.aihw.gov.au/reports/australias-welfare/home-ownership-and-housing-tenure
3ABS. (2025). Lending Indicators. Australian Bureau of Statistics. Retrieved on January 12, 2025, from https://www.abs.gov.au/statistics/economy/finance/lending-indicators/latest-release
4 Australian Government. (2025). First Home Owner Grant. Australian Government. Retrieved on January 13, 2025, from https://www.firsthome.gov.au/
5 Queensland Revenue Office. (2024). Previous home owner grants. Queensland Revenue Office. Retrieved on January 20, 2025, from https://www.publications.qld.gov.au/ckan-publications-attachments-prod/resources/58d58fbd-b8e4-4b47a1bc-d151e6f01be0/previous-grant-amounts.pdf?ETag=f47690ecd842d93edfbe02c2720151ec
6 NSW Government. (n/d). First Home Owner (New Homes Grant). Revenue NSW. Retrieved on January 14, 2025, from https://www.revenue.nsw.gov.au/grants-schemes/first-home-owner-new-homes-grant#:~:text=false%20claimsObjections,What%20is%20the%20First%20Home%20Owner%20Grant?,the%20plan%20or%20substantially%20renovated
7 Government of Western Australia. (2016). First homebuyer boost with increased grant. Government of Western Australia. Retrieved on January 14, 2025, from https://www.wa.gov.au/government/mediastatements/Barnett%20Liberal%20National%20Government/First-homebuyer-boost-with-increased-grant-20161227
8 FHBA. (2024). Queensland government extends First Home Owners’ Grant Boost. First Home Buyers Australia. Retrieved on January 14, 2025, from https://fhba.com.au/queensland-government-extends-first-home-owners-grant-boost/
9 State Revenue Office Victoria. (n/d). Regional First Home Owner Grant. State Revenue Office Victoria. Retrieved on January 14, 2025, from https://www.sro.vic.gov.au/about-us/our-organisation/closed-taxes-levies-and-grants/regional-first-homeowner-grant
10 FHBA. (2024). First home incentives extended for Tasmanian first home buyers. First Home Buyers Australia. Retrieved on January 14, 2025, from https://fhba.com.au/first-home-incentives-extended-for-tasmanian-first-home-buyers/
11 Domain. (2018). December 2017 House Price Report. Domain. Retrieved on January 23, 2025, from https://fhba.com.au/firsthome-incentives-extended-for-tasmanian-first-home-buyers/
12 Ong ViforJ, R et al. (2023). Financing first home ownership: modelling policy impacts at market and individual levels Retrieved on January 23, 2025, from https://www.ahuri.edu.au/sites/default/files/documents/2023-05/AHURI-Final-Report398-Financing-first%20home-ownership-modelling-policy-impacts-at-market-and-individual-levels.pdf
13 Kinsella, L., Slade, L. (2025). December 2017 House Price Report. Financial Review. Retrieved on January 23, 2025, from https://www.afr.com/policy/economy/first-home-buyer-incentives-fuel-the-housing-affordability-crisis-20251003-p5mzsn
14 Australian Government. (n/d). HomeBuilder. The Treasury. Retrieved on January 23, 2025, from https://treasury.gov.au/homebuilder
15 Housing Australia. (2025). Unlimited places, higher property price caps for first home buyers from 1 October 2025. Housing Australia. Retrieved on December 19, 2025, from https://www.housingaustralia.gov.au/media/unlimited-places-higherproperty-price-caps-first-home-buyers-1-october-2025
16 David, D (2025). Did the 5 per cent deposit scheme spark the Illawarra’s sudden surge. Region. Retrieved on January 14, 2025, from https://regionillawarra.com.au/did-the-5-per-cent-deposit-scheme-spark-the-illawarras-sudden-surge/
17 Snowden, C (2025). Darwin leads home loan deposit race. Realestate.com. Retrieved on January 13, 2025, from https://www.realestate.com.au/news/darwin-leads-home-loan-deposit-race/
18 Government of South Australia. (2025). $120 million to help thousands of South Australians own their first home. Government of South Australia. Retrieved on January 15, 2025, from https://www.premier.sa.gov.au/media-releases/newsitems/$120-million-to-help-thousands-of-south-australians-own-their-first-home
19 Queensland Government. (2023). Cost of living boost for first home buyers. Queensland Government. Retrieved on January 16, 2025, from https://statements.qld.gov.au/statements/99186
20 Queensland University of Technology USB344 Property Project student theses, focusing on answering the question First Home Buyer’s Grant: Friend or Foe?
21 Kobayashi, M. (2016). The Housing Market and Housing Policies in Japan. Asian Development Bank Institute. Retrieved on January 28, 2025, from https://www.adb.org/sites/default/files/publication/181404/adbi-wp558.pdf
22 Revenue. (2026). Help to Buy (HTB) Scheme. Irish Tax and Customs. Retrieved on January 27, 2025, from https://www.revenue.ie/en/property/help-to-buy-incentive/how-much-can-you-claim.aspx
23 Parliamentary Budget Office. (2019). An overview of the Help to Buy Scheme from 2016-2021. Parliamentary Budget Office Retrieved on January 27, 2025, from https://data.oireachtas.ie/ie/oireachtas/parliamentaryBudgetOffice/2022/2022-0624_an-overview-of-the-help-to-buy-scheme-from-2016-2021_en.pdf
24 New Zealand Government. (2025). Financial help for first-home buyers. New Zealand Government. Retrieved on January 26, 2025, from https://www.govt.nz/browse/housing-and-property/buying-or-selling-a-home/buying-your-first-home/
25 Super Members Council. (2025). Home Truths: the KiwiSaver experience. Super Members Council. Retrieved on February 3, 2025, from https://www.govt.nz/browse/housing-and-property/buying-or-selling-a-home/buying-your-first-home/
26 Government of Canada. (2025). GST relief for first-time home buyers on new homes valued up to $1.5 million Government of Canada. Retrieved on January 27, 2025, from https://www.canada.ca/en/department-finance/news/2025/05/gst-relieffor-first-time-home-buyers-on-new-homes-valued-up-to-15-million.html
27 Canadian Home Builders’ Association. (2025). CHBA welcomes Federal Government removing GST on new construction homes for first-time buyers Canadian Home Builders’ Association. Retrieved on January 27, 2025, from https://www.chba.ca/2025/03/20/chba-welcomes-federal-governement-removing-gst-on-new-construction-homes-forfirst-time-buyers/
28 Realkreditrådet & Finance Denmark. (2021). The traditional Danish mortgage model. Finance Denmark. Retrieved on January 23, 2025, from https://finansdanmark.dk/media/raim0hhz/den-klassiske-realkreditmodel_uk_2021_final.pdf
29 Wade, M. (2025). Australia is a global outlier on one key indicator. Changing it will help fix the housing crisis. The Sydney Morning Herald. Retrieved on December 19, 2025, from https://www.smh.com.au/business/the-economy/australia-is-aglobal-outlier-on-one-key-indicator-changing-it-will-help-fix-the-housing-crisis-20251202-p5nk8w.html
30 Lontayo, R. (2024). Australians turn to SMSFs for property investments. MPA. Retrieved on January 27, 2025, from https://www.mpamag.com/au/specialty/smsf/australians-turn-to-smsfs-for-property-investments/513386
31 Kelly, P. (2013). Are SMSFs contributing to a property bubble? Money Managment. Retrieved on January 26, 2025, from https://www.moneymanagement.com.au/are-smsfs-contributing-property-bubble/
32 Salt Air Modular. (n/d). The True Cost Breakdown of a Modular Home vs Traditional Build in Queensland. Salt Air Modular. Retrieved on December 19, 2025, from https://saltairmodular.com.au/the-true-cost-breakdown-of-a-modular-home/
33 AHURI. (2018). What is a Community Land Trust? AHURI. Retrieved on January 22, 2025, from https://www.ahuri.edu.au/analysis/brief/what-community-land-trust