

Tamworth Market Update 2nd Half 2025

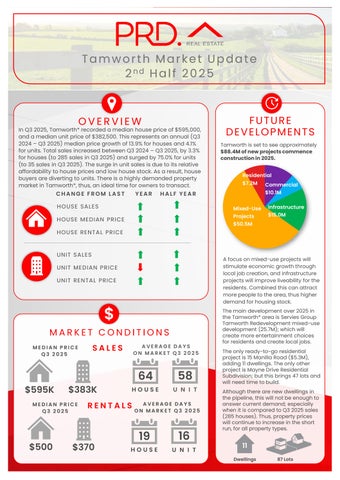
In Q3 2025, Tamworth* recorded a median house price of $595,000, and a median unit price of $382,500. This represents an annual (Q3 2024 – Q3 2025) median price growth of13.9% for houses and 4.1% for units. Total sales increased between Q3 2024 – Q3 2025, by 3.3% for houses (to 285 sales in Q3 2025) and surged by 75.0% for units (to 35 sales in Q3 2025). Thesurge in unit sales is due to its relative affordability to house prices and low house stock. As a result, house buyers are diverting to units. Thereis a highly demanded property market in Tamworth*, thus, an ideal time for owners to transact.
FROM LAST

MEDIAN PRICE HOUSE RENTAL PRICE


Tamworth is set to see approximately $88.4Mofnewprojectscommence constructionin2025.


MEDIAN PRICE Q3 2025 MEDIAN PRICE Q3 2025
AVERAGE DAYS ON MARKET Q3 2025
64
$595K $383K
58 $370 HOUSE UNIT 19 16
AVERAGE DAYS ON MARKET Q3 2025


A focus onmixed-use projects will stimulate economic growth through local job creation, and infrastructure projects will improve liveability for the residents. Combined this can attract more people to the area, thus higher demand for housing stock.
The main development over 2025in the Tamworth* area is Servies Group Tamworth Redevelopment mixed-use development (25.7M); which will create more entertainment choices for residents and create local jobs.
The only ready-to-go residential project is 15Manilla Road ($5.3M), adding 11dwellings. The only other project is Mayne Drive Residential Subdivision; butthis brings 47lots and will need time tobuild.
Although there are new dwellings in the pipeline, this will notbe enough to answer current demand; especially when it is compared to Q3 2025sales (285 houses). Thus, property prices will continue to increase in the short run, for all property types.


AVERAGE VENDOR DISCOUNT*
Average vendor discount reflects the average percentage difference between the first list price and final sold price. A lower percentage difference (closer to 0.0%) suggests that buyers are willing to purchase close to the first asking price of a property.


In the past 12months to Q3 2025average vendor discount have tightened, to lesser discounts of -3.0% for houses and -2.5% for units. The property market conditions in Tamworth* still favour buyers, as sellers will accept less than the first listed price. However, with lesser discounts and very few new dwellings built, buyers should act fast.
The postcode of 2340has historically performed on par with the wider Tamworth Local Government Area (LGA) for both median house and unit prices. 2025# saw this trend continue, with price growth in both the suburb and LGA tracking in the same direction, and at a similar pace.
The dominant proportion of homes sold in Tamworth* in 2025# were almost equally split between the premium bracket of $750,000and above (23.7%) and the most affordable price bracket of less than$449,999(26.0%). Almost similarly, most of the units sold were split between the premium price point of $450,000and above (36.0%) and the more affordable price bracket of $300,000to $349,999(29.2%). There are opportunities forboth buyers and sellers, which suggest a healthy market. Overall, there is a home forevery budget in Tamworth*.
MARKET COMPARISON
The market comparison graph provides a comparative trend for the median price of houses and units in the past 5 years. The main LGA profiled was chosen based on their proximity to the main suburb analysed, which is Tamworth.


PRICE BREAKDOWN 2025 #


to $349,999 $350,000 to $399,999
$400,000 to $449,999
$450,000 and above

RENTAL GROWTH 2025€
House rental yields in Tamworth¥ was 3.1% in September 2025, lower thanthe Tamworth LGA (4.4%) but higher than Sydney Metros (2.7%). This was paired with a 11.1% increase in median house price in the past 12 months to Q3 2025,at $500per week. At the same time the number of houses rented declined by -14.7%, to 307rentals in Q3 2025. The same pattern, of higher rent and decreasing number rented, is also evident in the unit market. This is beneficial for investors, especially those looking for a more affordable investment option to Sydney Metro.
3-bedroom houses have provided investors with +6.7% rental growth annually, achieving a median rent of $480per week.
Tamworth¥ recorded a vacancy rate of 1.0% in September 2025,on par with the Tamworth LGA’s 1.0%average, and below the Sydney Metro’s 1.3%average. Vacancy rates in Tamworth¥ increased slightly in the past 12months, due to anincrease in investors. However, a 1.0% vacancy rate is still well below the Real Estate Institution of Australia’s healthy benchmark of 3.0%, thus quicker occupancy of rental homes. This is a conducive environment for investors.

RENTAL VACANCY RATES 2025


Tamworth (2340)
Tamworth LGA
Sydney Metro
PROJECT DEVELOPMENT 2025 ₳

TAMWORTH


2


RESEARCH SERVICES
Our research services span over every suburb, LGA,and state within Australia; captured in a variety of standard and customised products, andinclude:
• Advisory and consultancy
• Market analysis including profiling and trends
• Primary qualitative and quantitative research
• Demographic and target market analysis
• Geographic information mapping
• Project analysis including product and pricing recommendations
• Rental and investment return analysis
OUR KNOWLEDGE
Access to accurate and objective research is the foundation of all good property decisions.
OUR PEOPLE
Our research team is made up of highly qualified researchers who focus solely on property analysis.


REFERENCES
* Tamworth sales market data and key indicators encapsulates aggregate property market conditions within the postcode of 2340.
** Estimated values are based on construction value provided by the relevant data authority and does not reflect commercial and/or re-sale value.
# 2025 encapsulates sales transactions for Q1 – Q3 2025 (01/01/2025 – 30/09/2025) only, other years encapsulates sales transactions for the full year (i.e 01/01 to 31/12 of the relevant year).
€ Annual rental growth is a comparison between Q3 2024 (01/07/2024 – 30/09/2024)and Q3 2025 (01/07/2025 – 30/09/2025) house median rent figures.
¥ Tamworth rental market data encapsulates aggregate property conditions within the postcodes of 2340, 2346, 2352, 2347, 2353, 2354, 2344, 2355, 2338, 2359, 2345.
§ Rental yields shown are as reported as of September 2025.
₳ Project development map showcases a sample of upcoming projects only, due to accuracy of addresses provided by the data provider for geocoding purposes.
£ Projects refers to the top developments within the postcode of 2340.
µ Estimated value is the value of construction costs provided by relevant data authority, it does not reflect the project’s sale/commercial value.
ψ Commencement date quoted for each project is an approximate only, as provided by the relevant data authority, PRD does not hold any liability to the exact date.
Source: APM Pricefinder, Cordell Connect database, SQM Research, Esri ArcGIS.
Disclaimer: PRD does not give any warranty in relation to the accuracy of the information contained in this report. If you intend to rely upon the information contained herein, you must take note that the information, figures and projections have been provided by various sources and have not been verified by us. We have no belief one way or the other in relation to the accuracy of such information, figures and projections. PRD will not be liable for any loss or damage resulting from any statement, figure, calculation or any other information that you rely upon that is contained in the material.
Prepared by PRD Research. © All medians and volumes are calculated by PRD Research. Use with written permission only. All other responsibilities disclaimed. © Copyright PRD 2025.

