
Southport Market Update 1st Half 2026

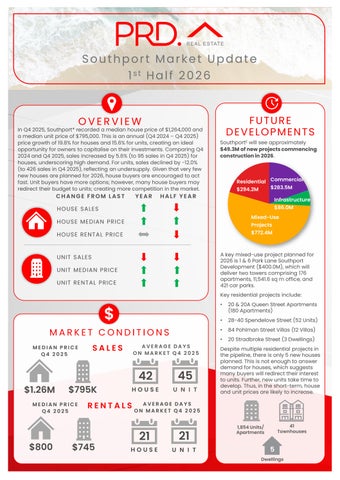
In Q4 2025, Southport* recorded a median house price of $1,264,000and a median unit price of $795,000.This is anannual (Q4 2024 – Q4 2025) price growth of 19.8% for houses and 15.6% forunits, creating an ideal opportunity for owners to capitalise on their investments. Comparing Q4 2024and Q4 2025,sales increased by 5.6% (to 95 sales in Q4 2025)for houses, underscoring high demand. For units, sales declined by -12.0% (to 426 sales in Q4 2025),reflecting anundersupply. Given that very few new houses are planned for 2026,house buyers are encouraged toact fast. Unit buyers have more options; however, many house buyers may redirect their budget to units; creating more competition in the market.
FROM LAST

HOUSE SALES
MEDIAN PRICE HOUSE RENTAL PRICE
SALES


Southport£ will see approximately $49.3Mofnewprojectscommencing constructionin2026
HALF YEAR

$283.5M
PRICE

MEDIAN PRICE Q4 2025 MEDIAN PRICE Q4 2025
AVERAGE DAYS ON MARKET Q4 2025
42 $1.26M $795K
45 $745 HOUSE UNIT
AVERAGE DAYS ON MARKET Q4 2025
21 21 $800


A key mixed-use project planned for 2026 is 1 & 6 Park Lane Southport Development ($400.0M), which will deliver two towers comprising 176 apartments, 11,541.6 sq m office, and 421car parks.
Key residential projects include:
• 20& 20A Queen Street Apartments (180 Apartments)
• 28-40 Spendelove Street (52 Units)
• 84 Pohlman Street Villas (12 Villas)
• 20Stradbroke Street (3 Dwellings)
Despite multiple residential projects in the pipeline, there is only 5 new houses planned. This is notenough to answer demand for houses, which suggests many buyers will redirect their interest to units. Further, new units take time to develop. Thus,in the short-term, house and unit prices are likely to increase.

41 Townhouses 1,854Units/ Apartments


AVERAGE VENDOR DISCOUNT*
Average vendor discount reflects the average percentage difference between the first list price and final sold price. A lower percentage difference (closer to 0.0%) suggests that buyers are willing to purchase close to the first asking price of a property.


Average vendor discounts between Q4 2024and Q4 2025 have swung from a discount to a premium of1.8%for houses and 1.6% for units. The peak discount has passed in Q1 2025. Market conditions in Southport* now favour sellers, where buyers must offer above the listed prices. With very few new houses planned in 2026,buyers must actfast
The suburb ofSouthport has historically provided a more affordable market than the Gold Coast Local Government Area (LGA) in bothhouse and unit median prices for the past 5years. This continued tobe the case in 2025, with both the suburb and the LGA experiencing price growth.
The dominant proportion of homes sold in Southport* in 2025were in the most affordable price point of less than $1,149,999for houses (37.2%)and less than $649,999for units (26.0%). This is good news for first-home buyers That said, the premium price bracket in Southport* is strong, with 28.9%of houses sold above $1,450,000and 19.3%of units sold above $950,000. This is good news for owners looking tocapitalise on their investments in Southport* Overall, Southport* offers housing options across a broad range of price points, suitable for all budgets.
MARKET COMPARISON
The market comparison graph provides a comparative trend for median price of houses and units over the past 5 years. The main LGA chosen was based on their proximity to the main suburb analysed, which is Southport.


PRICE BREAKDOWN 2025


than $649,999
$650,000 to $749,999 $750,000 to $849,999 $850,000 to $949,999 $950,000 and above
RENTAL GROWTH 2025€
House rental yields in Southport¥ were 3.4%as of December 2025,on par with Gold Coast (3.5%) but higher thanBrisbane Metro (2.9%). This is paired with a stable median house rental price in the past 12 months to Q4 2025,at $800 per week, and a 1.8% increase in the number of houses rented (to 112 rentals in Q4 2025). Average days on the market has declined to a historical lowof 21days. There is aresilient and highly demanded house rental market, benefitting investors.
4+ bedroom houses have provided investors with +15.8%rental growth annually, achieving a median rent of $1,100 per week.
Southport¥ recorded a vacancy rate of 0.7% in December 2025, below the Gold Coast Main average of 1.3% and Brisbane Metro’s 1.2%. Vacancy rates have decreased in the past 6 months, suggesting a tighter rental market. Further, a 0.7% vacancy rate is significantly below the Real Estate Institute of Australia’s healthy benchmark of 3.0%, indicatingquicker occupancyof rental homes in Southport¥. This creates a conducive environment for investors, even if median house and unit sale prices (thus, entry prices) have increased in the past 12 months to Q4 2025.
RENTAL VACANCY RATES 2025

Southport (4215) Gold Coast Main Brisbane Metro REIA 'Healthy' Benchmark

RENTAL YIELD 2025§ %

Southport¥
PROJECT DEVELOPMENT MAP 2026 ₳
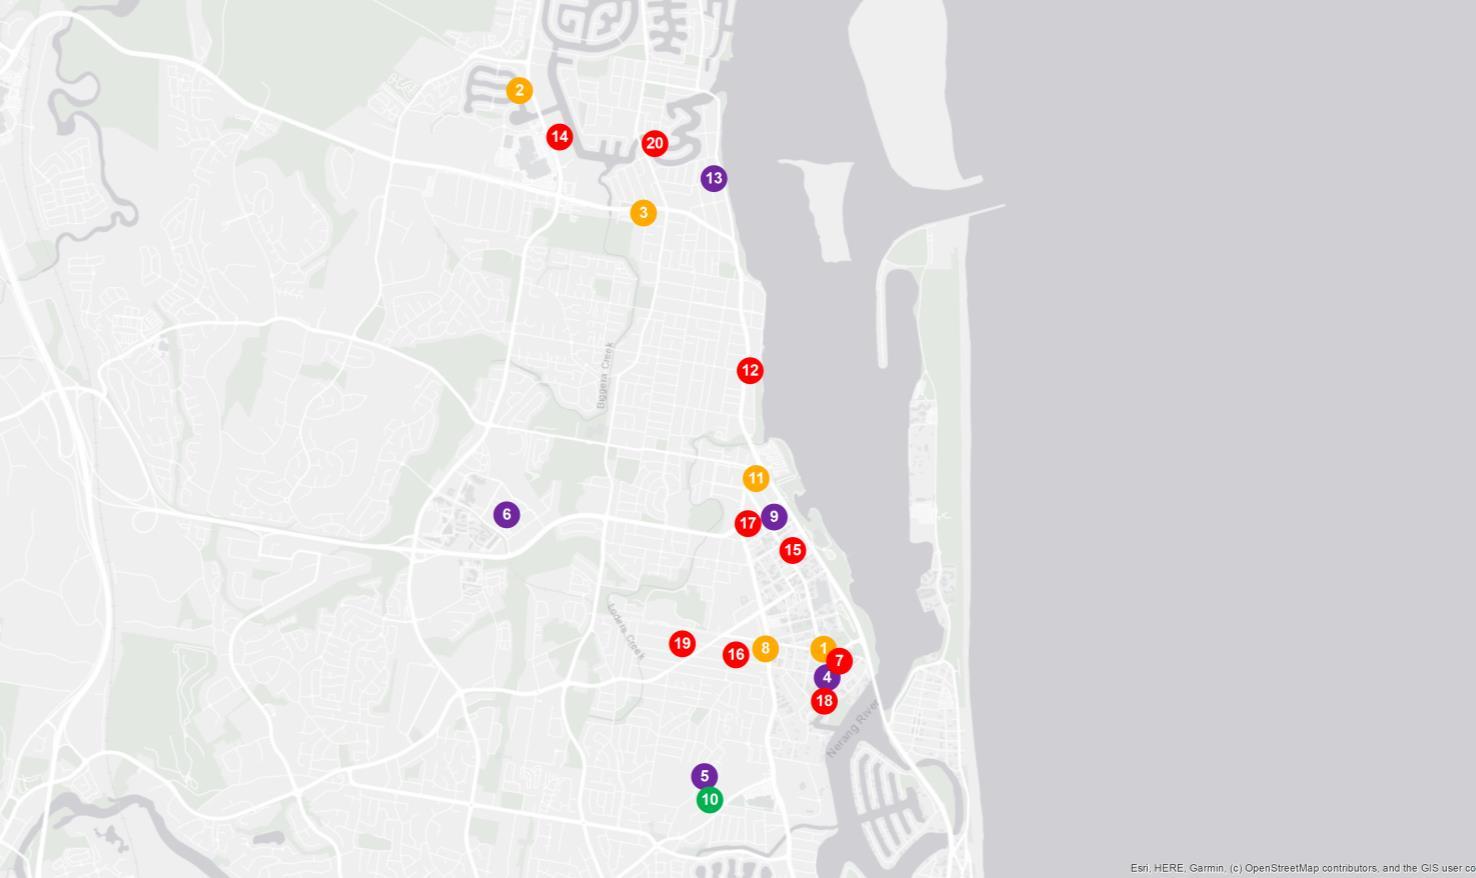

SOUTHPORT


RESEARCH SERVICES
Our research services span over every suburb, LGA,and state within Australia; capturedin a variety of standard and customised products, andinclude:
• Advisory and consultancy
• Market analysis including profiling and trends
• Primary qualitative and quantitative research
• Demographic and target market analysis
• Geographic information mapping
• Project analysis including product and pricing recommendations
• Rental and investment return analysis
OUR KNOWLEDGE
Access to accurate and objective research is the foundation of all good property decisions.
OUR PEOPLE
Our research team is made up of highly qualified researchers who focus solely on property analysis.


REFERENCES
* Southport sales market data and key indicators encapsulates aggregate property market conditions within the suburbs of Southport, Biggera Waters and Labrador.
** Estimated values are based on construction value provided by the relevant data authority and does not reflect commercial and/or re-sale value.
# 2025 encapsulates sales transactions for the full year 2025 (01/01/2025– 31/12/2025).
€ Annual rental growth is a comparison between Q4 2024 (01/10/2024 – 31/12/2024) and Q4 2025 (01/10/2025 – 31/12/2025) house median rent figures.
¥ Southport rental market data encapsulates aggregate property conditions within the postcode of 4215.
§ Rental yields shown are as reported as of December 2025
₳ Project development map showcases a sample of upcoming projects only, due to accuracy of addresses provided by the data provider for geocoding purposes.
£ Projects refers to the top developments within the suburbs of Southport, Biggera Waters and Labrador
µ Estimated value is the value of construction costs provided by relevant data authority, it does not reflect the project’s sale/commercial value.
ψ Commencement date quoted for each project is an approximate only, as provided by the relevant data authority, PRD does not hold any liability to the exact date.
Source: APM Pricefinder, Cordell Connect database, SQM Research, Esri ArcGIS.
Disclaimer: PRD does not give any warranty in relation to the accuracy of the information contained in this report. If you intend to rely upon the information contained herein, you must take note that the information, figures and projections have been provided by various sources and have not been verified by us. We have no belief one way or the other in relation to the accuracy of such information, figures and projections. PRD will not be liable for any loss or damage resulting from any statement, figure, calculation or any other information that you rely upon that is contained in the material.
Prepared by PRD Research. © All medians and volumes are calculated by PRD Research. Use with written permission only. All other responsibilities disclaimed. © Copyright PRD 2026.