
PRD Robina Market Update 1st Half 2026

Page 1


Robina Market Update 1st Half 2026

In Q4 2025,Robina* recorded a median house price of $1,525,000and a median unit price of $985,000.This represents an annual (Q4 2024 - Q4 2025)price growth of 17.3%for houses and 23.1%for units. Comparing Q4 2024and Q4 2025,total sales decreased by -8.5% (to 75sales in Q4 2025) for houses and -20.4% (to 78 sales in Q4 2025)for units. This suggests an undersupplied market for both houses and units, which combined with lower interest rates throughout 2025have resulted in more price growth. Thus,now is anideal time for owners to capitalize ontheir investments. Without any new ready-to-sell stand-alone houses planned from 2026 onwards, buyers need to act fast before prices increase even further

CHANGE FROM LAST

HOUSE SALES

HOUSE MEDIAN PRICE

HOUSE RENTAL PRICE

SALES

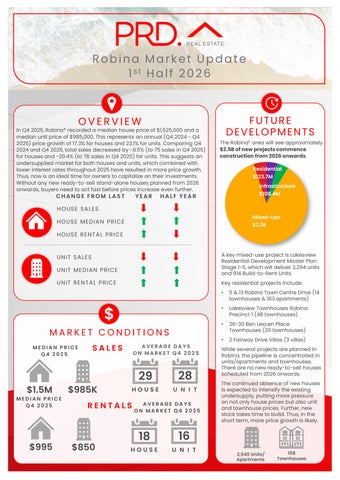
The Robina£ area will see approximately $2.5Bofnewprojectscommence constructionfrom2026onwards

PRICE

RENTAL PRICE

MEDIAN PRICE Q4 2025

$1.5M $985K

MEDIAN PRICE Q4 2025

YEAR HALF YEAR

CONDITIONS

AVERAGE DAYS ON MARKET Q4 2025

29

28

AVERAGE DAYS ON MARKET Q4 2025

16

A key mixed-use project is Lakesview Residential Development Master Plan Stage 1-5, which will deliver 2,294units and 914Build-to-Rent Units.

Key residential projects include:

• 5 & 13Robina Town Centre Drive (14 townhouses & 163apartments)

• Lakesview Townhouses Robina Precinct 1 (48 townhouses)

• 26-30 Ben Lexcen Place Townhouses (20 townhouses)

• 2Fairway Drive Villas (3 villas)

While several projects are planned in Robina, the pipeline is concentrated in units/apartments and townhouses. There are no new ready-to-sell houses scheduled from 2026 onwards.

The continued absence of new houses is expected to intensify the existing undersupply, putting more pressure on notonly house prices but also unit and townhouse prices. Further, new stock takes time to build. Thus,in the short term, more price growth is likely.

AVERAGE VENDOR DISCOUNT*

Average vendor discount reflects the average percentage difference between the first list price and final sold price. A lower percentage difference (closer to 0.0%) suggests that buyers are willing to purchase close to the first asking price of a property.

Average vendor discounts between Q4 2024and Q4 2025 have swung from a discount toa premium of 0.3%for houses, while units remained in premium territory at a higher level of 3.2% Robina* is now a seller’s market, as buyers must offer higher thanthe initial listing prices. With no new houses planned, buyers must actfast

The suburb of Robina has generally remained slightly more affordable than the Gold Coast Local Government Area (LGA) in median house prices, while median unit prices were broadly onpar. However, in 2025,median house and unit prices in the suburb of Robina surpassed Gold Coast LGA for the first time, now a premium market.

Most of the homes sold in Robina* in 2025were in the most affordable price brackets, with 33.4%of houses sold below $1,349,999and 30.6% of units sold below $799,999. This is good news for home buyers, especially considering median house and unit price growth in the past 12 months to Q4 2025.The premium market is still strong, with 27.2% of houses sold above $1.65Mand 19.8% of units sold above $1.10M,benefiting owners looking tocapitalize ontheir investments Overall, there is a home for every budget.

MARKET COMPARISON

House Gold Coast LGA House Robina Unit Gold Coast LGA Unit

The market comparison graph providesa comparative trend for median price of houses and units over the past 5 years. The main LGA chosen was based on their proximity to the main suburb analysed, which is Robina.

PRICE BREAKDOWN 2025

than $799,999 $800,000 to $899,999 $900,000 to $999,999 $1,000,000 to $1,099,999 $1,100,000 and above

Robina

RENTAL GROWTH 2025€

House rental yield in Robina¥ was 3.7% as of December 2025, higher than the Gold Coast (3.5%) and Brisbane Metro (2.9%). This is paired with a 4.7% growth in the median house rental price in the past 12 months to Q4 2025,to $995per week. During this time, the number of house rented decreased by -7.2%(to 116 rentals in Q4 2025). This indicates an undersupplied and highly competitive house rental market in Robina¥, which is beneficial to investors.

4+ bedroom houses have provided investors with a significant +6.4% rental growth annually, achieving a median rent of $1,200 per week.

Robina¥ recorded a vacancy rate of 0.8% in December 2025, below Gold Coast Main average of 1.3%and Brisbane Metro’s 1.2%. Vacancy rates have slightly increased in the past 12month since December 2024,due to investors re-entering the market. However, a 0.8%vacancy rate is well below the Real Estate Institution of Australia’s healthy benchmark of 3.0%, indicating quicker occupancy of rental properties in Robina¥. This creates a conducive environment for investors, even with a higher house and unit sales (thus entry) price in the past 12months toQ4 2025.

RENTAL VACANCY RATES 2025

(4226) Gold Coast Main Brisbane Metro REIA 'Healthy' Benchmark

Robina¥
Robina

PROJECT DEVELOPMENT MAP 2026-2028

RESEARCH SERVICES

Our research services span over every suburb, LGA,and state within Australia; captured in a variety of standard and customised products, andinclude:

• Advisory and consultancy

• Market analysis including profiling and trends

• Primary qualitative and quantitative research

• Demographic and target market analysis

• Geographic information mapping

• Project analysis including product and pricing recommendations

• Rental and investment return analysis

OUR KNOWLEDGE

Access to accurate and objective research is the foundation of all good property decisions.

OUR PEOPLE

Our research team is made up of highly qualified researchers who focus solely on propertyanalysis.

REFERENCES

* Robina sales market data and key indicators encapsulates aggregate property market conditions within the suburb of Robina.

** Estimated values are based on construction value provided by the relevant data authority and does not reflect commercial and/or re-sale value.

# 2025 encapsulates sales transactions for the full year 2025 (01/01/2025 – 31/12/2025).

€ Annual rental growth is a comparison between Q4 2024 (01/10/2024 – 31/12/2024) and Q4 2025 (01/10/2025 – 31/12/2025) house median rent figures.

¥ Robina rental market data encapsulates aggregate property conditions within the postcode of 4226.

§ Rental yields shown are as reported as of December 2025.

₳ Project development map showcases a sample of upcoming projects only, due to accuracy of addresses provided by the data provider for geocoding purposes.

£ Projects refers to the top developments within the postcode of 4226.

µ Estimated value is the value of construction costs provided by relevant data authority, it does not reflect the project’s sale/commercial value.

ψ Commencement date quoted for each project is an approximate only, as provided by the relevant data authority, PRD does not hold any liability to the exact date.

Source: APM Pricefinder, Cordell Connect database, SQM Research, Esri ArcGIS.

Disclaimer: PRD does not give any warranty in relation to the accuracy of the information contained in this report. If you intend to rely upon the information contained herein, you must take note that the information, figures and projections have been provided by various sources and have not been verified by us. We have no belief one way or the other in relation to the accuracy of such information, figures and projections. PRD will not be liable for any loss or damage resulting from any statement, figure, calculation or any other information that you rely upon that is contained in the material.

Prepared by PRD Research. © All medians and volumes are calculated by PRD Research. Use with written permission only. All other responsibilities disclaimed. © Copyright PRD 2026.

Turn static files into dynamic content formats.

Create a flipbook
PRD Robina Market Update 1st Half 2026 by PRD Real Estate - Issuu