Orange Market Update 1 st H a l f 2 0 2 6
FUTURE DEVELOPMENTS
OVERVIEW
In Q4 2025, Orange* recorded a median house price of $730,000, and a median unit price of $495,000. This represents an annual (Q4 2024 – Q4 2025) price growth of 7.8% for houses and 20.4% for units. Between Q4 2024 – Q4 2025 sales increased, by 14.9% (to 348 for houses in Q4 2025) and by 109.1% for units (to 46 sales in Q4 2025). Price growth and higher number of sales suggests a highly-demanded market, which was further aided by previously lower interest rates. This suggests that now is an ideal opportunity for owners to capitalise on their investment. There are several residential projects planned in 2026, which will assist with supply.
CHANGE FROM LAST
YEAR
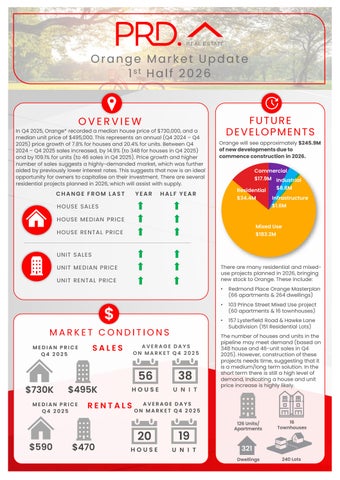
Orange will see approximately $245.9M of new developments due to commence construction in 2026.
Commercial $17.9M Industrial $8.8M
Residential
HALF YEAR
$34.4M
Infrastructure $1.6M
HOUSE SALE S HOUSE ME DIAN PRICE
Mixed Use
HOUSE RE NTAL PRICE
$183.2M
UNIT SALE S There are many residential and mixeduse projects planned in 2026, bringing new stock to Orange. These include:
UNIT ME DIAN PRICE UNIT RE NTAL PRICE
$ MARKET CONDITIONS MEDIAN PRICE Q4 2025
$730K
$495K
MEDIAN PRICE Q4 2025
$590
SALES
AVERAGE DAYS ON MARKET Q4 2025
56
38
HOUSE
U N I T
RENTALS
$470
•
Redmond Place Orange Masterplan (66 apartments & 264 dwellings)
•
103 Prince Street Mixed Use project (60 apartments & 16 townhouses)
•
157 Lysterfield Road & Hawke Lane Subdivision (151 Residential Lots)
The number of houses and units in the pipeline may meet demand (based on 348 house and 46-unit sales in Q4 2025). However, construction of these projects needs time, suggesting that it is a medium/long term solution. In the short term there is still a high level of demand, indicating a house and unit price increase is highly likely.
AVERAGE DAYS ON MARKET Q4 2025
20
19
HOUSE
U N I T
126 Units/ Apartments
16 Townhouses
321 Dwellings
240 Lots