Kyneton Market Update 1 st H a l f 2 0 2 6
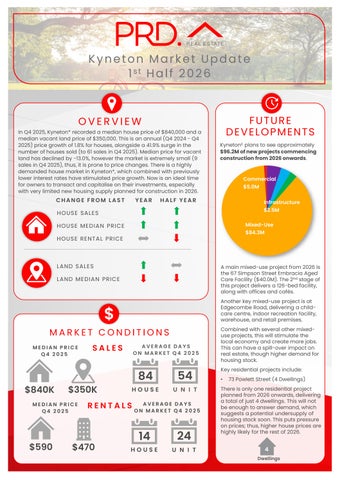
FUTURE DEVELOPMENTS
OVERVIEW
In Q4 2025, Kyneton* recorded a median house price of $840,000 and a median vacant land price of $350,000. This is an annual (Q4 2024 - Q4 2025) price growth of 1.8% for houses, alongside a 41.9% surge in the number of houses sold (to 61 sales in Q4 2025). Median price for vacant land has declined by -13.0%, however the market is extremely small (9 sales in Q4 2025), thus, it is prone to price changes. There is a highly demanded house market in Kyneton*, which combined with previously lower interest rates have stimulated price growth. Now is an ideal time for owners to transact and capitalise on their investments, especially with very limited new housing supply planned for construction in 2026.
CHANGE FROM LAST
YEAR
Kyneton£ plans to see approximately $96.2M of new projects commencing construction from 2026 onwards.
Commercial $5.0M
HALF YEAR
Infrastructure $2.5M
HOUSE SALE S
Mixed-Use
HOUSE ME DIAN PRICE
$84.3M
HOUSE RE NTAL PRICE
LAND SALE S
A main mixed-use project from 2026 is the 67 Simpson Street Embracia Aged Care Facility ($40.0M). The 2nd stage of this project delivers a 126-bed facility, along with offices and cafés.
LAND ME DIAN PRICE
Another key mixed-use project is at Edgecombe Road, delivering a childcare centre, indoor recreation facility, warehouse, and retail premises.
$ MARKET CONDITIONS MEDIAN PRICE Q4 2025
$840K
$350K
MEDIAN PRICE Q4 2025
$590
SALES
AVERAGE DAYS ON MARKET Q4 2025
84
54
HOUSE
U N I T
RENTALS
$470
AVERAGE DAYS ON MARKET Q4 2025
14
24
HOUSE
U N I T
Combined with several other mixeduse projects, this will stimulate the local economy and create more jobs. This can have a spill-over impact on real estate, though higher demand for housing stock. Key residential projects include: •
73 Powlett Street (4 Dwellings)
There is only one residential project planned from 2026 onwards, delivering a total of just 4 dwellings. This will not be enough to answer demand, which suggests a potential undersupply of housing stock soon. This puts pressure on prices; thus, higher house prices are highly likely for the rest of 2026.
4 Dwellings