
PRD Kingsgrove Market Update 2nd Half 2025

Page 1


Kingsgrove Market Update 2nd Half 2025

In Q3 2025, Kingsgrove* recorded a median house price of $1,890,000, and a median unit price of $663,000.This represents annual (Q3 2024 –Q3 2025)median price growth of 6.7%for houses and a slight softening of -1.8% for units. Comparing Q3 2024and Q3 2025,sales increased by 13.3%for houses (to 153sales in Q3 2025)and by 9.0%for units (to 97 sales in Q3 2025). Housing stock is highly demanded, which created a buffer against higher interest rates – especially for houses. Thus, now is an ideal time forhouse owners to capitalise on their investments. With little ready-to-go housing stock planned in 2025, buyers must act fast.

HOUSE SALES YEAR HALF YEAR CHANGE FROM LAST

HOUSE MEDIAN PRICE

HOUSE RENTAL PRICE

SALES

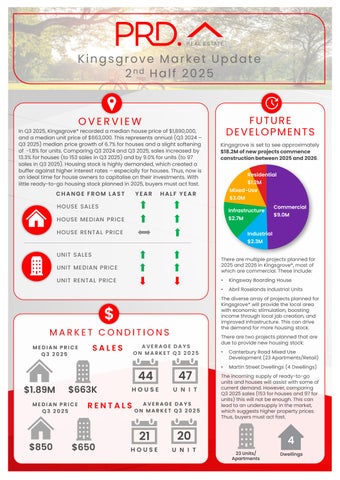
Kingsgrove is set to see approximately $18.2Mofnewprojectscommence constructionbetween2025and2026

PRICE

RENTAL PRICE

MEDIAN PRICE Q3 2025

$1.89M $663K

MEDIAN PRICE Q3 2025

AVERAGE DAYS ON MARKET Q3 2025

44

47 $650 HOUSE UNIT

AVERAGE DAYS ON MARKET Q3 2025

There aremultiple projects planned for 2025 and 2026 in Kingsgrove*,most of which are commercial. These include:

• Kingsway Boarding House

• Abril Roselands Industrial Units

The diversearrayof projectsplanned for Kingsgrove* will provide the local area with economic stimulation, boosting income through local job creation, and improved infrastructure. This can drive the demand for more housing stock.

There aretwo projects planned that are due to provide new housing stock:

• Canterbury Road Mixed Use Development (23 Apartments/Retail)

• Martin Street Dwellings (4 Dwellings)

The incoming supply of ready-to-go units and houses will assist with someof current demand. However, comparing Q3 2025sales(153 for houses and 97 for units) this will not be enough. This can lead to an undersupply in the market, which suggestshigher property prices. Thus, buyersmust act fast.

4

21 20 Dwellings 23Units/ Apartments

AVERAGE VENDOR DISCOUNT*

Average vendor discount reflects the average percentage difference between the first list price and final sold price. A lower percentage difference (closer to 0.0%) suggests that buyers are willing to purchase close to the first asking price of a property.

In the past 12months to Q3 2025average vendor discount have increased to a further premium of 9.4%for houses. Average vendor discount forunits have swung froma discount of -1.1% to a premium of 0.1%. Market conditions in Kingsgrove still favour sellers, as buyers must offer higher than the first list price. There is an opportunity for a lower premium forunits in Q3 2025,thus buyers must act fast.

The suburb of Kingsgrove has historically outperformed the wider Canterbury-Bankstown Local Government Area (LGA) in bothhouse and unit median prices. 2025# has seen median unit prices return to sit onpar with the wider Canterbury-Bankstown LGA, while houses still present a premium market (even with a lower growth rate).

The dominant proportion of homes sold in Kingsgrove* in 2025# were priced in the premium price point of $1.9Mand above (41.7%); in good news for owners. Buyers looking for affordable houses have access to 28.3%of stock,priced at less than$1.6M. Most of the units sold were in the most affordable price point of less than $599.999(35.7%); but the premium market of $900,000and above is growing, Overall, there is a property for all budgets in Kingsgrove*.

MARKET COMPARISON

The market comparison graph provides a comparative trend forthe median price of houses and unit over the past 5 years. The suburb chosen was based on their proximity to the main LGA analysed, which is Kingsgrove*.

PRICE

than $599,999

$600,000 to $699,999

$700,000 to $799,999 $800,000 to $899,999 $900,000 and above

RENTAL GROWTH 2025€

House rental yields in Kingsgrove* was 2.4%in September 2025,slightly below the CanterburyBankstown LGA (2.7%) and Sydney Metro (2.7%) rental yields. Thatsaid, median house rental price have remained stable in the past 12 months to Q3 2025,at $850per week. The number of houses rented decreased by -21.4% in the past 12months, to 33rental homes in Q3 2025. This trend is also found in the unit rental market, which confirms anundersupply for both types in Kingsgrove¥. This is beneficial for investors, even with a higher entry price in Q3 2025.

4+ bedroom houses have provided investors with +9.1% rental growth annually, achieving a median rent of $1200per week.

Kingsgrove¥ recorded a vacancy rate of 0.8%inSeptember 2025,lower thanthe CanterburyBankstown LGA’s 0.9% and the Sydney Metro’s 1.3%. Vacancy rates in Kingsgrove¥ trended downwards in the past 12months, indicating a tighter rental market. Further, a 0.8% vacancy rate is significantly below the Real Estate Institution of Australia’s healthy benchmark of 3.0%, suggesting quicker occupancy of rental homes in Kingsgrove¥. This is conducive for investors.

RENTAL VACANCY RATES 2025# RENTAL

PROJECT DEVELOPMENT MAP 2025 ₳

KINGSGROVE

RESEARCH SERVICES

Our research services span over every suburb, LGA,and state within Australia; captured in a variety of standard and customised products, andinclude:

• Advisory and consultancy

• Market analysis including profiling and trends

• Primary qualitative and quantitative research

• Demographic and target market analysis

• Geographic information mapping

• Project analysis including product and pricing recommendations

• Rental and investment return analysis

OUR KNOWLEDGE

Access to accurate and objective research is the foundation of all good property decisions.

OUR PEOPLE

Our research team is made up of highly qualified researchers who focus solely on propertyanalysis.

REFERENCES

* Kingsgrove market data and key indicators encapsulates aggregate property market conditions within the suburbs of Kingsgrove, Roselands, Earlwood, Beverly Hills, Belmore and Clemton Park.

** Estimated values are based on construction value provided by the relevant data authority and does not reflect commercial and/or re-sale value.

# 2025 encapsulates sales transactions for 2025 (01/01/2025 – 30/09/2025)only, other years encapsulates sales transactions for the full year (i.e 01/01 to 31/12 of the relevant year).

€ Annual rental growth is a comparison between Q3 2024 (01/07/2024 – 30/09/2024)and Q3 2025 (01/07/2025 – 30/09/2025) house median rent figures.

¥ Kingsgrove rental market data encapsulates aggregate property conditions within the postcode of 2208.

§ Rental yields shown are as reported as of September 2025.

₳ Project development map showcases a sample of upcoming projects only, due to accuracy of addresses provided by the data provider for geocoding purposes.

£ Projects refers to the top developments within the suburbs of Kingsgrove, Roselands, Earlwood, Beverly Hills, Belmore and Clemton Park.

µ Estimated value is the value of construction costs provided by relevant data authority, it does not reflect the project’s sale/commercial value.

ψ Commencement date quoted for each project is an approximate only, as provided by the relevant data authority, PRD does not hold any liability to the exact date.

Source: APM Pricefinder, Cordell Connect database, SQM Research, Esri ArcGIS.

Disclaimer: PRD does not give any warranty in relation to the accuracy of the information contained in this report. If you intend to rely upon the information contained herein, you must take note that the information, figures and projections have been provided by various sources and have not been verified by us. We have no belief one way or the other in relation to the accuracy of such information, figures and projections. PRD will not be liable for any loss or damage resulting from any statement, figure, calculation or any other information that you rely upon that is contained in the material.

Prepared by PRD Research. © All medians and volumes are calculated by PRD Research. Use with written permission only. All other responsibilities disclaimed. © Copyright PRD 2025.

Turn static files into dynamic content formats.

Create a flipbook