Karratha Market Update 1 st H a l f 2 0 2 6
FUTURE DEVELOPMENTS
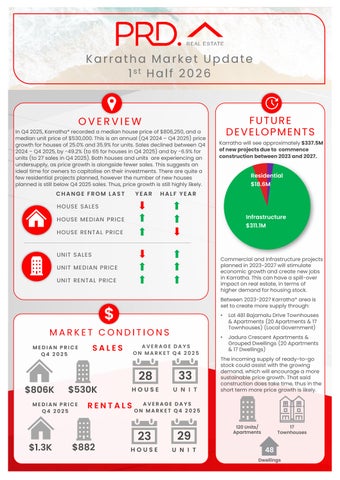
OVERVIEW
In Q4 2025, Karratha* recorded a median house price of $806,250, and a median unit price of $530,000. This is an annual (Q4 2024 – Q4 2025) price growth for houses of 25.0% and 35.9% for units. Sales declined between Q4 2024 – Q4 2025, by -49.2% (to 65 for houses in Q4 2025) and by -6.9% for units (to 27 sales in Q4 2025). Both houses and units are experiencing an undersupply, as price growth is alongside fewer sales. This suggests an ideal time for owners to capitalise on their investments. There are quite a few residential projects planned, however the number of new houses planned is still below Q4 2025 sales. Thus, price growth is still highly likely.
CHANGE FROM LAST
YEAR
Karratha will see approximately $337.5M of new projects due to commence construction between 2023 and 2027.
Residential $18.6M
HALF YEAR
HOUSE SALE S Infrastructure
HOUSE ME DIAN PRICE
$311.1M
HOUSE RE NTAL PRICE
UNIT SALE S
Commercial and infrastructure projects planned in 2023-2027 will stimulate economic growth and create new jobs in Karratha. This can have a spill-over impact on real estate, in terms of higher demand for housing stock.
UNIT ME DIAN PRICE UNIT RE NTAL PRICE
Between 2023-2027 Karratha* area is set to create more supply through:
$ MARKET CONDITIONS MEDIAN PRICE Q4 2025
$806K
$530K
MEDIAN PRICE Q4 2025
$1.3K
SALES
AVERAGE DAYS ON MARKET Q4 2025
28
33
HOUSE
U N I T
RENTALS
$882
•
Lot 481 Bajamalu Drive Townhouses & Apartments (20 Apartments & 17 Townhouses) (Local Government)
•
Jadura Crescent Apartments & Grouped Dwellings (20 Apartments & 17 Dwellings)
The incoming supply of ready-to-go stock could assist with the growing demand, which will encourage a more sustainable price growth. That said construction does take time, thus in the short term more price growth is likely.
AVERAGE DAYS ON MARKET Q4 2025
23
29
HOUSE
U N I T
17 Townhouses
120 Units/ Apartments
48 Dwellings