Ingleburn Market Update 1 st H a l f 2 0 2 6
FUTURE DEVELOPMENTS
OVERVIEW
In Q4 2025, Ingleburn* recorded a median house price of $1,150,000, and a median unit price of $645,000. This is an annual (Q4 2024 – Q4 2025) price growth of 11.7% for houses and 10.7% for units. Between Q4 2024 – Q4 2025 total sales increased, by 5.5% (to 403 for houses in Q4 2025) and has seen a 65.7% increase for units (to 222 sales in Q4 2025). Houses and units are in high demand, which has stimulated price growth. This creates an opportunity for owners to capitalise on their investments. There is many units planned for construction in 2026; however, this will take to build. Thus, buyers are encouraged to act, before prices increase even further.
CHANGE FROM LAST
YEAR
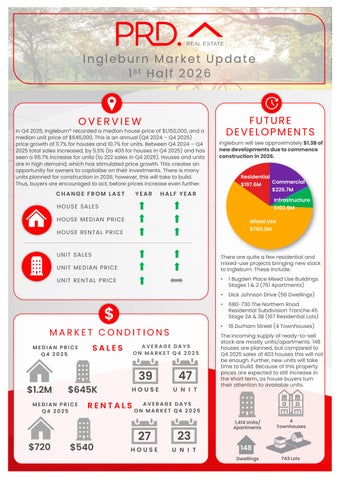
Ingleburn will see approximately $1.3B of new developments due to commence construction in 2026.
Residential $197.6M
HALF YEAR
$102.5M
HOUSE ME DIAN PRICE
Mixed Use $766.2M
HOUSE RE NTAL PRICE
UNIT SALE S UNIT ME DIAN PRICE
There are quite a few residential and mixed-use projects bringing new stock to Ingleburn. These include:
UNIT RE NTAL PRICE
•
1 Bugden Place Mixed Use Buildings Stages 1 & 2 (761 Apartments)
•
Dick Johnson Drive (56 Dwellings)
•
680-730 The Northern Road Residential Subdivision Tranche 45 Stage 2A & 2B (167 Residential Lots)
•
18 Durham Street (4 Townhouses)
$ MARKET CONDITIONS MEDIAN PRICE Q4 2025
SALES
$645K
MEDIAN PRICE Q4 2025
$720
$226.7M Infrastructure
HOUSE SALE S
$1.2M
Commercial
AVERAGE DAYS ON MARKET Q4 2025
39
47
HOUSE
U N I T
RENTALS
$540
The incoming supply of ready-to-sell stock are mostly units/apartments. 148 houses are planned, but compared to Q4 2025 sales of 403 houses this will not be enough. Further, new units will take time to build. Because of this property prices are expected to still increase in the short term, as house buyers turn their attention to available units.
AVERAGE DAYS ON MARKET Q4 2025
27
23
HOUSE
U N I T
1,414 Units/ Apartments
4 Townhouses
148 Dwellings
743 Lots