
PRD Hobart Market Update 1st Half 2026

Page 1


Hobart Market Update 1st Half 2026

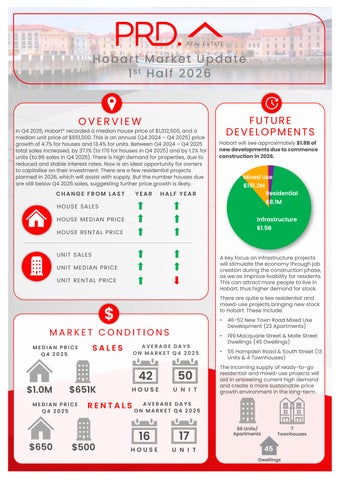
In Q4 2025, Hobart* recorded a median house price of $1,012,500,and a median unit price of $651,000.This is an annual (Q4 2024 – Q4 2025)price growth of 4.7% for houses and 13.4% for units. Between Q4 2024 – Q4 2025 total sales increased, by 37.1% (to 170 for houses in Q4 2025)and by 1.2% for units (to 86 sales in Q4 2025). There is high demand for properties, due to reduced and stable interest rates. Now is an ideal opportunity for owners to capitalise on their investment. There are a few residential projects planned in 2026,which will assist with supply. But the number houses due are still below Q4 2025sales, suggesting further price growth is likely.

YEAR HALF YEAR CHANGE FROM LAST

HOUSE SALES

HOUSE MEDIAN PRICE

HOUSE RENTAL PRICE

SALES

Hobart will see approximately$1.8Bof newdevelopmentsduetocommence constructionin2026.

PRICE

RENTAL PRICE

MEDIAN PRICE Q4 2025

$1.0M $651K

MEDIAN PRICE Q4 2025

AVERAGE DAYS ON MARKET Q4 2025

42

AVERAGE DAYS ON MARKET Q4 2025

A key focus oninfrastructure projects will stimulate the economy through job creation during the construction phase, as we as improve livability for residents. This canattract more people to live in Hobart, thus higher demand for stock.

There are quite a few residential and mixed-use projects bringing new stock to Hobart. These include:

• 46-52 New Town Road Mixed Use Development (23 Apartments)

• 199Macquarie Street & Molle Street Dwellings (45 Dwellings)

• 55 Hampden Road & SouthStreet (13 Units & 4 Townhouses)

The incoming supply of ready-to-go residential and mixed-use projects will aid in answering current high demand and create a more sustainable price growth environment in the long-term.

AVERAGE VENDOR DISCOUNT*

Average vendor discount reflects the average percentage difference between the first list price and final sold price. A lower percentage difference (closer to 0.0%) suggests that buyers are willing to purchase close to the first asking price of a property.

In the past 12months to Q4 2025 average vendor discount for houses and units have swung to premiums of 2.7% and 1.5%, respectively. For the first time since 2024, the market favours sellers; where buyers must offer higher than the initial listing price. This creates an ideal opportunity for owners. With a significant undersupply seen across the Hobart*, market buyers must act fast; before the current premiums climb to an even higher percentage.

The suburb of Sandy Bay has historically been a premium option compared to Hobart Local Government Area (LGA) for median house prices. This continued to be the case for 2025#.Units in Sandy Bay have historically tracked on par with the wider LGA, with 2025# seeing this trend continue.

Most of the properties sold in Hobart* in 2025#were in the premium price point of $1,250,000and above for houses (27.9%) and $800,000 and above for units (32.0%). This is an opportunity for owners looking to capitalise on their investment. However, 25.9% of house sales are in the more affordable middle price bracket of $800,000- $949,999 and 25.5% of unit sales were in the most affordable price point of less than $499,999;in good news for buyers. The market comparison graph provides a comparative trend for the median price of houses and unit in the past 5 years. The main LGA profiled was chosen based on their proximity to the main suburb analysed, which is Sandy Bay.

MARKET COMPARISON

PRICE BREAKDOWN 2025#

than $499,999 $500,000 to $599,999

$600,000 to $699,999

$700,000 to $799,999 $800,000 and above

Sandy Bay House

RENTAL GROWTH 2025€

House rental yields in Hobart¥ was 3.2%in December 2025,comparable to Hobart LGA (3.4%) and Hobart Metro (3.5%). This was paired with a 4.8%increase in median house rental price in the past 12 months to Q4 2025,at $650 per week. The number of houses rented decreased, by -9.9% in the past 12months, to 192rentals in Q4 2025. This suggests anundersupplied and highly demanded rental market in Hobart¥, which is beneficial to investors.

2-bedroom houses have provided investors with +9.5%rental growth annually, achieving a median rent of $575per week.

Hobart¥ recorded a vacancy rate of 0.7% in December 2025,on par with Hobart LGA’s 0.5% and Hobart Metro 0.5% average. Thatsaid vacancy rates in Hobart¥ decreased in the past 12 months, indicating a tighter rental market. Moreover, a 0.7% vacancyrate is well below the Real Estate Institution of Australia’s healthy benchmark of 3.0%, thus quicker occupancy of rental homes. This is a conducive environment for investors, even if the median house and unit sales price (thus, entry price) have increased in the past 12months toQ4 2025.

RENTAL VACANCY RATES 2025

Hobart¥
Hobart (7005)
Hobart LGA
Hobart Metro

PROJECT DEVELOPMENT MAP 2026 ₳

HOBART

RESEARCH SERVICES

Our research services span over every suburb, LGA,and state within Australia; captured in a variety of standard and customised products, andinclude:

• Advisory and consultancy

• Market analysis including profiling and trends

• Primary qualitative and quantitative research

• Demographic and target market analysis

• Geographic information mapping

• Project analysis including product and pricing recommendations

• Rental and investment return analysis

OUR KNOWLEDGE

Access to accurate and objective research is the foundation of all good property decisions.

OUR PEOPLE

Our research team is made up of highly qualified researchers who focus solely on propertyanalysis.

REFERENCES

* Hobart sales market data and key indicators encapsulates aggregate property market conditions within the Hobart Local Government Area.

** Estimated values are based on construction value provided by the relevant data authority and does not reflect commercial and/or re-sale value.

# 2025 encapsulates sales transactions for the 2025 full year (01/01/2025-31/12/2025).

€ Annual rental growth is a comparison between Q4 2024 (01/10/2024 – 31/12/2024) and Q4 2025 (01/10/2025 – 31/12/2025) house median rent figures.

¥ Hobart rental market data encapsulates aggregate property conditions within the postcode of 7005.

§ Rental yields and vacancy rates shown are as reported as of December 2025.

₳ Project development map showcases a sample of upcoming projects only, due to accuracy of addresses provided by the data provider for geocoding purposes.

£ Projects refers to the top developments within the Hobart Local Government Area.

µ Estimated value is the value of construction costs provided by relevant data authority, it does not reflect the project’s sale/commercial value.

ψ Commencement date quoted for each project is an approximate only, as provided by the relevant data authority, PRD does not hold any liability to the exact date.

Source: APM Pricefinder, Cordell Connect database, SQM Research, Esri ArcGIS.

Disclaimer: PRD does not give any warranty in relation to the accuracy of the information contained in this report. If you intend to rely upon the information contained herein, you must take note that the information, figures and projections have been provided by various sources and have not been verified by us. We have no belief one way or the other in relation to the accuracy of such information, figures and projections. PRD will not be liable for any loss or damage resulting from any statement, figure, calculation or any other information that you rely upon that is contained in the material.

Prepared by PRD Research. © All medians and volumes are calculated by PRD Research. Use with written permission only. All other responsibilities disclaimed. © Copyright PRD 2026.

Turn static files into dynamic content formats.

Create a flipbook