
Gundagai Market Update 1st Half 2026

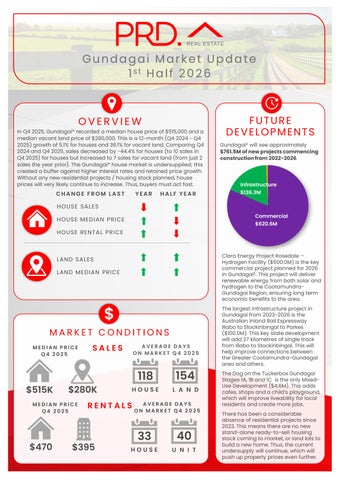
In Q4 2025, Gundagai* recorded a median house price of $515,000 and a median vacant land price of $280,000.This is a 12-month (Q4 2024- Q4 2025)growth of 5.1% for houses and 36.1%for vacant land. Comparing Q4 2024and Q4 2025,sales decreased by -44.4% for houses (to 10 sales in Q4 2025)for houses but increased to 7 sales for vacant land (from just 2 sales the year prior). The Gundagai* house market is undersupplied; this created a buffer against higher interest rates and retained price growth. Without any new residential projects / housing stock planned, house prices will very likely continue to increase. Thus, buyers must act fast.
CHANGE FROM LAST



Gundagai£ will see approximately $761.5Mofnewprojectscommencing constructionfrom2022-2026
HOUSE SALES
HOUSE MEDIAN PRICE
HOUSE RENTAL PRICE
LAND SALES
LAND MEDIAN PRICE

MEDIAN PRICE Q4 2025

$515K $280K
MEDIAN PRICE Q4 2025
YEAR HALF YEAR

33 40 $470 Commercial
CONDITIONS
AVERAGE DAYS ON MARKET Q4 2025
118
154 $395 HOUSE UNIT
AVERAGE DAYS ON MARKET Q4 2025

Clara Energy Project Rosedale –Hydrogen Facility ($600.0M)is the key commercial project planned for 2026 in Gundagai£ This project will deliver renewable energy from both solar and hydrogen to the CootamundraGundagai Region, ensuring long term economic benefits to the area.
The largest infrastructure project in Gundagai from 2023-2026is the Australian Inland Rail Expressway Illabo to Stockinbingal to Parkes ($100.0M). This key state development will add 27 kilometres of single track from Illabo to Stockinbingal. This will help improve connections between the Greater Cootamundra-Gundagai area and others.
The Dog on the TuckerboxGundagai Stages 1A, 1B and 1C is the only MixedUse Development ($4.6M). This adds cafes, shops and a child’s playground, which will improve liveability for local residents and create more jobs. There has been a considerable absence of residential projects since 2023.This means there are no new stand-alone ready-to-sell housing stock coming to market, or land lots to build a new home. Thus, the current undersupply will continue, which will push up property prices even further.

AVERAGE VENDOR DISCOUNT*
Average vendor discount reflects the average percentage difference between the first list price and final sold price. A lower percentage difference (closer to 0.0%) suggests that buyers are willing to purchase close to the first asking price of a property.




Average vendor discounts between Q4 2024and Q4 2025 have widened to -6.2% for houses, which suggests a higher discount compared to12 months prior. Thatsaid, when it is compared to earlier in 2025(Q1 and Q22025), average house vendor discount have tightened, suggesting there is less of a discount. This is in line with median house price growth in Gundagai*, thus buyers must actfast.
The suburb of Gundagai has remained on par with the wider Cootamundra-Gundagai Local LGA median house price over the past 5 years but have become a premium in 2025. Median vacantland price in Gundagai usually tracks above the LGA, which has continued in 2025.
Most of the homes sold in Gundagai* across 2025were split between the premium price point of $550,000and above (40.8%) and the most affordable point of less than $399,999(30.6%). This is good news for owners and buyers, with opportunities to capitalise on an investment and to enter the market. Vacant land had most properties sold in the middle price bracket of $200,000to $299,999.Overall, there are opportunities for all budgets, in both houses and vacantland, in Gundagai*.
MARKET COMPARISON
Gundagai (2722) House
Cootamundra-Gundagai LGA House Gundagai (2722) Vacant Land Cootamundra-Gundagai LGA Vacant Land
of houses and vacantland in the past 5years. The main LGA chosen was based on their proximity to the main suburb analysed, which is Gundagai (2722).

PRICE BREAKDOWN 2025








Less than $99,999
$100,000 to $199,999
$200,000 to $299,999
$300,000 to $399,999
$400,000 and above
RENTAL GROWTH 2025€
House rental yields in Gundagai¥ was 3.5%as of December 2025,above Sydney Metro (2.6%). The median house rental price increased by 11.9% in the 12months to Q4 2024, at $470per week. During this time, the number of houses rented decreased by -28.6% from 7 rentals in Q4 2024to 5rentals in Q4 2025. This indicates an undersupplied and a highly demanded rental market in Gundagai ¥, which benefits investors.
3-bedroom houses have provided investors with 5.0%rental growth annually, achieving a median rent of $462per week.
Gundagai¥ recorded a vacancyrate of 2.6%in December 2025, currently above Sydney Metro’s 1.8%. Vacancy rates have fluctuated greatly in the past 12months after hitting a low of in 0.0% August 2025, due tothe extremely small size of the Gundagai¥ rental market. Furthermore, a 2.6%vacancy rate is below the Real Estate Institution of Australia’s healthy benchmark of 3.0%, indicating quicker occupancy of rental properties in Gundagai¥. This creates a conducive and sustainable environment for investors, even with a higher median house sale price in Q4 2025.
RENTAL VACANCY RATES 2025

Gundagai (2722)
Cootamundra-Gundagai LGA

RENTAL YIELD 2025§
Gundagai (2722)¥

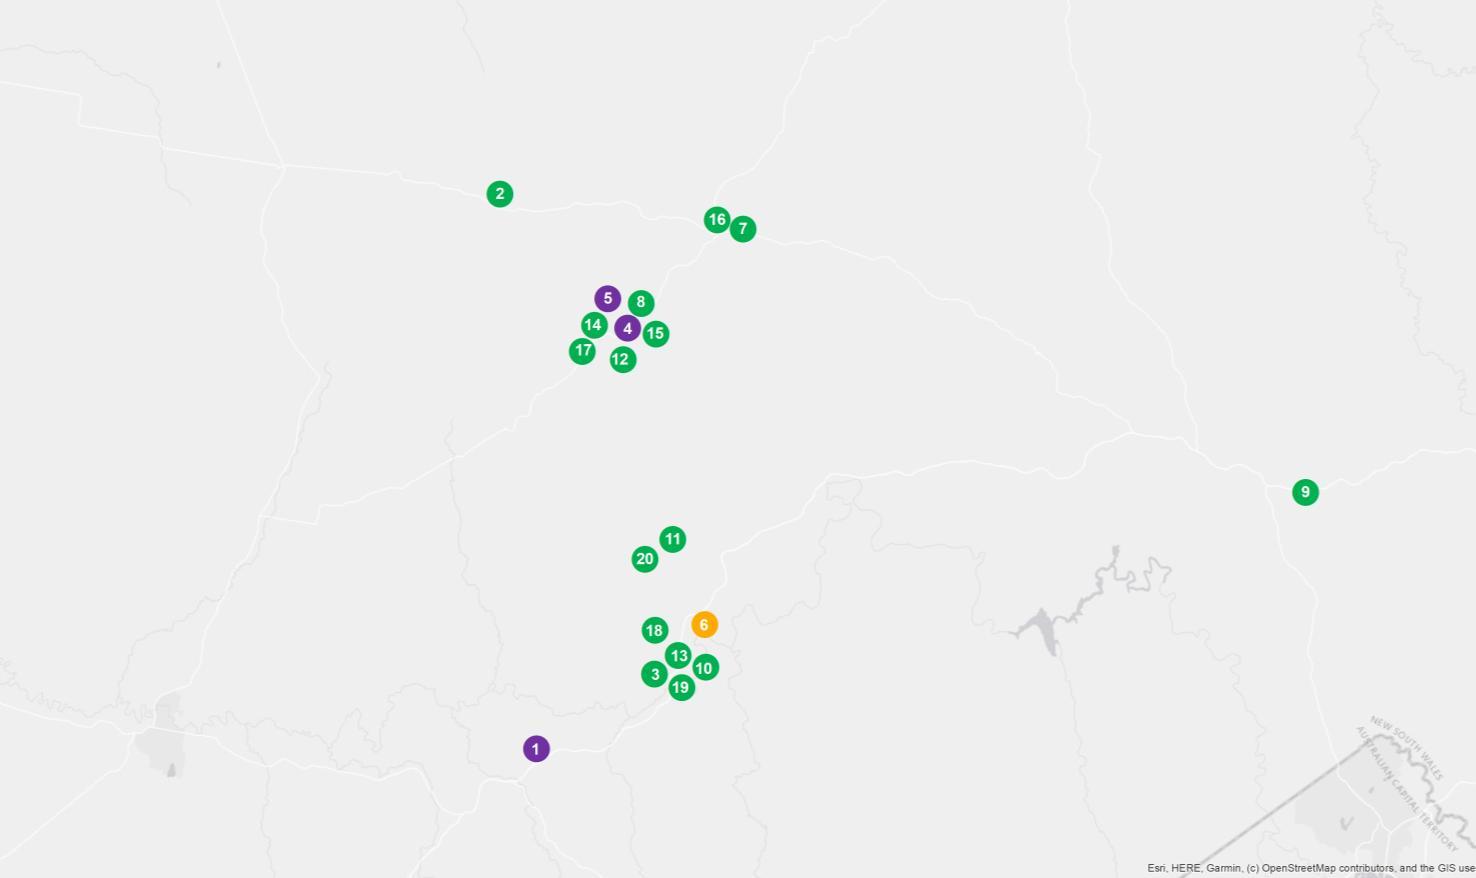
PROJECT DEVELOPMENT MAP 2022-2026 ₳

GUNDAGAI

RESEARCH SERVICES
Our research services span over every suburb, LGA,and state within Australia; captured in a variety of standard and customised products, andinclude:
• Advisory and consultancy
• Market analysis including profiling and trends
• Primary qualitative and quantitative research
• Demographic and target market analysis
• Geographic information mapping
• Project analysis including product and pricing recommendations
• Rental and investment return analysis


OUR KNOWLEDGE
Access to accurate and objective research is the foundation of all good property decisions.
OUR PEOPLE
Our research team is made up of highly qualified researchers who focus solely on propertyanalysis.






REFERENCES
* Gundagai sales market data and key indicators encapsulates aggregate property market conditions within the postcode of 2722.
** Estimated values are based on construction value provided by the relevant data authority and does not reflect commercial and/or re-sale value.
# 2025 encapsulates sales transactions for the 2025 full year (01/01/2025 – 31/12/2025).
€ Annual rental growth is a comparison between Q4 2024 (01/10/2024 – 31/12/2024) and Q4 2025 (01/10/2025 – 31/12/2025) house median rent figures.
¥ Gundagai rental market data encapsulates aggregate property conditions within the postcode of 4220.
§ Rental yields shown are as reported as of December 2025.
₳ Project development map showcases a sample of upcoming projects only, due to accuracy of addresses provided by the data provider for geocoding purposes.
£ Projects refers to the top developments within the Cootamundra-Gundagai Local Government Area (LGA).
µ Estimated value is the value of construction costs provided by relevant data authority, it does not reflect the project’s sale/commercial value.
ψ Commencement date quoted for each project is an approximate only, as provided by the relevant data authority, PRD does not hold any liability to the exact date.
Source: APM Pricefinder, Cordell Connect database, SQM Research, Esri ArcGIS.
Disclaimer: PRD does not give any warranty in relation to the accuracy of the information contained in this report. If you intend to rely upon the information contained herein, you must take note that the information, figures and projections have been provided by various sources and have not been verified by us. We have no belief one way or the other in relation to the accuracy of such information, figures and projections. PRD will not be liable for any loss or damage resulting from any statement, figure, calculation or any other information that you rely upon that is contained in the material.
Prepared by PRD Research. © All medians and volumes are calculated by PRD Research. Use with written permission only. All other responsibilities disclaimed. © Copyright PRD 2026.