Gold Coast City Council Market Update 2 nd H a l f 2 0 2 6 Gold Coast City Council
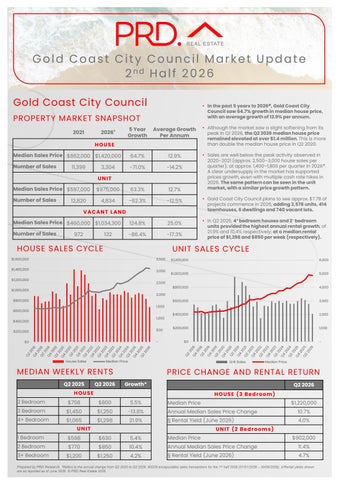
• In the past 5 years to 2026#, Gold Coast City Council saw 64.7% growth in median house price, with an average growth of 12.9% per annum.
PROPERTY MARKET SNAPSHOT 5 Year Growth
Average Growth Per Annum
• Although the market saw a slight softening from its peak in Q1 2026, the Q2 2026 median house price remained elevated at over $1.4 million. This is more than double the median house price in Q2 2020.
Median Sales Price $862,000 $1,420,000
64.7%
12.9%
Number of Sales
-71.0%
-14.2%
$975,000
63.3%
12.7%
• Sales are well below the peak activity observed in 2020–2021 (approx. 2,500–3,000 house sales per quarter); at approx. 1,400–1,800 per quarter in 2026#. A clear undersupply in the market has supported prices growth, even with multiple cash rate hikes in 2026. The same pattern can be seen in the unit market, with a similar price growth pattern.
4,834
-62.3%
-12.5%
• Gold Coast City Council plans to see approx. $7.7B of projects commence in 2026, adding 3,578 units, 414 townhouses, 6 dwellings and 740 vacant lots.
Median Sales Price $460,000 $1,034,300
124.8%
25.0%
Number of Sales
-86.4%
-17.3%
• In Q2 2026, 4+ bedroom houses and 2- bedroom units provided the highest annual rental growth, of 21.9% and 10.4% respectively; at a median rental price of $1,298 and $850 per week (respectively).
2021
2026# HOUSE
11,399
3,304 UNIT
Median Sales Price $597,000 Number of Sales
12,820
VACANT LAND
972
132
HOUSE SALES CYCLE
UNIT SALES CYCLE
$1,600,000
3,500
$1,400,000
3,000
$1,200,000
2,500
$1,000,000
$1,200,000
6,000
$1,000,000
5,000
$800,000
4,000
$600,000
3,000
$400,000
2,000
$200,000
1,000
2,000
$800,000 1,500
$600,000
1,000
$400,000
500
$200,000 $0
-
House Sales
Median Price
Q2 2026
-
Unit Sales
MEDIAN WEEKLY RENTS Q2 2025
$0
Median Price
PRICE CHANGE AND RENTAL RETURN Growth*
Q2 2026
HOUSE
H O U S E ( 3 Be d r o o m)
2 Bedroom
$758
$800
5.5%
Median Price
3 Bedroom
$1,450
$1,250
-13.8%
Annual Median Sales Price Change
10.7%
4+ Bedroom
$1,065
$1,298
21.9%
§ Rental Yield (June 2026)
4.0%
UNIT
$1,220,000
U NI T ( 2 Be d r o o ms )
1 Bedroom
$598
$630
5.4%
Median Price
2 Bedroom
$770
$850
10.4%
Annual Median Sales Price Change
11.4%
3+ Bedroom
$1,200
$1,250
4.2%
§ Rental Yield (June 2026)
4.7%
$902,000
Prepared by PRD Research. *Refers to the annual change from Q2 2025 to Q2 2026. #2026 encapsulates sales transactions for the 1st half 2026 (01/01/2026 – 30/06/2026).§Rental yields shown are as reported as of June 2026. © PRD Real Estate 2026.
Tweed Shire Council Market Update 2 nd H a l f 2 0 2 6 Tweed Shire Council
• In the past 5 years to 2025, Tweed Shire Council recorded a 42.0% growth in median house price, or an average annual growth of 8.4%.
PROPERTY MARKET SNAPSHOT 2021
5 Year Average Growth Growth Per Annum
2026# HOUSE
Median Sales Price $920,000 Number of Sales
$1,306,250
42.0%
8.4%
628
-66.8%
-13.4%
$900,000
50.0%
10.0%
657
-50.8%
-10.2%
$798,400
45.2%
9.0%
104
-52.7%
-10.5%
1,891
• Total sales declined for both houses (-24.6% to 270 sales) and units (-13.9% to 304 sales) in Q2 2026. This confirms a clear undersupply in houses and units.
UNIT Median Sales Price $600,000 Number of Sales
1,336
• Tweed Shire LGA will see approx. $211.8M projects in the 2026 pipeline. This will add 210 units only, with no townhouses, dwellings or lots. This is not enough when compared to 628 house sales and 657 unit sales in the 1st half of 2026 alone. Thus, a recovery in property prices is highly likely.
VACANT LAND Median Sales Price $550,000 Number of Sales
220
HOUSE SALES CYCLE
• The Q2 2026 median price has softened slightly from its Q1 2026 peak for both houses ($1.36M) and units ($920K). However, this is an annual growth of 4.5% and 8.4%, respectively; which suggests a highly resilient market despite higher interest rates in 2026.
• 3- bedroom houses and 1-bedroom units recorded the highest annual rental price growth, of 6.8% and 10.6% respectively; at $908 and $520 per week.
UNIT SALES CYCLE
$1,600,000
600
$1,400,000
500
$1,200,000 400
$1,000,000
$1,000,000
450
$900,000
400
$800,000
350
$700,000
300
$600,000
$800,000
300
250
$500,000
200
$400,000
$600,000
200
$400,000 100
$200,000 $0
0
House Sales
Q2 2026
100
$200,000
$100,000
50
$0
0
Median Price
Unit Sales
MEDIAN WEEKLY RENTS Q2 2025
150
$300,000
Median Price
PRICE CHANGE AND RENTAL RETURN Growth*
Q2 2026
HOUSE
H O U S E ( 3 Be d r o o m)
2 Bedroom
$700
$700
0.0%
Median Price
3 Bedroom
$850
$908
6.8%
Annual Median Sales Price Change
7.1%
4+ Bedroom
$1,125
$1,150
2.2%
§ Rental Yield (June 2026)
3.8%
UNIT
$1,205,000
U NI T ( 2 Be d r o o ms )
1 Bedroom
$470
$520
10.6%
Median Price
2 Bedroom
$700
$740
5.7%
Annual Median Sales Price Change
5.1%
3+ Bedroom
$850
$850
0.0%
§ Rental Yield (June 2026)
5.6%
$841,000
Prepared by PRD Research. *Refers to the annual change from Q2 2025 to Q2 2026. #2026 encapsulates sales transactions for the 1st half 2026 (01/01/2026 – 30/06/2026).§Rental yields shown are as reported as of June 2026. © PRD Real Estate 2026.