Derwent Valley Market Update 1 st H a l f 2 0 2 6
FUTURE DEVELOPMENTS
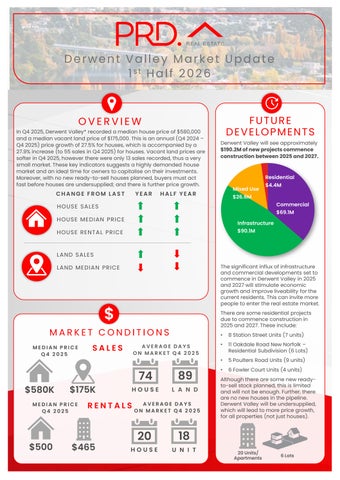
OVERVIEW
In Q4 2025, Derwent Valley* recorded a median house price of $580,000 and a median vacant land price of $175,000. This is an annual (Q4 2024 – Q4 2025) price growth of 27.5% for houses, which is accompanied by a 27.9% increase (to 55 sales in Q4 2025) for houses. Vacant land prices are softer in Q4 2025, however there were only 13 sales recorded, thus a very small market. These key indicators suggests a highly demanded house market and an ideal time for owners to capitalise on their investments. Moreover, with no new ready-to-sell houses planned, buyers must act fast before houses are undersupplied; and there is further price growth.
CHANGE FROM LAST
YEAR
Derwent Valley will see approximately $190.2M of new projects commence construction between 2025 and 2027.
Residential Mixed Use
HALF YEAR
$4.4M
$26.6M Commercial
HOUSE SALE S
$69.1M
HOUSE ME DIAN PRICE
Infrastructure $90.1M
HOUSE RE NTAL PRICE
LAND SALE S The significant influx of infrastructure and commercial developments set to commence in Derwent Valley in 2025 and 2027 will stimulate economic growth and improve liveability for the current residents. This can invite more people to enter the real estate market.
LAND ME DIAN PRICE
$
There are some residential projects due to commence construction in 2025 and 2027. These include:
MARKET CONDITIONS MEDIAN PRICE Q4 2025
$580K
$175K
MEDIAN PRICE Q4 2025
$500
SALES
AVERAGE DAYS ON MARKET Q4 2025
74
89
HOUSE
L A N D
RENTALS
$465
AVERAGE DAYS ON MARKET Q4 2025
20
18
HOUSE
U N I T
•
8 Station Street Units (7 units)
•
11 Oakdale Road New Norfolk – Residential Subdivision (6 Lots)
•
5 Poulters Road Units (9 units)
•
6 Fowler Court Units (4 units)
Although there are some new readyto-sell stock planned, this is limited and will not be enough. Further, there are no new houses in the pipeline. Derwent Valley will be undersupplied, which will lead to more price growth, for all properties (not just houses).
20 Units/ Apartments
6 Lots