
PRD Coolangatta Market Update 1st Half 2026

Page 1


Coolangatta Market Update

1st Half 2026

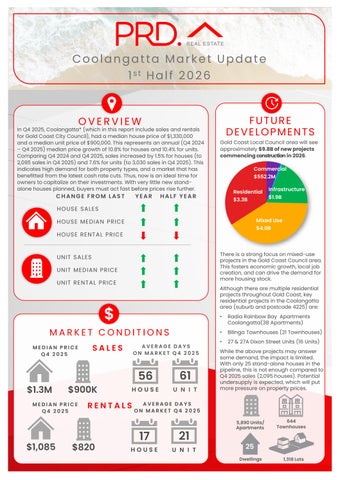
In Q4 2025, Coolangatta* (which in this report include sales and rentals for Gold Coast City Council), had a median house price of $1,330,000 and a median unit price of $900,000.This represents an annual (Q4 2024 – Q4 2025)median price growth of 10.8% forhouses and 10.4% for units. Comparing Q4 2024and Q4 2025,sales increased by 1.5% for houses (to 2,095sales in Q4 2025)and 7.6%for units (to 3,030sales in Q4 2025). This indicates high demand for bothproperty types, and a market that has benefitted from the latest cash rate cuts. Thus,now is anideal time for owners tocapitalize ontheir investments. With very little new standalone houses planned, buyers must act fast before prices rise further.

FROM LAST

HOUSE SALES

MEDIAN PRICE HOUSE RENTAL PRICE

Gold Coast Local Council area will see approximately$9.8Bofnewprojects commencingconstructionin2026.

HALF YEAR

MEDIAN PRICE Q4 2025 MEDIAN PRICE Q4 2025

AVERAGE DAYS ON MARKET Q4 2025

56 $1.3M $900K

AVERAGE DAYS ON MARKET Q4 2025

17 21 $1,085

61 $820 HOUSE UNIT

There is a strong focus onmixed-use projects in the Gold Coast Council area. This fosters economic growth, local job creation, and can drive the demand for more housing stock.

Although there are multiple residential projects throughout Gold Coast, key residential projects in the Coolangatta area (suburb and postcode 4225)are:

• Radia Rainbow Bay Apartments Coolangatta(38 Apartments)

• Bilinga Townhouses (21 Townhouses)

• 27& 27A Dixon Street Units (16 Units)

While the above projects may answer some demand, the impact is limited. With only 25stand-alone houses in the pipeline, this is notenough compared to Q4 2025sales (2,095houses). Potential undersupply is expected, which will put more pressure onproperty prices.

AVERAGE VENDOR DISCOUNT*

Average vendor discount reflects the average percentage difference between the first list price and final sold price. A lower percentage difference (closer to 0.0%) suggests that buyers are willing to purchase close to the first asking price of a property.

Average vendor discounts between Q4 2024and Q4 2025 have tightened to -0.5% forhouses and -0.3% for units. The Coolangatta* market still favourbuyers, as owners are willing to accept slightly below the first list price. That said, by Q4 2025 the average vendor discount is nearly 0%, indicating a shift towards a seller’s market. With limited new housing supply planned, buyers must act fast.

The suburb of Coolangatta has outperformed the Gold Coast Local Government Area (LGA) in bothhouse and unit prices for the past 5 years. This continued in 2025# , with median house price in Coolangatta increasing even further, establishing itself as a premium market. There is slower price growth for units, in good news forbuyers.

The dominant proportion of homes sold in Coolangatta* in 2025were in the premium price bracket, with 37.0% of houses sold above $1.8M and 30.5%of units sold above $1.2M.However, affordability remains, as 4.9%of houses sold were in the most affordable price point of less than $899,999and 12.3%of units sold at less than $599,999.This is good news for first-home buyers. Overall, there are homes available for buyers across various budget levels.

MARKET COMPARISON

Coolangatta (4225) House Gold Coast City (LGA) House Coolangatta (4225) Unit Gold Coast City (LGA) Unit

The market comparison graph provides a comparative trend for median price of houses and units over the past 5 years. The main LGA chosen was based on their proximity to the main suburb analysed, which is Coolangatta.

PRICE BREAKDOWN 2025

Less than $599,999

$600,000 to $799,999 $800,000 to $999,999 $1,000,000 to $1,199,999 $1,200,000 and above

RENTAL GROWTH 2025€

House rental yields in Coolangatta¥ (postcode 4225) were 3.1% as of December 2025, below Gold Goast Main (3.5%). Median house rental price has relatively stabilised in the past 12 months to Q4 2025,at $1,085per week, along with a 71.4%surge in the number of houses rented (to 12 houses in Q4 2025). A stable priced rental market is good news for renters, whilst a high number of houses rented presents anopportunity for investors to enter the market.

3-bedroom houses have provided investors with a significant +54.3%rental growth annually, achieving a median rent of $1,350per week.

Coolangatta¥ (postcode 4225) recorded a vacancy rate of 1.4% in December 2025,on par with Gold Coast Main (1.3%). Vacancy rates have increased in the past 12 months to December 2025, due to investors re-entering the market. However, a 1.4%vacancy rate is still well below the Real Estate Institution of Australia’s healthy benchmark of 3.0%, suggesting quicker occupancy of rental homes in Coolangatta¥ (postcode 4225). This confirms a conducive environment for investors, even with a higher median house and unit sales price (thus, entry price) in Q4 2025.

RENTAL VACANCY RATES 2025

Coolangatta (4225) Tweed Shire LGA Gold Coast Main REIA 'Healthy' Benchmark

RENTAL YIELD 2025§

Coolangatta¥ (Postcode4225)

PROJECT DEVELOPMENT MAP 2026 ₳

COOLANGATTA

1 Advanced Resource Recovery Centre Precinct Residual Waste ToEnergy Facility Development (State Government)

2 Lot 103Lake Orr Drive Mixed Use Development (Residential –multiple Apartments + Commercial)

3 14-20 Mary Avenue Apartments (112 Apartments)

4 Visy Glass Manufacturing & Recycling Plant Stapylton (Various Tenant Types)

5 Nalu Miami Apartments (46 Apartments)

6 Mariners Cove Marina & The Ritz-Carlton Hotel Mixed Use Development (Various Tenant Types)

7 3006-3016 Surfers Paradise Boulevard Mixed Use Development (Residential – 394 Apartments + Commercial)

8 Endless Surf Parkwood Redevelopment (Residential –234Units + Commercial)

9 Paradiso Place Surfers Paradise Mixed Use Development Stage 1 (Residential – 282 Apartments + Commercial)

10 Radia Rainbow Bay Apartments Coolangatta (38 Apartments)

11 2949-2957Surfers Paradise Boulevarde & 26 Vista Street Apartments (280Apartments)

12 Marina Mirage Main Beach Mixed Use Development - Marina Mirage Gold Coast (Residential – 92 Apartments + Commercial)

13 Harbour Cove Biggera Waters Apartments & Commercial Stages 1-4 (Residential – 511 Apartments +Commercial)

14 Sunlight Lifestyle Precinct Bundall Mixed Use Buildings Stages 1-3 (Residential –557Units + Commercial)

15 54 George Alexander Way Apartments & Townhouses Stages 1A2C (208Apartments + 10 Townhouses)

16 12-14 Hamilton Avenue Apartments (20 Apartments)

17 Masthead Apartments Main Beach (28 Units)

18 41 CoxRoad Townhouses Stages 1-3 (73Townhouses)

19 Foreshore Coomera Precinct BSubdivision Stages 5-11 (200Lots)

20 Skyridge Drive Dwellings (6 Dwellings)

13/07/2026

1/10/2026

9/12/2026

1/07/2026

$500,000,000 9/03/2026

24/07/2026

14/08/2026

6/10/2026

23/11/2026

1/10/2026

1/12/2026

1/10/2026

$160,000,000 12/11/2026

1/08/2026

$100,000,000 4/12/2026

$100,000,000 9/12/2026

4/08/2026

1/05/2026

$8,800,000 4/12/2026

$3,500,000 19/10/2026

RESEARCH SERVICES

Our research services span over every suburb, LGA,and state within Australia; captured in a variety of standard and customised products, andinclude:

• Advisory and consultancy

• Market analysis including profiling and trends

• Primary qualitative and quantitative research

• Demographic and target market analysis

• Geographic information mapping

• Project analysis including product and pricing recommendations

• Rental and investment return analysis

OUR KNOWLEDGE

Access to accurate and objective research is the foundation of all good property decisions.

OUR PEOPLE

Our research team is made up of highly qualified researchers who focus solely on propertyanalysis.

REFERENCES

* Coolangatta sales market data and key indicators encapsulates aggregate property market conditions within the Gold Coast Local Government Area.

** Estimated values are based on construction value provided by the relevant data authority and does not reflect commercial and/or re-sale value.

# 2025 encapsulates sales transactions for the full year 2025 (01/01/2025– 31/12/2025).

€ Annual rental growth is a comparison between Q4 2024 (01/10/2024 – 31/12/2024) and Q4 2025 (01/10/2025 – 31/12/2025) house median rent figures.

¥ Coolangatta rental market data encapsulates aggregate property conditions within the postcode of 4225.

§ Rental yields shown are as reported as of December 2025.

₳ Project development map showcases a sample of upcoming projects only, due to accuracy of addresses provided by the data provider for geocoding purposes.

£ Projects refers to the top developments within the Gold Coast Local Government Area.

µ Estimated value is the value of construction costs provided by relevant data authority, it does not reflect the project’s sale/commercial value.

ψ Commencement date quoted for each project is an approximate only, as provided by the relevant data authority, PRD does not hold any liability to the exact date.

Source: APM Pricefinder, Cordell Connect database, SQM Research, Esri ArcGIS.

Disclaimer: PRD does not give any warranty in relation to the accuracy of the information contained in this report. If you intend to rely upon the information contained herein, you must take note that the information, figures and projections have been provided by various sources and have not been verified by us. We have no belief one way or the other in relation to the accuracy of such information, figures and projections. PRD will not be liable for any loss or damage resulting from any statement, figure, calculation or any other information that you rely upon that is contained in the material.

Prepared by PRD Research. © All medians and volumes are calculated by PRD Research. Use with written permission only. All other responsibilities disclaimed. © Copyright PRD 2026.

Turn static files into dynamic content formats.

Create a flipbook