Clarence Market Update 2 nd H a l f 2 0 2 5
FUTURE DEVELOPMENTS
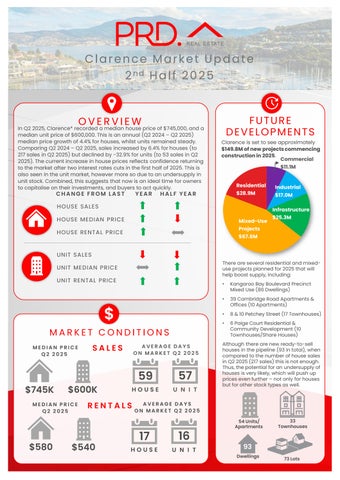
OVERVIEW
In Q2 2025, Clarence* recorded a median house price of $745,000, and a median unit price of $600,000. This is an annual (Q2 2024 – Q2 2025) median price growth of 4.4% for houses, whilst units remained steady. Comparing Q2 2024 – Q2 2025, sales increased by 6.4% for houses (to 217 sales in Q2 2025) but declined by -32.9% for units (to 53 sales in Q2 2025). The current increase in house prices reflects confidence returning to the market after two interest rates cuts in the first half of 2025. This is also seen in the unit market, however more so due to an undersupply in unit stock. Combined, this suggests that now is an ideal time for owners to capitalise on their investments, and buyers to act quickly.
CHANGE FROM LAST
YEAR
Clarence is set to see approximately $149.8M of new projects commencing construction in 2025. Commercial $11.1M Residential $28.9M
HALF YEAR
HOUSE SALE S
Industrial $17.0M Infrastructure
HOUSE ME DIAN PRICE
Mixed-Use
HOUSE RE NTAL PRICE
Projects $67.6M
$25.3M
UNIT SALE S There are several residential and mixeduse projects planned for 2025 that will help boost supply, including:
UNIT ME DIAN PRICE UNIT RE NTAL PRICE
$ MARKET CONDITIONS MEDIAN PRICE Q2 2025
$745K
$600K
MEDIAN PRICE Q2 2025
$580
SALES
AVERAGE DAYS ON MARKET Q2 2025
59
57
HOUSE
U N I T
RENTALS
$540
•
Kangaroo Bay Boulevard Precinct Mixed Use (86 Dwellings)
•
39 Cambridge Road Apartments & Offices (10 Apartments)
•
8 & 10 Petchey Street (17 Townhouses)
•
6 Paige Court Residential & Community Development (10 Townhouses/Share Houses)
Although there are new ready-to-sell houses in the pipeline (93 in total), when compared to the number of house sales in Q2 2025 (217 sales) this is not enough. Thus, the potential for an undersupply of houses is very likely, which will push up prices even further – not only for houses but for other stock types as well.
AVERAGE DAYS ON MARKET Q2 2025
17
16
HOUSE
U N I T
54 Units/ Apartments
33 Townhouses
93 Dwellings
73 Lots