Clarence Market Update 1 st H a l f 2 0 2 6
FUTURE DEVELOPMENTS
OVERVIEW
In Q4 2025, Clarence* recorded a median house price of $795,000, and a median unit price of $652,500. This is an annual (Q4 2024 – Q4 2025) price growth of 6.0% for houses and 9.7% for unit. House sales increased between Q4 2024 – Q4 2025, by 19.2% (to 261 sales in Q4 2025); however, softened for units, by -26.7% (to 55 sales in Q4 2025). Houses and units are highly demanded in Clarence*, and lower interest rates have helped stimulate price growth. Thus, now is an ideal opportunity for owners to capitalise on their investment, particularly for units. There are several residential projects planned in 2026; however, these will take time to build.
CHANGE FROM LAST
YEAR
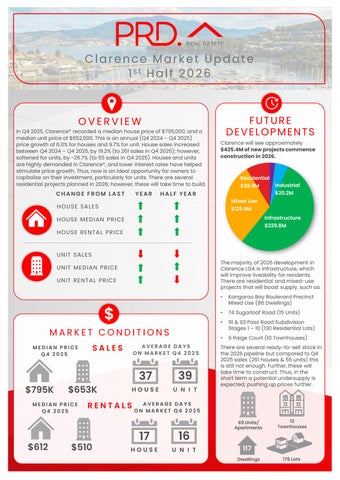
Clarence will see approximately $425.4M of new projects commence construction in 2026.
Residential $36.9M
Industrial $20.2M
HALF YEAR
Mixed Use
HOUSE SALE S
$129.9M Infrastructure
HOUSE ME DIAN PRICE
$229.8M
HOUSE RE NTAL PRICE
UNIT SALE S The majority of 2026 development in Clarence LGA is infrastructure, which will improve liveability for residents. There are residential and mixed-use projects that will boost supply, such as:
UNIT ME DIAN PRICE UNIT RE NTAL PRICE
$ MARKET CONDITIONS SALES
MEDIAN PRICE Q4 2025
$795K
$653K
MEDIAN PRICE Q4 2025
$612
AVERAGE DAYS ON MARKET Q4 2025
37
39
HOUSE
U N I T
RENTALS
$510
•
Kangaroo Bay Boulevard Precinct Mixed Use (86 Dwellings)
•
74 Sugarloaf Road (15 Units)
•
91 & 93 Pass Road Subdivision Stages 1 – 10 (130 Residential Lots)
•
6 Paige Court (10 Townhouses)
There are several ready-to-sell stock in the 2026 pipeline but compared to Q4 2025 sales (261 houses & 55 units) this is still not enough. Further, these will take time to construct. Thus, in the short term a potential undersupply is expected, pushing up prices further.
AVERAGE DAYS ON MARKET Q4 2025
17
16
HOUSE
U N I T
69 Units/ Apartments
13 Townhouses
117 Dwellings
176 Lots