Bungendore Market Update 1 st H a l f 2 0 2 6
FUTURE DEVELOPMENTS
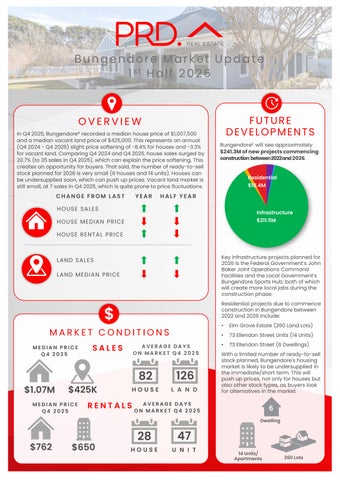
OVERVIEW In Q4 2025, Bungendore* recorded a median house price of $1,007,500 and a median vacant land price of $425,000. This represents an annual (Q4 2024 - Q4 2025) slight price softening of -8.4% for houses and -3.3% for vacant land. Comparing Q4 2024 and Q4 2025, house sales surged by 20.7% (to 35 sales in Q4 2025), which can explain the price softening. This creates an opportunity for buyers. That said, the number of ready-to-sell stock planned for 2026 is very small (6 houses and 14 units). Houses can be undersupplied soon, which can push up prices. Vacant land market is still small, at 7 sales in Q4 2025, which is quite prone to price fluctuations.
CHANGE FROM LAST
YEAR
Bungendore£ will see approximately $241.3M of new projects commencing construction between2022and 2026. Residential $18.4M
HALF YEAR
HOUSE SALE S
Infrastructure $211.5M
HOUSE ME DIAN PRICE HOUSE RE NTAL PRICE
Key infrastructure projects planned for 2026 is the Federal Government’s John Baker Joint Operations Command Facilities and the Local Government’s Bungendore Sports Hub; both of which will create more local jobs during the construction phase.
LAND SALE S LAND ME DIAN PRICE
Residential projects due to commence construction in Bungendore between 2022 and 2026 include:
$ MARKET CONDITIONS MEDIAN PRICE Q4 2025
$1.07M
SALES
$425K
MEDIAN PRICE Q4 2025
AVERAGE DAYS ON MARKET Q4 2025
82
126
HOUSE
L A N D
RENTALS
•
Elm Grove Estate (260 Land Lots)
•
73 Ellendon Street Units (14 Units)
•
73 Ellendon Street (6 Dwellings)
With a limited number of ready-to-sell stock planned, Bungendore's housing market is likely to be undersupplied in the immediate/short term. This will push up prices, not only for houses but also other stock types, as buyers look for alternatives in the market.
AVERAGE DAYS ON MARKET Q4 2025
6 Dwelling
$762
$650
28
47
HOUSE
U N I T
14 Units/ Apartments
260 Lots