Broome Market Update 1 st H a l f 2 0 2 6
OVERVIEW
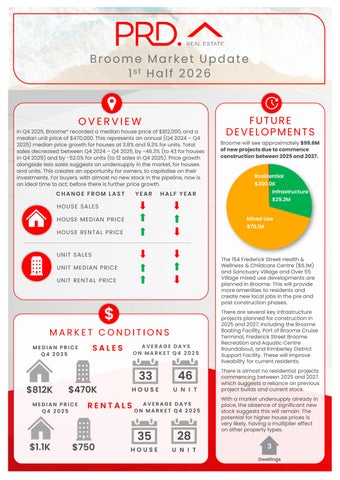
In Q4 2025, Broome* recorded a median house price of $812,000, and a median unit price of $470,000. This represents an annual (Q4 2024 – Q4 2025) median price growth for houses at 3.8% and 9.3% for units. Total sales decreased between Q4 2024 – Q4 2025, by -46.3% (to 43 for houses in Q4 2025) and by -52.0% for units (to 12 sales in Q4 2025). Price growth alongside less sales suggests an undersupply in the market, for houses and units. This creates an opportunity for owners, to capitalise on their investments. For buyers, with almost no new stock in the pipeline, now is an ideal time to act; before there is further price growth.
CHANGE FROM LAST
YEAR
FUTURE DEVELOPMENTS Broome will see approximately $99.6M of new projects due to commence construction between 2025 and 2027. Residential $300.0K Infrastructure
HALF YEAR
$29.2M
HOUSE SALE S
Mixed Use
HOUSE ME DIAN PRICE
$70.1M
HOUSE RE NTAL PRICE
UNIT SALE S
The 154 Frederick Street Health & Wellness & Childcare Centre ($6.1M) and Sanctuary Village and Over 55 Village mixed use developments are planned in Broome. This will provide more amenities to residents and create new local jobs in the pre and post construction phases.
UNIT ME DIAN PRICE UNIT RE NTAL PRICE
$ MARKET CONDITIONS MEDIAN PRICE Q4 2025
$812K
$470K
MEDIAN PRICE Q4 2025
$1.1K
SALES
AVERAGE DAYS ON MARKET Q4 2025
33
46
HOUSE
U N I T
R E N T A L S AVERAGE DAYS ON MARKET Q4 2025
$750
35
28
HOUSE
U N I T
There are several key infrastructure projects planned for construction in 2025 and 2027, including the Broome Boating Facility, Port of Broome Cruise Terminal, Frederick Street Broome Recreation and Aquatic Centre Roundabout, and Kimberley District Support Facility. These will improve liveability for current residents. There is almost no residential projects commencing between 2025 and 2027, which suggests a reliance on previous project builds and current stock. With a market undersupply already in place, the absence of significant new stock suggests this will remain. The potential for higher house prices is very likely, having a multiplier effect on other property types.
3 Dwellings