Brighton Market Update 1 st H a l f 2 0 2 6
FUTURE DEVELOPMENTS
OVERVIEW
In Q4 2025, Brighton* recorded a median house price of $625,500, and a median unit price of $530,000. This is an annual (Q4 2024 – Q4 2025) price growth of 4.3% for houses and by 2.4% for units. Sales decreased between Q4 2024 – Q4 2025, by -2.9% (to 68 for houses in Q4 2025) and by -40.0% for units (to 12 sales in Q4 2025). There is an undersupplied market for houses and units in Brighton*, and with lower interest rates this caused price growth. Thus, now is an ideal time for owners to capitalise on their investment. There are new houses and units planned for 2026, providing buyers with more choices. However, this will take time to build.
CHANGE FROM LAST
YEAR
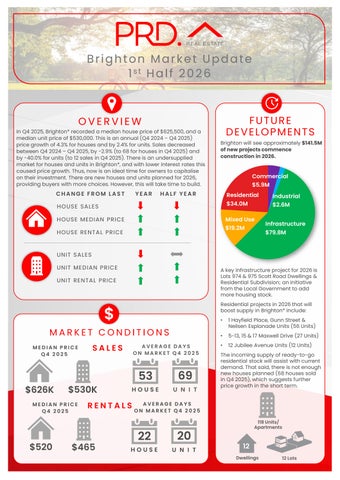
Brighton will see approximately $141.5M of new projects commence construction in 2026.
Commercial
$5.9M
HALF YEAR
Residential
HOUSE SALE S
$34.0M
HOUSE ME DIAN PRICE
Mixed Use
$2.6M
$19.2M
HOUSE RE NTAL PRICE
Industrial
Infrastructure $79.8M
UNIT SALE S UNIT ME DIAN PRICE
A key infrastructure project for 2026 is Lots 974 & 975 Scott Road Dwellings & Residential Subdivision; an initiative from the Local Government to add more housing stock.
UNIT RE NTAL PRICE
Residential projects in 2026 that will boost supply in Brighton* include:
$ MARKET CONDITIONS MEDIAN PRICE Q4 2025
$626K
$530K
MEDIAN PRICE Q4 2025
$520
SALES
AVERAGE DAYS ON MARKET Q4 2025
53
69
HOUSE
U N I T
RENTALS
$465
•
1 Hayfield Place, Gunn Street & Neilsen Esplanade Units (56 Units)
•
5-13, 15 & 17 Maxwell Drive (27 Units)
•
12 Jubilee Avenue Units (12 Units)
The incoming supply of ready-to-go residential stock will assist with current demand. That said, there is not enough new houses planned (68 houses sold in Q4 2025), which suggests further price growth in the short term.
AVERAGE DAYS ON MARKET Q4 2025
22
20
HOUSE
U N I T
118 Units/ Apartments
12 Dwellings
12 Lots