Bendigo Market Update 1 st H a l f 2 0 2 6
FUTURE DEVELOPMENTS
OVERVIEW
In Q4 2025, Bendigo* recorded a median house price of $610,000 and a median unit price of $475,000. This represents an annual (Q4 2024 - Q4 2025) price growth of 5.2% for houses and 8.0% for units. Comparing Q4 2024 and Q4 2025, total sales increased by 14.1% (to 412 sales in Q4 2025) for houses, reflecting a highly demanded housing market. By contrast, unit sales declined by -19.4% (to 79 sales in Q4 2025), indicating an undersupplied unit market. Combined with lower interest rates, this has stimulated house and unit price growth. Now is an ideal time for owners to capitalize on their investments. There are several residential projects planned; however, this will take time to build. Thus, buyers must act fast.
CHANGE FROM LAST
YEAR
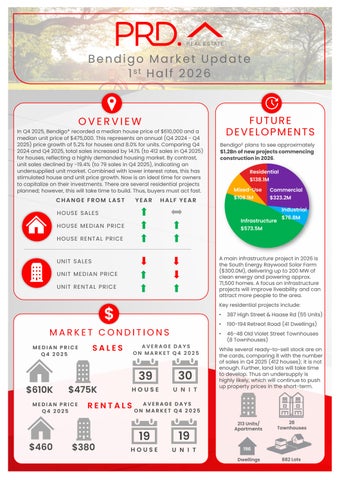
Bendigo£ plans to see approximately $1.2Bn of new projects commencing construction in 2026. Residential $138.1M
HALF YEAR
Mixed-Use
Commercial
$108.1M
$323.2M Industrial
HOUSE SALE S Infrastructure
HOUSE ME DIAN PRICE
$76.8M
$573.5M
HOUSE RE NTAL PRICE A main infrastructure project in 2026 is the South Energy Raywood Solar Farm ($300.0M), delivering up to 200 MW of clean energy and powering approx. 71,500 homes. A focus on infrastructure projects will improve liveability and can attract more people to the area.
UNIT SALE S UNIT ME DIAN PRICE UNIT RE NTAL PRICE
Key residential projects include:
$ MARKET CONDITIONS MEDIAN PRICE Q4 2025
$610K
$475K
MEDIAN PRICE Q4 2025
$460
SALES
AVERAGE DAYS ON MARKET Q4 2025
39
30
HOUSE
U N I T
RENTALS
$380
•
387 High Street & Haase Rd (55 Units)
•
190-194 Retreat Road (41 Dwellings)
•
46-48 Old Violet Street Townhouses (8 Townhouses)
While several ready-to-sell stock are on the cards, comparing it with the number of sales in Q4 2025 (412 houses); it is not enough. Further, land lots will take time to develop. Thus an undersupply is highly likely, which will continue to push up property prices in the short-term.
AVERAGE DAYS ON MARKET Q4 2025
19
19
HOUSE
U N I T
213 Units/ Apartments
28 Townhouses
196 Dwellings
882 Lots