Bayside Market Update 1 st H a l f 2 0 2 6
FUTURE DEVELOPMENTS
OVERVIEW
In Q1 2026, Bayside* recorded a median house price of $1,225,000 and a median unit price of $895,500. This represents an annual (Q1 2025 – Q1 2026) growth of 22.5% for houses and 15.9% for units. Comparing Q1 2025 and Q1 2026, total sales decreased by -33.9% for houses (to 168 sales in Q1 2026), and by -13.0% for units (to 47 sales in Q1 2026). This indicates a clear undersupply for both property types, which helped to support price growth despite multiple cash rate hikes in early 2026. Now is an ideal time for owners to capitalize on their investments. With limited new houses in the pipeline for 2026 the undersupply will deepen. Buyers need to act fast.
CHANGE FROM LAST
YEAR
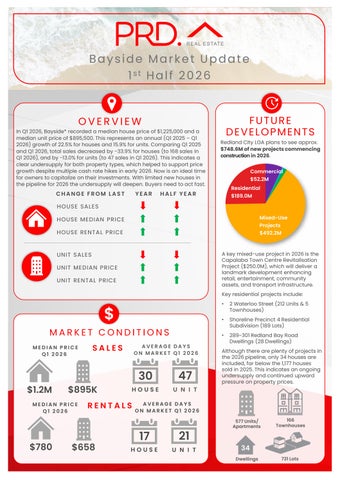
Redland City LGA plans to see approx. $748.6M of new projects commencing construction in 2026. Commercial
$52.2M Residential
HALF YEAR
$189.0M
HOUSE SALE S Mixed-Use
HOUSE ME DIAN PRICE
Projects $492.2M
HOUSE RE NTAL PRICE
A key mixed-use project in 2026 is the Capalaba Town Centre Revitalisation Project ($250.0M), which will deliver a landmark development enhancing retail, entertainment, community assets, and transport infrastructure.
UNIT SALE S UNIT ME DIAN PRICE UNIT RE NTAL PRICE
Key residential projects include:
$ MARKET CONDITIONS MEDIAN PRICE Q1 2026
$1.2M
$895K
MEDIAN PRICE Q1 2026
$780
SALES
AVERAGE DAYS ON MARKET Q1 2026
30
47
HOUSE
U N I T
RENTALS
$658
•
2 Waterloo Street (212 Units & 5 Townhouses)
•
Shoreline Precinct 4 Residential Subdivision (189 Lots)
•
289-301 Redland Bay Road Dwellings (28 Dwellings)
Although there are plenty of projects in the 2026 pipeline, only 34 houses are included, far below the 1,177 houses sold in 2025. This indicates an ongoing undersupply and continued upward pressure on property prices.
AVERAGE DAYS ON MARKET Q1 2026
17
21
HOUSE
U N I T
577 Units/ Apartments
166 Townhouses
34 Dwellings
731 Lots