Ashmore Market Update 1 st H a l f 2 0 2 6
FUTURE DEVELOPMENTS
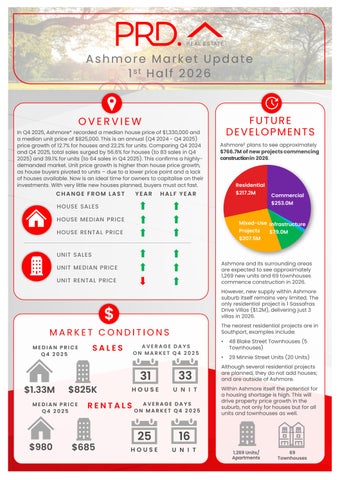
OVERVIEW In Q4 2025, Ashmore* recorded a median house price of $1,330,000 and a median unit price of $825,000. This is an annual (Q4 2024 - Q4 2025) price growth of 12.7% for houses and 22.2% for units. Comparing Q4 2024 and Q4 2025, total sales surged by 56.6% for houses (to 83 sales in Q4 2025) and 39.1% for units (to 64 sales in Q4 2025). This confirms a highlydemanded market. Unit price growth is higher than house price growth, as house buyers pivoted to units – due to a lower price point and a lack of houses available. Now is an ideal time for owners to capitalise on their investments. With very little new houses planned, buyers must act fast.
CHANGE FROM LAST
YEAR
Ashmore£ plans to see approximately $766.7M of new projects commencing construction in 2026.
Residential
$217.2M
HALF YEAR
Commercial $253.0M
HOUSE SALE S HOUSE ME DIAN PRICE
Mixed-Use Infrastructure Projects $207.5M
HOUSE RE NTAL PRICE
$79.0M
UNIT SALE S Ashmore and its surrounding areas are expected to see approximately 1,269 new units and 69 townhouses commence construction in 2026.
UNIT ME DIAN PRICE UNIT RE NTAL PRICE
However, new supply within Ashmore suburb itself remains very limited. The only residential project is 1 Sassafras Drive Villas ($1.2M), delivering just 3 villas in 2026.
$
The nearest residential projects are in Southport, examples include:
MARKET CONDITIONS MEDIAN PRICE Q4 2025
$1.33M
$825K
MEDIAN PRICE Q4 2025
$980
SALES
AVERAGE DAYS ON MARKET Q4 2025
31
33
HOUSE
U N I T
RENTALS
$685
AVERAGE DAYS ON MARKET Q4 2025
25
16
HOUSE
U N I T
•
48 Blake Street Townhouses (5 Townhouses)
•
29 Minnie Street Units (20 Units)
Although several residential projects are planned, they do not add houses; and are outside of Ashmore. Within Ashmore itself the potential for a housing shortage is high. This will drive property price growth in the suburb, not only for houses but for all units and townhouses as well.
1,269 Units/ Apartments
69 Townhouses