Albury Market Update 1 st H a l f 2 0 2 6
FUTURE DEVELOPMENTS
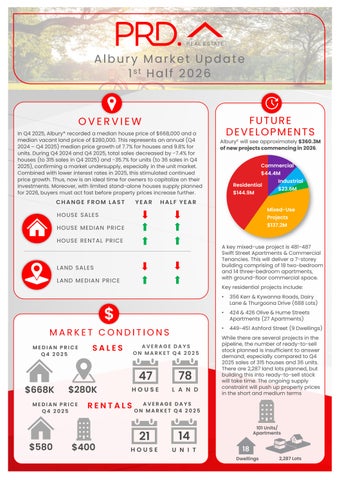
OVERVIEW In Q4 2025, Albury* recorded a median house price of $668,000 and a median vacant land price of $280,000. This represents an annual (Q4 2024 – Q4 2025) median price growth of 7.7% for houses and 9.8% for units. During Q4 2024 and Q4 2025, total sales decreased by -7.4% for houses (to 315 sales in Q4 2025) and -35.7% for units (to 36 sales in Q4 2025), confirming a market undersupply, especially in the unit market. Combined with lower interest rates in 2025, this stimulated continued price growth. Thus, now is an ideal time for owners to capitalize on their investments. Moreover, with limited stand-alone houses supply planned for 2026, buyers must act fast before property prices increase further.
CHANGE FROM LAST
YEAR
Albury£ will see approximately $360.3M of new projects commencing in 2026. Commercial $44.4M Residential $144.9M
HALF YEAR
Projects $137.2M
HOUSE ME DIAN PRICE HOUSE RE NTAL PRICE
A key mixed-use project is 481-487 Swift Street Apartments & Commercial Tenancies. This will deliver a 7-storey building comprising of 18 two-bedroom and 14 three-bedroom apartments, with ground-floor commercial space.
LAND SALE S LAND ME DIAN PRICE
Key residential projects include:
$ MARKET CONDITIONS
$668K
MEDIAN PRICE Q4 2025
$580
SALES
$280K
AVERAGE DAYS ON MARKET Q4 2025
47
78
HOUSE
L A N D
RENTALS
$400
$23.6M
Mixed-Use
HOUSE SALE S
MEDIAN PRICE Q4 2025
Industrial
•
356 Kerr & Kywanna Roads, Dairy Lane & Thurgoona Drive (688 Lots)
•
424 & 426 Olive & Hume Streets Apartments (27 Apartments)
•
449-451 Ashford Street (9 Dwellings)
While there are several projects in the pipeline, the number of ready-to-sell stock planned is insufficient to answer demand; especially compared to Q4 2025 sales of 315 houses and 36 units. There are 2,287 land lots planned, but building this into ready-to-sell stock will take time. The ongoing supply constraint will push up property prices in the short and medium terms
AVERAGE DAYS ON MARKET Q4 2025
21
14
HOUSE
U N I T
101 Units/ Apartments
18 Dwellings
2,287 Lots