Volume XXXVI - Issue III - September.,2026
Prof. Ailton de Souza Gomez Emeritus Professor, IMA/UFRJ
021 Pol, 2 B C 16 Preto Ouro th
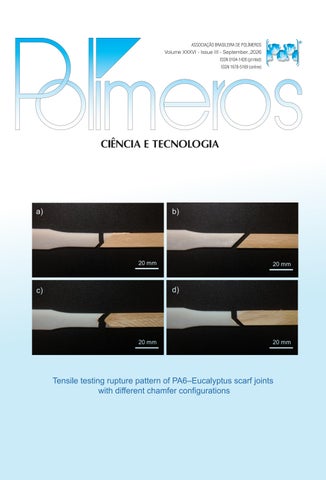
Tensile testing rupture pattern of PA6–Eucalyptus scarf joints with different chamfer configurations
19º CONGRESSO BRASILEIRO DE POLÍMEROS CIÊNCIA • TECNOLOGIA • INOVAÇÃO • CONEXÕES O principal evento científico da América Latina dedicado à ciência e tecnologia de polímeros, integrando academia, indústria e pesquisa em torno dos avanços e desafios dos materiais poliméricos.
24 -28
OUTUBRO
2027 CENTER CONVENTION UBERLÂNDIA, MG
Localização estratégica, excelente infraestrutura e a tradicional hospitalidade mineira para receber você no CBPol.
PROGRAME-SE E PARTICIPE!
Organização e Realização:
Associação Brasileira de Polímeros
Fundada em 1988
INSCRIÇÕES
SAIBA MAIS EM
a partir de 1º de fevereiro de 2027
www.cbpol.com.br
Apoio e Suporte:
ISSN 0104-1428 (printed) ISSN 1678-5169 (online)
P o l í m e r o s - I ss u e I I I - V o l u m e X X X V I - 2 0 2 6 I n d e x e d i n : “ C h e m ic a l A b s t r a c t s ” — “ RA P RA A b s t r a c t s ” — “ A l l - R u s s i a n I n s t i t u t e o f S ci e n c e a n d T e c h n ic a l I n f o r m a t i o n ” — “ L a t i n d e x ” — “ W e b o f S ci e n c e ”
Polímeros E d i t o r i a l C o u nci l
Editorial Committee
Edvani Curti Muniz (UFPI/DQUI; UEM/DQI)- President
Sebastião V. Canevarolo Jr. – Editor-in-Chief
Members
A ss o ci a t e E d i t o r s
Alain Dufresne (Grenoble INP/Pagora) Ana V. A. Machado Nóbrega (UMinho/DEP) Antonio Aprigio S. Curvelo (USP/IQSC) Artur José Monteiro Valente (UC/DQ) Bluma G. Soares (UFRJ/IMA) César Liberato Petzhold (UFRGS/IQ) Cristina T. Andrade (UFRJ/IQ) Daniela Becker (UDESC/DEM) Denise F. S. Petri (USP/IQ) Edson R. Simielli (Simielli - Soluções em Polímeros) Elias Hage Jr. (Retired – UFSCar/DEMa) Janaina S. Crespo (UCS/DEFQ) José Alexandrino de Sousa (Retired – UFSCar/DEMa) José António C. Gomes Covas (UMinho/IPC) José Carlos C. S. Pinto (UFRJ/COPPE) Júlio Harada (Harada Hajime Machado Consutoria Ltda) Luiz Antonio Pessan (UFSCar/DEMa) Luiz Henrique C. Mattoso (EMBRAPA) Marco Aurelio De Paoli (UNICAMP/IQ) María del Mar Orta Cuevas (US/QA) Nikos Hadjikristidis (KAUST/ PSE) Paula Moldenaers (KU Leuven/CIT) Roberto Pantani, (UNISA/DIIn) Rodrigo Lambert Oréfice (UFMG/DEMET) Sandra A. Cruz (UFSCar/DQ) Sebastião V. Canevarolo Jr. (Retired – UFSCar/DEMa) Silvio Manrich (Retired – UFSCar/DEMa) You-Lo Hsieh (UC Davis/BAE)
Alain Dufresne Artur José Monteiro Valente Bluma G. Soares César Liberato Petzhold José António C. Gomes Covas José Carlos C. S. Pinto Paula Moldenaers Roberto Pantani Rodrigo Lambert Oréfice
In memoriam Aliton S. Gomes (UFRJ/IMA) Richard G. Weiss (Georgetown University/Chemistry)
D e s k t o p P u b l is h in g
www.editoracubo.com.br
“Polímeros” is a publication of the Associação Brasileira de Polímeros São Paulo 994 St. São Carlos, SP, Brazil, 13560-053 Phone: +55 16 3374-3949 emails: abpol@abpol.org.br / revista@abpol.org.br http://www.abpol.org.br Date of publication: September 2026
Financial support:
Available online at: www.scielo.br
Polímeros / Associação Brasileira de Polímeros. vol. 1, nº 1 (1991) -.São Carlos: ABPol, 1991Quarterly v. 36, nº 3 (September 2026) ISSN 0104-1428 ISSN 1678-5169 (electronic version)
Website of the “Polímeros”: www.revistapolimeros.org.br
1. Polímeros. l. Associação Brasileira de Polímeros. Polímeros, 36(3), 2026
E1
E E E E E E E E E E E E E E E E E E E E E E E E E E E E
I
Editorial Section News....................................................................................................................................................................................................E3 Agenda.................................................................................................................................................................................................E4 Funding Institutions.............................................................................................................................................................................E5
R e vi e w A r t ic l e
N
Polymer-based fluids for well workover: a comprehensive review Mário César de Siqueira Lima, Victoria Bezerra Romualdo, Waleska Rodrigues Pontes da Costa, Ruth Luna do Nascimento Gonçalves, Anna Carolina Amorim Costa, Laura Rafaela Cavalcanti de Oliveira, Karine Castro Nóbrega, Mirele Costa da Silva Farias, Renalle Cristina Alves de Medeiros Nascimento and Luciana Viana Amorim .................................................................................................................................................................. e20260029
O r i g in a l A r t ic l e
D
Effect of stacking sequence on banana-aramid hybrid laminate properties Ramachandran Natarajan, Ramamoorthi Rangasamy and Manickaraj Karuppusamy ....................................................... e20250088 Impact of different surfactants on chitosan/sodium alginate films reinforced with bergamot oil Aditya Gupta, Muhammad Jawad, Ahmed Al-Harrasi and Saurabh Bhatia, ......................................................................... e20260026 Harnessing natural monoterpenes: cold plasma polymerization of citronellol Erick Osvaldo Martínez-Ruiz, José Abraham González-López, Claudia Gabriela Cuellar-Gaona, María del Carmen Rodríguez-Aranda, Adán Reyes-Reyes, Juan Andrés Reyes-Reyes, Alejandra Ortiz-Dosal, María Esther Treviño-Martínez and María Guadalupe Neira-Velázquez ............................................................................... e20260027
E
Bacterial cellulose synthesized in Erythrina mulungu extract: structural and bioactive properties Girlaine Santos da Silva, Mariana Alves Henrique, Severino Alves Júnior and Glória Maria Vinhas .............................. e20260028 Effect of silica nanoparticles on systems based on polyethylene/offshore-recovered polyamide 11 blends Joyce Braga Camargo, Gisele Cristina Valle Iulianelli, Christine Rabello Nascimento and Ana Lúcia Nazareth da Silva, ........................................................................................................................................................ e20260030
X
Electrospun scaffolds loaded with Stryphnodendron adstringens extract and Melaleuca alternifolia oil Lailla Daiana Soltau Missio Pinheiro, Vinícius Rodrigues Oviedo, Daniela Tiepo Gomes, Lisiara Ouriques Carvalho, Liana da Silva Fernandes, Michele Rorato Sagrillo, Daniel Assumpção Bertuol and Luiz Fernando Rodrigues Jr. ....... e20260031 Green fabrication of superhydrophobic poly(furfuryl alcohol)-coated melamine sponge Thi Nhat Thang Nguyen, Huu Trung Nguyen, Thao Quynh Ngan Tran and Xuan Thang Cao ............................................ e20260032 HDPE/geopolymer composites with improved thermal and acoustic insulation for aerospace applications Eliziane Medeiros Santos, Ricardo Pondé Weber, Flávio James Humberto Tommasini Vieira Ramos and Maria de Fátima Vieira Marques .................................................................................................................................................... e20260033 Injection overmolded polyamide 6 - Eucalyptus joints Giovana Zanetini Zanchetta, Gean Henrique Marcatto de Oliveira, Matheus Furlan, Vinicius Fiocco Sciuti, Rodrigo Bresciani Canto, Sergio de Traglia Amancio-Filho and Leonardo Bresciani Canto ............................................. e20260034 Characterization, gas transport properties, and degradability potential of poly(lactic acid) membranesa Fernando Silva Dal Magro, Wendel Paulo Silvestre, Luis Rafael Bonetto and Camila Baldasso, ........................................ e20260035 Degradation of polychloroprene/natural rubber blend by photo-Fenton process. II-A solvent effect Adonilson Reis Freitas, Luciana Gaffo and Edvani Curti Muniz ............................................................................................ e20260036
E2
Polímeros, 36(3), 2026
NEW ADDITIVE SUPPORTS PFAS-FREE POLYMER PROCESSING IN POLYOLEFIN EXTRUSION APPLICATIONS
RAINDROP-INSPIRED EQUATION SET REVEALS POLYMER COATING MAKES IRON CORRODE FASTER YET FRACTURE LATER
AddWorks PPA 101 FG is a PFAS-free polymer processing aid (PPA) for polyolefin extrusion applications, based on this company’s proprietary organic material technology. In polyethylene (PE) blown and cast films, it solves melt fracture – commonly called sharkskin – and it prevents die build-up. For decades, fluoropolymer-based polymer processing aids have been the standard solution to these challenging production issues but tightening global PFAS regulations and even selective bans in certain regions and applications are the driving forces behind the emerging conventional fluoropolymer technology phase-out. AddWorks PPA 101 FG is suitable for LLDPE-based packaging, agricultural, and building and construction film applications among others. Unlike fluoropolymer-based PPAs, it contains no PFAS, no silicone, nor inorganic substances, it is non-hazardous and label-free, and holds broad food contact approvals under FDA, EFSA, Mercosur, China GB and Japanese regulations.Fluoropolymerbased polymer-processing aids have long been effective tools in PE film extrusion. The challenge is that they contain per- and polyfluoroalkyl substances (PFAS) – the so-called forever chemicals that are highly persistent in the environment and harmful to human, animal and plant life. Regulators across the EU, USA, and Asia are progressively restricting PFAS use across chemical sectors, and polymer additives are within scope. PE film converters supplying packaging markets face both PFAS restrictions on the additive itself and recyclability mandates under the EU Packaging and Packaging Waste Regulation (PPWR), which create additional incentives to eliminate PFAS from packaging film formulations.
5-year clinical trial in 1108 patients validates a new biodegradable stent strategy.
AddWorks PPA 101 FG is a 100% active fine-grain formulation with an approximate bulk density of 500–600 g/L. It lowers apparent shear stress at the extruder die wall, which raises the critical shear rate and allows higher output without melt fracture. Sharkskin removal typically begins 20 to 40 minutes after line start-up, depending on letdown ratio (LDR), resin type, film configuration, and process- and equipment parameters. At a 0.2% LDR, performance is near-equivalent to conventional fluoropolymer-based PPAs in critical shear rate testing. The product is thermally stable, with less than 0.5% weight loss below 280°C and less than 0.9% below 320°C. It can be incorporated via the host resin, as a concentrate, or via a masterbatch carrier. AddWorks PPA 101 FG typically works in Ziegler-Natta LLDPE as well as in more difficult to process metallocene LLDPE resins. And this in fully formulated film configurations without antagonistic effects with typical film co-additivation. — Clariant AG, Muttenz, Switzerland Source: Chemical Engineering – chemengonline.com
N
A key yet often overlooked factor in the unpredictable failure of degradable systems is “acquired” heterogeneity — a spatially and temporally evolving unevenness of degradation that emerges and aggravates during service, rather than originating from manufacturing defects. Controlling this inherent randomness is particularly critical for biodegradable implants, where corrodible metals offer the necessary strength but are susceptible to such unpredictable localized weakness. Inspired by the Poisson raindrop question in mathematics, Professor Jiandong Ding at Fudan University derived a set of equations for the spatiotemporal evolution of random degradation. The research team employed these equations to quantify the acquired corrosion heterogeneity of biodegradable metals with and without polymer coatings. They found that coating iron with polylactide (PLA) increases the corrosion rate by 3-fold but reduces the inhomogeneity by 4,000-fold in a blood-mimetic Hank’s solution, surprisingly leading to later device fracture despite faster degradation. The mechanism involves two synergistic effects: PLA hydrolysis creates an acidic microenvironment (pH~5.6) at the PLA-Fe interface, and the coating inhibits the deposition of a passive calcium-phosphorus layer on the iron surface. Together, these factors lower the energy barrier for pit nucleation, transforming corrosion from “few and deep” pits to “many and shallow” pits across the substrate. Mechanical tests revealed that despite greater corrosion mass loss, PLA-coated iron wires exhibited significantly higher ultimate strength and elongation at fracture than bare iron after 30 days of immersion. In cyclic fatigue tests, bare iron wires fractured at approximately 19,000 cycles, while PLA-coated wires withstood up to 40,000 cycles without fracture. Based on these fundamental findings, Ding’s research team at Fudan University in Shanghai collaborated with Fuwai Hospital in Beijing and Biotyx Medical (a subsidiary of Lifetech Scientific) in Shenzhen to develop a biodegradable metal–polymer composite stent with struts as thin as a strand of hair (< 70 μm total thickness). The stent’s safety and efficacy were validated through preclinical studies in porcine models, clinical trials involving 1,108 patients across multiple cohorts, and 5-year follow-up of all 45 first-in-human (FIH) cases. Core clinical data show: 0 cardiac deaths, 0 target vessel myocardial infarctions, 5 clinically indicated target lesion revascularizations, a target lesion failure rate of 11.1%, and 0% stent thrombosis — outcomes that compare favorably with both the discontinued Absorb BVS and the gold-standard Xience stent. The theoretical framework and polymer coating strategy established in this study extend far beyond vascular stents. Any scenario where “acquired heterogeneity” arises from random spatiotemporal variability and affects system reliability — from ships and hydraulic structures to biological evolution and big data analytics — stands to benefit from the insights provided. Source: EurekAlert! – eurekalert.org
Polímeros, 36(3), 2026
E3
E
W
S
A
G
E
N
D
A
2026 September Global Polymer Summit Date: September 28–30, 2026 Location: Louisville, Kentucky, United States of America Website: gps2026.events.rubber.org International Conference on Next Horizons in Polymers: Beyond the past 50, toward the next 100 (IUPAC-PSK50) Date: September 28-October 1, 2026 Location: Busan, South Korea........................................................ Website: polymer.or.kr/conferenceintl/default
October Polymer-solvent Complexes and Intercalates (POLYSOLVAT-16) Date: October 6-9, 2026 Location: Tutzing, Germany Website: iffindico.fz-juelich.de/event/26/ 5th International Conference on Polymer Science and Engineering Date: October 7-9, 2026 Location: San Francisco, California, United States of America Website: polymers.unitedscientificgroup.org International Conference on Advanced Polymer Engineering and Applications (ICAPEA - 26) Date: October 8-9, 2026 Location: Vancouver, Canada Website: apste.net/conf/index.php?id=100865353 6th International Conference on Polymer Science & Composite Materials (ISTDPCM 2026) Date: October 15-16, 2026 Location: Dubai, United Arab Emirates Website: inovscitechconferences.com/2026/dubai/polymerscience XIX Latin American Symposium on Polymers and XVII Ibero-American Congress on Polymers - SLAP 2026 Date: October 19-23, 2026 Location: Salvador, Bahia, Brazil Website: slap2026.com.br 7th International Conference on Advanced Polymer Science and Engineering Date: October 26-28, 2026 Location: Madrid, Spain Website: polymersconference.yuktan.com Polymer Research & Engineering (PRE-2026) Date: October 26-28, 2026 Location: Las Vegas, Nevada, United States of America Website: polymerscienceconferences.com
November Fire Resistance in Plastics Date: November 3-4, 2026 Location: Düsseldorf, Germany Website: ami-events.com/event/097c9771-7499-4a0c-9bb0d857a4ea771f Innovations in Plastics Recycling & Sustainability Date: November 8–11, 2026 Location: Santa Rosa, California, United States of America Website: polyacs.org/2026polyiprs PLASTIMAGEN® MEXICO 2026 Date: November 10–13, 2026 Location: Mexico City, Mexico Website: plastimagen.com.mx/en/ 16th International Symposium on Ionic Polymerization (IP’26) Date: November 15-19, 2026 Location: Nadia, West Bengal, India Website: www.iiserkol.ac.in/~isip26 Bioplastics Brazil Date: November 16-17, 2026 Location: São Paulo, São Paulo, Brazil Website: www.bioplasticsbrazil.com/?lang=en POLY-CHAR 2026 Date: November 22-25, 2026
E4
Location: Chiang Mai, Thailand Website: fametu.com/polychar2026 15th World Congress on Biopolymers and Biomaterials Date: November 23-24, 2026 Location: Paris, France Website: biopolymerscongress.conferenceseries.com 3rd International Conference & Expo on Biopolymers, Polymer Science and Advanced Material (POLYMAT-2026) Date: November 26-28, 2026 Location: Munich, Germany Website: polymerscience.theinfiniteminds.net
December European Bioplastics Conference 2026 Date: December 1-2, 2026 Location: Berlin, Germany (Hybrid) Website:.european-bioplastics.org/events/ebc/ Polymer Engineering for Energy Date: December 1-2, 2026 Location: London, United Kingdom Website: ami-events.com/event/db799acb-6e78-46f4-9e3bd72992bb9495 PPS2026 – Asia/Australasia Regional Conference 2026 Date: December 1–4, 2026 Location: Phenikaa University, Duong Noi, Ha Noi, Viet Nam Website: pps2026.phenikaa-uni.edu.vn International Conference on Elastomers, Rubbers, and Industrial Polymers (ICERIP-26) Date: December 15-16, 2026 Location: Lisbon, Portugal (hybrid) Website: igaeglobal.com/conf/terms-conditions. php?id=100959729 2027 January 9th Global Summit on Polymer Chemistry Date: January 18-19, 2027 Location: Paris, France Website: polymerchemistry.annualcongress.com
March Plástico Brasil 2027 Date: March 16-19, 2027 Location: São Paulo, São Paulo, Brazil Website: plasticobrasil.com.br/en
May National Graduate Research Polymer Conference (NGRPC 2027) Date: May 3-5, 2027 Location: Gainesville, Florida, United States of America Website: sites.google.com/view/ngrpc2027/home
June Advances in Polyolefins (APO 27) Date: June 6-9, 2027 Location: Rohnert Park, California, United States of America Website: polyacs.org/2027-advances-in-polyolefins 42nd International Conference of the Polymer Processing Society (PPS-42) Date: June 15-19, 2027 Location: Chengdu, China Website: www.pps-42.com/En 7th Global Congress on Polymers, Plastics and Composites Date: June 23-24, 2027 Location: Paris, France (hybrid) Website: polymers-plastics.org October 19th Brazilian Polymer Conference (CBPol 2027) Date: October 24–28, 2027 Location: Uberlândia, Minas Gerais, Brazil Website: www.cbpol.com.br/?lang=en_US
Polímeros, 36(3), 2026
ABPol Associates Sponsoring Partners
Polímeros, 36(3), 2026
E5
ISSN 1678-5169 (Online)
https://doi.org/10.1590/0104-1428.20250094
Polymer-based fluids for well workover: a comprehensive review Mário César de Siqueira Lima1* , Victoria Bezerra Romualdo1 , Waleska Rodrigues Pontes da Costa1 , Ruth Luna do Nascimento Gonçalves1 , Anna Carolina Amorim Costa1 , Laura Rafaela Cavalcanti de Oliveira1 , Karine Castro Nóbrega1 , Mirele Costa da Silva Farias1 , Renalle Cristina Alves de Medeiros Nascimento2 and Luciana Viana Amorim1 Unidade Acadêmica de Engenharia de Petróleo, Laboratório de Pesquisa em Fluidos de Perfuração, Universidade Federal de Campina Grande, Campina Grande, PB, Brasil 2 Unidade Acadêmica do Cabo de Santo Agostinho, Universidade Federal Rural de Pernambuco, Cabo de Santo Agostinho, PE, Brasil
1
*mariocesar.slima@gmail.com
Abstract Polymeric fluids are widely applied in workover operations because of their ability to control well pressure, regulate filtrate loss, and preserve reservoir productivity. However, their performance is highly dependent on polymer stability, since degradation under thermal, mechanical, or chemical stresses can compromise rheology, weaken filtration control, and increase the risk of formation damage. Research since the 1970s has advanced toward developing improved formulations, aiming to enhance efficiency while reducing reservoir impairment. Laboratory characterization techniques have been essential in evaluating polymer degradation and fluid–rock interactions, generating insights for polymer selection and fluid design. Within this context, this study proposes a literature review on polymeric fluids in workover operations, with emphasis on the role of polymers in fluid formulation and performance. The review also addresses operational fundamentals and technical challenges, focusing on thermal stability, degradation mechanisms, and strategies to minimize formation damage through adequate formulation and characterization approaches. Keywords: polymeric fluids, well intervention, thermal stability, performance. Data Availability: All data supporting the findings of this study are included in this article and its supplementary materials. How to cite: Lima, M. C. S., Romualdo, V. B., Costa, W. R. P., Gonçalves, R. L. N., Costa, A. C. A., Oliveira, L. R. C., Nóbrega, K. C., Farias, M. C. S., Nascimento, R. C. A. M., & Amorim, L. V. (2026). Polymer-based fluids for well workover: a comprehensive review. Polímeros: Ciência e Tecnologia, 36(3), e20260029. https://doi.org/10.1590/0104-1428.20250094
1. Introduction Workover operations are performed throughout the productive life of a well for maintenance or technology updates. Although proper planning during construction reduces their frequency, periodic reviews remain essential to optimize production[1,2]. These operations include activities such as zone cleaning, scale removal, casing and artificial lift maintenance, and efficiency adjustments[2-5]. Workover duration is influenced by operational complexity, resource availability, weather conditions, and regulatory constraints, and can vary from one day to several months[6-8]. In subsea (offshore) wells, additional challenges demand specialized planning and support. These operations involve higher costs due to environmental complexity, specialized equipment, and logistics[9], and must also comply with strict environmental regulations[10]. Before intervention, the well must be placed in a safe condition. This is achieved by well killing, in which a workover fluid is pumped into the well to provide sufficient
Polímeros, 36(3), e20260029, 2026
hydrostatic pressure to counterbalance the reservoir pressure. As this fluid is pumped into the well, the existing wellbore fluids are displaced upward and circulated out of the well. In this way, workover fluids must control well pressures and filtrate loss while minimizing formation damage[11-13]. The most common workover fluids are brines, often enhanced with solids or polymers acting as viscosifiers and filtrate-control agents[11,14]. Among them, cellulose-based polymers such as hydroxyethyl cellulose (HEC) and carboxymethyl cellulose (CMC) stand out due to their performance and biodegradability[15-17]. In high-pressure and high-temperature (HPHT) wells, such as Brazil’s pre-salt fields, high temperature is a critical factor[18-20]. Polymers and additives must resist degradation to preserve performance, since thermal effects can reduce their efficiency in providing viscosity to the fluids and controlling filtrate[15,16,21].
1/11
R R R R R R R R R R R R R R
Lima, M. C. S., Romualdo, V. B., Costa, W. R. P., Gonçalves, R. L. N., Costa, A. C. A., Oliveira, L. R. C., Nóbrega, K. C., Farias, M. C. S., Nascimento, R. C. A. M., & Amorim, L. V. Since the 1970s, research has examined polymer-based workover fluids and concerns about formation damage[22,23]. With the growing relevance of HPHT interventions, issues of stability and durability have become more pressing, as degradation or viscosity loss can compromise fluid performance[15,17]. Recent studies have investigated PAC (polyanionic cellulose), a form of carboxymethyl cellulose (CMC) characterized by a high degree of substitution typically greater than 0.9, in well barrier formulations. In this range, the elevated degree of substitution enhances water solubility, hydration capacity, and viscosity, making PAC particularly relevant among the polymers commonly applied in high-performance workover fluids[16,22-25]. Given this context, this study reviews the use of polymeric fluids in workover operations, emphasizing their role in fluid formulation and performance. The review also addresses operational fundamentals and technical challenges, with focus on thermal stability, formation damage, and mitigation strategies.
2. Workover Operations Workover operations comprise interventions performed during the productive life of a well with the purpose of maintaining integrity, restoring productivity, or adapting the well to new operational conditions. These activities include scale or paraffin removal, cleaning of production zones, maintenance or replacement of completion equipment, and operational adjustments to improve performance[1-5]. The duration of workover operations varies according to the type of intervention, well configuration, availability of resources, and regulatory constraints, ranging from short-term activities to complex operations lasting several months[6-8]. In offshore wells, logistical limitations, higher operational costs, and stricter environmental regulations increase the complexity of planning and execution[9,10]. Prior to most workover activities, the well must be placed in a controlled condition through a well-killing procedure. This process involves circulating a specially designed fluid to provide sufficient hydrostatic pressure to balance reservoir pressure while displacing the fluids originally present in the wellbore. Under these conditions, workover fluids are essential to ensure pressure control and operational safety, while limiting fluid invasion and minimizing formation damage[11-13].
3. Workover Fluids Workover fluids are formulated to meet the specific requirements of the well and planned intervention, with functions that include controlling wellbore pressure, minimizing filtrate loss, and reducing formation damage[12]. The most common systems are brine-based fluids, which may be supplemented with minerals and polymers to enhance viscosity and filtrate control[11,14]. In this regard, cellulose-derived polymers, particularly hydroxyethyl cellulose (HEC) and carboxymethyl cellulose (CMC), are extensively utilized owing to their ability to provide efficient viscosity enhancement and fluid-loss control, while maintaining 2/11
good compatibility with reservoir conditions. Additionally, their water solubility, low toxicity, and susceptibility to biodegradation make them attractive from both operational and environmental perspectives[18]. During the design of workover fluids, attention must be given to the properties of the brine system employed. Ideally, brines should allow density adjustment over a broad range, be reusable, and contribute to shale inhibition. In addition, chemical compatibility between the brine and the formation rock is essential to avoid precipitation, scaling, or other adverse reactions. The compatibility of polymeric additives with the base fluid and formation is equally important, as inappropriate interactions may compromise fluid stability and overall performance[11,24]. In certain scenarios, particularly where wells are positioned in low-pressure zones, emulsion-based workover fluids emerge as a highly effective solution. These fluids consist of colloidal dispersions of water and oil, stabilized by surfactants. These formulations are suitable for such scenarios due to the presence of the oil phase, which results in a lower fluid density[1]. Since the 1970s, the use of polymers in workover fluid formulations has been studied. Lipton and Burnett[23] described the typical composition of these fluids, which combines a polymer solution containing polymers such as guar gum, HEC, and CMC with an inorganic salt. The polymers studied are ranked using the parameters of suspending ability (rheology), temperature/viscosity relationship, and stability to shear. According to those parameters, xanthan gum has presented the best performance. Eaton and Smitey[22] addressed formation damage as a critical concern in completion and workover operations. The authors investigated the reduction in formation permeability caused by different fluids and highlighted that fluid composition directly impacts the degree of damage. Backflow permeability tests revealed that fluid systems with low solid content or incorporating easily removable particles, such as acid-soluble materials, exhibited lower damage potential. In these systems, post-operation cleanup treatments, including acidizing, were effective in dissolving or dislodging the filter cake formed during operations, enabling partial recovery of formation permeability. The authors also compared various fluid systems and reported promising performance from newer formulations containing a complex lignosulfonate and sized calcium carbonate fluid loss additive, which resulted in minimal formation damage, with successful field applications documented. Scheuerman[26] contributed to the development of guidelines for using HEC polymer in solids-free completion and workover fluids. The author investigated the influence of different brines, including NaCl, CaCl2, CaBr2, and ZnBr2, in combination with the polymer. The results showed that fluids containing HEC exhibited similar rheological and filtration performance regardless of the brine employed, maintaining stability at temperatures up to 48.9 °C and pH values as low as 6. These findings demonstrate the feasibility of using HEC-based systems under moderate temperature conditions across a range of brine compositions. In the study conducted by Riley et al.[11], the importance of considering the compatibility between workover fluid Polímeros, 36(3), e20260029, 2026
Polymer-based fluids for well workover: a comprehensive review and formation lithology was emphasized. The researchers highlighted the risk of calcium carbonate precipitation when brines containing Ca2+ are used in workover fluid formulations for carbonate formations, since this cation reacts with the CO32− anion from formation waters. This reaction leads to scale formation, which can obstruct the pores and channels of the formation, causing severe damage. Thomas[21] investigated the thermal degradation of polymer-based fluids, considering the influence of temperature and exposure time. Fluid samples containing polymers, including CMC, were subjected to temperatures ranging from 37.8 °C to 232.2 °C. The half-life, defined as the time required for 50% degradation of the sample mass, was recorded for each condition. The results indicated that half-lives ranged from approximately 2 minutes to up to 95.2 years, the latter being estimated by extrapolation of the experimental data at lower temperatures. This highlights the significant influence of temperature on the degradation process of polymer-based fluids, underscoring the need to consider thermal effects in fluid formulation and application. Ezzat et al.[27] examined the vulnerability of polymers in workover fluids to microbial degradation, emphasizing that microorganisms can metabolize polymer chains as a nutrient source. Such degradation alters the polymer structure, leading to the loss of rheological properties and filtrate control, while also contributing to operational issues like corrosion, H2S generation, and reservoir acidification. To address these risks, the authors stressed the incorporation of biocides as essential to protect polymer stability and maintain fluid performance. Vollmer and Alleman[24] analyzed the limitations of using HEC as a viscosifier and filtrate controller in workover fluids, comparing its performance with a “New Polymer” selected from ten candidates. The study employed ceramic disks as porous media to simulate formation permeability during progressive filtration tests. Formation damage was evaluated by measuring permeability before and after fluid saturation. The results showed a significant reduction in permeability for samples exposed to HEC, ranging from 65.7% to 79.0% of the initial permeability, whereas the new polymer exhibited lower permeability impairment under the same test conditions. The permeability reduction associated with HEC was attributed to formation damage at temperatures above 65 °C, particularly in the presence of NaCl or CaCl2 brines. Yang et al.[25] evaluated formation damage in sandstone reservoirs using a polymer-based workover fluid and porescale X-ray CT analysis. By saturating a rock plug with formation water and then injecting the fluid, the study revealed swelling of clay minerals and fines migration. Rather than proposing a specific fluid formulation, the authors adopted a diagnostic and mechanistic approach, emphasizing that polymeric workover fluids must be compatible with the formation and capable of inhibiting the swelling of expansive minerals to minimize damage during interventions. Recent studies have expanded the discussion on polymerbased fluids beyond classical workover formulations, focusing on strategies to minimize formation damage under well control conditions. Li et al.[28] developed a high-density completion and workover fluid to reduce precipitation and Polímeros, 36(3), e20260029, 2026
emulsification, showing good stability, adjustable density (1.10–1.55 g/cm3), low filtrate loss (10.5 mL/30 min), reduced formation damage (8.7%), and successful field applications. This highlights that, alongside polymer-based approaches, additives such as mutual solvents and emulsifiers can also enhance performance and mitigate formation damage. Complementarily, Lima et al.[29] investigated polymer-based well-killing fluids formulated with carboxymethyl cellulose (CMC) in a glycerin-containing system, highlighting the role of formulation design in controlling filtrate loss and preserving formation permeability. The study also compared formation damage from CMC and HPA starch, showing higher damage with HPA. Although focused on well-killing operations, the mechanisms are applicable to workover fluids. These studies emphasize polymer–formation compatibility and filtration control, while performance differences reflect reservoir conditions and formulation strategies.
3.1 Workover fluids properties The properties of workover fluids must be adjusted according to the needs of each well, so that the fluid exerts sufficient hydraulic pressure to withstand the pressure exerted by the formations, and has satisfactory rheological and filtration properties. Among the commonly analyzed properties, the following stand out: 3.1.1 Density Before designing a workover fluid, it is essential to define the operational window, delimited by pore pressure (minimum) and fracture pressure (maximum) of the formation, ensuring section integrity. The fluid density must generate a hydrostatic pressure within these limits[30]. For workover fluids, suspended solids are undesirable since static conditions may persist for days, increasing sedimentation risk and density gradients. Thus, inorganic salts are generally preferred to adjust density[1]. Several types of salts are used in brines, selected by solubility to achieve target densities without solid dispersion[11]. Monovalent salts (NaCl, KCl, NaBr, NaHCO2, KHCO2) yield densities from 8.4 to 11.0 lb/gal, whereas divalent salts (CaCl2, CaBr2, ZnBr2) or blends can reach 14.0–19.2 lb/gal[1]. Divalent brines also exhibit higher solubility, lower crystallization temperatures, and acidic pH, which should be corrected to alkaline to prevent corrosion and preserve polymers sensitive to acidity[1,31,32]. When brines alone are insufficient, solid weighting agents can be added in some cases. Barite (BaSO4) is common in drilling fluids due to density (4.25 g/cm3) and inertness[33], but under static conditions it settles, producing density gradients and operational risks such as sticking[34,35]. Sedimentation occurs faster in oil-based systems and more slowly in aqueous ones[34,35]. For this reason, barite is rarely recommended in workover formulations. Calcite (CaCO3) has been reported since the 1980s as a weighting and bridging agent[11]. With specific gravity of 2.71 g/cm3[36], it is less prone to settling than barite[37]. Micronized calcite (~2 µm) reduces sedimentation and improves rheology compared to coarser particles (~40 µm) 3/11
Lima, M. C. S., Romualdo, V. B., Costa, W. R. P., Gonçalves, R. L. N., Costa, A. C. A., Oliveira, L. R. C., Nóbrega, K. C., Farias, M. C. S., Nascimento, R. C. A. M., & Amorim, L. V. due to better dispersion[38], making it more suitable for workover systems. Another strategy involves incorporating glycerin into the liquid phase. With density of 1.26 g/cm3 (10.51 lb/gal), hydrophilicity, environmental compatibility, and favorable interaction with polymers, glycerin increases density while reducing formation damage, making it attractive for workover fluids[39,40]. For low-density applications in depleted zones, inverse emulsions (water-in-oil stabilized by surfactants) provide lower density than water-based systems[1]. Mardashov et al.[13] reported densities of 0.950–1.420 g/cm3 (7.93–11.85 lb/gal), enabling precise adjustment. However, their high cost (synthetic oils) and environmental risks, particularly offshore, restrict their use to cases where the advantages outweigh the drawbacks. 3.1.2 Filtration Once the fluid must exert sufficient hydrostatic pressure to prevent influx, its invasion into permeable formations is restricted by the development of a filter cake, which reduces permeability and fluid loss[41]. Filtration is predominantly static during intervention operations and is controlled by a progressive sealing mechanism in which larger particles initially bridge larger pore openings, initiating filtration control, while progressively smaller particles pass through remaining flow paths and complete the sealing process, resulting in a low-permeability filter cake[42]. When polymeric materials are used as sealing agents in workover fluids, they can act through different mechanisms. One involves the formation of a gel or viscous layer on the rock surface. As the workover fluid interacts with the formation, hydrated polymer particles adsorb onto the rock, forming a layer that helps seal the pores and reduce fluid loss[41,43]. Additionally, when solid particles are incorporated into polymer-based workover fluids, the polymeric gels aid in their retention and deposition at pore openings, creating a low-permeability structure. This structure acts as an additional physical barrier to control fluid loss and prevent unwanted migration within the formation[41,43]. 3.1.3 Rheology In the context of workover fluids, rheology control plays a fundamental role. This property is essential to ensure efficient fluid pumping in the well and adequate filtration control. Additionally, the workover fluid must be capable of keeping solid particles suspended in the fluid column while facilitating their transport and removal[44]. According to Guo et al.[2], in intervention operations, such as scale and paraffin removal, the fluid must efficiently dislodge and transport these materials. Polymer molecules dispersed in aqueous media enhance viscosity by forming structured networks through molecular interactions and aggregates[44]. Examples include xanthan gum, which adopts helix conformations to establish complex networks, as well as CMC, whose weakly bonded aggregates also contribute to viscosity enhancement[44,45]. These bonds are easily disrupted under shear, leading to temporary viscosity reduction that recovers once stress ceases, a behavior characteristic of non-Newtonian, pseudoplastic fluids[46]. 4/11
The addition of solid particles to polymeric solutions can increase viscosity due to polymer adsorption onto particle surfaces, improving particle suspension and fluid consistency. Ahmed & Belhadri[45] showed that calcite addition significantly increases the consistency index (K) in polymeric fluids described by the Herschel–Bulkley model, while Nguyen et al.[35] reported that smaller calcite particles exert a stronger effect on viscosity enhancement than larger ones. Polymer conformation and intermolecular interactions are influenced by concentration, pH, ionic strength, and temperature, directly affecting viscosity and network formation. Changes in rheological behavior may also indicate polymer degradation, potentially leading to precipitation, flocculation, or microgel formation, which can impair fluid performance and increase formation damage risk[46-48].
3.2 Polymeric additives To enhance the performance of workover fluids during well interventions, various additives can be used. These additives are selected based on the well requirements and can improve fluid performance, particularly in situations where the fluid remains static in the well for extended periods. When selecting polymers, it is important to consider their molecular structure as well as the required properties of the fluids under application conditions, especially in deep wells with high temperatures and pressures[46]. Additionally, it is essential to ensure that the choice of polymers meets environmental requirements[47]. In general, polymers used in the formulation of well fluids have high molecular weight and polar functional groups, which enable them to adsorb water molecules and increase fluid viscosity. This increased viscosity helps improve the transport and suspension of solid particles present in the fluid. Furthermore, these hydrated particles can deposit on the surface of rock formations, aiding in pore plugging and contributing to fluid loss control to the formation[48]. In polymer-based fluid preparation, pre-hydration is commonly applied, allowing the polymer to fully absorb water and reach optimal solubilization before the addition of brine and other components, resulting in the final formulation[21]. Polymers used in fluid systems may undergo degradation when exposed to high temperatures and pressures, particularly during prolonged operations, leading to changes in their chemical structure and rheological behavior. Therefore, the selection of thermally and chemically stable polymers is essential to minimize performance losses under well conditions[49]. In response to increasing environmental concerns, biopolymers derived from cellulose, starch, and xanthan gum have gained attention and demonstrated effectiveness in improving the rheological and filtration properties of oilfield fluids[15]. Polymeric additives are commonly marketed in powder form and may consist of mixtures of different polymers or combinations of polymers with inorganic materials[50]. Among the polymers used in workover fluid formulations or those with potential for such applications, some stand out due to their properties and associated challenges. In the 1970s, guar Polímeros, 36(3), e20260029, 2026
Polymer-based fluids for well workover: a comprehensive review gum (GG) was widely used in workover and completion fluids due to its non-ionic nature, making it compatible with a wide range of electrolyte concentrations[20]. However, high concentrations of multivalent salts can compromise its hydration, leading to gel formation that may cause formation damage[51]. Although guar gum is still used in completion fluids[52], it is more frequently applied today in hydraulic fracturing fluids, where the polymer and its derivatives play a fundamental role[51,53-56]. Xanthan gum (XG) is widely used as a viscosifier and filtrate controller in drilling, completion, and workover fluids due to its low formation damage potential. However, it is sensitive to high temperatures and contaminants, requiring stabilizers and strict control of fluid purity[57]. Above 100 °C, its molecular structure undergoes irreversible changes that drastically reduce viscosity, and at temperatures above 120 °C, shear stress approaches zero, indicating loss of functionality[58,59]. The polymer hydroxyethyl cellulose (HEC) has been widely used in completion fluid formulations since the 1970s and gained popularity in workover fluids during the 1980s[21]. The authors highlight the importance of pre-hydration techniques for certain high molecular weight polymers. This step allows for the efficient incorporation of HEC into high-density brines. Thus, HEC has emerged as a commonly employed fluid loss control agent in well intervention operations. The polymer HEC can be used in brines containing NaCl, NaBr, KCl, NH4Cl, CaCl2, and CaBr2 under a range of density and pH conditions and at moderate temperatures. Under typical oil well conditions, published data indicate that HEC causes minimal formation damage and provides predictable rheological behavior when properly prepared[44]. HEC presents some limitations regarding its use. Performance issues commonly addressed in studies focus on dispersibility, hydration rate, high-temperature rheology, and formation damage[21]. As observed by Hodge[48], increasing the temperature in HEC-formulated fluids can lead to polymer precipitation, especially when combined with NaCl or KCl brines at temperatures above 65.6°C. This precipitation can compromise the fluid’s rheological properties, negatively affecting its performance. Furthermore, it is widely recognized that the use of HEC gels can cause formation damage, such as fish eyes (unsolvated polymer particles), microgels, and viscous pore plugging in rock formations. Therefore, proper preparation and use of fluids containing HEC are crucial to minimizing or eliminating formation damage associated with its use[44]. The application of sodium carboxymethyl cellulose (CMC) as a drilling fluid additive is well-documented, particularly in combination with bentonite and calcite (CaCO3). This combination is reported in several studies highlighting its effectiveness in various fluids compositions[15,60-67]. Teymoori & Alaskari[68] also emphasize the superior performance of CMC over other alternatives, such as xanthan gum, in filtration control. Sodium CMC, in its high-degree substitution form (greater than 0.9), is widely known as polyanionic cellulose (PAC). This derivative has been extensively used in drilling fluids, particularly to enhance rheological and filtration Polímeros, 36(3), e20260029, 2026
properties[16,69-74]. Although specific evidence of its application in workover fluids is limited, PAC has been successfully employed as a filtrate reducer in drill-in fluids[75-77] and in completion fluids[78,79], systems designed to minimize formation damage. Pioneering studies, such as those by Lipton and Burnett[23] and Carico[69], highlighted the benefits of CMC in workover formulations, laying the foundation for its current relevance. More recently published investigations expanded the understanding of the potential of CMC derivatives, such as PAC, in optimized barrier formulations for temporary well abandonment[15,17]. Notably, Gonçalves et al.[17] emphasized that fluids based on PAC, when prepared with an optimized polymer content, can deliver satisfactory performance in controlling well pressures during temporary plug and abandonment operations. Importantly, this performance was maintained even when the polymer was hydrated in saline media to increase fluid density, without the addition of mineral solids. This outcome strengthens the evidence that PAC is not only viable for drilling and abandonment fluids, but also a highly promising polymeric base for workover formulations, where maintaining well control under severe conditions is equally critical.
4. Degradation of Polymeric Fluids Polymers used in workover fluids are susceptible to degradation, which can compromise fluid performance. Degradation occurs primarily due to exposure to high temperatures and the microbial activity.
4.1 Effect of temperature In deeper wells, such as offshore wells in Brazil’s pre-salt layer, high-pressure and high-temperature conditions are common challenges. These wells can reach depths of up to 5,000 meters, with typical static pressures of up to 50 MPa, following a pressure gradient close to 0.01 MPa/m. Additionally, due to the geothermal gradient, temperatures in these wells can exceed 120 °C[15,16]. As a result, well intervention operations under these conditions require workover fluids capable of withstanding such extreme environments. Thermal stability is a decisive factor in fluid selection, since rheological and filtration properties depend on the preservation of polymers and additives[16]. Polymer degradation reduces viscosity and compromises filtrate control, directly affecting operational efficiency[18]. As verified by Thomas[21], the thermal decomposition of polymers such as CMC is influenced by both temperature and exposure time. Mohamed et al.[18] found that CMC shows higher thermal resistance (149 °C) compared to GX (121 °C) and HEC (96–99 °C), with viscosity losses attributed to hydrolysis and oxidation. Recent studies reinforce this perspective. Costa et al.[15] investigated the degradation of a polymer-based fluid under different temperature conditions, showing that rheological properties and filtrate control were only compromised above 140 °C due to CMC degradation. The study is notable for applying accelerated life tests to estimate the fluid’s expected lifespan under operational conditions, providing 5/11
Lima, M. C. S., Romualdo, V. B., Costa, W. R. P., Gonçalves, R. L. N., Costa, A. C. A., Oliveira, L. R. C., Nóbrega, K. C., Farias, M. C. S., Nascimento, R. C. A. M., & Amorim, L. V. a methodological advance for the qualification of liquid barriers in temporary abandonment. Complementarily, Farias et al.[16] pointed out the correlation between rheology and thermal degradation of CMC solutions, indicating that viscosity loss precedes structural decomposition and directly affects filtration performance. Collectively, these findings demonstrate that the design of polymer-based workover fluids must take into account not only their initial performance but also their thermal stability over time, ensuring reliability in HPHT environments.
4.2 Microbial activity In the context of petroleum wells, the degradation of fluids formulated with natural polymers due to microbial activity is a significant concern. The polymers present in these fluids, such as GX, CMC, and HEC, can be degraded and utilized as nutrients by microorganisms, primarily bacteria, leading to contamination of reservoir zones near the wellbore[78,79]. Microbial growth can cause issues such as equipment and pipeline corrosion, as well as the release of hydrogen sulfide (H2S) and reservoir acidification. Additionally, extensive microbial proliferation leads to significant degradation of the polymers present in the fluid, resulting in the loss of their rheological properties and the ability to control fluid loss to the formation[79,80]. According to Al-Humam et al.[78], biocidal substances are added to fluids to combat microbial activity. However, the effectiveness of these agents may be limited. It is important to select biocides that are compatible with the fluid components, effective against target microorganisms, and stable under downhole conditions. Some examples of effective biocides include aldehydes, isothiazolone, and quaternary phosphonium salts. Maintaining an alkaline pH (typically between 9 and 11) is also an approach to mitigating microbial activity, as most microorganisms responsible for these issues do not thrive in environments with a pH above 9[77,80]. Therefore, the appropriate selection of biocides and pH control are essential to prevent microbiological damage, preserve the integrity of workover fluids, and ensure satisfactory performance during operations[81].
4.3 Material characterization techniques applied to polymer degradation in fluids The degradation of polymeric fluids can be assessed through a variety of material characterization techniques. These techniques, commonly employed in drilling fluids, can also provide valuable insights into the changes in the physical, chemical, and structural properties of polymers over time in workover fluids. Fourier Transform Infrared Spectroscopy (FTIR) is a technique that analyzes the interaction of molecules with infrared radiation. It can be used to identify functional groups present in polymers and to monitor changes in the chemical structure caused by degradation. By comparing spectra obtained before and after degradation, it is possible to identify the formation of new functional groups or the modification of existing ones[82]. 6/11
Thermogravimetric Analysis (TGA) measures the mass variation of a material as a function of temperature. In the context of polymeric fluid degradation, TGA provides information on the thermal stability of polymers and identifies the temperature ranges in which degradation occurs. From the mass-loss curve as a function of temperature, it is possible to determine the onset temperature of degradation, the degradation rate, and the overall thermal stability of the material[45]. Gel Permeation Chromatography (GPC) is used to determine the molecular weight distribution of polymers. It is widely applied to detect changes in polymer molecular weight as a result of degradation. By comparing molecular weight distribution profiles before and after degradation, it is possible to identify reductions in average molecular weight as well as the presence of degraded fragments[83]. The Zeta Potential technique characterizes the surface charge and stability of colloidal dispersions by measuring the electrical potential at the interface between dispersed particles and the medium. Negative values indicate strong electrostatic repulsion and stable dispersions, while values near zero or positive suggest low stability with greater tendency to agglomeration or sedimentation[83,84]. This technique is widely applied in polymeric fluid studies to assess dispersion stability and performance under different conditions[84]. Material characterization techniques can be combined to map the behavior of polymers in fluids, considering the specific operational conditions to which they are subjected. Xie et al.[83] investigated the stability and rheological behavior of drilling fluids for deepwater applications under varying temperature conditions. A synthetic thermosensitive polymer (PANA) was characterized using FTIR, elemental analysis, and GPC, while rheological and zeta potential measurements were employed to assess the effects of temperature on fluid stability and viscosity. The results provided insights into fluid performance under thermally challenging conditions. In the study by Li et al.[85], a physicochemical characterization of a PAC-based polymer system was performed to investigate hydration mechanisms using XRD, DSC, FTIR, zeta potential, and rheological analyses. The authors concluded that PAC hydration is driven by hydrogen bonding between water molecules and polymer hydroxyl groups, forming an interconnected structure. These techniques were also shown to be suitable for monitoring structural changes associated with polymer degradation induced by thermal or microbial effects, although no specific operational temperature limits were established. In the work written by Huang et al.[49], the effect of laponite nanoparticles on the thermal stability of water-based drilling fluids was evaluated. Using thermogravimetric analysis and high-temperature rheological tests on fluids containing the AAD terpolymer, results revealed a high decomposition temperature (370 °C) for this polymer. This finding suggests its potential application in high-pressure and high-temperature wells, where thermal stability is a critical requirement. Farias et al.[16] advanced this line of research by evaluating the thermal degradation of carboxymethyl cellulose (CMC) Polímeros, 36(3), e20260029, 2026
Polymer-based fluids for well workover: a comprehensive review in saline solutions, combining SEM, FTIR, TGA/DTG, DSC, and rheological tests. Their findings demonstrated that viscosity loss can precede thermal decomposition, evidencing the importance of correlating chemical stability with rheological performance in the evaluation of fluids for petroleum wellbore applications. In high-pressure and high-temperature wells, such as those in Brazil’s offshore pre-salt fields, it is crucial to ensure the thermal stability of workover fluids. Thermal stability prevents significant polymer and additive degradation, thereby preserving fluid properties and performance[19,20]. Polymer degradation can reduce the operational efficiency of the fluid, compromising its functionality under demanding conditions. Therefore, the proper selection of workover fluids with high thermal stability is essential for the success of operations in high-pressure and high-temperature wells.
5. Formation Damage In addition to adjusting the appropriate properties and selecting components that remain stable throughout the intervention period, workover fluid must be carefully designed to ensure that its interaction with reservoir rocks does not cause formation damage. Formation damage refers to changes in rock structure and in its petrophysical or mechanical properties caused by fluid invasion during drilling, completion, or workover operations. These changes, such as reduced porosity, permeability, or altered wettability, can significantly impair well productivity or injectivity[85]. This damage can occur due to various factors, including mechanical effects, chemical effects, or extreme temperatures associated with thermal recovery methods[86,87]. Among these, mechanical and chemical effects are most strongly associated with the fluid used for wellbore stabilization[1]. The mechanical effects causing formation damage are related to the mobilization of solid particles carried by the fluid during invasion. This mechanism can result in pore blockage, reducing the formation’s permeability and affecting hydrocarbon production. The migration of solids into the formation occurs when a low-permeability filter cake is not effectively formed, allowing fines to migrate into the formation[49]. Although a low-permeability filter cake is desirable, it can also cause formation damage. The cake must be thin and removable; otherwise, hydrocarbon flow to the wellbore after the intervention may be restricted. Bentonite, widely used for viscosity and filtrate control, often forms filter cakes that are more difficult to remove than those made with polymeric materials, increasing the risk of damage. For this reason, avoiding clay minerals in workover formulations is generally preferable[88,89]. Calcite particles are widely used as bridging agents due to their availability in various sizes and their effectiveness in pore plugging. When combined with filtrate-reducing polymers, a synergistic effect occurs as polymer chains form a network around calcite particles, producing a thin, low-permeability filter cake. Moreover, calcite is acidPolímeros, 36(3), e20260029, 2026
soluble, which facilitates filter cake removal and helps restore formation permeability[90]. Chemical effects are directly related to the chemical compatibility between the fluid used, the rock formation, formation water, and the hydrocarbon compositions present[86]. Chemical incompatibility among these elements can cause significant formation damage. One of the main issues is the swelling and migration of clays within the formation, which can block pores and reduce reservoir permeability[25]. Scale formation is another issue, often linked to brine composition. When brines with Ca2+ interact with carbonate ions in formation water, calcium carbonate (CaCO3) precipitates in the pores, reducing permeability and fluid flow[1,11,86]. Polymers used in workover fluid formulations can also present challenges related to formation damage. These polymers can adsorb onto rock surfaces, forming plugs that restrict or even completely block flow toward the wellbore. Additionally, polymer incompatibility with other chemicals may lead to the swelling or dispersion of clay minerals, further reducing permeability[20]. To avoid or minimize these problems, optimizing the polymer concentration used in workover fluids is essential. It is also important to select polymers that are less harmful to the specific formation characteristics. If necessary, stabilizing additives can be used to improve chemical compatibility between polymers and the formation, preventing permeability reduction[86,91].
5.1 Formation damage mitigation According to Patel and Singh[92], formation damage causes annual losses of billions of dollars due to production delays, corrective treatments, and irreversible reservoir losses. Thus, prevention is essential, and when not possible, diagnosing, assessing, and remediating the damage become key challenges for efficient and profitable hydrocarbon recovery. Damage caused by wellbore fluids, particularly from polymers, can be mitigated through different approaches. One method is acidizing, in which acid solutions dissolve or break down polymer-related damage within the formation, restoring permeability[92]. Surfactants and gel breakers also play an important role. Surfactants reduce interfacial tension and disperse polymer residues, while gel breakers degrade crosslinked structures, lowering viscosity and reestablishing permeability. Their effectiveness, however, depends on fluid composition and the type of damage encountered[73,93]. The selection of a remediation method depends on factors such as damage type, lithology, and reservoir conditions[94,95]. Rahmati et al.[96] tested the LPM-FBR additive in fractured sandstone, showing its capacity to reduce fluid invasion and seal fractures under high overbalance. However, it also induced significant damage, underscoring the challenge of designing polymer-based systems that balance filtrate control with permeability recovery in fractured reservoirs.
6. Conclusions Aiming to conduct a comprehensive literature review on the use of polymeric fluids in workover operations, addressing operational fundamentals, polymers used in 7/11
Lima, M. C. S., Romualdo, V. B., Costa, W. R. P., Gonçalves, R. L. N., Costa, A. C. A., Oliveira, L. R. C., Nóbrega, K. C., Farias, M. C. S., Nascimento, R. C. A. M., & Amorim, L. V. these fluids, and technical challenges related to their thermal stability and formation damage.: •
The selection of polymeric additives in workover fluids requires careful consideration of their molecular structure and functional properties to ensure fluid stability under well-specific conditions, while also minimizing the risk of formation damage.
•
Polymer degradation can compromise workover fluid performance, especially in offshore wells, where high temperature and pressure demand additives with high thermal resistance to preserve their properties during operations.
•
In addition to thermal effects, the polymers in workover fluids are subject to degradation caused by microorganisms. Therefore, appropriate biocidal agents should be used to slow down this process during fluid application;
•
Formation damage caused by workover fluids can be minimized through the careful selection of polymers and sealing materials, ensuring efficient sealing and controlled removal. To achieve this, fluids must balance fluid loss control with permeability preservation.
This review emphasizes that polymer stability under reservoir conditions is essential for the performance of workover fluids, ensuring rheological control, filtrate management, and preservation of formation properties. Therefore, careful selection and characterization of polymers are essential for developing formulations that remain effective throughout operations.
7. Author’s Contribution • Conceptualization – Mário César de Siqueira Lima; Luciana Viana Amorim. • Data curation – NA. • Formal analysis – NA. • Funding acquisition – Renalle Cristina Alves de Medeiros Nascimento. • Investigation – Mário César de Siqueira Lima; Victoria Bezerra Romualdo; Ruth Luna do Nascimento Gonçalves; Anna Carolina Amorim Costa. • Methodology – Mário César de Siqueira Lima; Luciana Viana Amorim. • Project administration – Mário César de Siqueira Lima; Karine Castro Nóbrega; Anna Carolina Amorim Costa. • Resources – Mirele Costa da Silva Farias; Renalle Cristina Alves de Medeiros Nascimento; Luciana Viana Amorim. • Software – NA. • Supervision – Mirele Costa da Silva Farias; Anna Carolina Amorim Costa. • Validation – NA. 8/11
• Visualization – Karine Castro Nóbrega; Victoria Bezerra Romualdo. • Writing – original draft – Mário César de Siqueira Lima; Laura Rafaela Cavalcanti de Oliveira; Luciana Viana Amorim. • Writing – review & editing – Waleska Rodrigues Pontes da Costa; Ruth Luna do Nascimento Gonçalves; Laura Rafaela Cavalcanti de Oliveira.
8. Acknowledgements This research was funded by PETROBRAS, grant number 0050.0120134.21.9.
9. References 1. Chiriac, A. (2014). Reservoir drill-in fluids, completion and workover fluids (Master’s thesis). Aalborg University Esbjerg, School of Engineering and Science (SES), Esbjerg, Denmark. 2. Guo, B., Liu, X., & Tan, X. (Eds.) (2017). Well workover. In B. Guo, X. Liu, & X. Tan (Eds.), Petroleum production engineering. Gulf Professional Publishing. 3. Bissoli, D. C., Chaves, G. L. D., & Ribeiro, G. M. (2016). Drivers to the workover rig problem. Journal of Petroleum Science Engineering, 139(1), 13-22. https://doi.org/10.1016/j. petrol.2015.12.009. 4. Lei, Q., Li, Y., Li, T., Li, H., Guan, B., Bi, G., Wang, J., Weng, D., Huang, S., & Han, W. (2020). Technical status and development direction of workover operation of PetroChina. Petroleum Exploration and Development, 47(1), 161-170. https://doi.org/10.1016/S1876-3804(20)60015-5. 5. Mansour, H., Ahmad, M. M., & Dhafr, N. (2012). An investigation into benchmarking of workover activities of rigs in the oilfields. In Proceedings of the 20th International Conference on Flexible Automation and Intelligent Manufacturing. Helsinki, Finland. 6. Aloise, D. J., Aloise, D., Rocha, C. T. M., Ribeiro, C. C., Ribeiro Filho, J. C., & Moura, L. S. S. (2006). Scheduling workover rigs for onshore oil production. Discrete Applied Mathematics, 154(5), 695-702. https://doi.org/10.1016/j.dam.2004.09.021. 7. Diller, C. (2010). Field/well integrity issues, well abandonment planning and workover operations on an inadequately abandoned well: peace River Alberta case study. In Abu Dhabi International Petroleum Exhibition and Conference. Abu Dhabi, United Arab Emirates. https://doi.org/10.2118/138287-MS. 8. Mansour, H., & Ahmad, M. M. (2013). Framework for evaluation and improvement of workover rigs in oilfields. American Journal of Engineering Research, 4(4), 6-13. Retrieved in 2025, September 15, from https://www.ajer.org/papers/v4(04)/ B04406013.pdf 9. Tomlins, A., Conrad, J., & Bocaneala, B. (2019). The world’s first offshore multilateral well completed with multistage proppant fracturing: a case study from offshore Black Sea. In SPE Hydraulic Fracturing Technology Conference, Woodlands, Texas, USA. https://doi.org/10.2118/194324-MS. 10. Rae, P., Di Lullo, G., & Ahmad, A. B. (2002). Eliminating environmental risks in well construction and workover. In SPE Asia Pacific Oil and Gas Conference and Exhibition. Melbourne, Australia. https://doi.org/10.2118/77812-MS. 11. Riley, S. M., Potter, G. F., Holmes, J. M., Jr., & Reeves, H. C., 3rd. (1984, September 16). Controlling incompatibilities of formation and killweight fluids during workover. In 59th Annual Conference and Exhibition, Houston, Texas, USA. https://doi.org/10.2118/13131-MS. Polímeros, 36(3), e20260029, 2026
Polymer-based fluids for well workover: a comprehensive review 12. MI SWACO (2013). Basic mud school presentation manual (pp. 1-13). Houston: MI SWACO. 13. Mardashov, D. V., Rogachev, M. K., Zeigman, Y. V., & Mukhametshin, V. V. (2021). Well killing technology before workover operation in complicated conditions. Energies, 14(3), 654. https://doi.org/10.3390/en14030654. 14. MI SWACO (2012). Completion fluids manual (pp. 5-12). Houston: MI SWACO. 15. Costa, W. R. P., Nóbrega, K. C., Costa, A. C. A., Nascimento, R. C. A. M., Souza, E. A., Oliveira, T. A., Barros, M., & Amorim, L. V. (2024). A liquid well barrier element for temporary plug and abandonment operations: a breakthrough approach. Processes (Basel, Switzerland), 12(10), 2190. https://doi.org/10.3390/pr12102190. 16. Farias, M. C. S., Costa, W. R. P., Nóbrega, K. C., Romualdo, V. B., Costa, A. C. A., Nascimento, R. C. A. M., & Amorim, L. V. (2025). Thermal Degradation of Carboxymethyl Cellulose (CMC) in Saline Solution for Applications in Petroleum Industry Fluids. Polymers, 17(15), 2085. https://doi.org/10.3390/polym17152085. PMid:40808132. 17. Gonçalves, R. L. N., Costa, A. C. A., Lima, M. C. S., Nóbrega, K. C., Costa, W. R. P., Oliveira, L. R. C., Nascimento, R. C. A. M., Barros, M., Oliveira, T. A., & Amorim, L. V. (2025). A new application for salted water-based fluids with palygorskite: formulation designing for temporary plug and abandonment operations of petroleum wells. Applied Sciences (Basel, Switzerland), 15(6), 2980. https://doi.org/10.3390/app15062980. 18. Liu, X., Yuan, Z., Wang, A., Wang, C., Qu, J., Chen, B., Wei, B., Kapu, N. S., & Wen, Y. (2020). Cellulose nanofibrilpolymer hybrids for protecting drilling fluid at high salinity and high temperature. Carbohydrate Polymers, 229, 115465. https://doi.org/10.1016/j.carbpol.2019.115465. PMid:31826464. 19. Beltrao, R. L. C., Sombra, C. L., Lage, A. C. V. M., Netto, J. R. F., & Henriques, C. C. D. (2009). SS: pre-salt Santos basin - Challenges and new technologies for the development of the pre-salt cluster, Santos Basin, Brazil. In Offshore Technology Conference. Houston, TX, USA. https://doi.org/10.4043/19880-MS. 20. Gessner, T. R., & Barbosa, J. R., Jr. (2022). An internally consistent procedure to characterize singlecarbonnumber fractions for phase equilibrium of petroleum mixtures: application to Brazilian presalt reservoir fluids. Journal of Petroleum Science and Engineering, 208(Pt E), 109723. https://doi.org/10.1016/j.petrol.2021.109723. 21. Thomas, D. C. (1982). Thermal stability of starch- and carboxymethyl cellulose-based polymers used in drilling fluids. Society of Petroleum Engineers Journal, 22(2), 171-180. https://doi.org/10.2118/8463-PA. 22. Eaton, B. A., & Smithey, M. (1971). Formation damage from workover and completion fluids. In SPE California Regional Meeting. California, USA. https://doi.org/10.2118/3707-MS. 23. Lipton, D., & Burnett, D. B. (1976). Comparisons of polymers used in workover and completion fluids. In SPE California Regional Meeting. California, USA. https://doi.org/10.2118/5872-MS. 24. Vollmer, D. P., & Alleman, D. J. (2001). HEC no longer the preferred polymer. In SPE International Symposium on Oilfield Chemistry. Houston, TX, USA. https://doi.org/10.2118/65398-MS. 25. Yang, Y., Li, Y., Yao, J., Zhang, K., Iglauer, S., Luquot, L., & Wang, Z. (2019). Formation damage evaluation of a sandstone reservoir via pore-scale X-ray computed tomography analysis. Journal of Petroleum Science Engineering, 183, 106356. https://doi.org/10.1016/j.petrol.2019.106356. 26. Scheuerman, R. F. (1983). Guidelines for using HEC polymers for viscosifying solids-free completion and workover brines. Journal of Petroleum Technology, 35(2), 306-314. https://doi.org/10.2118/10666-PA. 27. Ezzat, A. M., Rosser, H. R., & Al-Humam, A. A. (1997). Control of microbiological activity in biopolymer-based drilling muds. Polímeros, 36(3), e20260029, 2026
In SPE/IADC Middle East Drilling Technology Conference. Bahrain. https://doi.org/10.2118/39285-MS. 28. Li, B., Luo, P., Zhao, X., & Chen, L. (2024). Research and application of completion and workover fluid technology in heavy oil reservoir in Ecuador. In International Petroleum Technology Conference. Dhahran, Saudi Arabia. https://doi.org/10.2523/IPTC-24160-MS. 29. Lima, M. C. S., Romualdo, V. B., Oliveira, G. V. B., Silva Filho, E. D., Nóbrega, K. C., Costa, A. C. A., Souza, E. A., Camargo, S. T., Jr., Rodrigues, M. A. F., & Amorim, L. V. (2025). Assessment of formation damage in carbonate rocks: isolated contribution of filtration control agents in aqueous fluids. Applied Sciences (Basel, Switzerland), 15(21), 11572. https://doi.org/10.3390/app152111572. 30. Rocha, L. A. S., & Azevedo, C. T. (2019). Projetos de poços de petróleo: geopressões e assentamento de colunas de revestimentos. Rio de Janeiro: Editora Interciência. 31. Petri, D. F. S. (2015). Xanthan gum: a versatile biopolymer for biomedical and technological applications. Journal of Applied Polymer Science, 132(23), 42035. https://doi.org/10.1002/app.42035. 32. McNeilly, K., El-Sayed, M. A., Al-Blooshi, J., & Al-Qubaisi, S. (2017). ADMA rigless intervention campaign: Breathing new life in to old wells. In Abu Dhabi International Petroleum Exhibition & Conference. Abu Dhabi, United Arab Emirates. https://doi.org/10.2118/188609-MS. 33. Siddig, O., Mahmoud, A. A., & Elkatatny, S. A. (2020). A review of different approaches for water-based drilling fluid filter cake removal. Journal of Petroleum Science Engineering, 192, 107346. https://doi.org/10.1016/j.petrol.2020.107346. 34. Vrålstad, T., Saasen, A., Fjær, E., Øia, T., Ytrehus, J. D., & Khalifeh, M. (2019). Plug & abandonment of offshore wells: ensuring long-term well integrity and cost-efficiency. Journal of Petroleum Science Engineering, 173, 478-491. https://doi.org/10.1016/j.petrol.2018.10.049. 35. Nguyen, T. C., Miska, S., Saasen, A., & Maxey, J. (2014). Using Taguchi and ANOVA methods to study the combined effects of drilling parameters on dynamic barite sag. Journal of Petroleum Science Engineering, 121, 126-133. https://doi.org/10.1016/j.petrol.2014.06.029. 36. Lippmann, F. (1973). Sedimentary carbonate minerals. USA: Springer-Verlag Berlin. https://doi.org/10.1007/978-3-642-65474-9. 37. Talukdar, P., & Gogoi, S. B. (2015). Use of calcium carbonate as bridging and weighting agent in the non-damaging drilling fluid for some oilfields of Upper Assam Basin. International Journal of Current Research, 7(8), 18964-18981. Retrieved in 2025, September 15, from https://www.journalcra.com/sites/ default/files/issue-pdf/9945.pdf 38. Nguyen, T., Silva, C., Dare, A., Saasen, A., & AlSafran, E. (2016). Optimization of calcium carbonate particles and pH in oil based drilling fluids to minimize barite sag. In AADE Fluids Technical Conference and Exhibition. Houston, TX, USA. Retrieved in 2025, September 15, from https://www.aade.org/application/ files/1815/7131/8493/AADE-16-FTCE-22_-_Nguyen.pdf 39. Hopkins, S. D., Gogovi, G. K., Weisel, E. W., Handler, R. A., & Blaisten-Barojas, E. (2020). Polyacrylamide in glycerol solutions from an atomistic perspective of the energetics, structure, and dynamics. AIP Advances, 10(8), 085011. https://doi.org/10.1063/5.0020850. 40. Câmara, P. C. F., Morais, S. C., Marques, N. N., Souza, E. A., Gasparotto, L. H. S., & Balaban, R. C. (2023). Polyacrylamide and poly-ethylenimine mixed hydrogels tailored with crude glycerol for conformance fluids: gelation performance and thermal stability. Fuel, 354, 129376. https://doi.org/10.1016/j.fuel.2023.129376. 41. Caenn, R., Darley, H. C. H., & Gray, G. R. (2011). Composition and properties of drilling and completion fluids. Waltham: Gulf Professional Publishing. 9/11
Lima, M. C. S., Romualdo, V. B., Costa, W. R. P., Gonçalves, R. L. N., Costa, A. C. A., Oliveira, L. R. C., Nóbrega, K. C., Farias, M. C. S., Nascimento, R. C. A. M., & Amorim, L. V. 42. Kalantariasl, A., Zeinijahromi, A., & Bedrikovetsky, P. (2014). External filter cake buildup in dynamic filtration: mechanisms and key factors. In SPE International Symposium and Exhibition on Formation Damage Control. Lafayette, LA, USA https://doi.org/10.2118/168144-MS. 43. Ezell, R. G., Ezzat, A. M., Turner, J. K., & Wu, J. J. (2010, 1012 de fevereiro). New filtration-control polymer for improved brine-based reservoir drilling-fluids performance at temperatures in excess of 400°F and high pressure. In SPE International Symposium and Exhibition on Formation Damage Control. Lafayette, Louisiana, USA. https://doi.org/10.2118/128119-MS. 44. Crumpton, H. (2018). Well control for completions and interventions. Waltham: Gulf Professional Publishing. 45. Ahamed, S. B., & Belhadri, M. (2009). Rheological properties of biopolymers drilling fluids. Journal of Petroleum Science Engineering, 67(3-4), 84-90. https://doi.org/10.1016/j.petrol.2009.04.001. 46. Luz, R. C. S., Fagundes, F. P., & Balaban, R. B. (2017). Waterbased drilling fluids: the contribution of xanthan gum and carboxymethylcellulose on filtration control. Chemical Papers, 71(12), 2365-2373. https://doi.org/10.1007/s11696-017-0231-7. 47. Nwosu, O. U., & Ewulonu, C. M. (2014). Rheological behaviour of eco-friendly drilling fluids from biopolymers. Journal of Polymer & Biopolymer Physics & Chemistry, 2(3), 50-54. http://doi.org/10.12691/jpbpc-2-3-2. 48. Hodge, R. M. (1998). HEC precipitation at elevated temperature: an unexpected source of formation damage. SPE Drilling & Completion, 13(2), 88-91. https://doi.org/10.2118/38155-PA. 49. Huang, X., Lv, K., Sun, J., Lu, Z., Bai, Y., Shen, H., & Wang, J. (2019). Enhancement of thermal stability of drilling fluid using laponite nanoparticles under extreme temperature conditions. Materials Letters, 248, 146-149. https://doi.org/10.1016/j.matlet.2019.04.005. 50. Shaheed, L. H. (2022). Analysis and mitigation of high-pressure and high-temperature well completion design of Elkin/Franklin Fields in the North Sea. Journal of Petroleum Research and Studies, 12(1 Suppl), 1-17. https://doi.org/10.52716/jprs.v12i1(Suppl.).617. 51. Sauman, M., Law, B., French, C. P., & Pianca, J. (2000). Enviromental protection in drilling operation using minimum pit and zero cost. In IADC/SPE Asia Pacific Drilling Technology Conference and Exhibition. Kuala Lumpur, Malaysia. https://doi.org/10.2118/62765-MS. 52. Luheng, Q. (2014). The application of polymer mud system in drilling engineering. Procedia Engineering, 73, 230-236. https://doi.org/10.1016/j.proeng.2014.06.192. 53. Singh, B., & Sharma, N. (2008). Mechanistic implications of plastic degradation. Polymer Degradation & Stability, 93(3), 561-584. https://doi.org/10.1016/j.polymdegradstab.2007.11.008. 54. Carico, R. D., & Bagshaw, F. R. (1978). Description and use of polymers used in drilling, workovers, and completions. In SPE Production Technology Symposium. Lubbock, TX, USA. https://doi.org/10.2118/7747-MS. 55. Wang, S., Chen, F., Guo, J., Li, Y., Zhao, F., & Zhou, S. (2019). Adsorption damage of hydroxypropyl guar gum to porous media composed of quartz. Journal of Petroleum Science Engineering, 182, 106379. https://doi.org/10.1016/j. petrol.2019.106379. 56. Elkatatny, S., Mahmoud, M., & Abdelgawad, K. (2018). Reaction of chelating agents with guar gum polymer for completion fluid. Arabian Journal for Science and Engineering, 43(11), 6481-6491. https://doi.org/10.1007/s13369-018-3278-z. 57. Bahamdan, A., & Daly, W. H. (2006). Poly(oxyalkylene) grafts to guar gum with applications in hydraulic fracturing fluids. Polymers for Advanced Technologies, 17(9–10), 679-681. https://doi.org/10.1002/pat.814. 58. Cao, X., Shi, Y., Li, W., Zeng, P., Zheng, Z., Feng, Y., & Yin, H. (2021). Comparative studies on hydraulic fracturing fluids 10/11
for high-temperature and high-salt oil reservoirs: synthetic polymer versus guar gum. ACS Omega, 6(39), 25421-25429. https://doi.org/10.1021/acsomega.1c03394. PMid:34632200. 59. Dajun, G. (2021). Study on instant low friction seawater based guar gum fracturing fluids. Drilling Fluid & Completion Fluid, 38(3), 371-374. 60. Wang, J., Huang, Y., Zhang, Y., Zhou, F., Yao, E., & Wang, E. (2020). Study of fracturing fluid on gel breaking performance and damage to fracture conductivity. Journal of Petroleum Science Engineering, 193, 107443. https://doi.org/10.1016/j.petrol.2020.107443. 61. Akpan, E. U., Enyi, G. C., & Nasr, G. G. (2020). Enhancing the performance of xanthan gum in water-based mud systems using an environmentally friendly biopolymer. Journal of Petroleum Exploration and Production Technology, 10(5), 1933-1948. https://doi.org/10.1007/s13202-020-00837-0. 62. Wu, L., Xu, T., Han, X., & Pan, X. (2011). Research on high temperature stability effects of xanthan gum. Zuanjing Ye yu Wanjing Ye- Drilling Fluid & Completion Fluid, 28(6), 77-80. 63. Zhu, W., & Zheng, X. (2021). Effective modified xanthan gum fluid loss agent for high-temperature water-based drilling fluid and the filtration control mechanism. ACS Omega, 6(37), 23788-23801. https://doi.org/10.1021/acsomega.1c02617. PMid:34568659. 64. Dolz, M., Jiménez, J., Hernández, M. J., Delegido, J., & Casanovas, A. (2007). Flow and thixotropy of non-contaminating oil drilling fluids formulated with bentonite and sodium carboxymethyl cellulose. Journal of Petroleum Science Engineering, 57(3-4), 294-302. https://doi.org/10.1016/j.petrol.2006.10.008. 65. Menezes, R. R., Marques, L. N., Campos, L. A., Ferreira, H. S., Santana, L. N. L., & Neves, G. A. (2010). Use of statistical design to study the influence of CMC on the rheological properties of bentonite dispersions for water-based drilling fluids. Applied Clay Science, 49(1-2), 13-20. https://doi. org/10.1016/j.clay.2010.03.013. 66. Srungavarapu, M., Patidar, K. K., Pathak, A. K., & Mandal, A. (2018). Performance studies of water-based drilling fluid for drilling through hydrate bearing sediments. Applied Clay Science, 152, 211-220. https://doi.org/10.1016/j.clay.2017.11.014. 67. Kuma, M., Das, B. M., & Talukdar, P. (2020). The effect of salts and hematite on carboxymethyl cellulose–bentonite and partially hydrolyzed polyacrylamide–bentonite muds for an effective drilling in shale formations. Journal of Petroleum Exploration and Production Technology, 10(2), 395-405. https://doi.org/10.1007/s13202-019-0722-x. 68. Teymoori, R. N., & Alaskarin, M. K. (2007). Effects of salinity, pH and temperature on CMC polymer and XC polymer performance. International Journal of Engineering, 20(3), 283-290. Retrieved in 2025, September 15, from https://www.ije.ir/article_71677.html 69. Carico, R. D. (1976). Suspension properties of polymer fluids used in drilling, workover, and completion operations. In SPE California Regional Meeting. California, USA. https://doi.org/10.2118/5870-MS. 70. Elemam, A. E., Hussien, R. A. M., Ibrahim, A. A., & Mohamed, S. A. (2015). Impacts of polyanionic cellulose polymer (PAC-LV) on drilling fluids properties. SUST Journal of Engineering and Computer Science, 16(3), 30-36. Retrieved in 2025, September 15, from https://repository.sustech.edu/handle/123456789/16631 71. Jia, X., Zhao, X., Chen, B., Egwu, S. B., & Huang, Z. (2022). Polyanionic cellulose/hydrophilic monomer copolymer grafted silica nanocomposites as HTHP drilling fluid-loss control agent for water-based drilling fluids. Applied Surface Science, 578, 152006. https://doi.org/10.1016/j.apsusc.2021.152089. 72. Liu, Z., Zhang, C., Li, Q., Davarpanah, A., & Metwally, A. S. M. (2022). Effectiveness of cellulose polyanionic-based polymers on the measurement of rheological properties of Polímeros, 36(3), e20260029, 2026
Polymer-based fluids for well workover: a comprehensive review water-based drilling fluids in high-pressure high-temperature fractured shale reservoirs. Applied Water Science, 12(5), 85. https://doi.org/10.1007/s13201-022-01595-6. 73. Kafashi, S., Rasaei, M., & Karim, G. (2017). Effects of sugarcane and polyanionic cellulose on rheological properties of drilling mud: an experimental approach. Egyptian Journal of Petroleum, 26(2), 371-374. https://doi.org/10.1016/j.ejpe.2016.05.009. 74. Fang, Q., Zhao, X., Sun, H., Wang, Z., Qiu, Z., Shan, K., & Ren, X. (2022). Formation-damage mechanism and gel-breaker-free drill-in fluid for carbonate reservoir. Gels (Basel, Switzerland), 8(9), 565. https://doi.org/10.3390/gels8090565. PMid:36135276. 75. Audibert, A., Argillier, J.-F., Ladva, H. K. J., Way, P. W., & Hove, A. O. (1999). Role of polymers on formation damage. In SPE European Formation Damage Conference. The Hague, Netherlands. https://doi.org/10.2118/54767-MS. 76. Mahmoud, H., Alhajabdalla, M., Nasser, M. S., Hussein, I. A., Ahmed, R., & Karami, H. (2021). Settling behavior of fine cuttings in fiber-containing polyanionic fluids for drilling and hole cleaning application. Journal of Petroleum Science Engineering, 199, 108377. https://doi.org/10.1016/j.petrol.2020.108337. 77. Mohamed, A., Salehi, S., & Ahmed, R. (2021). Rheological properties of drilling fluids containing special additives for geothermal drilling applications. In 46th Workshop on Geothermal Reservoir Engineering. Stanford, California, USA: Stanford University. 78. Al-Humam, A. A., Ezzat, A. M., Ba Hamdan, A. A., Sindi, M. E., Al-Humaid, G. A., & Zhu, X. (2021). Drilling fluids microbial impact and mitigation. Journal of Physical Science and Application, 11(1), 22-28. https://doi.org/10.17265/2159-5348/2021.01.004. 79. Anderson, Z., Ioannou, A., Howard, S., & Downs, J. (2023). Understanding and managing the natural self-breaking behaviour of xanthan in reservoir drill-in, completion and workover fluids. In SPE International Conference on Oilfield Chemistry. The Woodlands, TX, USA. https://doi.org/10.2118/213822-MS. 80. Fink, J. K. (2012). Petroleum engineer’s guide to oil field chemicals and fluids. Waltham: Gulf Professional Publishing. 81. Abdiyev, K., Marić, M., Orynbaev, B., Zhursumbaeva, M., Seitkaliyeva, N., & Toktarbay, Z. (2023). A novel cationic polymer surfactant for regulation of the rheological and biocidal properties of the water-based drilling muds. Polymers, 15(2), 330. https://doi.org/10.3390/polym15020330. PMid:36679210. 82. Quan, H., Li, H., Huang, Z., Zhang, T., & Da, S. (2014). Copolymer SJ-1 as a fluid loss additive for drilling fluid with high content of salt and calcium. International Journal of Polymer Science, 2014(1), 201301. https://doi.org/10.1155/2014/201301. 83. Xie, B., Zhang, X., Li, Y., Liu, W., & Luo, M. (2019). Application of a novel thermo-sensitive copolymer as a potential rheological modifier for deepwater water-based drilling fluids. Colloids and Surfaces. A, Physicochemical and Engineering Aspects, 581, 123848. https://doi.org/10.1016/j.colsurfa.2019.123848. 84. Inam, W., Bhadane, R., Akpolat, R. N., Taiseer, R. A., Filippov, S. K., Salo-Ahen, O. M. H., Rosenholm, J. M., & Zhang, H. (2022). Interactions between polymeric nanoparticles and different buffers as investigated by zeta potential measurements and molecular dynamics simulations. VIEW, 3(4), 20210009. https://doi.org/10.1002/VIW.20210009. 85. Li, M., Gu, S., Jin, J., Zheng, Y., & Xie, D. (2020). Research on the influence of polyanionic cellulose on the microstructure and
Polímeros, 36(3), e20260029, 2026
properties of oil well cement. Construction & Building Materials, 259, 119841. https://doi.org/10.1016/j.conbuildmat.2020.119841. 86. Cai, J., Yu, B., Zou, M., & Mei, M. (2010). Fractal analysis of invasion depth of extraneous fluids in porous media. Chemical Engineering Science, 65(18), 5178-5186. https://doi.org/10.1016/j.ces.2010.06.013. 87. Kok, M. V., & Iscan, G. (2009). Effect of carboxymethyl cellulose and determination of pore throat criteria for water-based drilling fluids. Energy Sources. Part A, Recovery, Utilization, and Environmental Effects, 31(5), 396-405. https://doi.org/10.1080/15567030801907254. 88. Zang, J., & Chen, X. (2018). Formation damage by thermal methods applied to heavy oil reservoirs. In B. Yuan, & D. A. Wood (Eds.), Formation damage during improved oil recovery: fundamentals and applications (pp. 361-384). USA: Elsevier. https://doi.org/10.1016/B978-0-12-813782-6.00009-9. 89. Mahmoud, O., & Nasr-El-Din, H. A. (2021). Formation-damage assessment and filter-cake characterization of Ca-bentonite fluids enhanced with nanoparticles. SPE Drilling & Completion, 36(1), 75-87. https://doi.org/10.2118/191155-PA. 90. Al Jaberi, J., Bageri, B. S., Adebayo, A. R., Patil, S., Barri, A., & Salin, R. B. (2021). Evaluation of formation damages during filter cake deposition and removal process: the effect of primary damage on secondary damage. Petroleum Science, 18(4), 1153-1162. https://doi.org/10.1016/j.petsci.2021.07.004. 91. Ezell, R., & Harrison, D. J. (2008). Design of improved high-density, thermally-stable drill-in fluid for HTHP applications. In SPE Annual Technical Conference and Exhibition. Denver, CO, USA. https://doi.org/10.2118/115537-MS. 92. Patel, M. C., & Singh, A. (2016). Near wellbore damage and types of skin depending on mechanism of damage. In SPE International Conference and Exhibition on Formation Damage Control. Lafayette, LA, USA. https://doi.org/10.2118/179011-MS. 93. Quintero, L., Newberry, M., Morales, R., & Davis, C. (2017). Organic and inorganic formation damage removal using customized formulations. In SPE Western Regional Meeting. Bakersfield, CA, USA. https://doi.org/10.2118/185735-MS. 94. Li, Z., Zhang, W., Tang, Y., Li, B., Song, Z., & Hou, J. (2016). Formation damage during alkaline-surfactant-polymer flooding in the Sanan-5 block of the Daqing Oilfield, China. Journal of Natural Gas Science and Engineering, 35(Pt A), 826-835. https://doi.org/10.1016/j.jngse.2016.07.046. 95. Mohammadi, M. K., Riahi, S., & Boek, E. S. (2023). An insight review on formation damage induced by drilling fluids. Reviews in Chemical Engineering, 39(3), 387-415. https://doi.org/10.1515/revce-2020-0106. 96. Rahmati, M., Khosravi, M., Tanha, A. A., & Rafiq Albajalan, A. (2024). Evaluation of formation damage and filter cake removal with a new LPM drilling fluid additive. Results in Engineering, 23, 102656. https://doi.org/10.1016/j. rineng.2024.102656. Received: Sep. 29, 2025 Revised: May 06, 2026 Accepted: May 13, 2026 Editor-in-Chief: Sebastião V. Canevarolo
11/11
ISSN 1678-5169 (Online)
https://doi.org/10.1590/0104-1428.20250088
Effect of stacking sequence on banana-aramid hybrid laminate properties Ramachandran Natarajan1* , Ramamoorthi Rangasamy1 and Manickaraj Karuppusamy2 Department of Mechanical Engineering, Sri Krishna College of Engineering and Technology, Anna University, Coimbatore, Tamil Nadu, India 2 Department of Mechanical Engineering, CMS College of Engineering and Technology, Anna University, Coimbatore, Tamil Nadu, India 1
*ramachandrandesign@gmail.com
Abstract Growing demand for lightweight, durable, and sustainable materials has increased interest in hybrid natural-synthetic fiber composites for structural and wear-critical applications. Research and industrial adoption are strong in Europe, North America, and the Asia-Pacific region, with Europe leading automotive and construction sectors due to sustainability-driven policies. This study examined the effect of stacking sequence on the mechanical, tribological, and hygroscopic performance of banana-aramid hybrid epoxy laminates fabricated by compression moulding. Four configurations were evaluated: all-banana (A), aramid-skinned banana core (B), alternating banana-aramid layers (C), and aramid-dominated laminates (D). Tensile, compressive, impact, hardness, water absorption, and wear properties were assessed. Sample C showed the highest tensile strength (36.80 MPa), while Sample D exhibited superior compressive strength (45.56 MPa), hardness (77 Shore D), impact resistance (13.89 kJ/m2), lowest water absorption (0.0712%), and best wear resistance (0.0006 mm). These results confirm that optimized stacking sequences enable high-performance, sustainable hybrid composites. Keywords: aramid fiber, banana fiber, epoxy composites, mechanical properties Data Availability: All data supporting the findings of this study are included in this article and its supplementary materials. How to cite: Natarajan, R., Rangasamy, R., & Karuppusamy, M. (2026). Effect of stacking sequence on banana-aramid hybrid laminate properties. Polímeros: Ciência e Tecnologia, 36(3), e20260025. https://doi.org/10.1590/0104-1428.20250088
1. Introduction Growing environmental concerns and the depletion of fossil resources have accelerated the development of natural fiber-reinforced and hybrid polymer composites as sustainable alternatives to petroleum-based materials[1]. Natural fibers such as banana, jute, sisal, hemp, coir, flax, vetiver, and luffa are increasingly utilized due to their renewability, low density, biodegradability, and cost-effectiveness[2-4]. Recent studies on lignocellulosic fibers derived from asparagus bean stem, Zanthoxylum acanthopodium, and Mimosa pudica have demonstrated that fiber type, chemical composition, and surface treatment significantly influence mechanical performance, water resistance, and interfacial bonding in polymer composites[5,6]. Despite these advantages, natural fibers generally exhibit moderate strength, hydrophilicity, and environmental sensitivity, limiting their use in demanding applications[7]. Banana fiber, extracted from the plant pseudo-stem, offers low density and renewability but suffers from moisture sensitivity and limited tensile strength. To overcome these drawbacks, hybridization with high-performance synthetic fibers has emerged as an effective strategy. Aramid fibers (e.g., Kevlar) provide high tensile strength, impact resistance, thermal stability, and superior tribological performance,
Polímeros, 36(3), e20250088, 2026
although their cost and non-biodegradability restrict standalone applications[8]. Banana-aramid hybridization thus enables a balance between sustainability and mechanical reliability, making such composites attractive for structural and wear-critical applications. Composite performance is strongly influenced by stacking sequence and interfacial architecture, which govern stress transfer, moisture diffusion, and wear behavior[9]. Epoxy resin is widely used due to its excellent adhesion and dimensional stability, while compression moulding ensures uniform laminate consolidation[10]. Previous studies on flax-vetiver-Luffa cylindrica, Parthenium hysterophorus–Ipomoea pes-caprae, and areca sheath–palm leaf sheath hybrid composites have confirmed that optimized stacking sequences significantly enhance mechanical performance and reduce water absorption, supporting applications in automotive interiors, structural panels, and acoustic components[11,12]. However, systematic investigations on banana–aramid hybrid epoxy laminates remain limited, particularly regarding stacking-sequence effects on mechanical, tribological, and hygroscopic properties[13]. Accordingly, the present study investigates banana–aramid hybrid epoxy laminates with distinct stacking sequences fabricated by compression moulding[14]. Mechanical,
1/11
O O O O O O O O O O O O O O O O
Natarajan, R., Rangasamy, R., & Karuppusamy, M. tribological, and water absorption behaviors were evaluated to establish structure–property relationships and demonstrate the potential of stacking-sequence engineering for sustainable, high-performance composite applications. The novelty of this work lies in the systematic evaluation of stacking-sequence effects in banana–aramid hybrid epoxy laminates, linking aramid layer placement with mechanical, tribological, and hygroscopic performance. The study uniquely demonstrates that alternating banana–aramid layers optimize tensile strength, while aramid-dominated sequences enhance compressive strength, impact resistance, moisture resistance, and wear durability, providing clear design guidelines for sustainable hybrid composites.
2. Materials The composite laminates were developed using epoxy resin, banana fibers, and aramid fabric as the primary constituents.
2.1 Matrix Epoxy resin (LY556) and hardener (HY951) from Covai Seenu & Seenu Co., Coimbatore, India, were used in a 10:1 weight ratio. Epoxy was chosen for its strong adhesion, dimensional stability, and compatibility with both natural and synthetic fibers[15].
2.2 Natural fiber Banana fibers, obtained from Amman Impex, Coimbatore, were extracted from pseudo-stems, washed, sun-dried for 48 h, cut to size, and aligned during lay-up. Pretreatment improved fiber–matrix bonding and minimized voids[16].
2.3 Synthetic fiber Woven aramid fabric (Kevlar-type) was used as the synthetic reinforcement. Aramid fibers were selected owing to their high tensile strength, excellent impact resistance, low density, and outstanding wear properties, which complement the eco-friendly but relatively weaker banana fibers. The fabric was cut into sheets of uniform size to match the mold dimensions[17].
3. Methods 3.1 Composite fabrication Laminates were fabricated using the hand lay-up process in a flat mould of 300 mm × 300 mm × 5 mm[18]. The mould surface was cleaned and coated with a polyvinyl alcohol (PVA) release agent to facilitate easy demoulding. Epoxy resin (LY556) and hardener (HY951) were mixed in a ratio of 10:1 by weight[19-21]. Banana fibers were cleaned, dried, and cut to uniform size, while aramid fabrics were trimmed to match the mould dimensions. Fibers were stacked in four configurations and are shown in Table 1. Each fiber layer was placed in the mould and manually impregnated with the resin–hardener mixture using a brush and roller to ensure proper wetting and removal of entrapped air. After lay-up, the laminate was covered with a release film and a weighted plate was placed on top to maintain uniform thickness during curing[22]. The Figure 1 shows the hand lay-up process.
3.2 Curing process Specimens were cured at room temperature for 24 h, followed by post-curing in a hot-air oven at 60 °C for 2 h,
Table 1. Stacking Sequence of the fibers. Samples A B C D
Sequences Banana Banana Banana Banana Banana Aramid Banana Banana Banana Aramid Banana Aramid Banana Aramid Banana Aramid Banana Aramid Banana Aramid
Figure 1. Hand-lay Up Process. 2/11
Polímeros, 36(3), e20250088, 2026
Effect of stacking sequence on banana-aramid hybrid laminate properties then cut to ASTM standard dimensions for testing[23,24]. The four laminate stacking sequences developed in this study are illustrated in Figure 2
4. Testing Procedures To evaluate the influence of stacking sequence on the performance of banana–aramid hybrid epoxy laminates, a comprehensive set of experimental tests was conducted in accordance with standard ASTM procedures[25]. The specimens prepared for these evaluations are shown in Figure 3. The tests covered tensile, compression, hardness, impact, water absorption, and wear performance, each designed to assess specific mechanical, physical, and tribological characteristics of the composites. For each test, five specimens per stacking sequence were evaluated, and the mean values were reported.
4.1 Tensile and flexural test Tensile and flexural tests were performed using a universal testing machine (UTM). Tensile strength was measured in
accordance with ASTM D3039, while flexural strength was evaluated following ASTM D7264 at a crosshead speed of 2 mm/min[26].
4.2 Compression test Compressive strength and modulus were evaluated as per ASTM D695. Specimens with a length-to-diameter ratio of 2:1 were subjected to axial compressive loading until failure[27].
4.3 Hardness test Surface hardness was measured with a Shore D tester following ASTM D2240. Multiple readings were taken across each specimen and averaged[28].
4.4 Impact test Impact strength was obtained by the Charpy method in compliance with ASTM D256, using notched specimens to record absorbed fracture energy[29].
Figure 2. (a) Sample A (Ba Ba Ba Ba); (b) Sample B (Ar Ba Ba Ba Ar); (c) Sample C (Ba Ar Ba Ar Ba); (d) Sample D (Ar Ba Ar Ba Ar).
Figure 3. Specimens for Various Tests, (a) Tensile Test; (b) Compression Test; (c) Hardness Test; (d) Impact Test; (e) Water Absorption Test; (f) Wear Test. Polímeros, 36(3), e20250088, 2026
3/11
Natarajan, R., Rangasamy, R., & Karuppusamy, M. 4.5 Water absorption test Moisture uptake was evaluated using ASTM D570. Specimens were dried, weighed, immersed in water for 24 h at room temperature, and reweighed to calculate weight gain[30].
4.6 Wear test Tribological performance was studied on a pin-on-disc tribometer per ASTM G99. Cylindrical pins of the laminates were tested against a hardened steel disc under controlled load and sliding distance, with wear loss and coefficient of friction recorded[31].
4.7 Scanning Electron Microscopy (SEM) analysis Fracture surface morphology of the tested specimens was examined using Scanning Electron Microscopy (SEM). Samples from tensile, impact, and wear-tested laminates were sputter-coated with a thin layer of gold to enhance conductivity before imaging. SEM analysis provided detailed insights into fiber–matrix interfacial adhesion, fiber pull-out, crack propagation, matrix fragmentation, and microvoid formation. These observations were correlated with the mechanical and tribological test results to better understand the underlying failure mechanisms and performance differences between stacking sequences[32-34].
5. Results and Discussions 5.1 Tensile and flexural strength As observed in Figure 4a, The tensile strength of banana–aramid hybrid epoxy laminates strongly depended on stacking sequence, increasing from 16.60 MPa for the banana-only laminate (Sample A) to 38.18 MPa for the aramid-dominated laminate (Sample D). The low strength of Sample A resulted from the limited stiffness of banana fibers, their heterogeneous composition, and weak fiber–matrix adhesion, which promoted fiber pull-out and matrix cracking. Introducing aramid surface plies in Sample B improved strength to 24.48 MPa by enhancing load bearing, though
the banana-rich core limited performance. A significant increase was observed in Sample C (36.80 MPa), where alternating banana–aramid layers improved stress transfer and delayed crack propagation. The highest strength in Sample D was achieved through aramid-dominated load sharing, with banana fibers contributing to toughness and sustainability[35]. The stacking sequence thus plays a decisive role in tensile behavior, with aramid-rich and alternating designs outperforming banana-dominated laminates[36]. This trend is consistent with earlier studies on banana–aramid and other natural–synthetic hybrid laminates, where alternating or aramid-skinned configurations exhibited enhanced tensile strength due to improved interfacial stress transfer and delayed crack initiation (e.g., reported ranges of 30-42 MPa depending on stacking architecture)[36,37]. SEM analysis is expected to validate these results: Sample A should show fiber pull-out and poor adhesion, while Samples C and D are likely to display stronger bonding, fewer voids, and enhanced stress transfer. Figure 5a represents the tensile stress–strain curves of all the samples, while Figure 5b represents the flexural stress–strain curves of all the samples. As observed in Figure 4b, Sample A exhibited the lowest flexural strength of 21.5 MPa, while a progressive increase was observed for Samples B (32.5 MPa) and C (50 MPa). The significant improvement in flexural performance indicates enhanced load transfer and bending resistance with modified reinforcement. Sample D achieved the highest flexural strength of 54 MPa, demonstrating the most effective stress distribution and structural integrity under flexural loading. Tensile and flexural stress–strain responses improved progressively from Sample A to Sample D. Samples C and D exhibited higher stress at comparable strain, indicating delayed failure and better load transfer. Sample A showed lower stress at lower strain, reflecting inferior mechanical performance.
5.2 Compression strength results The compressive strength of the laminates strongly depended on fiber type and stacking configuration. As
Figure 4. (a) Tensile Strength Analysis; (b) Flexural Strength Analysis. 4/11
Polímeros, 36(3), e20250088, 2026
Effect of stacking sequence on banana-aramid hybrid laminate properties
Figure 5. (a) Tensile stress vs strain; (b) Flexural stress vs strain.
observed in Figure 6, The banana-only laminate (Sample A) showed the lowest strength of 34.59 MPa due to low fiber stiffness, lumen collapse, micro-buckling, and weak fiber–matrix adhesion. Introducing aramid surface plies in Sample B increased strength to 40.02 MPa (≈16% improvement) by enhancing compressive resistance and delaying matrix cracking. Sample C, with alternating banana–aramid layers, exhibited slightly lower strength (39.56 MPa) because banana fibers on the outer surfaces were prone to localized crushing. The highest compressive strength was achieved by Sample D (45.56 MPa), representing a 32% improvement, owing to aramid-dominated outer layers that reduced microbuckling, constrained matrix deformation, and ensured uniform stress distribution. Overall, these findings confirm that aramid-rich stacking, particularly with aramid at the surfaces, provides the most effective reinforcement strategy for maximizing compressive strength in hybrid laminates[38]. Similar improvements in compressive strength have been reported for natural–aramid hybrid epoxy systems, where high-modulus aramid outer plies suppressed fiber micro-buckling and matrix kinking, resulting in compressive strength gains of 25–35% over natural-fiber-only laminates[38,39].
5.3 Shore D hardness Hardness values reflected the contribution of aramid layers to surface stiffness which is shown in Figure 7. The banana-only laminate (Sample A) showed the lowest value of 57.25 due to lumen structure and weak adhesion. Adding aramid in Sample B raised hardness to 66.63, while Sample C was slightly lower (65.63) because banana occupied outer layers. The maximum hardness of 77 was achieved by Sample D, where aramid-dominated surfaces minimized micro-voids and improved stress transfer. This trend demonstrates that aramid placement at outer plies effectively improves surface rigidity and abrasion resistance[40]. Comparable hardness enhancement has been observed in aramid- and glass-fiber–modified natural fiber composites, where Shore D values increased with synthetic Polímeros, 36(3), e20250088, 2026
fiber surface dominance due to reduced porosity and improved load-bearing capability of the surface layers[40,41].
5.4 Impact strength results Impact strength also improved with aramid reinforcement. As we observe Figure 8, Sample A recorded the lowest value of 10.58 kJ/m2 due to brittle banana fracture and weak adhesion. Sample B increased to 12.92 kJ/m2, aided by aramid fibrillation and energy dissipation. Sample C showed an intermediate strength (11.73 kJ/m2) as banana outer layers were more prone to cracking. The best performance was achieved by Sample D (13.89 kJ/m2), which absorbed 31% more energy than Sample A through crack deflection and stress redistribution. These results highlight the superior toughness of aramid-rich hybrids[42]. The observed impact strength enhancement aligns well with previous studies on banana–aramid and jute–aramid hybrids, which attribute higher energy absorption to aramid fibrillation, crack deflection, and fiber bridging mechanisms under dynamic loading[42,43].
5.5 Water absorption results From the observation from Figure 9, we can tell that moisture uptake decreased markedly with aramid incorporation. The banana-only laminate absorbed 0.1587% water, while Sample B dropped to 0.0872% due to hydrophobic aramid barriers. Sample C absorbed slightly more (0.1025%) because banana plies were exposed at the surface. Sample D showed the lowest uptake (0.0712%), demonstrating that aramid-rich outer layers act as effective shields against water ingress and improve dimensional stability[44]. This behavior is in agreement with reported literature, where hydrophobic synthetic fiber skins significantly reduced moisture diffusion pathways in natural fiber composites, leading to reductions in water absorption of up to 40-60% compared to fully natural laminates[44,45].
5.6 Wear test results Wear tests revealed significant improvements in tribological resistance with aramid reinforcement. In Figure 10, The banana-only laminate (Sample A) suffered 5/11
Natarajan, R., Rangasamy, R., & Karuppusamy, M.
Figure 6. Compression Strength Analysis.
Figure 7. Shore D Hardness Analysis.
Figure 8. Impact Strength Analysis. 6/11
Polímeros, 36(3), e20250088, 2026
Effect of stacking sequence on banana-aramid hybrid laminate properties
Figure 9. Water Absorption Analysis.
Figure 10. Wear Rate Analysis.
the highest material loss (0.002875 g), while Sample B reduced wear to 0.00105 g owing to aramid’s superior abrasion resistance. Sample C (0.001275 g) performed better than A but worse than B due to banana on the surface. Sample D showed the least wear (0.0006 g), nearly 80% lower than Sample A, confirming the protective effect of aramid outer plies[46]. Similar reductions in wear loss have been documented in aramid-reinforced hybrid composites, where hard, wear-resistant aramid fibers at the sliding interface limited matrix removal and fiber fracture, thereby enhancing tribological durability[46,47].
5.7 Scanning Electron Microscopy (SEM) analysis SEM micrographs of the fractured surfaces provided insight into interfacial adhesion, fiber distribution, and failure mechanisms of the laminates. The banana-only laminate (Sample A, Figure 11) exhibited extensive fiber pull-out, matrix cracking, and micro-voids, indicating weak fiber–matrix bonding. Elongated voids around Polímeros, 36(3), e20250088, 2026
pulled-out fibers suggest inefficient stress transfer, consistent with its low tensile strength (16.60 MPa), high wear loss (0.002875 g), and higher water absorption (0.1587%). Hybrid laminates with aramid fibers showed marked improvements. Sample B (Figure 12), with aramid outer plies, displayed dense fracture surfaces with minimal voids and limited fiber pull-out, reflecting strong adhesion and effective load transfer, supporting higher tensile strength (24.48 MPa) and reduced wear loss (0.00105 g). Sample C (Figure 13), with alternating banana and aramid layers, exhibited mixed fracture features—banana-rich regions showed partial debonding, while aramid zones had cohesive failure, explaining intermediate performance. Sample D (Figure 14) had the most refined fracture morphology, with strong adhesion, restricted crack propagation, and aramid layers arresting cracks while banana fibers contributed stiffness, resulting in superior mechanical properties and wear resistance. 7/11
Natarajan, R., Rangasamy, R., & Karuppusamy, M.
Figure 11. Sample A.
Figure 12. Sample B.
Figure 13. Sample C. 8/11
Polímeros, 36(3), e20250088, 2026
Effect of stacking sequence on banana-aramid hybrid laminate properties
Figure 14. Sample D.
6. Conclusion This study assessed banana–aramid hybrid epoxy laminates with different stacking sequences, focusing on mechanical, tribological, and hygroscopic performance. Incorporating aramid fibers consistently enhanced properties over banana-only laminates. Aramid-rich laminates (Sample D) showed the highest tensile and compressive strength, superior hardness, improved impact resistance, lower water absorption, and enhanced wear resistance. SEM analysis confirmed stronger fiber–matrix adhesion and fewer voids in aramid-dominated laminates. Stacking-sequence design enables tailoring composites for specific applications, making aramid-rich hybrids ideal for lightweight, semi-structural uses. They offer a sustainable balance of strength, durability, and environmental resistance for automotive interior panels and engine covers, aerospace cabin panels, protective sports gear, machine casings, and electrical enclosures. Industrial challenges include the high cost of aramid fibers, moisture sensitivity of banana fibers, and complex layered fabrication. These can be mitigated through optimized fiber ratios, surface treatments, and automated layup or quality-control methods. Future work can focus on optimizing stacking sequences, incorporating nano-reinforcements, enhancing thermal and environmental durability, and scaling up production to expand practical applications while maintaining sustainability.
7. Author’s Contribution • Conceptualization – Ramachandran Natarajan • Data curation – Ramachandran Natarajan; Ramamoorthi Rangasamy • Formal analysis – Ramachandran Natarajan • Funding acquisition - NA • Investigation – Ramachandran Natarajan • Methodology – Ramachandran Natarajan Polímeros, 36(3), e20250088, 2026
• Project administration – Ramachandran Natarajan; Ramamoorthi Rangasamy • Resources – Ramachandran Natarajan; Ramamoorthi Rangasamy • Software – NA • Supervision – Ramachandran Natarajan • Validation – Ramachandran Natarajan; Ramamoorthi Rangasamy • Visualization – Ramachandran Natarajan; Manickaraj Karuppusamy • Writing – original draft – Ramachandran Natarajan; Manickaraj Karuppusamy • Writing – review & editing – Ramachandran Natarajan; Manickaraj Karuppusamy
8. References 1. Thorat, Y. V., Chavan, S. S., Mohite, D. D., & Pawar, U. S. (2024). Development of eco-friendly bio-composites using banana fibers for enhanced tensile and flexural properties. Materials Today: Proceedings, In press. https://doi.org/10.1016/j. matpr.2024.04.061. 2. Alsenani, S. M. H., Nazeer, A., Khidhir, B. A., Al Raqqadi, S., & Al Mawaali, J. (2024). Tensile behavior of date and banana fiber-reinforced sustainable green hybrid composites. Journal of Materials Science Research and Reviews, 7(4), 846-855. https://doi.org/10.9734/jmsrr/2024/v7i4371. 3. Imran, A. I., Delly, J., Samhuddin, Manalu, J., Jonathan, J., Numberi, A., & Safanpo, A. (2023). A review of banana fiber: impact of treatment, filler materials, hybrid composite, and application. Journal of Innovation and Technology, 2023(27), 1-12. https://doi.org/10.61453/joit.v2023no27. 4. Manickaraj, K., Ramamoorthi, R., Karuppasamy, R., Sakthivel, K. R., & Vijayaprakash, B. (2024). A review of natural biofiber-reinforced polymer matrix composites. In K. Muduli, S. K. Rout, S. Sarangi, S. M. N. Islam, & A. Mohamed (Eds.), Evolutionary manufacturing, design and operational practices for resource and environmental sustainability (pp. 135–141). Hoboken: Wiley. https://doi. org/10.1002/9781394198221.ch11. 9/11
Natarajan, R., Rangasamy, R., & Karuppusamy, M. 5. Tengsuthiwat, J., Raghunathan, V., Ayyappan, V., Techawinyutham, L., Srisuk, R., Yorseng, K., Rangappa, S. M., & Siengchin, S. (2024). Lignocellulose sustainable composites from agro-waste Asparagus bean stem fiber for polymer casting applications: effect of fiber treatment. International Journal of Biological Macromolecules, 278(Part 3), 134884. https://doi.org/10.1016/j. ijbiomac.2024.134884. PMid:39168200. 6. Raghunathan, V., Ayyappan, V., Dhilip, J. D. J., Sundarrajan, D., Rangappa, S. M., & Siengchin, S. (2024). Influence of alkali-treated and raw Zanthoxylum acanthopodium fibers on the mechanical, water resistance, and morphological behavior of polymeric composites for lightweight applications. Biomass Conversion and Biorefinery, 14(19), 24345-24357. https://doi.org/10.1007/s13399-023-04240-7. 7. Raghunathan, V., Gnanasekaran, S., Ayyappan, V., Devanathan, L. S., Rangappa, S. M., & Sienghcin, S. (2024). Sustainable characterization of brake pads using raw/silane‐treated Mimosa pudica fibers for automobile applications. Polymer Composites, 45(11), 10204-10219. https://doi.org/10.1002/pc.28467. 8. Sumesh, K. R., & Kanthavel, K. (2022). Optimizing various parameters influencing mechanical properties of banana/coir natural fiber composites using grey relational analysis and artificial neural network models. Journal of Industrial Textiles, 51(4), 6705S-6727S. https://doi.org/10.1177/1528083720930304. 9. Sivanantham, G., Ayyappan, V., Loganathan, P., Mani, S. K., Vijaya, G. S., Raghunathan, V., Rangappa, S. M., & Siengchin, S. (2025). Sustainable hybrid composites from flax, vetiver, and Luffa cylindrica: acoustic and structural performance. Polymer Composites, 46(14), 12818-12834. https://doi.org/10.1002/ pc.29900. 10. Raghunathan, V., Palani, K., Shinu, P., Dhilip, J. D. J., Yoganjaneyulu, G., & Ganesh, S. (2022). Influence of Parthenium hysterophorus and Impomea pes-caprae fibers stacking sequence on the performance characteristics of epoxy composites. Journal of Natural Fibers, 19(12), 4456-4466. https://doi.org/10.1080/15440478.2020.1863292. 11. Ganesh, S., Gunda, Y., Mohan, S. R. J., Raghunathan, V., & Dhilip, J. D. J. (2022). Influence of stacking sequence on the mechanical and water absorption characteristics of areca sheath-palm leaf sheath fibers reinforced epoxy composites. Journal of Natural Fibers, 19(5), 1670-1680. https://doi.org/ 10.1080/15440478.2020.1787921. 12. Swaroop, D. V., Raju, D. M., Yaswanth, C., & Jenarthanan, M. P. (2022). Analysis of mechanical properties of banana-jute hybrid fiber reinforced epoxy composite by varying stacking sequence. International Journal for Research in Applied Science and Engineering Technology, 10(3), 429-438. https://doi.org/10.22214/ijraset.2022.40581. 13. Nguyen, T. A., & Nguyen, T. H. (2022). Study on mechanical properties of banana fiber-reinforced poly(lactic acid) composites. International Journal of Chemical Engineering, 2022(1), 8485038. https://doi.org/10.1155/2022/8485038. 14. Manickaraj, K., Thirumalaisamy, R., Palanisamy, S., Ayrilmis, N., Massoud, E. E. S., Palaniappan, M., & Sankar, S. L. (2025). Value-added utilization of agricultural wastes in biocomposite production: characteristics and applications. Annals of the New York Academy of Sciences, 1549(1), 72-91. https://doi.org/10.1111/nyas.15368. PMid:40376963. 15. Sampath, B., Naveenkumar, N., Sampathkumar, P., Silambarasan, P., Venkadesh, A., & Sakthivel, M. (2022). Experimental comparative study of banana fiber composite with glass fiber composite material using Taguchi method. Materials Today: Proceedings, 49(Part 5), 1475-1480. https://doi.org/10.1016/j. matpr.2021.07.232. 16. Karthick, L., Sivakumar, S., Sasikumar, A., Prabhu, A., Senthil Kumar, J., & Vadivukarasi, L. (2022). A comparison and 10/11
analysis of mechanical properties of glass fiber and banana fiber composite. Materials Today: Proceedings, 52(Part 3), 398-402. https://doi.org/10.1016/j.matpr.2021.09.073. 17. Anbarasu, N. A., & Karuppusamy, M. (2025). A review of sustainable construction and waste management: brick manufacturing using agro-industrial wastes. Zaštita Materijala, 66(4), 913-927. https://doi.org/10.62638/ZasMat1354. 18. Gokul, S., Ramakrishnan, T., Manickaraj, K., Devadharshan, P., Mathew, M. K., & Prabhu, T. V. (2024). Analyzing challenges and prospects for sustainable development with green energy: a comprehensive review. AIP Conference Proceedings, 3221(1), 020043. https://doi.org/10.1063/5.0235884. 19. Banu, M., Madhavan, V. R. B., Manickam, D., & Devarajan, C. (2021). Experimental investigation on stacking sequence of Kevlar and natural fibres/epoxy polymer composites. Polímeros: Ciência e Tecnologia, 31(1), e2021004. https://doi.org/10.1590/0104-1428.04320. 20. Manickaraj, K., Nithyanandhan, T., Sathish, K., Karuppasamy, R., & Sachuthananthan, B. (2024). An experimental investigation of volume fraction of natural Java jute and sponge gourd fiber reinforced polymer matrix composite. In International Conference on Advanced Computing and Communication Systems (ICACCS), Coimbatore, India. New York: IEEE. https://doi.org/10.1109/ICACCS60874.2024.10717221. 21. Murugan, K., Venkatesh, S., Thirumalai, R., & Nandhakumar, S. (2021). Fabrication and investigations of kenaf fiber and banana fiber reinforced composite material. Materials Today: Proceedings, 37(Part 2), 110-114. https://doi.org/10.1016/j. matpr.2020.04.540. 22. Manickaraj, K., Ramamoorthi, R., Karuppasamy, R., Kannan, S., & Vijayaprakash, B. (2024). Experimental investigation of steel and porous Al foam LM vehicle leaf spring by using mechanical and computer method. In K. Muduli, S. K. Rout, S. Sarangi, S. M. N. Islam, & A. Mohamed (Eds.), Evolutionary manufacturing, design and operational practices for resource and environmental sustainability (pp. 107-112). Hoboken: Wiley. https://doi.org/10.1002/9781394198221.ch8. 23. Subramanya, R., Sathyanarayana, P., Kn, M., & Naik, S. (2022). The manufacture and characterisation of short banana fibre-reinforced polymer composites. Advances in Materials and Processing Technologies, 8(1), 797-807. https://doi.org/ 10.1080/2374068X.2020.1833403. 24. Karuppusamy, M., Kalidas, S., Palanisamy, S., Nataraj, K., Nandagopal, R. K., Natarajan, R., Samraj, A., Ayrilmis, N., Sahu, S. K., Giri, J., & Kanan, M. (2025). Real-time monitoring in polymer composites: internet of Things integration for enhanced performance and sustainability-A review. BioResources, 20(3), 8093-8118. https://doi.org/10.15376/biores.20.3.Karuppusamy. 25. Dinesh, S., Elanchezhian, C., Vijayaramnath, B., Sathiyanarayanan, K., & Adinarayanan, A. (2020). Experimental investigation of banana bract fiber and palm fiber reinforced with epoxy hybrid composites. Materials Today: Proceedings, 22(Part 3), 335-341. https://doi.org/10.1016/j.matpr.2019.06.633. 26. Muralikrishna, M. V. V., Surya Kumari, T. S. A., Gopi, R., & Loganathan, G. B. (2019). Development of mechanical properties in banana fiber composite. Materials Today: Proceedings, 22(Part 3), 541-545. https://doi.org/10.1016/j. matpr.2019.08.189. 27. Venkatasudhahar, M., Kishorekumar, P., & Raja, N. D. (2020). Influence of stacking sequence and fiber treatment on mechanical properties of carbon-jute-banana reinforced epoxy hybrid composites. IJPAC. International Journal of Polymer Analysis and Characterization, 25(4), 238-251. https://doi.or g/10.1080/1023666X.2020.1781481. 28. Margabandu, S., & Subramaniam, S. (2019). Experimental evaluation and numerical validation of bending and impact Polímeros, 36(3), e20250088, 2026
Effect of stacking sequence on banana-aramid hybrid laminate properties behaviours of hybrid composites with various stacking arrangements. Materials Research Express, 6(12), 125305. https://doi.org/10.1088/2053-1591/ab54e7. 29. Sathish, K., Manickaraj, K., Krishna, S. A., Basha, K. M., & Pravin, R. (2024). Integrating sustainable materials in exoskeleton development: a review. AIP Conference Proceedings, 3221(1), 020021. https://doi.org/10.1063/5.0235913. 30. Bakri, M. K. B., Jayamani, E., & Hamdan, S. (2017). Processing and characterization of banana fiber/epoxy composites: effect of alkaline treatment. Materials Today: Proceedings, 4(2), 2871-2878. https://doi.org/10.1016/j.matpr.2017.02.167. 31. Muktha, K., & Keerthi Gowda, B. S. (2019). Investigation of water absorption and fire resistance of untreated banana fibre reinforced polyester composites. Materials Today: Proceedings, 4(8), 8307-8312. https://doi.org/10.1016/j.matpr.2017.07.173. 32. Vijayan, C. N., Ramasamy, K., Karuppusamy, M., & Sivanantham, G. (2025). Mechanical, tribological and corrosion behaviour of stir compocast Al 6063 composites: impact of cenosphere reinforcement. Surface Review and Letters, 2025, 2550185. https://doi.org/10.1142/S0218625X25501859. 33. Rajkumar, D. R., Karthik, S., & Santhy, K. (2022). Evaluation of mechanical and thermal properties of banana/aramid/E-glass powder hybrid composite plate. In A. K. Parwani, P. Ramkumar, K. Abhishek, & S. K. Yadav (Eds.), Recent advances in mechanical infrastructure, lecture notes in intelligent transportation and infrastructure (pp. 383-394). Singapore: Springer. https://doi. org/10.1007/978-981-16-7660-4_34. 34. Sudhan, K., Deepak, S., & Karthick, R. (2016). Sustainability analysis of Kevlar and banana fiber composite. International Research Journal in Global Engineering and Sciences, 1(3), 70-84. Retrieved in 2019, October 19, from http://www.irjges. com/Volume1Issue3/paper12.pdf. 35. Krishnadas, G., Karuppasamy, R., Selvam, S., & Manickaraj, K. (2024). Evolving sandwich composites through structural modifications with polyurethane foam and glass fiber. Matéria, 29(4), e20240507. https://doi.org/10.1590/15177076-rmat-2024-0507. 36. Manickaraj, K., Karthik, A., Palanisamy, S., Jayamani, M., Ali, S. K., Sankar, S. L., & Al-Farraj, S. A. (2025). Improving mechanical performance of hybrid polymer composites: incorporating banana stem leaf and jute fibers with tamarind shell powder. BioResources, 20(1), 1998-2025. https://doi. org/10.15376/biores.20.1.1998-2025. 37. Ramesh, M., Atreya, T. S. A., Aswin, U. S., Eashwar, H., & Deepa, C. (2014). Processing and mechanical property evaluation of banana fiber reinforced polymer composites. Procedia Engineering, 97, 563-572. https://doi.org/10.1016/j. proeng.2014.12.284. 38. Badrinath, R., & Senthilvelan, T. (2014). Comparative investigation on mechanical properties of banana and sisal reinforced polymer based composites. Procedia Materials Science, 5, 2263-2272. https://doi.org/10.1016/j.mspro.2014.07.444. 39. Thangavel, N., Shanmugavel, N. K., Karuppusamy, M., & Thirumalaisamy, R. (2024). Friction and wear behavior of premixed reinforcement hybrid composite materials. Matéria
Polímeros, 36(3), e20250088, 2026
(Rio de Janeiro), 29(4), e20240552. https://doi.org/10.1590/15177076-rmat-2024-0552. 40. Ramakrishnan, T., Manickaraj, K., Prithiv, S. P., Aditya, S. L. L., Rajanarayanan, N., & Gopalsamy, S. (2024). Advancements in aluminum metal matrix composites: reinforcement, manufacturing, and applications. AIP Conference Proceedings, 3221(1), 020030. https://doi.org/10.1063/5.0235881. 41. Aruchamy, K., Karuppusamy, M., Krishnakumar, S., Palanisamy, S., Jayamani, M., Sureshkumar, K., Ali, S. K., & Al-Farraj, S. A. (2025). Enhancement of mechanical properties of hybrid polymer composites using Palmyra palm and coconut sheath fibers: the role of tamarind shell powder. BioResources, 20(1), 698-724. https://doi.org/10.15376/biores.20.1.698-724. 42. Subramanian, L. S., Palanisamy, S., Karuppusamy, M., Azeez, A., Kashif Ali, S., Kalathil, S., Abbas, M., Alfarraj, S. A., & Ali Alharbi, S. (2026). Eco-friendly hybrid epoxy composites reinforced with snake grass fiber and dual agro-waste fillers for enhanced mechanical and acoustic performance. BioResources, 21(2), 3636-3649. https://doi.org/10.15376/ biores.21.2.3622-3649. 43. Karuppusamy, M., Thirumalaisamy, R., Palanisamy, S., Nagamalai, S., Massoud, E. E. S., & Ayrilmis, N. (2025). A review of machine learning applications in polymer composites: advancements, challenges, and future prospects. Journal of Materials Chemistry. A, Materials for Energy and Sustainability, 13(22), 16290-16308. https://doi.org/10.1039/D5TA00982K. 44. Manickaraj, K., Aravind, S., Ramakrishnan, T., Sudha, N., Ramamoorthi, R., & Nithyanandhan, T. (2024). Advancing polymer composites through computational learning and artificial intelligence integration. In 2024 International Conference on Emerging Research in Computational Science (ICERCS), Coimbatore, India. New York: IEEE. https://doi. org/10.1109/ICERCS63125.2024.10895062. 45. Gurusamy, M., Thirumalaisamy, R., Karuppusamy, M., & Sivanantham, G. (2025). Pistachio shell biochar as a reinforcing filler in short Turkish hemp fiber composites: A path toward sustainable materials. Journal of Polymer Research, 32(4), 110. https://doi.org/10.1007/s10965-025-04338-8. 46. Gurusamy, M., Soundararajan, S., Karuppusamy, M., & Ramasamy, K. (2024). Exploring the mechanical impact of fine powder integration from ironwood sawdust and coco dust particles in epoxy composites. Matéria, 29(3), e20240216. https://doi.org/10.1590/1517-7076-rmat-2024-0216. 47. Ravichandran, G., Ramasamy, K., Manickaraj, K., Kalidas, S., Jayamani, M., Mausam, K., Palanisamy, S., Ma, Q., & Al-Farraj, S. A. (2025). Effect of sal wood and babool sawdust fillers on the mechanical properties of snake grass fiber-reinforced polyester composites. BioResources, 20(4), 8674-8694. https:// doi.org/10.15376/biores.20.4.8674-8694. Received: Oct. 19, 2025 Revised: Feb. 05, 2026 Accepted: Mar. 25, 2026 Associate Editor: José A. C. G. Covas
11/11
ISSN 1678-5169 (Online)
https://doi.org/10.1590/0104-1428.20250121
Impact of different surfactants on chitosan/sodium alginate films reinforced with bergamot oil Aditya Gupta1 , Muhammad Jawad1 , Ahmed Al-Harrasi1 and Saurabh Bhatia1,2* Natural and Medical Sciences Research Center, University of Nizwa, Nizwa, Oman School of Health Science, University of Petroleum and Energy Studies, Dehradun, India 1
2
*sbsaurabhbhatia@gmail.com
Abstract Active packaging often contains essential oils and plant extracts, which are predominantly hydrophobic. Surfactants are added to stabilize the matrix, improve the dispersion, and ultimately enhance the effectiveness of the active compounds. In the present study evaluate how different surfactants affect Bergamot essential oil incorporated into chitosan and sodium alginate-based packaging film. The incorporation of surfactants leads to enhancement in film thickness and elongation at break, and tensile strength was reduced, which is attributed to altered intermolecular hydrogen bonding and increased chain mobility. XRD and FTIR analyses revealed chemical interactions between additives and polymeric chains that reduced crystallinity and peak intensities. Furthermore, optical, color, and functional properties including water vapor transmission rate (WVTR), swelling index, water contact angle, and antioxidant activity were analyzed. Overall, the results demonstrated that the strategic selection of surfactant enables the development of high-performance material for sustainable active packaging applications. Keywords: eco-friendly packaging, green packaging, essential oil-based packaging, active packaging. Data Availability: All data supporting the findings of this study are available from the corresponding author upon request. How to cite: Gupta, A., Jawad, M., Al-Harrasi, A., & Bhatia, S. (2026). Impact of different surfactants on chitosan/ sodium alginate films reinforced with bergamot oil. Polímeros: Ciência e Tecnologia, 36(3), e20260026. https://doi. org/10.1590/0104-1428.20250121
1. Introduction At present, plastic packaging production and usage have increasing exponentially due to its low cost, lightweight, and durability. A report published by Plastics Europe showed that in 2018, global plastic production was 370.6 Mt, out of which 339.4 Mt was derived from petroleum-based plastics, and the rest was chemically or mechanically recycled. In 2023 inforgraphics reported that 400.3 Mt global plastic production[1]. A report from Ellen MacArthur Foundation, the World Economic Forum, and McKinsey says plastic production rose to 311 million tonnes in 2014 and is expected to triple by 2050[2]. The benefits of using traditional plastic as a food packaging material are durability, safety, low cost, and lightweight during transportation and storage, which extend the product’s shelf-life, reduce energy consumption, and prevent food wastage[3]. Petroleum derived plastics are non- renewable and are associated with pollution and lifecycle-emission concerns[4,5]. Packaging is a major contributor to plastic waste streams such as single-use containers, disposable packaging, wrapping materials, cushioning materials, etc.[6]. Consequently, these limitations of traditional petroleum-based plastics have driven extensive research toward biobased polymers that could offer comparable performance and enhanced environmental compatibility.
Polímeros, 36(3), e20260026, 2026
Biopolymers are derived from natural resources, which makes them renewable, low-toxic, biodegradable, and have a lower environmental impact. The biopolymers such as starch, cellulose, etc., are derived from agricultural resources, whereas several biopolymers are also derived from the fermentation process[7]. Chitosan (CA) is derived from chitin, which is extracted from crab shells and shrimp shells. It is a natural polysaccharide that shows good film-forming ability, barrier against CO2 and O2, biodegradability, and biocompatibility. The limitation of using CA film in food packaging is due to higher water vapor permeability, flexibility, and ductility[8]. Sodium alginate (SA) is extracted from brown algae. It is a natural anionic polysaccharide that shows good film-forming ability and flexibility[9]. The limitation of using SA in food packaging is due to its higher water vapor permeability, water solubility, and heat sealing ability[10]. Thus designing stable composite material of these oppositely charged polymers based on polyelectrolyte complexation is an promising approach to overcome the challenges faced by both pure polymers. Recent trend in active food packaging demonstrated the utilization of essential oil to improve the shelf life of the targeted food. However uniform dispersion of essential oil in the polymer matrix is always challenging. Thus several surfactants have been utilized to improve the dispersion of the essential oil in the polymeric matrix.
1/10
O O O O O O O O O O O O O O O O
Gupta, A., Jawad, M., Al-Harrasi, A., & Bhatia, S. Surfactants or emulsifiers are added to the polymeric solution to improve functional properties in the film by increasing the dispersion of essential oil, such as water vapor permeability, flexibility, hydrophobicity, etc.[11]. There are four types of surfactants such as non-ionic, anionic, cationic, and amphoteric. Span 80 or Sorbitan monooleate is a non-ionic and hydrophobic surfactant having a low Hydrophilic-Lipophilic Balance (HLB) value of 4.3[12]. Non-ionic surfactants do not carry an ionic charge when dissolved in water, which makes them compatible with a wide range of polymers[13]. Tween 80 or polysorbate 80 is a non-ionic surfactant approved by the Food and Drug Administration (FDA) with a high HLB value of approximately 15.0[14]. Lecithin is an amphoteric biobased surfactant found in all living organisms. Lecithin act as an emulsifier and an antioxidant in different preparations[15]. This study aimed to evaluate the impact of various surfactants on the physical, chemical, mechanical, optical, and functional properties of CA, SA, and Bergamot essential oil (BEO) based films.
2. Materials and Methods 2.1 Materials CA, SA, Glycerol (99% pure), Tween 80 extra pure, and Lecithin ex. Soya, 30% was purchased from Sisco Research Laboratories Pvt. Ltd., Andheri, India. Span 80 was purchased from Yakuri Pure Chemicals Co., Ltd., Kyoto, Japan. BEO was purchased from Nature Natural India, based in Uttar Pradesh, India.
48 hours at a temperature of 27 °C. After complete drying of the films they were peeled off and stored in a desiccator for further analysis.
2.3 Characterization 2.3.1 Thickness test The thickness of the fabricated film samples was measured using a Digital micrometer (Dequmont digital vernier caliper (ROHS NORM 2011/65/EU)). The measurements were randomly tested at 10 different positions, and the mean values were used for further analysis. 2.3.2 Mechanical test The mechanical properties of the fabricated film sample were determined by using a Texture Analyzer model TA. XT Plus, Stable Micro System from Godalming, UK. The mechanical properties, such as tensile strength and elongation at break, of the fabricated film samples were determined using ASTM D882-95[16] standard protocol. The film samples were stored and conditioned at RH 50% and temperature 25 °C for 40 hours in order to stabilize the water content in Biobase, China. The dimension of the film samples that were used to determine the mechanical strength was 70 mm × 7 mm. The testing was conducted on rectangular strips using crosshead speed was 30 mm/min, and the distance between the opposite grips was 60 mm. The tensile strength and elongation at break values were calculated by using Exponent Connect Software. 2.3.3 Morphological test
2.2 Fabrication of film samples CA (1.5% w/v) was dissolved in 1% acetic acid solution. The mixture marked as C1 was then stirred using a magnetic stirrer at a temperature of 30 °C for 3 hours. Simultaneously, SA of concentration 1.5% (w/v) was dissolved in distilled water. This mixture marked as S1 was then stirred using a magnetic stirrer at a temperature of 30 °C for 3 hours. Once both components were fully dissolved, the C1 and S1 solutions were mixed with 0.5% (v/v) of glycerol. After complete mixing of glycerol with C1 and S1 the solutions were divided into four equal parts and named CSS1, CSS2, CSS3, and CSS4. Then, 1% (v/v) bioactive compound BEO was added with different surfactants as mentioned in Table 1 in CSS2, CSS3, and CSS4 solutions. This is followed by ultrasonication of film forming solution, using an ultrasonicator (Sonoplus Bandelin, Germany) for 20 min, mainly for the complete dispersion of the essential oil. Later on all the solutions were poured into a separate petri dish and marked. The petri dishes were allowed to air dry for
The change in the morphology of the fabricated film sample caused by the addition of BEO, Span 80, Tween 80, and Lecithin in the polymeric solution of CA and SA was studied using scanning electron microscopy of model JSM6510 LA, JEOL, Japan. Its operated at an accelerating voltage of 20 kV. On the fixed aluminum stubs, film specimens were placed using double-sided carbon adhesive. The prepared samples were sputter-coated with a very thin layer of gold before SEM imaging to improve surface conductivity and resulting in better resolution and clarity. 2.3.4 Color and opacity tests The color and opacity of the fabricated film sample were analyzed by using Chroma Meter (CR-410), Konica Minolta, Japan. The color parameters, including lightness (L*), redness–greenness (a*), and yellowness–blueness (b*) were recorded. The total difference in the color (∆E) was measured by Equation (1):
Table 1. The composition ratios of the components used to fabricate edible films.
2/10
Sample Code
Chitosan
Sodium Alginate
CSS1 CSS2 CSS3 CSS4
1.5% 1.5% 1.5% 1.5%
1.5% 1.5% 1.5% 1.5%
Bergamot essential oil 1% 1% 1%
Surfactant
Glycerol
Span 80 (1%) Tween 80 (1%) Lecithin (1%)
0.5% 0.5% 0.5% 0.5%
Polímeros, 36(3), e20260026, 2026
Impact of different surfactants on chitosan/sodium alginate films reinforced with bergamot oil
∆E =
∆L 2 + ∆a 2 + ∆b 2
(1)
∆p is the water vapor difference (Pa), d is the thickness of the film sample (mm).
2.3.5 Transmittance and haze tests
2.3.10 Antioxidant test
The transmittance and haze of the fabricated film samples were measured by using a YH1200 haze meter (3nh, China). To ensure measurement accuracy, the film samples were carefully aligned with the instrument’s measuring aperture to provide complete coverage.
The antioxidant properties of the film samples (CSS1– CSS4) were evaluated based on their DPPH radical scavenging activity, following the procedure described in the previous study[18]. The absorbance of the reaction solution was measured using a spectrophotometer at a wavelength of 517 nm. All measurements were performed in triplicate, and the mean inhibition percentage was used for further analysis.
2.3.6 X-Ray diffraction test To investigate the phase composition and crystalline structure of the fabricated film sample modified with BEO, Span 80, Tween 80, and Lecithin, X-ray diffraction (XRD) was performed using a Bruker D8 Discover diffractometer. The system utilized a Cu Kα radiation source (λ = 1.5418Å) operating at 40 kV. The crystallinity index was subsequently calculated using OriginPro software according to the formula described in Equation (2). CI (%) =
Total area of the crystalline peaks X 100 (2) Total area of the amorphous and crystalline peaks
2.3.7 FTIR spectrometry The Fourier Transform Infrared (FTIR) spectroscopy was used to investigate the chemical interaction between the polymeric chains, essential oil, and surfactant. Spectra were recorded using a Bruker Tensor 37 FTIR spectrometer (Ettlingen, Germany) over a range of 4000–400 cm-1 at a resolution of 4 cm-1. 2.3.8 Swelling test The swelling index of the fabricated film samples was assessed following the method of Erdem et al.[17]. Film samples of size 2 × 2 cm2 were cut and the intitial weight (w1) was recorded. At a temperature of 25 °C for 2 min, the film samples were dipped in deionized water. The final weight (w2) was measured after removing the excess water. The swelling index was calculated by using Equation (3) Swelling Index =
w2 − w1 X 100 w1
(3)
2.3.9 Water vapor transmission rate test The Water Vapor Transmission Rate (WVTR) of the fabricated film samples was assessed by gravimetrically method followed by Erdem et al.[17]. A glass cup of inner diameter 5 cm and depth 2 cm was used and film samples were sealed over the cups. To generate a vapor pressure gradient, the internal environment was maintained at near 0% relative humidity (RH) using anhydrous silica gel, while the external environment was kept at 25 ± 2 °C and 75% RH (using saturated sodium chloride solution). The WVTR was then calculated according to Equation (4). WVTR =
∆m
( ∆t )( ∆p )( A )
Xd
(4)
Here, ∆m/∆t is the rate of moisture accumulation (kg/s), A is the surface area of the film sample (m2),
Polímeros, 36(3), e20260026, 2026
2.3.11 Water contact angle The surface hydrophobicity of the fabricated films (CSS1–CSS4) was evaluated by measuring the water contact angle using an OCA15 goniometer (DataPhysics Instruments GmbH, Germany). Each film sample was cut into a 2 × 2 cm2 and placed on the flat surface of the stage. Water (deionized) droplet of 1 µL was deposited on the centre of each film sample. The contact angle was measured by using dpiMAX software. 2.3.12 GC-MS Gas chromatograph mass spectrometer (GC-MS) model no. Shimadzu GCMS-QP-2010 Plus was used to determine the chemical composition of BEO, following the previous procedure[19]. Bioactive constituents were identified by comparing their retention times and retention indices with library mass spectra. 2.3.13 Statistical analysis All experiments were conducted in triplicate, and results are expressed as the mean ± standard error. Statistical significance was assessed using one-way analysis of variance (ANOVA) followed by Fisher’s post-hoc test.
3. Results and Discussions 3.1 Thickness analysis The thickness of a packaging material is an important characteristic that directly affects the tensile strength, water vapor permeability, and optical properties. The impact of different surfactants and BEO in the polymer matrix of CA and SA was analyzed, and the results are shown in Table 2. In the fabricated film samples, the thickness is increased with the addition of surfactant and essential oil. The control sample, consisting of CA and SA (CSS1) has an average thickness of 0.06 mm. The addition of BEO and the surfactants Span 80, Tween 80, and Lecithin increased the film thickness by 0.08 mm, 0.08 mm, and 0.09 mm, respectively. Non-ionic surfactants, such as Tween 80 and Span 80, may form aggregates or micelles with in the film resulting in the increase in the film thickness of CSS2 and CSS3[20]. The CSS4 film contain Lecithin which is an ionic surfactant and has a bulky structure, which could contribute to its higher thickness than other fabricated films[21]. There are various other studies reported earlier, where the effect of various surfactants in the polymeric solution casted film is mentioned[22-24]. 3/10
Gupta, A., Jawad, M., Al-Harrasi, A., & Bhatia, S. 3.2 Mechanical analysis The mechanical properties are mainly tensile strength (TS) and elongation at break (EB) of the fabricated film samples were analyzed and represented in Table 2. With the addition of surfactants in the polymeric solution, TS of the resultant film decreased whereas EB increased. The control sample (CSS1), demonstrated TS 19.69 MPa and EB 75.53%. The addition of surfactant in the polymeric solutions resulted in the significant drop in TS values with CSS2, CSS3 and CSS3 showed 9.53 MPa, 9.44 MPa, and 9.87 MPa. However, addition of surfactant caused significant increase in EB values of CSS2 (74.86%), CSS3 (70.65%) and CSS4 (70.11%). The mechanical properties of the film CSS2 and CSS3 decreased due to weakening of intermolecular hydrogen bonding. Tween 80 has higher HLB value (hydrophile-lipophile balance) than Span 80[25]. Lecithin is an ionic surfactant that forms electrostatic bonding with the CA and SA, forming bulky structure and resulting in less reduction in the TS when compared to CSS2 and CSS3 film samples[11,26]. EB of the surfactant added film samples increased due to the increase in chain mobility leading to increase in free volume in the polymer matrix[27].
Table 3 represents color analysis of the fabricated films. The L* value represents the lightness, a* value signifies redness–greenness and b* value signifies yellowness– blueness. The addition of Span 80 to the polymeric solution decreased the lightness and b* value, whereas the a* value was increased. This is due to the addition of essential oil and surfactant that may have increased the reddish-blue hue, resulting in increase in slight darkness in the film. Similar results were found in the previous studies[25,28]. The CSS 3 film sample showed maximum lightness with the increase in a* value whereas b* value decreased. Similar results were found in previous study[29]. In the CSS 4 film sample, the lightness increased with an increase in b* value, whereas the a* value decreased which could be attributed to the brown color of lecithin added[30].
3.5 Scanning electron microscopy analysis
The results of transmittance and haze of the fabricated film samples were analyzed and demonstrated in Table 3. The CSS1 sample, consisting of CA and SA, showed a transmittance value of 83.73% and a haze value of 72.23%, whereas upon the addition of essential oils and surfactant, the transmittance changed. In the CSS 2 sample, consisting of Span 80 showed transmittance was 85.03% and the haze value of 63.78%. Moreover, the CSS 3 sample, consisting of Tween 80 showed transmittance value of 85.08% and the haze value of 46.31%. In addition, CSS 4 sample, consisting of Lecithin showed the transmittance 81.37% and the haze value of 83.42%. The CSS 4 sample demonstrated minimum transmittance due to increased scattering of incident light, which may be attributed to bulky structure of Lecithin.
The scanning electron microscopy (SEM) images demonstrate the surface morphology and cross-sectional images of the fabricated film samples. The SEM images of all films with BEO and different surfactant are demonstrated in Figure 1. The CSS 1 film sample image indicates the rough, homogeneous, and uniform surface characteristics which may be attributed to the electrostatic interaction between the chitosan and alginate, as reported earlier[31]. The cross-sectional image indicates that there are no pores and phase separation in control film samples. The CSS 2 film sample indicates the surface is smooth, homogenous, and uniform, whereas the cross-section image indicates smoother edges and no phase separation. This may be associated with addition of Span 80, which is lipophilic in nature. The CSS 3 film sample indicates the surface is smooth, homogeneous, and uniform, whereas the crosssectional image indicates rough edges. This is due to Tween 80, which is highly hydrophilic in nature. The CSS 4 film sample indicates that the surface is smooth, homogeneous, and uniform, whereas the cross-sectional image indicates that smoother edges and uniform. This is due to lecithin, which is amphiphilic and ionic in nature.
3.4 Color analysis
3.6 X-Ray diffraction analysis
3.3 Transmittance and haze analysis
Table 2. Thickness, tensile strength, and elongation at break of the fabricated film samples. Sample CSS1 CSS2 CSS3 CSS4
Thickness (mm) 0.060 ±0.005c 0.080 ±0.005ab 0.080 ±0.005b 0.090 ±0.005a
Tensile Strength (MPa) 19.69 ±0.66a 9.53 ±2.41b 9.44 ±0.47b 9.87 ±0.67b
Elongation at Break (%) 75.53 ±1.78a 74.86 ±1.66a 70.65 ±0.59b 70.11 ±0.55b
The values with different letters (a,b and c) inside a column indicate significant differences (p < 0.05).
Table 3. Transmittance, Haze, and Color of the fabricated film samples. Sample CSS1 CSS2 CSS3 CSS4
Transmittance (%) 83.73 ± 1.40ab 85.03 ± 1.13ab 85.08 ± 2.65a 81.37 ± 2.23b
Haze (%) 72.23 ± 1.18b 63.78 ± 6.16c 46.31 ± 4.13d 83.42 ± 0.71a
L* 85.49 ± 0.08c 84.63 ± 0.59d 87.71 ± 0.28a 86.12 ± 0.23b
a* 0.25 ± 0.17bc 0.84 ± 0.12a 0.42 ± 0.10b 0.16 ± 0.05c
b* 4.66 ± 0.47b 3.30 ± 0.39c 4.14 ± 0.76b 6.81 ± 0.40a
ΔE 2.53 ± 0.05b 2.83 ± 0.09c 2.13 ± 0.12a 1.93 ± 0.03d
The values with different letters (a,b,c and d) inside a column indicate significant differences (p < 0.05).
4/10
Polímeros, 36(3), e20260026, 2026
Impact of different surfactants on chitosan/sodium alginate films reinforced with bergamot oil
Figure 1. SEM images of fabricated film samples.
The crystallinity of the fabricated film samples was determined by X-ray diffraction analysis. The results are analyzed and demonstrated in Figure 2. The CSS 1 sample showed a major peak at 2θ = 20.54, and the crystallinity index (CI) is 56.25%. In the CSS 2 film sample, there is a slight shift in the peak, and the new peak is at 2θ = 20.480 and the CI was 53.80% because of the addition of essential oil and Span 80. The CSS3 sample has a peak at 2θ = 20.540 and the CI was 41.49%. This is because of Tween 80, a high HLB (Hydrophilic-Lipophilic Balance) value, which increases the free volume inside the polymer matrix, resulting in a decline in crystallinity. The CSS4 film sample demonstrated peak at 2θ = 20.430 with CI 46.24%. This is because of lecithin, which is an ionic surfactant that increases the mobility of polymeric chains resulting in increase in the free volume. Polímeros, 36(3), e20260026, 2026
3.7 Fourier transform infrared spectroscopy analysis Figure 3 represents the Fourier Transform Infrared (FTIR) Spectroscopy of the fabricated film samples. The peak at 3296 cm-1 is attributed to -OH stretching vibration. The peak at 2924 cm-1 is attributed to -CH stretching vibration. The 1601 cm-1 is attributed to the C=O bond. The peak at 1031 cm-1 is ascribed to the -COC bond, which is reported earlier in the previous study[32]. The addition of BEO and surfactant in the bio-composite matrix in CSS 2, CSS 3, and CSS 4 changed the intensities of the peak. The shift in peak intensity from CSS 2 to CSS 4, indicate molecular interactions between the components. Several studies have been published where BEO showed similar peaks[33,34]. These findings are in line with the previous studies[35-38]. 5/10
Gupta, A., Jawad, M., Al-Harrasi, A., & Bhatia, S. 3.8 Water vapor permeability analysis The water vapor transmission rate of a polymer based film is determined to quantify the amount of moisture that passes through the film per unit area and time, under certain conditions. This is mainly done to assess the film’s barrier performance and its potential to maintain the required internal environment of the product. The WVTR results of fabricated films are demonstrated in Table 4. The control sample (CSS 1) showed 0.182 g/m2·day. The CSS 2 film showed the lowest WVTR of 0.164 g/m2·day, which could be due to the addition of hydrophobic surfactant, Span 80. This addition resulted in reduction in the hydrogen bonding
with CA and SA leading to change in hydrophobicity of the material . The CSS 3 film showed the highest WVTR of 0.39 g/m2·day, due to addition of hydrophilic surfactant that may increase bound water, resulting in a less dense structure[39]. The CSS 4 film showed a WVTR of 0.21 g/m2·day, due to the presence of lecithin in the polymeric network, which shows lipophilic behavior and demonstrates lower WVTR[40].
3.9 Swelling index analysis The swelling index is a critical factor in packaging material, which determines the expansion in the volume of the film due to absorption of water. In terms of food packaging, water resistance is determined by swelling capacity which signifies the quality of the food product during transportation and storage[41]. The results of the swelling index of the fabricated film samples were analyzed and demonstrated in Table 4. The CSS 1 film sample showed 77.88%, however with the addition of surfactants and essential oil the swelling index was changed. The CSS 2 film sample showed the lowest swelling index of 74.53%. This behavior might be due to the addition of Span 80, as this addition caused an increase in the water resistance of the film[42]. The CSS 3 film sample showed the swelling index of 88.81%, due to the presence of hydrophilic surfactant, Tween 80 and possess more porous structure, which increases the water uptake of the films. Similar results were found in WVTR and previously reported[43].
3.10 Antioxidant properties Figure 2. XRD graph of fabricated film samples.
The antioxidant properties of the fabricated film samples are shown in Table 4. The CSS 1 film samples showed 38.46%. The blank sample also possess antioxidant due to the the presence of chitosan[44]. The incorporation of BEO and surfactant in the polymer matrix increases the antioxidant activity. The CSS 2 film samples showed the 41.39% of radical scavenging activity, whereas the CSS 3 and CSS 4 showed 44.90% and 41.52% of inhibition. This illustrates that with different surfactants in the polymer matrix, the antioxidant properties were different, which may be due to the different nature of the surfactants that interact with BEO and polymer matrix.
3.11 Water contact angle
Figure 3. FTIR graph of fabricated film samples.
The water contact angle of the fabricated film samples is shown in Figure 4. The control sample showed an average contact angle of 82.17ᴼ, indicating a hydrophilic surface. The incorporation of BEO and surfactant in the polymer matrix made the films more wettable when compared to the control. The CSS 2 film samples showed an average contact angle of 60.98ᴼ, whereas CSS 3 and CSS 4 film
Table 4. WVTR, Swelling Index and Antioxidant Properties of the fabricated film samples. Sample CSS1 CSS2 CSS3 CSS4
WVTR (g/m2·day) 0.182 ± 0.008b 0.164 ± 0.001a 0.390 ± 0.362d 0.210 ± 0.020c
Swelling Index (%) 77.88 ± 18.94d 74.53 ± 8.21b 88.81 ± 13.80c 89.97 ± 6.68a
Antioxidant Properties (%) 38.46 ± 2.66a 41.39 ± 3.88b 44.90 ± 7.48c 41.52 ± 2.80a
The values with different letters (a,b,c and d) inside a column indicate significant differences (p < 0.05).
6/10
Polímeros, 36(3), e20260026, 2026
Impact of different surfactants on chitosan/sodium alginate films reinforced with bergamot oil samples showed an average contact angles of 49.41ᴼ and 54.51ᴼ, indicating increase in wettability compared to the control. This may be due to the different nature of the surfactant, which reduces the interfacial energy between the polymers and the BEO[45].
3.12 Gas chromatography – Mass spectroscopy analysis Figure 5 demonstrates the GC-MS analysis of BEO. The GC-MS profile of oil shown in Table 5 revealed the presence
of oxygenated and hydrocarbon monoterpenes in the oil. This aligns with the previously reported composition of Citrus bergamia oil. The major component in BEO was limonene which accounted for 50.49% of the total composition. These components form the principal monoterpene hydrocarbon that contributes to the characteristic aroma of citrus. The second most abundant component was linalyl acetate with 14.91% followed by linalool (12.97%). Both of these are key aromatic components that are responsible for Aromatic
Figure 4. Water contact angle of the fabricated film samples.
Figure 5. GC-MS analysis of BEO. Polímeros, 36(3), e20260026, 2026
7/10
Gupta, A., Jawad, M., Al-Harrasi, A., & Bhatia, S. Table 5. Major components detected in the GC-MS of BEO. Compound Limonene Linalyl acetate Linalool β-pinene α-pinene γ-terpinene Terpinolene
Area (%) 50.49% 14.91% 12.97% 3.72% 2.64% 1.23% 0.52%
Retention Time 10.654 20.132 13.544 8.040 6.499 11.403 12.503
odour. Some additional monoterpenes such as β-pinene (3.72%) followed by α-pinene (2.64%), γ-terpinene (1.23%), terpinolene (0.52%), and sabinene (0.44%) out of total oil composition were also detected. This indicates the complex volatile matrix of BEO. Furthermore, some minor oxygenated constituents such as limonene oxides (cis and trans), α-terpineol, carveol, and neryl acetate were also detected. Some high molecular weight sesquiterpene derivatives such as caryophyllene (2.00%) and caryophyllene oxide (0.49%) were also present. Similar findings have been documented in the previous literature [46,47].
4. Conclusions This study successfully evaluated the incorporation of different surfactants over the structural and functional behavior of CA and SA bio-composite films containing BEO. These research findings confirmed that different surfactants caused different changes in the polymer matrix, that help in designing packaging material based on requirements. Span 80 is hydrophobic in nature and have a low HLB value, hence its incorporation caused an improvement in WVTR and decreased swelling index of films, making it more favorable for a high-humidity environment. Tween 80 is hydrophilic in nature and possess high HLB value, hence its incorporation resulted in increase in the free volume with increase in affinity for water molecules, resulting increase in WVTR and swelling index. Lecithin is a bulky surfactant, when incorporated in film, it causes an increase in the thickness. FTIR validated the interaction between the polymer and surfactants. The DPPH radical inhibition showed increased antioxidant activity due to the addition of surfactant and BEO. The water contact angle of the surfactant loaded films decreased due to decrease in wettability resistance of the films. Overall, the presented work highlights the impact of surfactants in the polymer matrix of CA and SA. Span 80-based films emerged as the most suitable candidate for moisture-sensitive food packaging. This study provides robust knowledge for the development of advance eco-friendly active packaging material having customizable performance attributes.
5. Author’s Contribution • Conceptualization – Muhammad Jawad; Aditya Gupta. • Data curation – Muhammad Jawad; Aditya Gupta. • Formal analysis – Muhammad Jawad; Aditya Gupta. • Funding acquisition – NA. 8/10
• Investigation – Muhammad Jawad; Aditya Gupta; Saurabh Bhatia. • Methodology – Muhammad Jawad; Aditya Gupta. • Project administration – Ahmed Al-Harrasi; Saurabh Bhatia. • Resources – Ahmed Al-Harrasi; Saurabh Bhatia. • Software – Muhammad Jawad; Aditya Gupta. • Supervision – Ahmed Al-Harrasi; Saurabh Bhatia. • Validation – NA. • Visualization – NA. • Writing – original draft – Muhammad Jawad; Aditya Gupta. • Writing – review & editing – Aditya Gupta; Saurabh Bhatia.
6. Acknowledgements The Authors are thankful to the Natural and Medical Sciences Research Center, University of Nizwa, Oman, for providing research facilities to conduct the current study.
7. References 1. Plastics Europe. (2023). Plastics – the fast facts 2023. Retrieved in 2026, January 27, from https://plasticseurope.org/knowledgehub/plastics-the-fast-facts-2023/ 2. Ellen MacArthur Foundation. World Economic Forum. McKinsey & Company. (2016). The new plastics economy: Rethinking the future of plastics. Ellen MacArthur Foundation. Retrieved in 2026, January 27, from https://www.ellenmacarthurfoundation. org/the-new-plastics-economy-rethinking-the-future-of-plastics 3. British Plastics Federation. (2025, December 3). Retrieved in 2026, January 27, from https://www.bpf.co.uk/plastipedia/ applications/about_plastics__packaging.aspx 4. Singh, N., & Walker, T. R. (2024). Plastic recycling: A panacea or environmental pollution problem. Npj Materials Sustainability, 2(1), 17. https://doi.org/10.1038/s44296-02400024-w. PMid:39114578. 5. European Environment Agency. (2020). Plastics, the circular economy and Europe’s environment — A priority for action. Retrieved in 2026, January 27, from https://www.eea.europa. eu/publications/plastics-the-circular-economy-and 6. Sharma, S., & Mallubhotla, S. (2019). Plastic waste management practices. In A. Rathoure (Ed.), Zero waste: Management practices for environmental sustainability (pp. 9-13). Boca Raton: CRC Press. https://doi.org/10.1201/9780429059247-7. 7. Gironi, F., & Piemonte, V. (2011). Bioplastics and petroleumbased plastics: strengths and weaknesses. Energy Sources. Part A, Recovery, Utilization, and Environmental Effects, 33(21), 1949-1959. https://doi.org/10.1080/15567030903436830. 8. Xu, Y., Liu, X., Jiang, Q., Yu, D., Xu, Y., Wang, B., & Xia, W. (2021). Development and properties of bacterial cellulose, curcumin, and chitosan composite biodegradable films for active packaging materials. Carbohydrate Polymers, 260, 117778. https://doi.org/10.1016/j.carbpol.2021.117778. PMid:33712134. 9. Hefft, D. I., & Adeutnji, C. O. (2024). Alginate in food and beverage formulations. In D. I. Hefft, & C. O Adeutnji (Eds.), Applications of seaweeds in food and nutrition (pp.115-128). Amsterdam: Elsevier. https://doi.org/10.1016/B978-0-32391803-9.00017-2. 10. Schenk, S., Bucher, M., Herrenbauer, M., Schmid, D., & Schmid, M. (2025). Challenges of alginate-based cast films in plastic-free food packaging applications: an overview. Polímeros, 36(3), e20260026, 2026
Impact of different surfactants on chitosan/sodium alginate films reinforced with bergamot oil Polymers, 17(22), 3061. https://doi.org/10.3390/polym17223061. PMid:41304426. 11. Andreuccetti, C., Carvalho, R. A., Galicia-García, T., MartínezBustos, F., & Grosso, C. R. F. (2011). Effect of surfactants on the functional properties of gelatin-based edible films. Journal of Food Engineering, 103(2), 129-136. https://doi. org/10.1016/j.jfoodeng.2010.10.007. 12. Wu, S., Hatahet, T., Bona, B. L., Lodigiani, G., Zhang, M., Bombelli, F. B., & Al-Jamal, W. T. (2025). Incorporating Span 80 surfactant into lipid nanocapsules improves their biocompatibility and cellular uptake in B16F10 melanoma cells. International Journal of Pharmaceutics, 672, 125358. https:// doi.org/10.1016/j.ijpharm.2025.125358. PMid:39954976. 13. Aksalamol, P. R., George, J., Guthige, M. R., Navaf, M., Sunooj, K. V., Kumar, R., & Semwal, A. D. (2024). Towards sustainable food packaging: optimization of suitable sorbitan surfactant for the development of PLA-based antifog film. Food Packaging and Shelf Life, 46, 101368. https://doi.org/10.1016/j. fpsl.2024.101368. 14. Olewnik-Kruszkowska, E., Ferri, M., Degli Esposti, M., Richert, A., & Fabbri, P. (2025). Innovative biobased active composites of cellulose acetate propionate with tween 80 and cinnamic acid for blueberry preservation. Polymers, 17(15), 2072. https://doi.org/10.3390/polym17152072. PMid:40808120. 15. Li, Q., Liang, W., Lv, L., Fang, Z., Xu, D., Liao, J., & Liu, Y. (2024). Preparation of PCL/lecithin/bacteriocin CAMT6 antimicrobial and antioxidant nanofiber films using emulsion electrospinning: characteristics and application in chilled salmon preservation. Food Research International, 175, 113747. https:// doi.org/10.1016/j.foodres.2023.113747. PMid:38128997. 16. American Society for Testing and Materials – ASTM. (2012). ASTM D882-12: Standard test method for tensile properties of thin sheeting. West Conshohocken: ASTM. https://doi. org/10.1520/D0882-12. 17. Erdem, B. G., Dıblan, S., & Kaya, S. (2019). Development and structural assessment of whey protein isolate/sunflower seed oil biocomposite film. Food and Bioproducts Processing, 118, 270-280. https://doi.org/10.1016/j.fbp.2019.09.015. 18. Brand-Williams, W., Cuvelier, M. E., & Berset, C. (1995). Use of a free radical method to evaluate antioxidant activity. Lebensmittel-Wissenschaft + Technologie, 28(1), 25-30. https:// doi.org/10.1016/S0023-6438(95)80008-5. 19. Khan, T. S., Shah, Y. A., Al-Harrasi, A., Al Dawery, S. K., Harharah, H. N., Harharah, R. H., Ahmad, M. W., Al-Kharusi, L., & Bhatia, S. (2025). Impact of various surfactants on the properties of fucoidan-based biopolymer films extracted from brown seaweed (Padina boergesenii) for active food packaging. International Journal of Biological Macromolecules, 327(Part 2), 146919. https://doi.org/10.1016/j.ijbiomac.2025.146919. PMid:40819761. 20. Ivanova, N. A., Kovalchuk, N. M., Sobolev, V. D., & Starov, V. M. (2015). Wetting films of aqueous solutions of Silwet L-77 on a hydrophobic surface. Soft Matter, 12(1), 26-30. https:// doi.org/10.1039/C5SM02043C. PMid:26451895. 21. Li, X., Tu, Z.-C., Sha, X.-M., Ye, Y.-H., & Li, Z.-Y. (2020). Flavor, antimicrobial activity, and physical properties of composite film prepared with different surfactants. Food Science & Nutrition, 8(7), 3099-3109. https://doi.org/10.1002/ fsn3.1526. PMid:32724574. 22. Yulianti, K., Gunawan, A. Y., Soewono, E., & Mucharam, L. (2020). The effects of surfactant on the evolution of a thin film under a moving liquid drop. Indonesian Journal of Science and Technology, 5(1), 75-85. https://doi.org/10.17509/ijost. v5i1.23100. 23. Brandelero, R. P. H., Yamashita, F., & Grossmann, M. V. E. (2010). The effect of surfactant Tween 80 on the hydrophilicity, Polímeros, 36(3), e20260026, 2026
water vapor permeation, and the mechanical properties of cassava starch and poly(butylene adipate-co-terephthalate) (PBAT) blend films. Carbohydrate Polymers, 82(4), 11021109. https://doi.org/10.1016/j.carbpol.2010.06.034. 24. Delacotte, J., Montel, L., Restagno, F., Scheid, B., Dollet, B., Stone, H. A., Langevin, D., & Rio, E. (2012). Plate coating: influence of concentrated surfactants on the film thickness. Langmuir : The ACS Journal of Surfaces and Colloids, 28(8), 3821-3830. https://doi.org/10.1021/la204386b. PMid:22283676. 25. Song, X., Zuo, G., & Chen, F. (2018). Effect of essential oil and surfactant on the physical and antimicrobial properties of corn and wheat starch films. International Journal of Biological Macromolecules, 107(Pt A), 1302-1309. https:// doi.org/10.1016/j.ijbiomac.2017.09.114. PMid:28970166. 26. Chuah, A. M., Kuroiwa, T., Kobayashi, I., & Nakajima, M. (2009). Effect of chitosan on the stability and properties of modified lecithin stabilized oil-in-water monodisperse emulsion prepared by microchannel emulsification. Food Hydrocolloids, 23(3), 600-610. https://doi.org/10.1016/j.foodhyd.2008.03.014. 27. Calambás Pulgarin, H. L., Caicedo, C., & López, E. F. (2022). Effect of surfactant content on rheological, thermal, morphological and surface properties of thermoplastic starch (TPS) and polylactic acid (PLA) blends. Heliyon, 8(10), e10833. https:// doi.org/10.1016/j.heliyon.2022.e10833. PMid:36247174. 28. Kong, I., Degraeve, P., & Pui, L. P. (2022). Polysaccharide-based edible films incorporated with essential oil nanoemulsions: Physico-chemical, mechanical properties and its application in food preservation—A review. Foods, 11(4), 555. https:// doi.org/10.3390/foods11040555. PMid:35206032. 29. Carrapiso, A. I., Pimienta, M., Martín, L., Cardenia, V., & Andrés, A. I. (2023). Effect of a chitosan coating enriched with an olive leaf extract on the characteristics of pork burgers. Foods, 12(20), 3757. https://doi.org/10.3390/foods12203757. PMid:37893650. 30. Tongnuanchan, P., Benjakul, S., & Prodpran, T. (2013). Characteristics and antioxidant activity of leaf essential oil-incorporated fish gelatin films as affected by surfactants. International Journal of Food Science & Technology, 48(10), 2143-2149. https://doi.org/10.1111/ijfs.12198. 31. Arzate-Vázquez, I., Chanona-Pérez, J. J., Calderón-Domínguez, G., Terres-Rojas, E., Garibay-Febles, V., Martínez-Rivas, A., & Gutiérrez-López, G. F. (2012). Microstructural characterization of chitosan and alginate films by microscopy techniques and texture image analysis. Carbohydrate Polymers, 87(1), 289-299. https://doi.org/10.1016/j.carbpol.2011.07.044. PMid:34662963. 32. Kuczajowska-Zadrożna, M., Filipkowska, U., & Jóźwiak, T. (2020). Adsorption of Cu(II) and Cd(II) from aqueous solutions by chitosan immobilized in alginate beads. Journal of Environmental Chemical Engineering, 8(4), 103878. https:// doi.org/10.1016/j.jece.2020.103878. 33. Zambito, Y., Piras, A. M., & Fabiano, A. (2022). Bergamot essential oil: A method for introducing it in solid dosage forms. Foods, 11(23), 3860. https://doi.org/10.3390/foods11233860. PMid:36496668. 34. Wong, S. T. S., Kamari, A., Abdullah, N. N. A., Yusof, N., & Wayan Sutapa, I. (2024). Preparation and characterization of bergamot essential oil nanoemulsion. IOP Conference Series. Earth and Environmental Science, 1425(1), 012031. https:// doi.org/10.1088/1755-1315/1425/1/012031. 35. Chalid, M., Husnil, Y. A., Puspitasari, S., & Cifriadi, A. (2020). Experimental and modelling study of the effect of adding starch-modified natural rubber hybrid to the vulcanization of sorghum fibers-filled natural rubber. Polymers, 12(12), 3017. https://doi.org/10.3390/polym12123017. PMid:33348531. 36. Zhang, H., Han, Q., Gao, X., Tang, X., Chen, K., & Li, M. (2019). Impact of reinforcing additives on the structure and 9/10
Gupta, A., Jawad, M., Al-Harrasi, A., & Bhatia, S. performance of composite films based on regenerated cellulose from corn stalk pith. BioResources, 14(4), 8455-8469. https:// doi.org/10.15376/biores.14.4.8455-8469. 37. Pasieczna-Patkowska, S., Cichy, M., & Flieger, J. (2025). Application of Fourier transform infrared (FTIR) spectroscopy in characterization of green synthesized nanoparticles. Molecules, 30(3), 684. https://doi.org/10.3390/molecules30030684. PMid:39942788. 38. Arya, A., Sadiq, M., & Sharma, A. L. (2018). Effect of variation of different nanofillers on structural, electrical, dielectric, and transport properties of blend polymer nanocomposites. Ionics, 24(8), 2295-2319. https://doi.org/10.1007/s11581-017-2364-7. 39. Boonpratum, C., Naemchanthara, P., Limsuwan, P., & Naemchanthara, K. (2022). Effects of chitosan and Tween 80 addition on the properties of nanofiber mat through the electrospinning. E-Polymers, 22(1), 234-248. https://doi. org/10.1515/epoly-2022-0029. 40. Shamsuri, A. A., & Siti Nurul, S. N. A. (2020). Functional properties of biopolymer-based films modified with surfactants: A brief review. Processes, 8(9), 1039. https://doi.org/10.3390/ pr8091039. 41. Kazak, M. B., & Tugrul, N. (2024). Comparison of the film properties of lemon and sour cherry seed essential oiladded glycerol and/or sorbitol-plasticized corn, potato, rice, tapioca, and wheat starch-based edible films. International Journal of Polymer Science, 2024(1), 9112555. https://doi. org/10.1155/2024/9112555. 42. Maran, J. P., Sivakumar, V., Sridhar, R., & Thirugnanasambandham, K. (2013). Development of model for barrier and optical properties of tapioca starch based edible films. Carbohydrate Polymers, 92(2), 1335-1347. https://doi.org/10.1016/j. carbpol.2012.09.069. PMid:23399163.
10/10
43. Ali, M., Ullah, S., Ullah, S., Shakeel, M., Afsar, T., Husain, F. M., Amor, H., & Razak, S. (2024). Innovative biopolymers composite based thin film for wound healing applications. Scientific Reports, 14(1), 27415. https://doi.org/10.1038/ s41598-024-79121-8. PMid:39521931. 44. Sun, L., Sun, J., Chen, L., Niu, P., Yang, X., & Guo, Y. (2017). Preparation and characterization of chitosan film incorporated with thinned young apple polyphenols as an active packaging material. Carbohydrate Polymers, 163, 81-91. https://doi. org/10.1016/j.carbpol.2017.01.016. PMid:28267521. 45. Gomes, A. C. D., Silva, K. F., Freitas, A. J., Miranda, K. W. E., Santos, T. A., Borges, S. V., Dias, M. V., & Thomazi, A. C. (2021). Effect of surfactant on the formation of chitosan/εpolycaprolactone blend films for food packaging applications. Research Square. https://doi.org/10.21203/rs.3.rs-804708/v1. 46. Melliou, E., Michaelakis, A., Koliopoulos, G., Skaltsounis, A. L., & Magiatis, P. (2009). High quality bergamot oil from Greece: chemical analysis using chiral gas chromatography and larvicidal activity against the West Nile virus vector. Molecules, 14(2), 839-849. https://doi.org/10.3390/molecules14020839. PMid:19255543. 47. Leggio, A., Leotta, V., Belsito, E. L., Di Gioia, M. L., Romio, E., Santoro, I., Taverna, D., Sindona, G., & Liguori, A. (2017). Aromatherapy: composition of the gaseous phase at equilibrium with liquid bergamot essential oil. Chemistry Central Journal, 11(1), 111. https://doi.org/10.1186/s13065-017-0340-y. PMid:29098462. Received: Jan. 27, 2026 Revised: Mar. 26, 2026 Accepted: Mar. 30, 2026 Editor-in-Chief: Sebastião V. Canevarolo
Polímeros, 36(3), e20260026, 2026
ISSN 1678-5169 (Online)
https://doi.org/10.1590/0104-1428.20250108
Harnessing natural monoterpenes: cold plasma polymerization of citronellol Erick Osvaldo Martínez-Ruiz1* , José Abraham González-López1 , Claudia Gabriela Cuellar-Gaona1 , María del Carmen Rodríguez-Aranda2 , Adán Reyes-Reyes2 , Juan Andrés Reyes-Reyes2 , Alejandra Ortiz-Dosal2 , María Esther Treviño-Martínez1 and María Guadalupe Neira-Velázquez1* Departamento de Química Macromolecular y Nanomateriales, Centro de Investigación en Química Aplicada, Coahuila de Zaragoza, CH, México 2 Facultad de Ciencias, Universidad Autónoma de San Luis Potosí, San Luis Potosí, SLP, México
1
*erick.martinez@ciqa.edu.mx; guadalupe.neira@ciqa.edu.mx
Abstract This study presents the cold plasma polymerization of citronellol, a natural monoterpene, as a route to obtain antibacterial polymeric films. A 10 µL volume of citronellol was polymerized under argon plasma at 100 Pa, yielding a solid film (Pcit). SEM analysis revealed a heterogeneous, branched surface with a roughness Ra of 7.53 ± 2.19 µm and Rz of 50.57 ± 24.26 µm. Water contact angle measurements indicated moderate hydrophilicity (62°). XPS and FTIR analyses confirmed the presence of oxygen-containing functional groups, while OES detected reactive carbon- and oxygencontaining species generated during plasma operation. Hemolysis tests showed excellent blood compatibility (<5%), and antimicrobial assays revealed inhibition zones of 12 ± 1 mm for E. coli and 10 ± 1 mm for S. aureus. Overall, these results indicate that plasma-polymerized citronellol yields functional surfaces with promising potential for biomedical and antibacterial applications. Keywords: citronellol, cold plasma, green chemistry, monoterpenes, polymerization. Data Availability: All data supporting the findings of this study are available from the corresponding author upon request. How to cite: Martínez-Ruiz, E. O., González-López, J. A., Cuellar-Gaona, C. G., Rodríguez-Aranda, M. C., ReyesReyes, A., Reyes-Reyes, J. A., Ortiz-Dosal, A., Treviño-Martínez, M. E., & Neira-Velázquez, M. G. (2026). Harnessing natural monoterpenes: cold plasma polymerization of citronellol. Polímeros: Ciência e Tecnologia, 36(3), e20260027. https://doi.org/10.1590/0104-1428.20250108
1. Introduction Plasma-based processes have become an effective alternative for the synthesis and surface deposition of organic thin films, particularly in cases where conventional catalytic polymerization routes are limited by catalyst deactivation, solvent use, or incompatibility with temperature-sensitive substrates, especially for the fabrication of functional coatings derived from bio-based organic monomers[1,2]. In this context, plasma polymerization enables the activation of organic monomers through energetic species such as electrons, ions, and metastable atoms, leading to the formation of highly crosslinked, solvent-free coatings without the need for external initiators or catalysts[3,4]. In recent years, interest in the plasma processing of bio-based monomers has grown significantly, driven by the demand for sustainable materials and functional coatings with intrinsic biological activity[4,5]. Among these precursors, terpenes and terpenoid compounds derived from essential oils have been extensively explored due to their renewable origin, structural diversity, and the presence of functional groups that can be preserved, to varying extents, during plasma-induced fragmentation[6-8]. Previous studies have demonstrated the feasibility of plasma-deposited films derived from
Polímeros, 36(3), e20260027, 2026
monoterpenes such as limonene, linalool, carvacrol, and related compounds, yielding amorphous, highly crosslinked polymeric networks with tunable surface chemistry and wettability[3,9-11]. Nevertheless, despite these advances, the plasma processing of terpene alcohols remains comparatively underexplored relative to hydrocarbon terpenes, and the structure–property relationships of the resulting materials are still not fully understood[5,12,13]. Citronellol is a naturally occurring monoterpene alcohol found in various aromatic plants and is characterized by a wide range of biologically relevant properties, including antimicrobial, antioxidant, and anti-inflammatory activity[14-16]. Although citronellol has been extensively studied in its molecular form, there are only a few reports on its transformation under plasma conditions, and its behavior as a precursor in plasma polymerization processes has not been systematically investigated. In particular, it remains unclear how plasma-generated reactive species influence the fragmentation, recombination, and crosslinking pathways of citronellol, as well as the structural nature of the resulting deposited material[3,17].
1/9
O O O O O O O O O O O O O O O O
Martínez-Ruiz, E. O., González-López, J. A., Cuellar-Gaona, C. G., Rodríguez-Aranda, M. C., Reyes-Reyes, A., Reyes-Reyes, J. A., Ortiz-Dosal, A., Treviño-Martínez, M. E., & Neira-Velázquez, M. G. In this work, the cold plasma polymerization of citronellol is investigated using an argon-based plasma system, with emphasis on the formation and characterization of plasmadeposited polymeric thin films, which give rise to a highly crosslinked three-dimensional network of predominantly polymeric nature, distinct from conventional linear polymers. The plasma–monomer interaction mechanisms and their influence on the chemical and morphological characteristics of the resulting material are analyzed, allowing the correlation of plasma conditions with the chemical and structural nature of the formed coatings. To this end, a comprehensive characterization is carried out using scanning electron microscopy, profilometry, water contact angle measurements, optical emission spectroscopy, Fourier transform infrared spectroscopy, and X-ray photoelectron spectroscopy. By clarifying the nature of plasma-derived citronellol films and their formation pathways, this study contributes to a more consistent understanding of plasma polymerization of bio-based monomers and expands current knowledge on terpene-derived plasma materials. In contrast to previously investigated terpene precursors such as limonene and carvacrol, citronellol presents a distinct molecular architecture characterized by a primary alcohol functional group and higher polarity, which can influence plasma-induced fragmentation pathways, surface oxidation, and functional group retention. These features are expected to promote the formation of oxygen-containing functionalities and alter nucleation–growth behavior during plasma deposition, potentially affecting both surface chemistry and biological performance. Therefore, investigating citronellol as a plasma precursor provides insight into structure–property relationships within terpene-derived plasma polymers and
contributes to understanding how precursor functionality governs film morphology, chemistry, and bioactivity.
2. Materials and Methods 2.1 Plasma polymerization of citronellol Glass substrates (1 cm in diameter) were cleaned prior to deposition by sequential ultrasonication in acetone, ethanol, and deionized water (10 min each), followed by drying under an air stream. This cleaning procedure was employed to remove organic and particulate contaminants that could interfere with plasma polymerization and film adhesion. For plasma polymerization, 10 µL of citronellol (purity ≥ 95%, Sigma-Aldrich) was deposited onto the cleaned glass substrates and uniformly spread by spin coating using the following sequence: 100 rpm for 15 s, 250 rpm for 30 s, and 100 rpm for 15 s, with 1 s pauses between steps. This procedure ensured a uniform distribution of the monomer before plasma treatment. The substrates were then placed inside a cylindrical glass vessel (1.65 L) equipped with stainless steel caps and a copper wire loop positioned around the body of the vessel; one end of the copper wire was connected to the plasma generator (as shown in Figure 1). The plasma reactor was connected to a 13.56 MHz radio-frequency (RF) generator through an impedance-matching network (AT6 Automatic Matching Network). The system was evacuated using a vacuum pump (Maxima C Plus, Fisher Scientific™), reaching a base pressure of 0.26 Pa prior to gas introduction. The pressure inside the reactor was monitored using a singlechannel ACS 2000 controller (Alcatel Vacuum Technology). Plasma polymerization was carried out in an argon atmosphere
Figure 1. (a) photographic and schematic; (b) representation of the plasma polymerization system. 2/9
Polímeros, 36(3), e20260027, 2026
Harnessing natural monoterpenes: cold plasma polymerization of citronellol at an RF power of 50 W, a working pressure of 100 Pa, and a treatment time of 10 min. These parameters were selected based on preliminary experiments and literature reports to ensure plasma stability, effective monomer fragmentation, and the formation of continuous polymeric films while avoiding excessive ablation or over-fragmentation. Under these conditions, reproducible plasma polymerization of citronellol was achieved[1,3,18]. After plasma polymerization, plasma-polymerized citronellol (Pcit) films were obtained and characterized. The deposited polymer mass was obtained as the mean value of three independent plasma deposition cycles (n=3) and determined by gravimetric analysis based on the mass difference of the substrates measured before and after deposition.
2.2 Optical emission spectroscopy (OES) Reactive species generated by plasma discharges were identified with a fiber-optic spectrometer (Ocean Optics) covering 700–900 nm. Spectral monitoring is conducted at the side of the cold-plasma reactor, with the optical fiber positioned horizontally 1 cm away from the wall.
2.3 X-ray photoelectron spectroscopy (XPS) The XPS spectra of Pcit were collected on a Fisher Thermo Scientific K-Alpha+ with a monochromatic AlKα source (hν = 1486.6 eV; 25 W, 15 kV). Survey spectra used an energy step size of 150 eV and a 1.0 eV resolution. High-resolution C 1s and N 1s scans used a 50 eV step and a 0.1 eV resolution. Atomic percentages of C, N, and O were obtained in triplicate from survey spectra with CasaXPS software. High-resolution spectra were Shirleybackground-corrected and deconvoluted in Origin 2019b using Gaussian components (FWHM = 1.35 eV). Binding energies were referenced to the C–C/C–H component at 285.04 eV. Relative sensitivity factors were those provided by CasaXPS.
2.6 Static water contact angle (WCA) WCA was measured by the sessile-drop method using a ramé-hart goniometer (model 100-00). A 2 μL Milli-Q water droplet was dispensed manually; images were analyzed in ImageJ software. Materials were classified as hydrophobic (WCA ≥ 90°) or hydrophilic (WCA < 90°). Measurements were performed on three independently prepared samples corresponding to distinct plasma deposition cycles.
2.7 Scanning electron microscopy (SEM) Images of Pcit were captured using a JEOL 6000 Scanning Electron Microscope (SEM). Before SEM analysis, the Pcit samples were mounted on aluminum stubs and coated with a 10 nm silver layer using a plasma sputtering system.
2.8 Hemolysis assay Prior to the hemolysis assay, the plasma-polymerized citronellol (Pcit) films were gently detached from the substrate using a sterile plastic scraper and subsequently dispersed in Alsever’s solution. The dispersion was assisted by mild ultrasonication (5 min) to obtain a homogeneous suspension without inducing thermal or chemical degradation of the material. The blood compatibility of Pcit was assessed through an in vitro hemolysis assay. Human erythrocytes were washed three times with Alsever’s solution and diluted to 10% (v/v). Aliquots (1500 µL) were incubated with Pcit at 1.0, 2.5, or 5.0 mg/mL in 24-well plates at 37 °C for 1 h with gentle shaking (100 rpm). Alsever’s solution and distilled water served as negative and positive controls, respectively. Following incubation, the samples were centrifuged at 2500 rpm for 4 minutes to separate intact cells from the supernatant. Then, 1000 μL of the supernatant was carefully transferred into a new transparent 24-well plate for absorbance measurement at 415 nm (Synergy HTX; BioTek Instruments). Each condition was run in triplicate. Percent hemolysis was calculated using (Equation 1):
2.4 Attenuated total reflectance-fourier transform infrared (ATR-FTIR) = Hemolysis A Thermo Scientific Nicolet IS50 ATR-FTIR system was employed to obtain the infrared spectra of Pcit and citronellol. Following the collection of Pcit deposited onto a coverslip, the sample was prepared for FTIR analysis. The spectra were acquired by performing 40 scans at a resolution of 4 cm−1.
2.5 Roughness 3D surface topography of Pcit was measured with a Keyence VR-6100 Series 3D Optical Profilometer, providing high-definition images up to 40× magnification. Roughness parameters were extracted from the generated height maps. Roughness parameters were extracted from surface-based topography measurements performed over representative surface regions (1–2 mm2). Data processing included form removal and standard surface filtering to eliminate macroscopic tilt effects while preserving micrometric features associated with plasma-induced agglomerates. Consequently, the reported roughness values reflect the hierarchical surface morphology arising from localized cluster formation rather than the intrinsic roughness of a uniform thin film. Polímeros, 36(3), e20260027, 2026
Asample − Anegative control Asample control − Anegative control
× 100% (1)
2.9 Antimicrobial disk Antibacterial activity of Pcit was assessed by disk diffusion against Staphylococcus aureus (Gram-positive) and Escherichia coli (Gram-negative). Plates were seeded with 200 μL of a 10−3 dilution; a 10 mm Pcit disk was placed centrally. A bare glass coverslip served as the negative control. Plates were incubated at 37 °C for 24 hours, and inhibition halo diameters were measured in millimeters. Each condition was tested and evaluated in triplicate to improve statistical reliability.
3. Results and Discussions 3.1 Plasma polymerization process The development and scaling of eco-friendly synthesis methods are essential to fully exploit the environmental benefits of renewable monoterpenes (MTs). The literature highlights the transformation of monoterpenes, such as citronellol, 3/9
Martínez-Ruiz, E. O., González-López, J. A., Cuellar-Gaona, C. G., Rodríguez-Aranda, M. C., Reyes-Reyes, A., Reyes-Reyes, J. A., Ortiz-Dosal, A., Treviño-Martínez, M. E., & Neira-Velázquez, M. G. into (meth)acrylate monomers, which can be polymerized to obtain materials with tailored properties. Furthermore, various polymerization strategies for monoterpene-derived (meth)acrylates, including radical polymerization and ringopening polymerization, are extensively discussed. Other research articles also explore potential industrial applications of these polymers, including their use in adhesives, coatings, and biomedical materials. The exploration of plasma from noble gases with a focus on argon is noteworthy due to the presence of metastable species within the argon plasma phase, like Ar*[19]. These species can potentially modify the reaction dynamics, optimizing the polymerization process in certain contexts. When 10 µL of citronellol was subjected to the specified conditions in section 2.1 over a 10-minute duration, 0.12 ± 0.01 mg of a solid film (plasma polymer; Pcit) was obtained.
3.2 Optical emission spectroscopy Optical emission spectroscopy (OES) was performed to qualitatively identify the reactive species generated during plasma operation. Figure 2 shows a representative emission spectrum recorded during the plasma polymerization of citronellol in argon within the 700–900 nm range. Several emission lines were detected between 750–880 nm, including dominant argon-related emissions. Characteristic Ar I emission lines were identified at approximately 750.4, 763.5, 811.5, and 852–857 nm, which are attributed to transitions of excited neutral argon, in agreement with the NIST database[20]. These emissions are consistent with electron-impact excitation processes leading to the formation of excited argon species, with only minor contributions from ionized argon (Ar II). Weak and unresolved features observed at lower wavelengths may be associated with carbon-containing fragments generated from partial evaporation and plasma-induced fragmentation of citronellol. In this context, argon metastable species (Ar*) likely play a key role as energy-transfer agents, promoting bond dissociation (e.g., C=C and C–H cleavage) and radical formation, which are essential steps in plasma polymerization processes[19,21,22]. Overall, the OES results support the occurrence of plasma-phase activation and fragmentation mechanisms; however, due to the restricted spectral range (700–900 nm), the analysis remains qualitative and does
not provide a comprehensive identification of all active species or reaction pathways.
3.3 X-ray photoelectron spectroscopy Figure 3 a) shows the XPS survey spectrum and atomic composition of the plasma-polymerized citronellol film (Pcit), probing approximately the upper 10 nm of the surface. The detected elements were carbon (C, 92.84% at 285.04 eV), oxygen (O, 5.56% at 531.46 eV), and a minor contribution of nitrogen (N, 1.6% at 391.5 eV). The presence of nitrogen is plausibly attributed to residual atmospheric species within the plasma reactor and/or post-deposition exposure to air. The reactor was operated at a base pressure of 0.26 Pa, a regime in which trace amounts of nitrogen are commonly detected in plasma-polymerized and plasma-treated polymeric surfaces, even in the absence of intentional nitrogen-containing precursors[23,24]. Therefore, the detected nitrogen should be regarded as an incidental surface contribution rather than as evidence of active nitrogen incorporation into the polymer backbone. Figure 3 b) presents the high-resolution C1s spectrum of Pcit, deconvoluted into three main components: C1 (C–C/C–H at 284.69 eV, 74.77%), C2 (C–O–C/C–N/C– OH at 285.6 eV, 16.61%), and C3 (C=O/N–C=O at 287.6 eV, 8.89%). The surface chemistry is thus dominated by hydrocarbon bonds, with a moderate fraction of oxygencontaining functional groups introduced during plasma polymerization. This composition is consistent with the measured water contact angle of 62°, indicative of a moderately hydrophilic surface. The presence of polar functionalities such as C–O and C=O groups is known to increase surface energy and water affinity, partially counterbalancing the hydrophobic character associated with the predominant hydrocarbon backbone[23-26]. While a direct causal relationship cannot be established, the relative abundance of oxidized carbon species may plausibly contribute to the observed wettability by promoting polar interactions at the solid–liquid interface. Furthermore, oxygen-containing functional groups, particularly carbonyl moieties, have been associated in the literature with antibacterial responses in plasma-modified polymeric surfaces[23]. In this context, the XPS results suggest a surface chemistry compatible with such effects.
3.4 Attenuated total reflectance-fourier transform infrared
Figure 2. Emission spectrum for the cold-plasma polymerization of citronellol in an argon atmosphere. 4/9
The infrared spectra comparison between the pure citronellol monomer and the synthesized Pcit film (Figure 4) reveals significant chemical transformations occurring during the plasma process. Given the inherent complexity of plasma-polymerized films, the resulting FTIR bands in Pcit should be interpreted as an ensemble of overlapping functional groups rather than as welldefined, discrete molecular structures[22]. In the pure citronellol spectrum, characteristic bands include the –OH stretching at 3327 cm-1, aliphatic CH2 asymmetric and symmetric stretching at 2915 and 2851 cm-1, and signals at 1376 cm-1 and 1053 cm-1 associated with bending and stretching vibrations of the carbon skeleton and C–O bonds, respectively[27]. A critical observation is the Polímeros, 36(3), e20260027, 2026
Harnessing natural monoterpenes: cold plasma polymerization of citronellol
Figure 3. a) Survey spectra for Pcit (pass energy of 150 eV with a resolution of 1 eV), b) Component-fitted C1s spectra for Pcit as deposited, C1 (C-H / C-C), C2 (C-O-C / C-N / C-OH) and C3 (N-C = O, C = O).
attenuation or disappearance of the features associated with the monomer’s double bond (C=C) region 1670 cm-1. This loss of unsaturation provides direct evidence of the degree of monomer fragmentation and subsequent crosslinking, as the plasma energy drives the opening of double bonds to form the highly reticulated polymeric network[22]. In the Pcit spectrum, the –OH band shifts to 3359 cm-1, suggesting its incorporation into a more complex and diverse hydrogen-bonding network within the amorphous polymer matrix[28]. Furthermore, a new prominent signal at 1706 cm-1 indicates the formation of carbonyl groups (C=O). These groups arise from fragmentation and oxidation reactions during plasma synthesis, contributing to the ensemble of functionalities that may confer antibacterial properties[23]. The emergence of new configurations in the range of 1000 to 900 cm-1, such as the signals at 1000 cm-1 and 901 cm-1, further confirms the drastic restructuring of the carbon backbone into a functionalized, crosslinked surface[29]. Based on the OES, FTIR, and XPS results, a simplified plasma polymerization pathway for citronellol is proposed, consistent with mechanisms reported for RF argon plasmas[19,21,22], as illustrated in Figure 5. The argon discharge generates energetic electrons and metastable species (Ar*), which act as energy transfer agents, promoting bond scission in the precursor, particularly at the C=C bond. This process leads to the formation of carbon-centered radicals (R•), oxygenated radicals (RO•), and small hydrocarbon fragments (CxHy•). These species undergo competitive recombination and surface-driven crosslinking reactions, resulting in the formation of a highly reticulated polymeric network. The attenuation of unsaturation signals in FTIR, together with the emergence of C–O and C=O groups in XPS, supports Polímeros, 36(3), e20260027, 2026
Figure 4. ATR-FTIR spectra of Pcit and citronellol.
a mechanism dominated by partial fragmentation rather than complete monomer degradation. The OES emissions in the 700–900 nm range further indicate the presence of excited argon species and reactive fragments, supporting plasma-phase activation pathways. Although intermediate species cannot be directly identified, the overall process can be described as a sequence of (i) activation via electron and Ar* interactions, (ii) fragmentation into reactive radicals, and (iii) radical-mediated surface growth, in agreement with previously reported plasma polymerization mechanisms[21,22]. 5/9
Martínez-Ruiz, E. O., González-López, J. A., Cuellar-Gaona, C. G., Rodríguez-Aranda, M. C., Reyes-Reyes, A., Reyes-Reyes, J. A., Ortiz-Dosal, A., Treviño-Martínez, M. E., & Neira-Velázquez, M. G.
Figure 5. Mechanistic scheme of citronellol plasma polymerization in argon RF discharge.
Figure 6. SEM images of Pcit, scale bar of a) 1 mm and b) 100 µm.
3.5 Scanning electron microscopy
3.6 Roughness
Figure 6 presents scanning electron microscopy (SEM) images of the Pcit obtained by cold plasma polymerization of citronellol. In micrograph (a), with a scale of 1 mm, a predominantly homogeneous surface is observed at low magnification. However, micrograph (b), with a scale of 100 µm, reveals a more complex morphology characterized by branched structures or small clusters irregularly distributed over the surface. These structures could be attributed to a combined phenomenon of localized polymerization and differences in the initial concentration of citronellol, possibly influenced by a non-uniform evaporation process under the vacuum conditions of the reactor[22]. The differential evaporation of citronellol may have induced local gradients in the monomer density on the coverslip surface. This phenomenon could have generated regions with higher citronellol concentrations, favoring cluster formation during the plasma treatment. Additionally, the argon plasma likely played a role in redistributing the monomer and generating the observed branched structures, reflecting the interaction between plasma dynamics and the initial characteristics of the deposited monomer[30]. The optical emission spectroscopy (OES) described in section 3.1 supports the hypothesis of non-uniform monomer evaporation, revealing the presence of carbon (C) and oxygen (O) ions in the plasma phase, indicating the activation of citronellol molecules and their partial fragmentation under the argon plasma conditions[31].
The surface morphology of the plasma polymerized citronellol layer was characterized by optical profilometry using a multilayer surface 1roughness analysis, evaluating a total of nine points distributed along 21 lines. Figure 7 shows the three-dimensional height profile of a representative area of Pcit at 180% magnification. The average film thickness, determined by step-height measurements, was 0.96 ± 0.12 µm, indicating that the underlying plasma-polymerized layer is submicrometric rather than nanometric. Despite this sub-micrometric average thickness, the surface exhibited an average roughness (Ra) of 7.53 ± 2.19 µm and a maximum roughness height (Rz) of 50.57 ± 24.26 µm. These high roughness values reflect a heterogeneous surface morphology dominated by localized micrometric agglomerates rather than the intrinsic roughness of a uniform film[3]. The presence of pronounced peaks and valleys observed in the 3D height profiles is consistent with the SEM micrographs (Figure 6), which reveal micron-scale clusters and irregular growth features formed during plasma polymerization. Such agglomerates are attributed to localized variations in monomer availability and plasma-induced fragmentation recombination processes under vacuum conditions, leading to non-uniform polymer growth. Therefore, the reported roughness parameters (Ra and Rz) are predominantly governed by these micrometric surface features, while
6/9
Polímeros, 36(3), e20260027, 2026
Harnessing natural monoterpenes: cold plasma polymerization of citronellol
Figure 7. 3D height profile of the representative area of Pcit at magnifications of 180%.
the underlying polymer layer remains sub-micrometric in thickness. This hierarchical micro–submicron topography is relevant for biomedical applications, as surface heterogeneity and roughness are known to influence protein adsorption, cell–material interactions, and antimicrobial behavior[24,31].
3.7 Hemolysis The evaluation of hemocompatibility is a criterion that determines the viability of biomaterials intended for medical applications, especially those with direct or indirect contact with blood. In this study, the interaction of the material Pcit with human erythrocytes was investigated through an in vitro hemolysis assay. The material was evaluated at different concentrations: 1, 2.5, and 5 mg/mL (Figure 8). The results indicated that Pcit exhibits non-hemolytic behavior, with hemolysis levels below the 5% threshold, which is considered the acceptable limit according to ASTM F 756-17[32]. In the literature, the hemocompatibility of electrospun fibers loaded with citronellol has been evaluated, obtaining similar results, with hemolysis values below 5%[33,34], suggesting that citronellol does not induce damage to red blood cell membranes under the conditions evaluated in this assay. This finding is particularly relevant considering that citronellol is a monoterpene present in essential oils, which has been primarily studied for its antimicrobial, antioxidant, and anti-inflammatory properties, but its direct interaction with human blood cells has been scarcely documented[33-35]. The evaluation of Pcit confirms a safe profile in terms of blood compatibility.
3.8 Antimicrobial disk The antimicrobial activity of Pcit against Escherichia coli and Staphylococcus aureus is presented in Table 1. Pcit exhibits measurable inhibition against both strains, indicating broad-spectrum antimicrobial behavior, although lower than the ampicillin control. This activity is plausibly associated with the intrinsic bioactivity of citronellol and the presence of oxygen-containing functional groups (C–O, C=O), which have been reported to promote interactions with bacterial membranes and oxidative stress responses in Polímeros, 36(3), e20260027, 2026
Figure 8. In vitro hemolysis test.
Table 1. Inhibition halos of Pcit. Material Pcit Negative Control Positive Control (Ampicillin)
Inhibition halos (mm) Escherichia Staphylococcus coli aureus 12 ± 1 10 ± 1 0 0 25 ± 1 22 ± 1
plasma-modified surfaces[23,24,36]. Surface roughness (Ra ≈ 7.5 µm) may also influence bacterial adhesion by modifying local contact conditions; however, at this micrometric scale, its contribution is likely secondary compared to chemical effects[31]. Therefore, the antimicrobial behavior of Pcit is better interpreted as a combined effect of surface chemistry and morphology. Nevertheless, these contributions were not independently isolated, and the proposed structure–property relationship should be considered as a supported hypothesis rather than a definitive mechanism. 7/9
Martínez-Ruiz, E. O., González-López, J. A., Cuellar-Gaona, C. G., Rodríguez-Aranda, M. C., Reyes-Reyes, A., Reyes-Reyes, J. A., Ortiz-Dosal, A., Treviño-Martínez, M. E., & Neira-Velázquez, M. G.
4. Conclusions
6. Acknowledgements
This study demonstrates the successful plasma polymerization of citronellol (Pcit) under argon at 100 Pa, yielding a functional polymeric coating with distinct morphological, chemical, and wettability characteristics. The resulting film exhibits a heterogeneous surface composed of a sub-micrometric layer decorated with micrometric agglomerates, leading to relatively high roughness (Ra = 7.53 ± 2.19 µm; Rz = 50.57 ± 24.26 µm) and moderate hydrophilicity (WCA ≈ 62°). XPS and FTIR analyses confirmed the incorporation of oxygen-containing functional groups, while OES provided qualitative evidence of reactive species involved in plasma-phase activation and fragmentation processes. Pcit showed non-hemolytic behavior (<5%) and measurable antibacterial activity against E. coli and S. aureus. This response is more plausibly attributed to the combined effects of surface chemistry and morphology, in agreement with previous reports, although no direct causal mechanism was established. Some limitations should be acknowledged. Thickness estimation may be affected by surface heterogeneity, and biological assays were limited in statistical scope. In addition, the antimicrobial mechanism was not directly resolved and requires further investigation. Overall, these results support cold plasma polymerization as a viable strategy for converting renewable monoterpenes into functional coatings with potential applications in antibacterial and biomedical fields.
The authors would like to sincerely acknowledge the Secretariat of Science, Humanities, Technology, and Innovation (Secihti) for the financial support provided through the postdoctoral fellowship (grant 347182), which made this research possible. Additionally, they extend their appreciation to B. E. Reyes Vielma and M. García Zamora for their crucial technical contributions in the execution of various analytical techniques used in this study. The authors also gratefully acknowledge Dr. Zugasti Cruz for his valuable support in the performance of the hemolytic assays.
5. Author’s Contribution • Conceptualization – Erick Osvaldo Martínez-Ruiz; Alejandra Ortiz-Dosal. • Data curation – Erick Osvaldo Martínez-Ruiz; José Abraham González-López; Claudia Gabriela Cuellar-Gaona; Adán Reyes-Reyes; Juan Andrés Reyes-Reyes; Alejandra Ortiz-Dosal; María del Carmen Rodríguez-Aranda. • Formal analysis – Erick Osvaldo Martínez-Ruiz; Claudia Gabriela Cuellar-Gaona; Adán Reyes-Reyes; Juan Andrés Reyes-Reyes; Alejandra Ortiz-Dosal. • Funding acquisition – María Guadalupe Neira-Velázquez. • Investigation – Erick Osvaldo Martínez-Ruiz; María Guadalupe Neira-Velázquez. • Methodology –Erick Osvaldo Martínez-Ruiz; Claudia Gabriela Cuellar-Gaona; Adán Reyes-Reyes; Juan Andrés Reyes-Reyes; María Guadalupe Neira-Velázquez, María del Carmen Rodríguez-Aranda. • Project administration – María Guadalupe NeiraVelázquez. • Resources – María Esther Treviño-Martínez. • Software – Erick Osvaldo Martínez-Ruiz. • Supervision – Erick Osvaldo Martínez-Ruiz; María Esther Treviño-Martínez; María Guadalupe Neira-Velázquez. • Validation – Erick Osvaldo Martínez-Ruiz; María Esther Treviño-Martínez; María Guadalupe Neira-Velázquez. • Visualization – Erick Osvaldo Martínez-Ruiz. • Writing – original draft – Erick Osvaldo Martínez-Ruiz. • Writing – review & editing – José Abraham GonzálezLópez; María Guadalupe Neira-Velázquez. 8/9
7. References 1. Dufour, T. (2023). From basics to frontiers: a comprehensive review of plasma-modified and plasma-synthesized polymer films. Polymers, 15(17), 3607. https://doi.org/10.3390/ polym15173607. PMid:37688233. 2. Mosquera, M. E. G., Jiménez, G., Tabernero, V., Vinueza-Vaca, J., García-Estrada, C., Kosalková, K., Sola-Landa, A., Monje, B., Acosta, C., Alonso, R., & Valera, M. A. (2021). Terpenes and terpenoids: building blocks to produce biopolymers. Sustainable Chemistry, 2(3), 467-492. https://doi.org/10.3390/ suschem2030026. 3. Loesch‐Zhang, A., Geissler, A., & Biesalski, M. (2023). Plasma polymerization of biogenic precursors. Plasma Processes and Polymers, 20(10), e2300016. https://doi.org/10.1002/ ppap.202300016. 4. Kumar, A., Grant, D. S., Bazaka, K., & Jacob, M. V. (2018). Tailoring terpenoid plasma polymer properties by controlling the substrate temperature during PECVD. Journal of Applied Polymer Science, 135(5), 45771. https://doi.org/10.1002/ app.45771. 5. Levchenko, I., Xu, S., Baranov, O., Bazaka, O., Ivanova, E., & Bazaka, K. (2021). Plasma and polymers: recent progress and trends. Molecules, 26(13), 4091. https://doi.org/10.3390/ molecules26134091. PMid:34279431. 6. Thomsett, M. R., Storr, T. E., Monaghan, O. R., Stockman, R. A., & Howdle, S. M. (2016). Progress in the synthesis of sustainable polymers from terpenes and terpenoids. Green Materials, 4(3), 115-134. https://doi.org/10.1680/jgrma.16.00009. 7. Milchev, A., & Binder, K. (2020). Semiflexible Polymers interacting with planar surfaces: weak versus strong adsorption. Polymers, 12(2), 255. https://doi.org/10.3390/polym12020255. PMid:31978981. 8. Martínez-Ruiz, E. O., González-López, J. A., Cuellar-Gaona, C. G., González-López, M. Á., Torres-Lubián, J. R., TreviñoMartínez, M. E., Gallardo-Vega, C., Soria-Arguello, G., & Neira-Velázquez, M. G. (2024). Cold plasma oligomerization in argon atmosphere from carvacrol: product formation and characterization. Revista Mexicana de Ingeniería Química, 23(3), Poly24405. https://doi.org/10.24275/rmiq/Poly24405. 9. Ghalkhani, M., Beheshtian, J., & Salehi, M. (2016). Electrochemical and DFT study of an anticancer and active anthelmintic drug at carbon nanostructured modified electrode. Materials Science and Engineering C, 69, 1345-1353. https://doi.org/10.1016/j. msec.2016.08.031. PMid:27612835. 10. Kannan, M., Singh, S., & Prasad, R. R. (2022). The effect of processing parameters on the mechanical properties of CalciaStabilized Zirconia (CSZ) for dental use. Coatings, 13(1), 75. https://doi.org/10.3390/coatings13010075. 11. Gaglio, R., Botta, L., Garofalo, G., Miceli, A., Settanni, L., & Lopresti, F. (2021). Carvacrol activated biopolymeric foam: an effective packaging system to control the development of spoilage and pathogenic bacteria on sliced pumpkin and Polímeros, 36(3), e20260027, 2026
Harnessing natural monoterpenes: cold plasma polymerization of citronellol melon. Food Packaging and Shelf Life, 28, 100633. https:// doi.org/10.1016/j.fpsl.2021.100633. 12. Bazaka, K., Jacob, M. V., Truong, V. K., Wang, F., Pushpamali, W. A. A., Wang, J. Y., Ellis, A. V., Berndt, C. C., Crawford, R. J., & Ivanova, E. P. (2010). Plasma-enhanced synthesis of bioactive polymeric coatings from monoterpene alcohols: a combined experimental and theoretical study. Biomacromolecules, 11(8), 2016-2026. https://doi.org/10.1021/bm100369n. PMid:20590150. 13. Bazaka, K., Ahmad, J., Oelgemöller, M., Uddin, A., & Jacob, M. V. (2017). Photostability of plasma polymerized γ-terpinene thin films for encapsulation of OPV. Scientific Reports, 7(1), 45599. https://doi.org/10.1038/srep45599. PMid:28358138. 14. Isobe, T., Ohkawara, S., Ochi, S., Tanaka-Kagawa, T., & Hanioka, N. (2019). S-equol glucuronidation in liver and intestinal microsomes of humans, monkeys, dogs, rats, and mice. Food and Chemical Toxicology : An International Journal Published for the British Industrial Biological Research Association, 131, 110542. https://doi.org/10.1016/j. fct.2019.05.050. PMid:31163218. 15. Jayaraj, R. L., Azimullah, S., Parekh, K. A., Ojha, S. K., & Beiram, R. (2022). Effect of citronellol on oxidative stress, neuroinflammation and autophagy pathways in an in vivo model of Parkinson’s disease. Heliyon, 8(11), e11434. https:// doi.org/10.1016/j.heliyon.2022.e11434. PMid:36387498. 16. Iqbal, U., Malik, A., Sial, N. T., Mehmood, M. H., Nawaz, S., Papadakis, M., Fouad, D., Ateyya, H., Welson, N. N., Alexiou, A., & Batiha, G. E.-S. (2024). β-Citronellol: a potential antiinflammatory and gastro-protective agent-mechanistic insights into its modulatory effects on COX-II, 5-LOX, eNOS, and ICAM-1 pathways through in vitro, in vivo, in silico, and network pharmacology studies. Inflammopharmacology, 32(6), 3761-3784. https://doi.org/10.1007/s10787-024-01569-x. PMid:39342545. 17. Puchalski, M., Szparaga, G., Biela, T., Gutowska, A., Sztajnowski, S., & Krucińska, I. (2018). Molecular and supramolecular changes in Polybutylene Succinate (PBS) and Polybutylene Succinate Adipate (PBSA) copolymer during degradation in various environmental conditions. Polymers, 10(3), 251. https://doi.org/10.3390/polym10030251. PMid:30966286. 18. Grant, D. S., Ahmed, J., Whittle, J. D., Michelmore, A., Vasilev, K., Bazaka, K., & Jacob, M. V. (2021). Comparative study of natural terpenoid precursors in reactive plasmas for thin film deposition. Molecules, 26(16), 4762. https://doi.org/10.3390/ molecules26164762. PMid:34443354. 19. Fridman, A. (2008). Plasma chemistry. Cambridge: Cambridge University Press. https://doi.org/10.1017/CBO9780511546075 20. National Institute of Standards and Technology – NIST. (2024). NIST Atomic Spectra Database (Version 5.12) (NIST Standard Reference Database, No. 78). Gaithersburg: NIST. https://doi. org/10.18434/T4W30F 21. Martínez-Ruiz, E. O. (2017). Partial oxidation of methane in a dielectric barrier discharge plasma milli-reactor (Doctoral thesis). Université Pierre et Marie Curie - Paris VI, Paris. 22. Friedrich, J. (2011). Mechanisms of plasma polymerizationreviewed from a chemical point of view. Plasma Processes and Polymers, 8(9), 783-802. https://doi.org/10.1002/ppap.201100038. 23. Chan, Y. W., Siow, K. S., Ng, P. Y., Gires, U., & Majlis, B. Y. (2016). Plasma polymerized carvone as an antibacterial and biocompatible coating. Materials Science and Engineering C, 68, 861-871. https://doi.org/10.1016/j.msec.2016.07.040. PMid:27524089. 24. Ruiz, E. O. M., Rao, X., García, A. F., Vega, C. G., Canche, C. N. A., López, J. A. G., Pérez, A. S. L., Medina, M. D. D., Gaona, C. G. C., Céspedes, R. I. N., Arguello, G. S., & Velázquez, M. G. N. (2023). Cold plasma copolymer with
Polímeros, 36(3), e20260027, 2026
antimicrobial activity deposited on three different substrates. Polímeros, 33(4), e20230038. https://doi.org/10.1590/01041428.20220099. 25. Sun, P., Wu, H., Bai, N., Zhou, H., Wang, R., Feng, H., Zhu, W., Zhang, J., & Fang, J. (2012). Inactivation of Bacillus subtilis Spores in Water by a Direct‐Current, Cold Atmospheric‐Pressure Air Plasma Microjet. Plasma Processes and Polymers, 9(2), 157-164. https://doi.org/10.1002/ppap.201100041. 26. Desmet, T., Morent, R., De Geyter, N., Leys, C., Schacht, E., & Dubruel, P. (2009). Nonthermal Plasma Technology as a Versatile Strategy for Polymeric Biomaterials Surface Modification: A Review. Biomacromolecules, 10(9), 23512378. https://doi.org/10.1021/bm900186s. PMid:19655722. 27. Thompson, J. M. (2018). Infrared spectroscopy. Boca Raton: Jenny Stanford Publishing. https://doi.org/10.1201/9781351206037 28. Wang, B., Lu, C., Hu, J., & Lu, W. (2020). Property improvements of EVOH by enhancing the hydrogen bonding. Plastics. Plastics, Rubber and Composites, 49(1), 18-24. https://doi.or g/10.1080/14658011.2019.1666465. 29. Larkin, P. (2011). Infrared and raman spectroscopy. Amsterdam: Elsevier. https://doi.org/10.1016/C2010-0-68479-3 30. Shenton, M. J., & Stevens, G. C. (2001). Surface modification of polymer surfaces: atmospheric plasma versus vacuum plasma treatments. Journal of Physics. D, Applied Physics, 34(18), 2761-2768. https://doi.org/10.1088/0022-3727/34/18/308. 31. Hochbaum, A. I., & Aizenberg, J. (2010). Bacteria Pattern Spontaneously on Periodic Nanostructure Arrays. Nano Letters, 10(9), 3717-3721. https://doi.org/10.1021/nl102290k. PMid:20687595. 32. American Society for Testing and Materials – ASTM. (2017). ASTM F756-17: Standard practice for assessment of hemolytic properties of materials. West Conshohocken: ASTM International. 33. Gonzalez-Prada, I., Borges, A., Santos-Torres, B., Magariños, B., Simões, M., Concheiro, A., & Alvarez-Lorenzo, C. (2024). Antimicrobial cyclodextrin-assisted electrospun fibers loaded with carvacrol, citronellol and cinnamic acid for wound healing. International Journal of Biological Macromolecules, 277(Pt 3), 134154. https://doi.org/10.1016/j.ijbiomac.2024.134154. PMid:39116822. 34. Pereira, R. L. S., Campina, F. F., Costa, M. S., Cruz, R. P., Freitas, T. S., Santos, A. T. L., Cruz, B. G., Sena Júnior, D. M., Lima, I. K. C., Xavier, M. R., Teixeira, A. M. R., Menezes, I. R. A., Quintans-Júnior, L. J., Araújo, A. A. S., & Coutinho, H. D. M. (2021). Antibacterial and modulatory activities of β-cyclodextrin complexed with (+)-β-citronellol against multidrug-resistant strains. Microbial Pathogenesis, 156, 104928. https://doi.org/10.1016/j.micpath.2021.104928. PMid:33957243. 35. Wu, Y., Hong, D., Qiu, S., Fang, Y., & Zhu, Y. (2024). Intrinsic antibacterial photopolymerization 3D-printed thermosets from citronellol and cinnamyl alcohol: synthesis and properties. Polymer Testing, 140, 108582. https://doi.org/10.1016/j. polymertesting.2024.108582. 36. Milovanovic, S., Markovic, D., Jankovic-Castvan, I., & Lukic, I. (2024). Cornstarch aerogels with thymol, citronellol, carvacrol, and eugenol prepared by supercritical CO2-assisted techniques for potential biomedical applications. Carbohydrate Polymers, 331, 121874. https://doi.org/10.1016/j.carbpol.2024.121874. PMid:38388060. Received: Nov. 29, 2025 Revised: Apr. 21, 2026 Accepted: Apr. 23, 2026 Associate Editor: Artur J. M. Valente
9/9
ISSN 1678-5169 (Online)
https://doi.org/10.1590/0104-1428.20250087
Bacterial cellulose synthesized in Erythrina mulungu extract: structural and bioactive properties Girlaine Santos da Silva1* , Mariana Alves Henrique2 , Severino Alves Júnior3 and Glória Maria Vinhas4 Programa de Pós-graduação em Ciência dos Materiais, Universidade Federal de Pernambuco, Recife, PE, Brasil 2 Centro de Tecnologias Estratégicas do Nordeste, Universidade Federal de Pernambuco, Recife, PE, Brasil 3 Departamento de Química Fundamental, Universidade Federal de Pernambuco, Recife, PE, Brasil 4 Departamento de Engenharia Química, Universidade Federal de Pernambuco, Recife, PE, Brasil
1
*girlaine.santos@ufpe.br
Abstract Bacterial cellulose is a biopolymer valued for its purity, biocompatibility, and versatility, but its production typically depends on synthetic media, limiting sustainability and hindering the incorporation of functional compounds during biosynthesis. The effects of plant-derived extracts on the physicochemical and biological properties of bacterial cellulose remain poorly understood. This study evaluates the use of an aqueous extract of Erythrina mulungu as an alternative culture medium capable of producing and functionalizing bacterial cellulose simultaneously. Over 20 days, hydrated membranes were obtained with an average productivity of 186.41 g/L. Infrared spectroscopy confirmed characteristic cellulose functional groups, while Xray diffraction revealed reduced crystallinity in mulunguderived membranes (46%) compared to salinederived membranes (72%). Antimicrobial assays showed inhibition of Escherichia coli and Staphylococcus aureus. Antioxidant activity reached 14.70% for the extract, 10.14% for mulunguderived cellulose, and 1.50% for salinederived cellulose. The extract enhanced functional properties, supporting applications requiring antimicrobial and antioxidant performance. Keywords: biopolymer membranes, natural culture medium, phenolic compounds, antioxidant activity, antimicrobial properties. Data Availability: Research data is available upon request from the corresponding author. How to cite: Silva, G. S., Henrique, M. A., Alves Júnior, S., & Vinhas, G. M. (2026). Bacterial cellulose synthesized in Erythrina mulungu extract: Structural and bioactive properties. Polímeros: Ciência e Tecnologia, 36(3), e20260028. https://doi.org/10.1590/0104-1428.20250087
1. Introduction Cellulose is one of the most abundant natural polymers. It is formed by repeating βDglucopyranose units linked by β-(1→4) bonds and contains many hydroxyl groups along its chain[1,2]. Although mainly produced by plants, it can also be synthesized by fungi, seaweeds, and some bacteria[3]. Bacterial cellulose (BC) stands out for its high crystallinity, purity, mechanical strength, water-holding capacity, biocompatibility, biodegradability, and non-toxicity[4,5]. These features, along with the possibility of structural modification, support its use in the medicine, food, and pharmaceutical industries; packaging; paper; textiles; water treatment; and electronics [6-9]. BC can be functionalized by adding substances that introduce new properties. The most common modification strategies are in situ (during synthesis) and ex situ (after production) [6]. Natural compounds have gained prominence as modifiers due to their functional potential and sustainability, especially those derived from medicinal plants[10,11].
Polímeros, 36(3), e20260028, 2026
Erythrina mulungu is a Fabaceae species native to the caatinga, whose bark and leaves contain alkaloids, flavonoids, terpenoids, and phenolic compounds responsible for its antioxidant and antimicrobial activities[12]. When incorporated into the bacterial cellulose matrix, these metabolites can interact with the hydrogenbonding network, reducing crystallinity, altering fibrillar organization, and introducing new functional groups detectable by spectroscopy. Such interactions may also impart antioxidant and antimicrobial properties to the cellulose, enabling the production of functionalized membranes without additional modification steps. These physicochemical and biological changes expand the material’s potential for applications requiring enhanced bioactivity, such as active packaging, biomedical devices, and cosmetic formulations[13,14]. In this study, bacterial cellulose was produced using an aqueous extract of Erythrina mulungu as an alternative
1/10
O O O O O O O O O O O O O O O O
Silva, G. S., Henrique, M. A., Alves Júnior, S., & Vinhas, G. M. culture medium, to produce membranes with antimicrobial and antioxidant activity. The extract was characterized by High-Performance Liquid Chromatography (HPLC), total phenolic content, Fourier-transform infrared spectroscopy (FTIR), antioxidant assays, and antimicrobial tests. The BC membranes were analyzed by XRay Diffraction (XRD), FTIR, Thermogravimetry (TG), Scanning Electron Microscopy (SEM), and antimicrobial and antioxidant assays.
2. Materials and Methods 2.1 Production and treatment of bacterial cellulose 2.1.1 Bacterial strain, plant raw material, and reagents Gluconacetobacter hansenii was obtained from the Culture Bank of the Catholic University of Pernambuco, and Erythrina mulungu bark was purchased from a natural products store in Recife (PE, Brazil). The reagents used for microbial cultivation and analyses included peptone, agar, yeast extract, glucose, ethyl alcohol, DPPH, ascorbic acid, calcium chloride, acetic acid, sodium carbonate, Folin–Ciocalteu reagent, acetonitrile, gallic acid, ammonium dihydrogen phosphate, potassium dihydrogen phosphate, magnesium sulfate, and ferrous sulfate, all from standard commercial suppliers. 2.1.2 Culture medium and strain activation The conservation medium followed Hestrin and Schramm[15]. For activation, 100 mL of medium was sterilized (121 °C, 20 min), melted, poured into sterile tubes, and solidified at 45°. Cells were inoculated with a platinum loop and incubated at 30 °C for 48 h. Cultures were stored at −2 °C and subcultured every 30 days. 2.1.3 Preparation of the aqueous extract The extract was prepared by infusing 6 g of dried E. mulungu bark in 250 mL of distilled water ( 24 g/L) at 80 °C for 20 min. After cooling and filtration, it was stored at 4 °C. 2.1.4 Production of cellulose membranes The culture medium consisted of the E. mulungu extract supplemented with sucrose (48 g/L). Membranes were cultivated in Roux flasks containing 400 mL of medium under static conditions at 25 ± 2 °C for 20 days. The control saline medium followed patent BR1020200124005[16], containing glucose and mineral salts (ammonium dihydrogen phosphate, potassium dihydrogen phosphate, magnesium sulfate heptahydrate, calcium chloride, and ferrous sulfate), all analytical grade. Cellulose produced from the mulungu extract is referred to as BC Mulungu, and that from the saline medium as BC Salts. 2.1.5 Washing, purification, and drying After cultivation, membranes were washed with distilled water, immersed in E. mulungu extract, and sterilized by gamma irradiation (25 kGy). They were dried at 45 °C for ~24 h and stored in a desiccator before characterization. 2/10
2.2 Characterizations 2.2.1 Characterization of the Erythrina mulungu aqueous extract Phenolic compounds were identified by high-performance liquid chromatography (HPLC) using a Shimadzu UFLC system with a Phenomenex C18 column (250 × 4.6 mm). Mobile phases were water (A) and acetonitrile (B). The gradient started at 7% B, increased to 50% over 36 min, remained until 70 min, returned to 7% at 80 min, and ended at 90 min. Flow rate was 0.4 mL/min, column temperature 30 °C, detection at 280 nm, and injection volume 50 µL. The Folin determined total phenolic content–Ciocalteu method[17]. Extract concentration (500 µg/mL) was obtained by drying 1 mL of extract at 60 °C to constant mass. The reaction mixture contained distilled water (8 mL), Folin–Ciocalteu reagent (0.5 mL), sample (0.5 mL), and saturated sodium carbonate (1 mL). After 60 min in the dark, absorbance was measured at 720 nm. Analyses were performed in triplicate, using PA ethanol as the blank and gallic acid as the standard. Fouriertransform infrared spectroscopy was performed on the dried extract using a Perkin Elmer Spectrum 400 with ATR, collecting spectra from 550–4000 cm−1 (4 cm−1 resolution, 16 scans). Antimicrobial activity was evaluated by agar disk diffusion against Escherichia coli and Staphylococcus aureus. Filter paper discs (5.2 mm) impregnated with extract were placed on plates inoculated with 0.1 mL of bacterial suspension (10−4 McFarland). Plates were incubated at 30 °C for 48 h, and inhibition zones were measured. Antioxidant activity was assessed by the DPPH method[18]. A DPPH solution (2.5 mg/100 mL in ethanol) was mixed with 100 µL of extract and kept in the dark for 60 min. Absorbance was measured at 515 nm, and inhibition was calculated using Equation 1. % DPPH inhibition =
Abscontrol − Abssample x100 Abscontrol
(1)
2.2.2 Characterization of bacterial cellulose membranes Fourier identified functional groups of the BC membranestransform infrared spectroscopy coupled with attenuated total reflectance, using spectra collected from 550 to 4000 cm−1. Surface morphology was examined by scanning electron microscopy, enabling visualization of fibrillar organization, porosity, and possible structural modifications induced by the alternative culture medium. Crystallinity was assessed by Xray diffractio, and the crystallinity index was calculated using the Segal method[19], providing information on the degree of structural order and the influence of the extract on cellulose microfibril arrangement. Thermal stability was evaluated by thermogravimetryusing a Mettler Toledo TG 2 Star System. Approximately 20 mg of each membrane were heated from 30 to 800 °C at 10 °C/ min under a nitrogen atmosphere to prevent thermooxidative degradation. Antimicrobial activity was determined by the agar disk diffusion method using circular membranes (1 cm diameter) placed on nutrient agar plates inoculated with Escherichia coli and Staphylococcus aureus. Plates were incubated at Polímeros, 36(3), e20260028, 2026
Bacterial cellulose synthesized in Erythrina mulungu extract: structural and bioactive properties 30 °C for 48 h, and inhibition zones were measured to assess the bioactive potential of the membranes. Antioxidant activity was evaluated by the DPPH radical scavenging assay. Membrane fragments (1 × 1 cm) were extracted in 50% ethanol for 24 h, and 0.1 mL of the extract was mixed with 3.9 mL of DPPH solution. After 1 h in the dark, absorbance was measured at 515 nm, and antioxidant activity was calculated using Equation 1.
3. Results and Discussions The hydrated and dry yields were calculated from membrane mass. BC Mulungu produced 186.41 g/L (hydrated) and 5.35 g/L (dry), while BC Salts reached 346.5 g/L and 17.35 g/L. These differences reflect the influence of medium composition: the saline medium, rich in simple sugars and minerals, favors bacterial metabolism and cellulose secretion, whereas the mulungu extract contains complex phytochemicals that may slow growth but contribute functional properties. Figure 1 illustrates the BC production process using the Erythrina mulungu extract, from extract preparation to the final dry membrane.
3.1 Characterization of the aqueous extract of Erythrina mulungu 3.1.1 High-Performance Liquid Chromatography (HPLC) The chromatogram obtained for the aqueous extract of mulungu is shown in Figure 2, in which the main peaks
corresponding to the compounds present in the extract can be observed. Specific alkaloids and phenolic compounds were identified in the chromatogram. The peak at 5.9 minutes corresponds to minor phenolic compounds, while the main peak at 9.24 minutes is typical of common phenols such as chlorogenic and caffeic acids[20]. Peaks between 16 and 30 minutes (16.96, 25.73, 30.19 min) indicate erythrin alkaloids like erysothrine and related derivatives, consistent with their higher hydrophobicity. The peak at 44.91 minutes suggests less polar alkaloid forms, and the late signal at 75.72 minutes likely reflects residual compounds or cellulosederived fragments retained longer in the column[21,22]. 3.1.2 Determination of total phenolics The concentration of phenolic compounds in the aqueous extract of Erythrina mulungu, determined by the Folin–Ciocalteu method, was 38.18µg/mL or 7.64mg GAE/g of dry extract, a value considered moderate and relevant for antioxidant and bioactive applications[23]. Da Silva Mota et al.[24] reported 27.0mg GAE/g in hydroethanolic extract of the same species, a result compatible with this study, considering the greater extraction efficiency with mixed solvents. 3.1.3 Fourier transform infrared spectroscopy Infrared spectroscopy was conducted to identify the main characteristic absorption bands of the aqueous extract of Erythrina mulungu. The resulting spectrum of the extract is presented in Figure 3.
Figure 1. Production of bacterial cellulose using the aqueous extract of Erythrina mulungu: (a) extract; (b) membrane formation; (c) wet membrane; and (d) dry membrane.
Figure 2. HPLC chromatogram of the aqueous extract of Erythrina mulungu. Polímeros, 36(3), e20260028, 2026
3/10
Silva, G. S., Henrique, M. A., Alves Júnior, S., & Vinhas, G. M.
Figure 3. Infrared spectrum of the aqueous extract of Erythrina mulungu.
The FTIR spectrum of the Erythrina mulungu extract (Figure 3) showed bands consistent with the HPLC profile. The broad signal near 3300 cm−1 corresponds to O–H stretching of phenolic compounds, while the 2935 cm−1 band reflects aliphatic C–H groups typical of flavonoids and alkaloids. Peaks at 1612 and 1381 cm−1 indicate aromatic C=C stretching, and the 1183–1023 cm−1 region shows C–H bending and C–O stretching associated with oxygenated groups and glycosidic linkages in erythrin alkaloids[25]. Altogether, the spectrum supports the presence of phenolic and alkaloid constituents, confirming the extract’s chemical complexity. 3.1.4 Antimicrobial activity After the incubation period, it was found that the aqueous extract of Erythrina mulungu presented a slight inhibition of the growth of the bacteria under study, as the formation of the inhibition halo for the two types of bacteria under analysis could be verified. As illustrated in Figure 4, inhibition halos were observed for both bacterial strains. The images relating to the antimicrobial activity test can be seen in the figures below. Measurement of the inhibition halos yielded values of 9.75 ± 0.10 mm for Escherichia coli and 8.5 ± 0.06 mm for Staphylococcus aureus. These results indicate that both bacterial strains exhibited resistance to the aqueous extract of Erythrina mulungu, as the inhibition halo diameters were less than 14 mm. 3.1.5 Antioxidant activity The antioxidant activity was evaluated using the DPPH radical inhibition method (Section 2.2.1), resulting in 14.70% inhibition for 100 µL of the Erythrina mulungu aqueous extract. As reported by Ramos et al.[26], phenolic compounds are mainly responsible for the antioxidant activity of E. mulungu due to their ability to neutralize free radicals. The relatively low inhibition observed here may be related to the limited solubility of nonpolar compounds, such as flavonoids and alkaloids, which are known contributors to antioxidant activity but are poorly extracted in water. 4/10
Although this study focused on the aqueous extract as the culture medium, exploratory tests were also performed with the ethanolic extract. When used as the sole medium, the ethanolic extract did not support membrane formation, suggesting that its composition or residual ethanol affected bacterial viability. These results indicate that, while ethanol is more efficient at extracting antioxidant compounds, its direct use as a culture medium is unsuitable, being more appropriate as a supplement. This highlights the importance of balancing solvent extraction efficiency with microbial compatibility in bacterial cellulose production[26]. These results, together with the chemical profile identified by HPLC and FTIR, reinforce that the phenolic and alkaloid compounds present in the extract not only influence BC yield but also confer relevant bioactive properties, even if at moderate intensity.
3.2 Characterization of the produced membranes 3.2.1 Fourier Transform Infrared Spectroscopy The characteristic bands of BC can be observed in Figure 5, which shows the infrared spectrum of bacterial cellulose produced using the aqueous extract of Erythrina mulungu. Figure 5 shows the FTIR spectra of BC produced in saline medium and in Erythrina mulungu extract. Both samples display the typical cellulose bands (O–H at 3690–2981 cm−1 and C–H at 2974–2831 cm−1). In the mulunguderived BC, additional signals appear between 1750 and 1028 cm−1. The weak 1740–1750 cm−1 band suggests esterified or conjugated C=O groups[27,28], while bands at 1652–1647 cm−1 (asymmetric COO−), 1430–1412 cm−1 (symmetric COO−), and 1300–1028 cm−1 (aromatic vibrations) indicate phenolic and alkaloid compounds from the extract[29]. These features confirm the incorporation of E. mulungu metabolites into the BC network. 3.2.2 X-ray diffractometry In Figure 6, the XRD pattern of bacterial cellulose obtained from the aqueous extract of Erythrina mulungu is shown, in comparison with BC Salts. Polímeros, 36(3), e20260028, 2026
Bacterial cellulose synthesized in Erythrina mulungu extract: structural and bioactive properties
Figure 4. Antimicrobial activity of the aqueous extract of Erythrina mulungu against (a) Escherichia coli and (b) Staphylococcus aureus.
Figure 5. Infrared spectra of BC Salts and BC Mulungu membranes.
Figure 6. XRD patterns of BC Salts and BC Mulungu membranes.
Figure 6 shows the XRD patterns of bacterial cellulose samples obtained in salt medium and in aqueous extract of Erythrina mulungu. Both profiles exhibit broad diffraction peaks, typical of semicrystalline materials such as bacterial cellulose, with reflections at 2θ ≈ 14.6° (plane 110), 17.1° (plane 110), and 22.7° (plane 200), corresponding to the crystalline structure of cellulose type I[30]. Polímeros, 36(3), e20260028, 2026
The similarity between the BC Salts and BC Mulungu diffractograms indicates that the extract did not alter the cellulose I crystalline pattern. However, the crystallinity index decreased from 72% (BC Salts) to 46% (BC Mulungu), showing that the extract promoted a more amorphous structure. This reduction may result from interactions between extract metabolites and the cellulose hydrogenbonding 5/10
Silva, G. S., Henrique, M. A., Alves Júnior, S., & Vinhas, G. M. network[31,32]. Lower crystallinity can enhance flexibility, porosity, and active incorporation, which are desirable for food and biomedical applications[33]. The decrease is also consistent with the lower thermal stability observed in TG analyses, reinforcing the relationship between structural organization and thermal resistance.
enhance thermal resistance[35-38]. Although the lower stability may limit certain industrial applications, it favors greater flexibility and porosity, which are desirable characteristics for biomedical and foodrelated uses. Mass losses for each stage and the final residue at 600 °C are presented in Table 2. The final residue corresponds to the nonvolatile fraction, mainly ash and inorganic compounds resistant to 600 °C under nitrogen[39]. BC from the aqueous extract showed lower mass loss in the first stage (8.26%) than BC Salts (17.99%), likely due to reduced moisture. In later stages, it exhibited higher mass losses and a smaller final residue (26.55% vs. 34.95%), indicating lower thermal stability, consistent with its reduced crystallinity.
3.2.3 Thermogravimetry The thermograms of the produced membranes are shown in Figure 7, and the degradation temperature results can be observed in Table 1. As shown in Figure 7 and Table 1, the bacterial cellulose samples exhibited three main massloss stages: (i) moisture evaporation near 100 °C, (ii) cellulose decomposition with depolymerization and carbonaceous residue formation, and (iii) thermooxidative degradation above 300–350 °C[4,29,34]. The second stage, occurring around 200–300 °C, corresponds to the breakdown of β1,4glycosidic bonds, consistent with typical BC degradation. In this study, Ton, Tmax and Toff were obtained directly from the DTG curves, which provide more precise identification of the onset, maximum and end temperatures of each event, avoiding extrapolation from TG data. Although Tmax values were similar between samples, BC produced with the mulungu extract showed a lower Ton, indicating earlier degradation and reduced thermal stability compared to BC Salts. This behavior is associated with its lower crystallinity, since more crystalline regions
3.2.4 Scanning electron microscopy SEM analysis revealed that the microstructural morphology of BC Mulungu (Figure 8a) consists of an interconnected, three-dimensional network of cellulose nanofibrils, forming a porous and fibrous architecture. The membranes, previously sterilized by gamma irradiation to ensure purity and integrity, displayed a clean, nanofibrous arrangement, free of visible contaminants, highlighting the effectiveness of the treatment in preserving the intrinsic structure of bacterial cellulose. This morphology reflects the hierarchical organization of cellulose chains during the membrane formation process[40]. Moreover, the observed architecture closely resembles that of the BC membrane produced using the salt medium (Figure 8b), confirming that the alternative cultivation
Figure 7. TG (a) and DTG (b) curves of BC Salts and BC Mulungu membranes.
Table 1. TG parameters for BC Salts and BC Mulungu membranes. Films
1st Stage (Ton – Toff – Tmax)
2nd Stage (Ton – Toff – Tmax)
3rd Stage (Ton – Toff – Tmax)
BC Salt
31.33 – 188.33 – 161.73
188.33 – 252.33 – 214.72
290.33 – 553.00 – 324.96
BC Mulungu
49.33 – 140.33 – 117.31
161.17 – 258.17 – 203.09
272.83 – 599.83 – 325.35
Table 2. TG parameters of BC Salts and BC Mulungu membranes. Samples BC Salts BC Mulungu
6/10
1° Stage 17.99 8.26
Weight Loss (%) 2° Stage 18.14 27.05
Residue (%) 3° Stage 22.30 33.83
34.95 26.55
Polímeros, 36(3), e20260028, 2026
Bacterial cellulose synthesized in Erythrina mulungu extract: structural and bioactive properties
Figure 8. Micrographs of (a) BC Mulungu and (b) BC Salts membranes.
Figure 9. Antimicrobial activity of BC Salts against (a) Escherichia coli; and (b) Staphylococcus aureus; and of BC Mulungu against (c) Escherichia coli; and (d) Staphylococcus aureus.
strategy successfully promoted the synthesis of bacterial cellulose nanofibrils with comparable structural features. 3.2.5 Antimicrobial activity The antimicrobial activity test was conducted for both membrane samples. Following the incubation period, inhibition of microbial growth was observed for both bacterial strains, as demonstrated in Figure 9. Postincubation analysis confirmed the formation of clear inhibition halos for all samples. BC Salts produced halos of 24.75 ± 0.10 mm against Escherichia coli and 39.25 ± 0.96 mm against Staphylococcus aureus. BC Mulungu showed larger halos, 31.50 ± 0.51 mm and 46.50 ± 0.24 mm for E. coli and S. aureus, respectively, demonstrating stronger antimicrobial activity. The activity observed for BC Salts is attributed to metallic compounds in the saline medium, which can disrupt bacterial membranes and promote cell death[41]. The higher inhibition values obtained for BC Mulungu indicate that bioactive compounds from Erythrina mulungu enhanced the antimicrobial performance of the membranes, reinforcing the extract’s relevance as an effective culture medium. Direct comparison with the literature is limited because no studies were found using the same concentration of aqueous extract. Still, previous works consistently report Polímeros, 36(3), e20260028, 2026
antimicrobial and antioxidant activities in Erythrina species, attributed mainly to flavonoids and alkaloids[42-45], supporting the coherence of the activities observed here. Moreover, the inhibition halos obtained for membranes produced with Erythrina mulungu extract exceeded values commonly reported for conventional bacterial cellulose, indicating that incorporating plantderived metabolites can be an effective strategy for functionalizing cellulosebased membranes. 3.2.6 Antioxidant activity The antioxidant activity of BC Mulungu was 10.14%, while BC Salts showed only 1.5%. The aqueous extract of Erythrina mulungu exhibited 14.70% activity, which decreased to 10.14% after incorporation into the BC membrane. This reduction reflects the partial adsorption of phenolic compounds into the cellulose matrix and their gradual release, yet the activity remains far higher than that of standard BC. These results indicate that the phenolic compounds from the mulungu extract were effectively incorporated and retained in the BC structure, giving the membrane significant antioxidant functionality. In contrast, BC produced in the saline medium showed minimal activity, confirming the absence of bioactive compounds. Overall, the incorporation of mulungu extract generated a functionalized BC with clear bioactive potential and provides a basis for future optimization. 7/10
Silva, G. S., Henrique, M. A., Alves Júnior, S., & Vinhas, G. M.
4. Conclusions This study demonstrated that bacterial cellulose can be produced using an aqueous extract of Erythrina mulungu, generating membranes with good structural quality. FTIR confirmed the characteristic BC profile, while XRD showed a more amorphous structure in mulungu-derived membranes. Thermogravimetric analysis indicated lower thermal stability at higher temperatures but greater stability in the initial stages. Both membranes showed antimicrobial activity against Escherichia coli and Staphylococcus aureus, with stronger inhibition for BC produced in the mulungu extract. Antioxidant activity was also detected only in this membrane, confirming the incorporation of bioactive compounds. Overall, BC synthesized with E. mulungu presents combined antimicrobial and antioxidant functionalities, indicating potential for future technological and biomedical applications.
5. Author’s Contribution •
Conceptualization – Girlaine Santos da Silva; Glória Maria Vinhas.
•
Data curation – Girlaine Santos da Silva; Mariana Alves Henrique.
•
Formal analysis – Girlaine Santos da Silva.
•
Funding acquisition – Girlaine Santos da Silva.
•
Investigation – Girlaine Santos da Silva.
•
Methodology – Girlaine Santos da Silva; Mariana Alves Henrique; Glória Maria Vinhas.
•
Project administration – Girlaine Santos da Silva.
•
Resources – Girlaine Santos da Silva; Mariana Alves Henrique; Severino Alves Júnior; Glória Maria Vinhas.
•
Software – NA.
•
Supervision – Glória Maria Vinhas.
•
Validation – Girlaine Santos da Silva; Glória Maria Vinhas.
•
Visualization – Girlaine Santos da Silva.
•
Writing – original draft – Girlaine Santos da Silva.
•
Writing – review & editing – Girlaine Santos da Silva; Mariana Alves Henrique; Severino Alves Júnior; Glória Maria Vinhas.
6. Acknowledgements The authors gratefully acknowledge the support provided by the Foundation for the Improvement of Higher Education Personnel (CAPES), the Foundation for Science and Technology Support of the State of Pernambuco (FACEPE), the National Council for Scientific and Technological Development (CNPq), and the Center for Research in Therapeutic Innovation (Nupit).
7. References 1. Oliveira, R. V., Kumineck, S. R., Jr., Garcia, M. C. F., Apati, G. P., Leitzke, T. D. C. G., Schneider, A. L. D. S., & Pezzin, A. P. T. (2022). Biocompósito biodegradável hidrofóbico a base de amido de banana verde associado 8/10
à celulose bacteriana. Matéria, 27(1), e202149059. https://doi.org/10.1590/1517-7076-rmat-2021-49059. 2. Lahiri, D., Nag, M., Dutta, B., Dey, A., Sarkar, T., Pati, S., Edinur, H. A., Abdul Kari, Z., Mohd Noor, N. H., & Ray, R. R. (2021). Bacterial cellulose: Production, characterization, and application as antimicrobial agent. International Journal of Molecular Sciences, 22(23), 12984. https://doi.org/10.3390/ijms222312984. PMid:34884787. 3. Swingler, S., Gupta, A., Gibson, H., Kowalczuk, M., Heaselgrave, W., & Radecka, I. (2021). Recent advances and applications of bacterial cellulose in biomedicine. Polymers, 13(3), 412. https://doi.org/10.3390/polym13030412. PMid:33525406. 4. Silva, G. S., Trindade, F. C. S., Souza, K. C., Caetano, V. F., Almeida, Y. M. B., & Vinhas, G. M. (2021). Avaliação da influência da incorporação do óleo de coco em membranas de celulose bacteriana. Research. Social Development, 10(1), e52910112002. https://doi.org/10.33448/rsd-v10i1.12002. 5. Silva, J. G. M., Pinto, F. C. M., Oliveira, G. M., Silva, A. A., Campos, O., Jr., Silva, R. O., Teixeira, V. W., Melo, I. M. F., Paumgartten, F. J. R., Souza, T. P., Carvalho, R. R., Oliveira, A. C. A. X., Aguiar, J. L. A., & Teixeira, A. A. C. (2020). Non-clinical safety study of sugarcane bacterial cellulose hydrogel. Research. Social Development, 9(9), e960997932. https://doi.org/10.33448/rsd-v9i9.7932. 6. Nascimento, H. A. (2022). Produção de biopolímero de celulose bacteriana enriquecido com antioxidante natural (Doctoral thesis). Universidade Federal de Pernambuco, Recife. Retrieved in 2025, September 29, from https://repositorio.ufpe.br/handle/123456789/46531 7. Duarte, E. B., Chagas, B. S., Andrade, F. K., Brígida, A. I. S., Borges, M. F., Muniz, C. R., Souza Filho, M. S. M., Morais, J. P. S., Feitosa, J. P. A., & Rosa, M. F. (2015). Production of hydroxyapatite–bacterial cellulose nanocomposites from agroindustrial wastes. Cellulose, 22(5), 3177-3187. https://doi.org/10.1007/s10570-015-0734-8. 8. Tilak, J., Sanjeev, B., Marimuthu, S., & Uthandi, S. (2020). Bacterial cellulose nanofiber (BCNF) as carrier support for the immobilization of probiotic Lactobacillus acidophilus 016. Carbohydrate Polymers, 250, 116965. https://doi.org/10.1016/j.carbpol.2020.116965. PMid:33049863. 9. Wu, Y., Huang, T.-Y., Li, Z.-X., Huang, Z.-Y., Lu, Y.-Q., Gao, J., Hu, Y., & Huang, C. (2021). In-situ fermentation with gellan gum adding to produce bacterial cellulose from traditional Chinese medicinal herb residues hydrolysate. Carbohydrate Polymers, 270, 118350. https://doi.org/10.1016/j.carbpol.2021.118350. PMid:34364598. 10. Nowak, A., Ossowicz-Rupniewska, P., Rakoczy, R., Konopacki, M., Perużyńska, M., Droździk, M., Makuch, E., Duchnik, W., Kucharski, Ł., Wenelska, K., & Klimowicz, A. (2021). Bacterial cellulose membrane containing Epilobium angustifolium L. extract as a promising material for the topical delivery of antioxidants to the skin. International Journal of Molecular Sciences, 22(12), 6269. https://doi.org/10.3390/ijms22126269. PMid:34200927. 11. Samyn, P., Meftahi, A., Abbasi Geravand, S., Momeni Heravi, M. E., Najarzadeh, H., Kashef Sabery, M. S., & Barhoum, A. (2023). Opportunities for bacterial nanocellulose in biomedical applications: review on biosynthesis, modification and challenges. International Journal of Biological Macromolecules, 231, 123316. https://doi.org/10.1016/j.ijbiomac.2023.123316. PMid:36682647. 12. Cardoso, A. P. M. (2021). Uso de bioestimulante à base de algas e água residuária da aquicultura na produção de mudas de Erythrina velutina Willd em solo degradado (Master’s dissertation). Instituto Federal de Educação, Ciência Polímeros, 36(3), e20260028, 2026
Bacterial cellulose synthesized in Erythrina mulungu extract: structural and bioactive properties e Tecnologia do Rio Grande do Norte, Natal. Retrieved in 2025, September 29, from http://memoria.ifrn.edu.br/ handle/1044/2151 13. Santiago, I. F., Damasceno, H. G. M. C., & Cavelet, L. C. (2022). Perfil farmacológico de Erythrina velutina em transtorno de ansiedade. Revista Ibero-Americana de Humanidades. Ciência & Educação, 8(10), 1711-1720. https://doi.org/10.51891/rease.v8i10.7221. 14. Silva, G. S., Henrique, M. A., Alves Júnior, S., & Vinhas, G. M. (2026). Avaliação comparativa dos extratos aquoso e etanólico de Erythrina mulungu: composição química e atividades biológicas. Research, Social, Development, 15(2), e3315250640. https://doi.org/10.33448/rsd-v15i2.50640. 15. Hestrin, S., & Schramm, M. (1953). Synthesis of cellulose by Acetobacter xylinum. II. Preparation of freeze-dried cells capable of polymerizing glucose to cellulose. The Biochemical Journal, 58(2), 345-352. https://doi.org/10.1042/bj0580345. PMid:13208601. 16. de Souza, K. C., Caetano, V. F., Vinhas, G. M., & de Carvalho, R. V. (2020). BR Patent 102020012400-5 [Saline medium for bacterial cellulose production applied in environmental remediation]. Rio de Janeiro: Instituto Nacional da Propriedade Intelectual. Retrieved in 2025, September 29, from https:// repositorio.ufpe.br/bitstream/123456789/61585/1/BR%20 102020012400.pdf 17. Lima, A. C. A., Brito, A. M. S. S., Caetano, V. F., & Vinhas, G. M. (2025). Incorporation of cashew bark extract and gamma irradiation effects on biodegradable bacterial cellulose/kappacarrageenan film. Express Polymer Letters, 19(6), 610-627. https://doi.org/10.3144/expresspolymlett.2025.46. 18. Brand-Williams, W., Cuvelier, M. E., & Berset, C. (1995). Use of a free radical method to evaluate antioxidant activity. Lebensmittel-Wissenschaft + Technologie, 28(1), 25-30. https://doi.org/10.1016/S0023-6438(95)80008-5. 19. Segal, L., Creely, J. J., Martin, A. E., Jr, & Conrad, C. M. (1959). An empirical method for estimating the degree of crystallinity of native cellulose using the X-ray diffractometer. Textile Research Journal, 29(10), 786-794. https://doi.org/10.1177/004051755902901003. 20. Rambo, D. F. (2011). Determinação de parâmetros de controle de qualidade para Erythrina verna Vell. (Master’s dissertation). Universidade Federal do Rio Grande do Sul, Porto Alegre. Retrieved in 2025, September 29, from https://lume.ufrgs.br/handle/10183/143347 21. Amorim, J., Borges, M. C., Fabro, A. T., Contini, S. H. T., Valdevite, M., Pereira, A. M. S., & Carmona, F. (2019). The ethanolic extract from Erythrina mulungu Benth. flowers attenuates allergic airway inflammation and hyperresponsiveness in a murine model of asthma. Journal of Ethnopharmacology, 242, 111467. https://doi.org/10.1016/j.jep.2018.08.009. PMid:30102994. 22. Bezerra, J. W. A., Coronel, C., Gomez, M. C. V., Rolón, M., Nunez, C. V., Silva, D. R., Silva, L. A., Rodrigues, F. C., Boligon, A. A., Souza, M. A., Linhares, K. V., Silva, M. A. P., & Morais-Braga, M. F. B. (2019). Evaluation of antiparasitary, cytotoxic and antioxidant activity and chemical analysis of Tarenaya spinosa (Jacq.) Raf. (Cleomaceae). South African Journal of Botany, 124, 546-555. https://doi.org/10.1016/j.sajb.2019.05.025. 23. Aryal, S., Baniya, M. K., Danekhu, K., Kunwar, P., Gurung, R., & Koirala, N. (2019). Total phenolic content, flavonoid content and antioxidant potential of wild vegetables from Western Nepal. Plants, 8(4), 96. https://doi.org/10.3390/ plants8040096. PMid:30978964. 24. Mota, G. S., Nery, F. C., Araujo, E. S., Lorenço, M. S., Pereira, H., & Mori, F. A. (2025). Characterization of cork features of Erythrina mulungu and Enterolobium gummiferum in view Polímeros, 36(3), e20260028, 2026
of a potential valorization and conservation of forest species in the Cerrado bioma. Holz als Roh- und Werkstoff, 83(1), 2. https://doi.org/10.1007/s00107-024-02159-y. 25. Tondi, G., Link, M., Oo, C. W., & Petutschnigg, A. (2015). A simple approach to distinguish classic and formaldehyde-free tannin-based rigid foams by ATR FT-IR. Journal of Spectroscopy, 2015(1), 902340. https://doi.org/10.1155/2015/902340. 26. Ramos, R. M., Feitosa, J. M., Lima, V. S., Santos, R. C., Oliveira, A. M., Soares, L. A. L., & Silva, G. C. (2020). Comparative study of phytochemical composition, citotoxicity and potentials antioxidant and photoprotector of the bark and leaf of Erythrina velutina. Brazilian Journal of Development, 6(6), 33140-33158. https://doi.org/10.34117/bjdv6n6-026. 27. Xing, T.-Q., Zhao, T.-F., Hu, C.-S., Cao, X.-F., Sun, S.-N., Shen, X.-J., Wen, J.-L., Yuan, T.-Q., & Sun, R.-C. (2024). Ultrafast surface esterification of cellulosic materials in aqueous media at room temperature. Cellulose, 31(17), 10241-10252. https://doi.org/10.1007/s10570-024-06205-z. 28. Wang, B., Wang, B., Yang, D., Zhang, H.-R., Huang, C., Xiong, L., Luo, J., & Chen, X.-D. (2016). Preparation of esterified bacterial cellulose for improved mechanical properties and the microstructure of isotactic polypropylene/ bacterial cellulose composites. Polymers, 8(4), 129. https://doi.org/10.3390/polym8040129. PMid:30979230. 29. Jafari, M. S., Ghadami, S., Mantripragada, S., Dellinger, K., Alston, J. R., & LaJeunesse, D. R. (2025). Facile and green carboxylation of never-dried bacterial cellulose produced from low-cost substrates: structural characterization and copper binding performance. Materials Advances, 6(23), 8936-8951. https://doi.org/10.1039/D5MA00725A. 30. Campêlo, J. M. (2017). Produção de celulose bacteriana em meio à base de glicerol (Master’s dissertation). Universidade Federal de Pernambuco, Recife. Retrieved in 2025, September 29, from https://repositorio.ufpe.br/handle/123456789/29670 31. Albuquerque, R. M. B. (2019). Desenvolvimento de uma blenda biodegradável à base de celulose bacteriana (BC) e polihidroxibutirato (PHB) para aplicação como embalagem ativa de alimentos (Master’s dissertation). Universidade Federal de Pernambuco, Recife. Retrieved in 2025, September 29, from http://tede2.unicap.br:8080/handle/tede/1112 32. Sumini, M., Andrade, G. J. S., Tischer, C. A., Kobayashi, R. K. T., & Nakazato, G. (2025). Production of bacterial cellulose by Komagataeibacter xylinus: Biochemistry, synthesis and applications. Cellulose, 32(1), 81-94. https://doi.org/10.1007/s10570-024-06179-y. 33. Castellões, F. R. L. (2016). Estudo das condições de processamento e caracterização da matéria prima para a produção de um biocompósito de matriz de poli(succinato de butileno) com reforço de celulose branqueada (Undergraduate thesis). Centro Federal de Educação Tecnológica de Minas Gerais, Belo Horizonte. 34. Barud, H. S., Ribeiro, C. A., Capela, J. M. V., Crespi, M. S., Ribeiro, S. J. L., & Messadeq, Y. (2011). Kinetic parameters for thermal decomposition of microcrystalline, vegetal, and bacterial cellulose. Journal of Thermal Analysis and Calorimetry, 105(2), 421-426. https://doi.org/10.1007/s10973-010-1118-9. 35. Calahorra, M. E., Cortázar, M., Eguiazábal, J. I., & Guzmán, G. M. (1989). Thermogravimetric analysis of cellulose: effect of the molecular weight on thermal decomposition. Journal of Applied Polymer Science, 37(12), 3305-3314. https://doi.org/10.1002/app.1989.070371203. 36. Terinte, N., Ibbett, R., & Schuster, K. C. (2011). Overview on native cellulose and microcrystalline cellulose I structure studied by X-ray diffraction (WAXD): comparison between measurement techniques. Lenzinger Berichte, 89, 118-131. Retrieved in 2025, September 29, from https://www.researchgate. 9/10
Silva, G. S., Henrique, M. A., Alves Júnior, S., & Vinhas, G. M. net/publication/266593566_Overview_on_native_cellulose_ and_microcrystalline_cellulose_I_structure_studied_by_Xray_diffraction_WAXD_Comparison_between_measurement_ techniques 37. Poletto, M., Ornaghi, H. L., Jr., & Zattera, A. J. (2020). Thermal decomposition of natural fibers: Kinetics and degradation mechanisms. In A. Tiwari, & B. Raj (Eds.), Reactions and mechanisms in thermal analysis of advanced materials (pp. 515-545). Hoboken: John Wiley & Sons, Ltd. https://doi.org/10.1002/9781119117711.ch21. 38. Simplicio, E. N. (2017). Isolamento de nanofibras de celulose de bagaço de cana de açúcar e engaços de dendê obtidas por hidrólise enzimática (Master’s dissertation). Universidade de Brasília, Brasília. 39. Canal, H. H. M., Teles, C. R., Lira, T. S., & Xavier, T. P. (2023). Estudo cinético da copirólise do lodo da indústria de celulose e papel e casca de café. Revista Brasileira de Energia, 29(2), 62-86. https://doi.org/10.47168/rbe.v29i2.731. 40. Cavalcante, J. A. P., Rocha, G. N. S. A. O., Silva, J. Y. R., Santos, D. K. D. N., Vinhas, G. M., & Alves Júnior, S. (2024). Prototype of a biopolymer-based transdermal film with bacterial cellulose membrane and microneedles for methotrexate administration. Materials Letters, 376, 137311. https://doi. org/10.1016/j.matlet.2024.137311. 41. Medeiros, L. F. (2024). Partículas bioinorgânicas metal–proteína, com ação antimicrobiana, incorporadas em filmes de caseína para aplicação em doenças cutâneas caninas (Master’s dissertation). Universidade Federal do Rio Grande do Sul, Porto Alegre.
10/10
42. Herlina, T., Akili, A. W. R., Nishinarizki, V., Hardianto, A., & Latip, J. B. (2025). Review on antibacterial flavonoids from genus Erythrina: structure-activity relationship and mode of action. Heliyon, 11(1), e41395. https://doi.org/10.1016/j. heliyon.2024.e41395. PMid:39811340. 43. Lima, L. M. A., Valdevino, A. B. J. M., Mendes, R. L., & Bezerra, P. Q. M. (2025). Erythrina mulungu: Pharmacological Properties and Therapeutic Potential – A narrative review. Research. Social Development, 14(3), e2514348430. https://doi.org/10.33448/rsd-v14i3.48430. 44. Brasil. Ministério da Saúde. (2023). Informações sistematizadas da relação nacional de plantas medicinais de interesse ao SUS: Erythrina mulungu Mart. ex Benth., Fabaceae (Mulungu). Retrieved in 2025, September 29, from https:// bvsms.saude.gov.br/bvs/publicacoes/informacoes_renisus_ erythrina_mulungu.pdf 45. Palumbo, C. F. G., Gardin, N. E., & Nakamura, M. U. (2016). Erythrina mulungu Mart. ex Benth and Erythrina velutina Willd.: pharmacological aspects and anthroposophic view of these Brazilian plants. Arte Médica Ampliada, 36(4), 152-161. Retrieved in 2025, September 29, from https://docs.bvsalud. org/biblioref/2017/12/876394/36-4-erythrina-mulungu-eerythrina-velutina.pdf Received: Sep. 29, 2025 Revised: Apr. 18, 2026 Accepted: Apr. 30, 2026 Editor-in-Chief: Sebastião V. Canevarolo
Polímeros, 36(3), e20260028, 2026
ISSN 1678-5169 (Online)
https://doi.org/10.1590/0104-1428.20250112
Effect of silica nanoparticles on systems based on polyethylene/offshore-recovered polyamide 11 blends* Joyce Braga Camargo1 , Gisele Cristina Valle Iulianelli1 , Christine Rabello Nascimento2 and Ana Lúcia Nazareth da Silva1,2* Instituto de Macromoléculas Professora Eloisa Mano – IMA, Universidade Federal do Rio de Janeiro – UFRJ, Rio de Janeiro, RJ, Brasil 2 Programa de Engenharia Ambiental – PEA, Universidade Federal do Rio de Janeiro – UFRJ, Rio de Janeiro, RJ, Brasil *This paper has been partially presented at the 17th Brazilian Polymer Congress, held in Joinville, SC, 29/Oct - 02/Nov/2023. 1
*ananazareth@ima.ufrj.br
Abstract This study produces and characterizes immiscible blend systems made with high-density polyethylene (HDPE) and post-industrial polyamide 11 (PA11) obtained from offshore. Blends were prepared at an 80/20 (wt.%) HDPE/PA11 ratio. To enhance phase compatibility, high-density polyethylene grafted with maleic anhydride (HDPE-g-MA) was employed as a conventional compatibilizer at 1.5 wt.% content. In addition, the effect of silicon dioxide nanoparticles (nSiO2) incorporated at 2 and 4 wt.% contents was evaluated. The compositions were analyzed in the presence and absence of the compatibilizer. Mechanical, thermal, rheological, and morphological analyses showed that HDPE-g-MA led to a slight improvement in the interfacial interaction between the immiscible polymer phases. Moreover, the addition of nSiO2, in the presence of the traditional compatibilizer, led to the most favorable balance of thermal and mechanical performance, suggesting that nSiO2 nanoparticles may act as effective co-compatibilizers in HDPE/HDPE-g-MA/PA11 systems. Keywords: immiscible polymer blends, compatibilization processes, nanocomposites, SiO2 nanoparticles. Data Availability: All data supporting the findings of this study are available from the corresponding author upon request. How to cite: Camargo, J. B., Iulianelli, G. C. V., Nascimento, C. R., & Silva, A. L. N. (2026). Effect of silica nanoparticles on systems based on polyethylene/offshore-recovered polyamide 11 blends. Polímeros: Ciência e Tecnologia, 36(3), e20260030. https://doi.org/10.1590/0104-1428.20250112.
1. Introduction Since the emergence of polymeric materials, one of their main advantages over inorganic materials has been their low density. However, due to their relatively weak mechanical and thermal performance compared to metals, for instance, various polymeric systems have been developed to meet increasingly demanding applications[1,2]. To enhance their performance, polymers were progressively reinforced with higher filler loadings, which in turn compromised other properties. From the 1980s onwards, a new class of materials emerged, the polymer nanocomposites, opening new possibilities with the advent of nanotechnology[3]. The performance of polymer blends is significantly influenced by the morphology of the dispersed phase, which can take forms such as spherical particles, fibers, or lamellae[4]. Adding nanofillers to polymeric systems has improved their properties and added new functionalities[5-7]. Lower production costs and better mechanical and barrier properties have led to a lot of research and technological development of these materials[8].
Polímeros, 36(3), e20260030, 2026
Nanocomposites are defined as multiphase materials in which at least one constituent possesses dimensions within the nanometric scale (0.1-100 nm)[3]. Polymeric nanocomposites are hybrid systems in which a polymer, copolymer, or blend acts as the matrix, and nanofillers are homogeneously dispersed within it. In general, nanocomposites exhibit superior overall performance than neat polymers or regular microcomposites[9-11]. In immiscible polymer blends, the physicochemical and mechanical properties of each polymer remain distinct, and the final material results from the physical combination of two or more incompatible components. However, upon achieving partial miscibility and effective interfacial interactions, synergistic effects may arise, resulting in enhanced or even novel properties that are not observed in the individual polymers[12]. Among the wide variety of nanofillers, silicon dioxide (SiO2) nanoparticles have been extensively reported as effective additives for polymeric matrices, producing nanocomposites with improved and differentiated properties[13-16].
1/10
O O O O O O O O O O O O O O O O
Camargo, J. B., Iulianelli, G. C. V., Nascimento, C. R., & Silva, A. L. N. The present study focuses on the development and evaluation of immiscible polymer systems based on commercial highdensity polyethylene (HDPE) and post-industrial polyamide 11 (PA11) from the pressure barrier of flexible pipes. HDPEg-MA was used as a compatibilizer, and, additionally, the potential compatibilizing or co-compatibilizing role of SiO2 nanoparticles was investigated. The innovative aspect of this work lies in its dual approach: it explores the reuse of high-performance post-consumer PA11 derived from offshore infrastructure, which is an underexplored source, while simultaneously assessing the synergistic effect of HDPE-g-MA and SiO2 nanoparticles in tailoring interfacial interactions in HDPE/PA11 blends, aiming at sustainable and high-performance nanocomposite systems. To contextualize, flexible pipes are key components in offshore oil extraction, as they provide operational adaptability under extreme conditions such as great depths, temperature variations, and intense marine currents[17-20]. These structures consist of multiple polymeric and metallic tubular layers arranged helically (Figure 1). Each layer performs a specific function: while the polymeric layers ensure sealing, the metallic layers provide the mechanical strength required for operation[21-23]. During the service life of these structures, failures may occur, or decommissioning operations may require the removal of flexible pipes from service[24,25]. In both scenarios, although the pressure barriers are typically composed of engineering polymers such as polyamide 11 (PA11), polyamide 12 (PA12), or poly(vinylidene fluoride) (PVDF)[26], these materials are usually discarded without reuse. Therefore, research dedicated to the recycling and valorization of these polymeric barriers aligns with the principles of the Brazilian National Solid Waste Policy (PNRS, 2010), which is defined as an instrument for economic and social development and described as “a set of actions, procedures, and means designed to enable the collection and return of solid waste to the productive sector for reuse in its own production cycle, in other production cycles, or for another environmentally appropriate final destination”[27].
(hydrophobic, surface area of 110 ± 20 m2/g, and particle diameter around 16 nm) was bought from Evonik.
2.2 Blend and composite preparation Post-industrial PA11 was manually cut and subsequently cryogenically ground in liquid nitrogen (Figure 2). Table 1 lists the experimental formulations utilized in this study. The ratio of HDPE to PA11 was maintained at 80:20. The amount of HDPE-g-MA was set at 1.5 wt.%, while n-SiO2 was included at either 2 or 4 wt.%. All blends were meltprocessed using a co-rotational twin-screw extruder, with a temperature profile ranging from 90 to 200 °C at a speed of 400 rpm. Test specimens (Type I, ASTM D638) were produced by injection molding (Arburg 270S). The injection parameters were the temperature range for the barrel zone of 210-250 °C, nozzle temperature of 260 °C, injection pressure of 1600 bar, back pressure of 800 bar, injection speed of 10 cm3.s-1, cooling time of 30 s, and mold temperature of 30 °C. It is important to highlight that the processing conditions were established based on the thermal behavior of the materials, as determined by thermal analyses, ensuring that the selected temperature range was within the processing window and below degradation temperature.
2.3 Characterizations Thermogravimetric analysis (TGA) was performed on a Q500 (TA Instruments) equipment under N2 atmosphere from 30 to 700 °C at 10 °C min-1. The maximum degradation temperature (TMAX) values were determined to assess the thermal stability of the materials. X-ray diffraction (XRD) was conducted on a Rigaku Ultima IV diffractometer (CuKα, λ = 1.54 Å, 40 kV, 30 mA) over 2θ = 2-80° at 1° min-1. The crystallinity degree (χc) was calculated using Fytik software.
2. Materials and Methods 2.1 Materials High-density polyethylene (HDPE), grade GM9450F was supplied by Braskem S.A. According to the manufacturer, it is a high-density polyethylene produced with bimodal technology and developed for the high molar mass film extrusion segment and has a melt flow index (MFI) of 9.3 g.10 min-1 (based on ASTM D1238 standard) and a density of 0.952 g.cm-3 (ASTM D792). Post-industrial polyamide 11 (PA11) (442 °C - temperature at the maximum degradation rate and Tm = 186 °C – melt temperature) from offshore platforms was donated by Primaplast. The post-industrial pressure barrier was previously cleaned, cut, ground, and subsequently quartered to minimize the expected heterogeneity effect, given that it is a post-consumer material. Maleic anhydride-grafted HDPE (HDPE-g-MA, 0.4 wt.% maleic anhydride, Mw = 15,000 g/mol) was bought from Sigma Aldrich. Nanosilica (n-SiO2) type Aerosil R972 2/10
Figure 1. Photo of a typical unbonded flexible riser used in offshore applications, highlighting its main structural layers: interlocked carcasses, pressure armor, tensile armor, pressure barrier, and outer sheath. Polímeros, 36(3), e20260030, 2026
Effect of silica nanoparticles on systems based on polyethylene/offshore-recovered polyamide 11 blends
Figure 2. Photo of post-industrial PA11 and ground sample.
Table 1. Compositions based on HDPE/PA11—Amounts in wt. %. Sample Code HDPE/PA11 HDPE/HDPE-g-AM/PA11 HDPE/PA11 + 2% nSiO2 HDPE/HDPE-g-AM/PA11+ 2% nSiO2 HDPE/PA11 + 4% nSiO2 HDPE/HDPE-g-AM/PA11+ 4% nSiO2
HDPE
PA11
HDPE-g-MA
nSiO2
80 80 80 80 80 80
20 20 20 20 20 20
1.5 1.5 1.5
2 2 4 4
The surface morphology of the compositions was analyzed using a TESCAN FEG microscope at 10 kV of voltage. Samples were fractured using liquid nitrogen and then coated with gold. Oscillatory rheology was carried out on an Anton Paar MCR 301 rheometer with 25 mm parallel plates and 1 mm gap at 200 °C. Stress sweep determined the linear viscoelastic region, followed by frequency sweeps (100 Pa, 0.1-600 rad/s) to obtain complex viscosity (η*) and storage modulus (G’). Tensile tests were performed using a universal testing machine (EMIC DL3000) according to ASTM D638 (Type I) at a crosshead speed of 50 mm min-1. This test was replicated 5 times. Data were analyzed using STATISTICA 6. ANOVA verified significant differences, with residual normality and variance homogeneity tested. Fisher’s LSD test was applied at α = 0.05.
3. Results and Discussion 3.1 Thermal analysis The thermal stability of the HDPE/PA11 systems, with and without n-SiO2 nanoparticles, was evaluated based on their TMAX values, as presented in Table 2. Polímeros, 36(3), e20260030, 2026
Table 2. TGA results of the HDPE/PA11 compositions. Sample Code HDPE/PA11 HDPE/HDPE-g-AM/PA11 HDPE/PA11 + 2% nSiO2 HDPE/HDPE-g-AM/PA11+ 2% nSiO2 HDPE/PA11 + 4% nSiO2 HDPE/HDPE-g-AM/PA11+ 4% nSiO2
TMAX (°C) ± 2 °C 467 461 479 482 466 479
Although HDPE-g-MA is recognized to be an efficient compatibilizer for HDPE and PA11 blends[12-14], a reduction in TMAX for the HDPE/PA11 blend was observed (Table 2) and showed in the TGA/DTG thermograms (Figure 3). This decrease in thermal behavior can be attributed to the fact that the PA11 used in this study is a post-industrial material; therefore, it was exposed to oil during service, which could have impaired the compatibilization efficiency of HDPE-g-MA. The addition of 2% wt. of nSiO2 to the HDPE/PA11 blend led to a rise in TMAX value (approximately 12 °C), indicating enhanced thermal stability. This behavior can be attributed to the barrier effect promoted by well-dispersed nanoparticles, which restrict the diffusion of volatile degradation products 3/10
Camargo, J. B., Iulianelli, G. C. V., Nascimento, C. R., & Silva, A. L. N. and delay thermal decomposition[1,7,26]. In the compatibilized system (presence of the compatibilizer agent), the addition of 2 wt.% nSiO2 resulted in a slightly higher increase in TMAX (15 °C), suggesting a synergistic effect between HDPE-gMA and the nanoparticles, improving interfacial adhesion and dispersion[1,4,28]. At higher nanoparticle loading (4 wt.%), no significant increase in TMAX was observed for the non-compatibilized blend, likely due to nanoparticle agglomeration, which reduces the effective surface area and limits the barrier effect[6,25]. In contrast, in the presence of the compatibilizer, the addition of 4 wt.% nSiO2 still promoted an increase in TMAX, although comparable to that observed at the composition without the compatibilizing agent. This result suggests that HDPE-g-MA contributes to a more effective dispersion of nanoparticles, even at higher loadings, maintaining their stabilizing effect[1,28]. It is important to note that PA11 used in this study is a post-industrial material, which may introduce some variability in the results due to differences in prior processing and service history[13,16]. However, to minimize heterogeneity, the PA11 was previously ground to improve its dispersion within the HDPE matrix. Therefore, the observed thermal behavior is primarily associated with morphological factors, such as nanoparticle dispersion and interfacial interactions, rather than solely the previous exposure conditions of the PA11. It is also important to highlight that the mass loss observed in the temperature range between 30-250 °C refers to the loss of plasticizer, normally present in commercial grades of PA11 used in the manufacture of pressure barriers.
3.2 Morphology – SEM analysis Figure 4 shows the SEM micrographs of neat HDPE, HDPE/PA11 blends with and without compatibilizer, and HDPE/PA11/nSiO2 composites with and without compatibilizer. According to Figure 4a, the HDPE/PA11 binary blend has typical island-sea-type morphology, where irregular droplets (island phase) are dispersed in the HDPE matrix (sea phase).
When the compatibilizer (HDPE-g-MA) was added to the HDPE/PA11 binary blend (Figure 4b), the droplets of PA11 seem to have become more uniform, although there is no evidence of having an effective interaction between the HDPE and PA11 phases. Further, adding 2% and 4% wt. nSiO2 to the HDPE/HDPE-g-MA/PA11 blends (Figures 4d and 4f) changed the PA11 dispersed phase morphology compared to the HDPE/PA11 blends containing the same amount of nSiO2 but without HDPE-g-MA (Figures 4c and 4e). The dispersed phase of PA11 becomes more uniform and well dispersed in the HDPE matrix, indicating an improvement in interaction between the HDPE and PA11 phases. Similar behavior was reported in the literature for an HDPE/PLA blend with HDPE-g-MA compatibilizer and CaCO3 nanoparticles (nCaCO3)[29]. In that study, the authors reported that a reduction in the interfacial tension caused a synergistic effect of HDPE-g-MA and nCaCO3. The morphologies observed in Figure 4 also suggest the synergistic effect of the SiO2 nanoparticles and HDPE-g-MA on the interaction between the immiscible phases, HDPE and PA11. These evaluations corroborate the previously discussed results (Table 2), indicating that, in the presence of the HDPE-g-MA, nSiO2 can act as a co-compatibilizer for the HDPE/PA11 blend.
3.3 X-ray diffraction (XRD) analysis Figure 5 presents the X-ray diffraction patterns of the raw materials: HDPE (a), PA11 (b), and nSiO2 (c). The diffractograms of the processed materials, including neat HDPE, PA11, nSiO2, and the HDPE/PA11 blends and composites, are shown in Figure 5d. The crystalline peaks of PA11 are observed at diffraction angles (2θ) of 20.2°, corresponding to the (100) crystal plane, and at 23.5°, corresponding to the (010) and (110) planes, which are characteristic of the triclinic α-form arrangement[30]. HDPE has a strong reflection peak at 21.6° and a weaker one at 24.0°. These peaks correspond to the orthorhombic unit cell structure of the (110) and (200) reflection planes, respectively. These 2θ values are consistent with those reported in the literature[28].
Figure 3. (a) TGA curves and (b) DTG curves of HDPE/PA11 compositions. 4/10
Polímeros, 36(3), e20260030, 2026
Effect of silica nanoparticles on systems based on polyethylene/offshore-recovered polyamide 11 blends There are two more weak peaks at about 30.0° and 36.2°, which are caused by the (210) and (020) planes, respectively. There are also a few other small reflections in the 38°-60° range[28]. The commercial nanosilica, Aerosil® R972, exhibits
a broad amorphous profile, lacking distinct reflections from crystalline planes, which indicates its amorphous morphology. Literature suggests that more crystalline forms would show peaks at 13° (020), 17° (110), and 30.7° (002)[2].
Figure 4. SEM micrographs of (a) HDPE/PA11, (b) HDPE/HDPE-g-MA/PA11, (c) HDPE/PA11 + 2% nSiO2, (d) HDPE/HDPE-g-AM/ PA11+ 2% nSiO2, (e) HDPE/PA11 + 4% nSiO2, and (f) HDPE/HDPE-g-AM/PA11+ 4% nSiO2. Polímeros, 36(3), e20260030, 2026
5/10
Camargo, J. B., Iulianelli, G. C. V., Nascimento, C. R., & Silva, A. L. N.
Figure 5. X-ray diffraction patterns (a) HDPE, (b) nSiO2, (c) PA11 and (d) neat HDPE, PA11, nSiO2, and HDPE/PA11 blend.
The diffractograms show that the HDPE/PA11 blend exhibits peak positions similar to those of the individual neat polymers. The HDPE/PA11 blend shows the typical HDPE reflection peaks, with a strong signal at 21.6° and a weaker one at 24.0°, assigned to the (110) and (200) planes of the orthorhombic unit cell[28]. The weaker reflections at 2θ ≈ 30.0° and 36.2° correspond to the (210) and (020) planes, respectively, and minor reflections are also visible in the 38-60° range[30]. The characteristic HDPE peaks in HDPE/PA11 exhibit an amorphous halo, attributed to the overlapping PA11 phase peaks. Figure 6 compares the diffractograms of HDPE/PA11 blends, with and without the HDPE-g-MA compatibilizer, and composites based on HDPE/PA11/nSiO2 with and without the commercial compatibilizer. Figure 6 illustrates that the two primary crystalline peaks located at 21.6° (110) and 24.0° (200) of HDPE exhibited no significant changes in intensity following the addition of the compatibilizing agent. In contrast, the intensity of these peaks decreased in systems containing nSiO2 nanofiller, regardless of the presence of the compatibilizing agent. This reduction was particularly pronounced in the systems with both the compatibilizing agent and nanoparticles, highlighting the synergistic effect of HDPE-g-MA and nSiO2 in enhancing the interaction between the HDPE and 6/10
PA11 phases. Table 3 shows the crystallinity degree of the samples calculated from XRD data. Table 3 shows that the addition of PA11 to HDPE causes a decrease in its crystallinity degree, indicating that the presence of the dispersed PA11 phase hinders the growth of HDPE crystals. With the addition of the compatibilizing agent, there was a more pronounced decrease in crystallinity degree, indicating a greater impediment to crystal growth, probably due to interaction between the HDPE and PA11 phases. The lowest crystallinity values are observed in the HDPE/HDPE-g-MA/PA11 composites containing 2 wt.% and 4 wt.% nSiO2, suggesting a strengthened interphase interaction. This behavior is consistent with literature findings in which hydrophobic nanosilica combined with compatibilizers reduces crystallinity by localizing at the polymer’s interface, restricting chain mobility, and thus reducing the ability of HDPE chains to organize into crystals[26,31,32].
3.4 Oscillatory rheology Oscillatory rheology was utilized to assess the viscoelastic properties of the polymeric systems. Low-frequency measurements yield important insights into the phase structure and the effectiveness of dispersion within the blends[26]. Polímeros, 36(3), e20260030, 2026
Effect of silica nanoparticles on systems based on polyethylene/offshore-recovered polyamide 11 blends Figures 7 and 8 illustrate, respectively, the complex viscosity (η*) and storage modulus (G′) as a function of frequency for HDPE/PA11, both with and without a compatibilizer, as well as for HDPE/PA11/nSiO2 compositions, which also vary in the presence of the HDPE-g-MA compatibilizer and different amounts of SiO2 nanoparticles. The addition of HDPE-g-MA increased the elastic response of the blends, indicating higher flow restriction and improved interfacial adhesion between the polymer phases[27].
Table 3. Crystallinity degree (χc ) of neat HDPE and HDPE/PA11 compositions. Sample Code Neat HDPE HDPE/PA11 HDPE/HDPE-g-AM/PA11 HDPE/PA11 + 2% nSiO2 HDPE/HDPE-g-AM/PA11+ 2% nSiO2 HDPE/PA11 + 4% nSiO2 HDPE/HDPE-g-AM/PA11+ 4% nSiO2
χc (%) 66 60 56 53 45 54 48
The incorporation of SiO2 nanoparticles also affected the viscoelastic behavior, as shown by the increased values of both complex viscosity (Figure 7) and storage modulus (Figure 8) at low frequencies. This behavior suggests that the nanofiller promotes higher phase interaction, even in the absence of the compatibilizer, due to possible physical interactions between the polar groups of PA11 and the surface hydroxyl groups of the silica nanoparticles[28,30,31]. Oscillatory rheology is a key technique for assessing the viscoelastic nature of polymer blends, enabling the correlation of rheological responses with the morphological structure and phase dispersion. The results indicate that the compatibilized systems exhibit more elastic characteristics, especially at low frequencies, confirming the enhanced interfacial adhesion provided by HDPE-g-MA and nSiO2 nanoparticles in the HDPE/PA11 matrix[28].
3.5 Tensile properties Tensile testing results are presented in Table 4. The mechanical properties of the HDPE/PA11 blends were evaluated by tensile testing, showing that the addition of nSiO2 generally increased tensile strength, stress at break, and elastic modulus.
Table 4. Mechanical properties of neat HDPE, HDPE/PA11 and HDPE/HDPE-g-MA/PA11 compositions, with different contents of nSiO2. Sample Code HDPE/PA11 HDPE/HDPE-g-AM/PA11 HDPE/PA11 + 2% nSiO2 HDPE/HDPE-g-AM/PA11+ 2% nSiO2 HDPE/PA11 + 4% nSiO2 HDPE/HDPE-g-AM/PA11+ 4% nSiO2
Stress at break (MPa)* 9.0 9.3 12.0 11.7 11.5 11.2
Elastic Modulus (MPa)* 667 649 713 746 695 751
Strain at Break (%)* 58 72 41 75 42 79
*The values had been verified by performing ANOVA, and a confidence interval of 0.95 was applied.
Figure 6. Diffractograms of neat HDPE and HDPE/PA11 compositions. Polímeros, 36(3), e20260030, 2026
7/10
Camargo, J. B., Iulianelli, G. C. V., Nascimento, C. R., & Silva, A. L. N.
Figure 7. Rheology curves of complex viscosity (η*) versus frequency for HDPE/PA11 and HDPE/HDPE-g-MA/PA11 blends containing 2 wt% and 4 wt% nSiO2.
Figure 8. Rheology curves of storage modulus (G′) versus frequency for HDPE/PA11 and HDPE/HDPE-g-MA/PA11 blends containing 2 wt% and 4 wt% nSiO2.
Based on the Fisher LSD statistical test, the mean values of stress at break of samples with nSiO2 were statistically similar to each other but significantly higher than the HDPE/PA11 matrix, indicating that the nanofiller, with or without HDPE-g-MA, enhances mechanical performance[4,7,26]. Regarding the elastic modulus and strain at break properties, statistical analysis revealed that the HDPE/PA11 compositions with nSiO2 nanofiller tend to present the lower values compared to the composites with the presence of the compatibilizing agent, signaling a co-compatibilizing effect of the nanoparticles with the 8/10
commercial compatibilizer in the tensile properties. It is important to highlight that HDPE/HDPE-g-MA/PA11 systems with the addition of nSiO2 exhibit greater toughness compared to other compositions. Overall, the mechanical, rheological, and thermal performance of the HDPE/PA11/n-SiO2 blends suggests that the addition of SiO2 nanofiller with HDPE-g-MA provides an optimal combination of tensile strength, flow properties, and thermal stability, making these materials promising for injection-molded applications in construction and other industrial uses. Polímeros, 36(3), e20260030, 2026
Effect of silica nanoparticles on systems based on polyethylene/offshore-recovered polyamide 11 blends
4. Conclusions This study developed and characterized immiscible blend systems based on high-density polyethylene (HDPE) and post-industrial polyamide 11 (PA11) sourced from offshore pressure barriers. The addition of HDPE-grafted with maleic anhydride (HDPE-g-MA) as a compatibilizer improved interfacial adhesion between the polymer phases, although only modest enhancements were observed. Incorporation of silicon dioxide nanoparticles (nSiO2) at 2 and 4 wt.% further influenced blend properties, with 2 wt.% nSiO2 yielding a significant increase in thermal stability due to improved nanoparticle dispersion and barrier effects. The synergistic combination of HDPE-g-MA and nSiO2 was particularly effective, resulting in the best balance of mechanical strength, toughness, and thermal performance. Morphological analysis revealed that compatibilized blends containing nSiO2 exhibited a more uniform and welldispersed PA11 phase within the HDPE matrix, confirming enhanced phase interaction. X-ray diffraction demonstrated a reduction in crystallinity degree associated with the presence of PA11 and further decreased by the addition of compatibilizer and nanoparticles, indicating strengthened interphase interactions and restricted chain mobility. Rheological results showed that compatibilized blends and nanocomposites displayed increased elastic modulus and complex viscosity values, especially at low frequencies, verifying improved interfacial adhesion and phase dispersion. Tensile tests confirmed that blends incorporating nSiO2, with or without HDPE-g-MA, achieved higher mechanical performance, with the best toughness and modulus observed in systems containing both additives. Overall, the findings demonstrate that nSiO2 nanoparticles act as effective co-compatibilizers in HDPE/HDPE-g-MA/ PA11 blends, enabling the production of sustainable, highperformance nanocomposites suitable for injection-molded applications. The reuse of post-industrial PA11 aligns with circular economy principles, offering promising routes for the valorization of engineering polymers from offshore infrastructure.
5. Author’s Contribution • Conceptualization – Joyce Braga Camargo; Ana Lúcia Nazareth da Silva; Gisele Cristina Valle Iulianelli. • Data curation – Joyce Braga Camargo; Christine Rabello Nascimento. • Formal analysis – Joyce Braga Camargo. • Funding acquisition – Joyce Braga Camargo; Ana Lúcia Nazareth da Silva; Gisele Cristina Valle Iulianelli. • Investigation – Joyce Braga Camargo. • Methodology – Joyce Braga Camargo; Ana Lúcia Nazareth da Silva; Gisele Cristina Valle Iulianelli. • Project administration – Joyce Braga Camargo; Ana Lúcia Nazareth da Silva; Gisele Cristina Valle Iulianelli. • Resources – Joyce Braga Camargo; Ana Lúcia Nazareth da Silva; Gisele Cristina Valle Iulianelli. • Software – NA. Polímeros, 36(3), e20260030, 2026
• Supervision – Ana Lúcia Nazareth da Silva; Gisele Cristina Valle Iulianelli. • Validation – Joyce Braga Camargo; Christine Rabello Nascimento; Ana Lúcia Nazareth da Silva; Gisele Cristina Valle Iulianelli. • Visualization – Joyce Braga Camargo. • Writing – original draft – Joyce Braga Camargo. • Writing – review & editing – Joyce Braga Camargo; Ana Lúcia Nazareth da Silva.
6. Acknowledgements The authors acknowledge the Conselho Nacional de Desenvolvimento Científico e Tecnológico (CNPQ) (307889/2022) and Coordenação de Aperfeiçoamento de Pessoal de Nível Superior - CAPES.
7. References 1. Taguet, A., Cassagnau, P., & Lopez-Cuesta, J.-M. (2014). Structuration, selective dispersion and compatibilizing effect of (nano)fillers in polymer blends. Progress in Polymer Science, 39(8), 1526-1563. https://doi.org/10.1016/j.progpolymsci.2014.04.002. 2. Rodriguez, A. O. F., Silva, P. S. R. C., Iulianelli, G. C. V., & Tavares, M. I. B. (2021). Effect of silicon dioxide in the PHB matrix characteristics. International Journal of Developmental Research, 11(2), 44179-44183. Retrieved in 2025, December 20, from https://www.journalijdr.com/sites/default/files/issuepdf/21038.pdf 3. Lindsay, S. M. (2009). Introduction to nanoscience. Oxford: Oxford University Press.. https://doi.org/10.1093/ oso/9780199544202.001.0001. 4. Liu, S., Li, C., Wu, H., & Guo, S. (2020). Novel structure to improve mechanical properties of polymer blends: multilayered ribbons. Industrial & Engineering Chemistry Research, 59(45), 20221-20231. https://doi.org/10.1021/acs.iecr.0c04448. 5. Mazinani, S., Darvishmanesh, S., Ramazani, R., & Van der Bruggen, B. (2017). Miscibility of polyimide blends: physicochemical characterization of two high-performance polyimide polymers. Reactive & Functional Polymers, 111, 88-101. https://doi.org/10.1016/j.reactfunctpolym.2016.12.010. 6. Zare, Y. (2016). Modeling the yield strength of polymer nanocomposites based upon nanoparticle agglomeration and polymer–filler interphase. Journal of Colloid and Interface Science, 467, 165-169. https://doi.org/10.1016/j.jcis.2016.01.022. PMid:26802275. 7. Peponi, L., Puglia, D., Torre, L., Valentini, L., & Kenny, J. M. (2014). Processing of nanostructured polymers and advanced polymeric-based nanocomposites. Materials Science and Engineering R Reports, 85, 1-46. https://doi.org/10.1016/j. mser.2014.08.002. 8. Rodrigues, A. C., Bastos, I. N., Kappel, M. A. A., Nascimento, C. R., Ferreira, L. S., & Silva, A. L. N. (2021). Micromechanical property study of nylon 11 and organoclay systems for offshore flexible pipe. Fibers and Polymers, 22(11), 3172-3182. https://doi.org/10.1007/s12221-021-0391-5. 9. Yu, Z.-Z., Hu, G.-H., Varlet, J., Dasari, A., & Mai, Y.-W. (2005). Water-assisted melt compounding of nylon 6/pristine montmorillonite nanocomposites. Journal of Polymer Science. Part B, Polymer Physics, 43(9), 1100-1112. https://doi.org/10.1002/polb.20397. 10. Custódio, A. B., & Vaz, M. A. (2002). A nonlinear formulation for the axisymmetric response of umbilical cables and flexible pipes. Applied Ocean Research, 24(1), 21-29. https://doi. org/10.1016/S0141-1187(02)00007-X. 9/10
Camargo, J. B., Iulianelli, G. C. V., Nascimento, C. R., & Silva, A. L. N. 11. Fergestad, D., & Løtveit, S. A. (Eds.). (2017). Handbook on design and operation of flexible pipes. Trondheim: SINTEF. 12. Guimarães, M. G. B. (2013). Dependência da fluência e recuperação do fluoreto de polivinilideno (PVDF) com a temperatura e taxa de recuperação (Monografia). Universidade Federal do Rio de Janeiro, Rio de Janeiro. Retrieved in 2025, December 20, from https://monografias.poli.ufrj.br/monografias/ monopoli10006017.pdf 13. Rodrigues, A. C., Kappel, M. A. A., Nascimento, C. R., Spinelli, L. S., Bastos, I. N., & Silva, A. L. N. (2016). Modeling instrumented indentation testing to evaluate the behavior of PA11 and CaCO3 composites for offshore applications. Polymer Testing, 56, 140-147. https://doi.org/10.1016/j. polymertesting.2016.10.003. 14. Morais, J. M. (2013). Deepwater petroleum: a technological history of Petrobras in offshore exploration and production. Brasília: Instituto de Pesquisa Econômica Aplicada. Retrieved in 2025, December 20, from http://repositorio.ipea.gov.br/ handle/11058/1147 15. Zhang, Y., Chen, B., Qiu, L., Hill, T., & Case, M. (2003). State of the art analytical tools improve optimization of unbonded flexible pipes for deepwater environments. In Offshore Technology Conference, Houston, TX, USA. Richardson, TX: OnePetro. https://doi.org/10.4043/15169-MS. 16. Sudaia, D. P., Bastos, M. B., Fernandes, E. B., Nascimento, C. R., Pacheco, E. B. A. V., & Silva, A. L. N. (2018). Sustainable recycling of mooring ropes from decommissioned offshore platforms. Marine Pollution Bulletin, 135, 357-360. https:// doi.org/10.1016/j.marpolbul.2018.06.066. PMid:30301047. 17. Rouse, S., Hayes, P., Davies, I. M., & Wilding, T. A. (2018). Offshore pipeline decommissioning: scale and context. Marine Pollution Bulletin, 129(1), 241-244. https://doi.org/10.1016/j. marpolbul.2018.02.041. PMid:29680543. 18. Park, M. S., Lee, S., Kim, A. R., Choi, I., Shin, J., & Kim, Y.-W. (2019). Toughened and hydrophobically modified polyamide 11 copolymers with dimer acids derived from waste vegetable oil. Journal of Applied Polymer Science, 136(10), 47174. https://doi.org/10.1002/app.47174. 19. Filippone, G., Carroccio, S. C., Curcuruto, G., Passaglia, E., Gambarotti, C., & Dintcheva, N. T. (2015). Time-resolved rheology as a tool to monitor the progress of polymer degradation in the melt state: part II—thermal and thermo-oxidative degradation of polyamide 11/organo-clay nanocomposites. Polymer, 73, 102-110. https://doi.org/10.1016/j.polymer.2015.07.042. 20. Cai, J., Jiang, X., & Lodewijks, G. (2017). Residual ultimate strength of offshore metallic pipelines with structural damage: a literature review. Ships and Offshore Structures, 12(8), 10371055. https://doi.org/10.1080/17445302.2017.1308214. 21. Zheng, X., Zheng, S., Zhang, X., Yang, W., Liu, Z., & Yang, M. (2016). Phase morphology control and selective localization of MWCNT for suppressing dielectric loss and enhancing the dielectric constant of HDPE/PA11/MWCNT composites. RSC Advances, 6(77), 73056-73062. https://doi.org/10.1039/ C6RA13127A. 22. Zhou, C., Wang, K., & Fu, Q. (2009). Toughening of polyamide 11 via addition of crystallizable polyethylene derivatives. Polymer International, 58(5), 538-544. https://doi.org/10.1002/ pi.2564.
10/10
23. Liu, Q., Qu, Z., Chen, F., Liu, X., & Wang, G. (2024). Review of the development of an unbonded flexible riser: new material, types of layers, and cross-sectional mechanical properties. Materials, 17(11), 2560. https://doi.org/10.3390/ma17112560. PMid:38893824. 24. Lyu, Y., Pang, J., Gao, Z., Zhang, Q., & Shi, X. (2019). Characterization of the compatibility of PVC/PLA blends by aid of rheological responses. Polymer, 176, 20-29. https://doi. org/10.1016/j.polymer.2019.05.016. 25. Jin, J., Rafiq, R., Gill, Y. Q., & Song, M. (2013). Preparation and characterization of high-performance graphene/nylon nanocomposites. European Polymer Journal, 49(9), 2617-2626. https://doi.org/10.1016/j.eurpolymj.2013.06.004. 26. Laoutid, F., François, D., Paint, Y., Bonnaud, L., & Dubois, P. (2013). Using nanosilica to fine-tune morphology and properties of polyamide 6/poly(propylene) blends. Macromolecular Materials and Engineering, 298(3), 328-338. https://doi. org/10.1002/mame.201200047. 27. Brasil. Lei nº 12.305, de 2 de agosto de 2010. (2010, 2 de agosto). Institui a Política Nacional de Resíduos Sólidos. Diário Oficial da República Federativa do Brasil, Brasília. Retrieved in 2025, December 20, from http://www.planalto. gov.br/ccivil_03/_ato2007-2010/2010/lei/l12305.htm 28. Palacios, J. K., Sangroniz, A., Eguiazabal, J. I., Etxeberria, A., & Müller, A. J. (2016). Tailoring the properties of PP/ PA6 nanostructured blends by the addition of nanosilica and compatibilizer agents. European Polymer Journal, 85, 532552. https://doi.org/10.1016/j.eurpolymj.2016.11.010. 29. Oliveira, A. G., Silva, A. L. N., Sousa, A. M. F., Leite, M. C. A. M., Jandorno, J. C., & Escócio, V. A. (2016). Composites based on green high-density polyethylene, polylactide and nanosized calcium carbonate: effect of the processing parameter and blend composition. Materials Chemistry and Physics, 181, 344-351. https://doi.org/10.1016/j.matchemphys.2016.06.068. 30. Chouit, F., Guellati, O., Boukhezar, S., Harat, A., Guerioune, M., & Badi, N. (2014). Synthesis and characterization of HDPE/N-MWNT nanocomposite films. Nanoscale Research Letters, 9(1), 288. https://doi.org/10.1186/1556-276X-9-288. PMid:25024676. 31. Sangroniz, L., Moncerrate, M. A., De Amicis, V. A., Palacios, J. K., Fernández, M., Santamaria, A., Sánchez, J. J., Laoutid, F., Dubois, P., & Müller, A. J. (2015). The outstanding ability of nanosilica to stabilize dispersions of nylon 6 droplets in a polypropylene matrix. Journal of Polymer Science. Part B, Polymer Physics, 53(22), 1567-1579. https://doi.org/10.1002/ polb.23786. 32. Jeziorska, R., Szadkowska, A., & Studzinski, M. (2022). Morphology and properties of poly(2,6-dimethyl-1,4-phenylene oxide)/polyamide 11 hybrid nanocomposites: effect of silica surface modification. Materials, 15(10), 3421. https://doi. org/10.3390/ma15103421. PMid:35629449. Received: Dec. 20, 2025 Revised: Apr. 08, 2026 Accepted: May 19, 2026 Associate Editor: Artur J. M. Valente
Polímeros, 36(3), e20260030, 2026
ISSN 1678-5169 (Online)
https://doi.org/10.1590/0104-1428.20250123
Electrospun scaffolds loaded with Stryphnodendron adstringens extract and Melaleuca alternifolia oil Lailla Daiana Soltau Missio Pinheiro1 , Vinícius Rodrigues Oviedo1* , Daniela Tiepo Gomes2 , Lisiara Ouriques Carvalho3 , Liana da Silva Fernandes1 , Michele Rorato Sagrillo1 , Daniel Assumpção Bertuol4 and Luiz Fernando Rodrigues Jr.3 Programa de Pós-graduação em Nanociências – PPGNano, Universidade Franciscana – UFN, Santa Maria, RS, Brasil 2 Departamento de Engenharia Biomédica, Universidade Franciscana – UFN, Santa Maria, RS, Brasil 3 Programa de Pós-graduação em Saúde Materno Infantil, Universidade Franciscana – UFN, Santa Maria, RS, Brasil 4 Laboratório de Processos Ambientais – LAPAM, Universidade Federal de Santa Maria – UFSM, Santa Maria, RS, Brasil 1
*vinicius.oviedo@ufn.edu.br
Abstract Electrospun PCL-based scaffolds have been proposed for wound healing. However, to deal with bacterial infections, the incorporation of natural compounds into the PCL matrix could be a promising alternative. Stryphnodendron adstringens (Barbatimão) extract and Melaleuca alternifolia (Melaleuca) oil are known due to their antibacterial, antifungical, and anti-inflammatory properties, interesting for healing applications. This paper proposed the development of electrospun PCL scaffolds containing a combination of barbatimão and melaleuca compounds. The obtained samples were 20B/80M and 80B/20M, in which B refers to Barbatimão and M for Melaleuca. The samples were characterized via X-ray diffraction, Raman spectroscopy, tensile test, contact angle analysis, optical microscopy, and cytotoxicity. The incorporation of the natural compounds did not alter the structure of PCL and higher concentration of Barbatimão indicated an enhancement in antimicrobial properties against S. aureus, with reduction of 33.3% on biofilm formation. Hence, the proposed scaffolds could be promising material for wound healing applications. Keywords: barbatimão extract, melaleuca oil, poly-ε-caprolactone, scaffolds. Data Availability: All data supporting the findings of this study are available from the corresponding author upon request. How to cite: Pinheiro, L. D. S. M., Oviedo, V. R., Gomes, D. T., Carvalho, L. O., Fernandes, L. S., Sagrillo, M. R., Bertuol, D. A., & Rodrigues Jr., L. F. (2026). Electrospun scaffolds loaded with Stryphnodendron adstringens extract and Melaleuca alternifolia oil. Polímeros: Ciência e Tecnologia, 36(3), e20260031. https://doi.org/10.1590/0104-1428.20250123
1. Introduction Tissue engineering aims to develop materials that can biologically replace tissue functions by combining a scaffold, cells and biological molecules[1]. These biomaterials exhibit biocompatibility with tissues, biodegradability, non-toxic, adequate porosity, and good mechanical resistance, making them favorable to cell proliferation, migration and differentiation, and enabling them, for example, to stimulate the wound healing process[2-4]. In the context of dressings applied to healing acute and chronic wounds, the use of micro and nanofibrous scaffolds are good alternatives, as they promote the mimicry of the native extracellular matrix (ECM)[5]. Depending on the degree of severity of a wound, the healing process tends to become complex[6-8], resulting in great susceptibility to bacteria that are multiresistant to conventional antibiotics[9]. Furthermore, it is known that infections caused by bacteria represent a major concern in wound treatments, delaying the
Polímeros, 36(3), e20260031, 2026
healing process and leading to tissue deformation or even the patient’s death[10]. In this sense, nanofibrous biomaterials provide support for the release of bioactive compounds, such as antimicrobial agents[11]. Given this scenario, the impregnation of scaffolds with substances with therapeutic potential is necessary and beneficial[12], since the release of such structures can enable faster and more effective healing. Therefore, scaffolds impregnated with oils and natural extracts with healing and antifungal effects on topical lesions have attracted interest of the scientific community[13]. The bioactive constituents of medicinal herbs are responsible for therapeutic activities and offer unlimited potential through new medicines due to their accessibility and chemical diversity. These constituents are responsible for therapeutic activities, such as hypoglycemic, antidiabetic, antioxidant, antimicrobial, anti-inflammatory, anti-carcinogenic and antimalarial[14,15].
1/11
O O O O O O O O O O O O O O O O
Pinheiro,L.D.S.M.,Oviedo,V.R.,Gomes,D.T.,Carvalho,L.O.,Fernandes,L.S.,Sagrillo,M.R.,Bertuol,D.A.,&RodriguesJr.,L.F. One of the main polymers used in tissue engineering, poly-ε-caprolactone (PCL) is a synthetic composite that has good mechanical resistance and rigidity, also known for its biodegradable and biocompatible properties[16,17]. Furthermore, PCL is a polymer already approved and with a well-established safety profile confirmed by the Food and Drug Administration (FDA)[18]. Among different methods for manufacturing nanofibers, electrospinning technique is considered an easy and effective way to produce ultrafine fibers from various polymers[19]. Thus, electrospinning offers an efficient way to produce well-organized scaffolds, due to the high versatility in material choice, ease of standardization and great flexibility in drug formulation[20]. Stryphnodendron adstringens (Barbatimão), found mainly in the Brazilian cerrado, has pharmacological properties with antibacterial, anti-inflammatory, and healing potential, thus inhibiting the formation of chemical mediators of inflammation, such as histamine, bradykinin, prostaglandin[21]. Despite the known effects on reduction of biofilm, many studies are focused on oral and anaerobic bacteria[22,23]. Some studies present evaluations regarding its safety; however, there is still a need for a deeper understanding of its effects, as well as the safe quantities capable of inhibiting biofilm formation in different bacteria[24,25]. Hence, there is potential for the use of natural extracts, especially Barbatimão extract, in applications involving bacteria commonly found in epidermal wounds. The medicinal effects of Barbatimão are attributed to the high tannin content in its chemical composition, which can reach levels of 20% to 50%[26]. Similarly, Melaleuca alternifolia (Tea Tree), a typical Australian tree, also presents scientific evidence of its biological properties, such as antimicrobial and antifungal activity, aiding in the healing processes[27-29]. Additionally, Melaleuca alternifolia stimulates cellular potassium ion leakage and inhibits respiration in E. coli suspensions, providing evidence of a lethal action related to damage to the cytoplasmic membrane[30]. In literature, scaffolds obtained via electrospinning and based on PCL impregnated with natural substances, such as Aloe vera extract, fennel extract (Inula graveolens), clove essential oil (Eugenia caryophyllata), oregano essential oil (Origanum vulgare) and tucumã oil (Astrocaryum vulgare) have already been investigated[31-34]. In addition to providing bioactive properties to the resulting material, impregnation with structures of natural origin has been widely investigated because, due to their nature, they are less likely to induce resistance of multidrug-resistant bacteria to conventional antibiotics[35], which is an indispensable characteristic for topical applications. However, to date, the development of PCL-based electrospun scaffolds incorporating a combination of M. alternifolia and S. adstringens remains unexplored in the literature.
Therefore, this research is considered innovative, contributing to the expansion of knowledge regarding the potential use of natural species for application in dressings and wound healing. In this context, the present study aimed to develop scaffolds using PCL as a polymeric matrix, incorporating Melaleuca auternifolia oil and Stryphnodendron astringens extract, and to evaluate their physicochemical properties, cytotoxic behavior and antibiofilm activity.
2. Materials and Methods 2.1 Materials All reagents and raw materials were used without prior treatment. The materials used to scaffold production included Sigma Aldrich PCL polymer, average molecular weight of 80,000 g/mol; Acetone solvent (Synth, Brazil); Melaleuca auternifolia oil (Nova Derme, Brazil); Stryphnodendron adstringens (Cruz Vermelha - Farmácia Homeopatia, Brazil). It is worth noting that Stryphnodendron adstringens extract and Melaleuca alternifolia oil were obtained as medical-grade reagents from certified compounding pharmacies. These materials present established safety profiles, complying with the requirements for biomaterial development.
2.2 Sample preparation The scaffolds were produced according to the adaptation of the literature[36,37]. To prepare the polymeric solutions, 0.75 g of PCL was dissolved in acetone (7,5% w/v), using a hot plate at 50 °C (±2 °C) under constant magnetic stirring for approximately 60 min. Subsequently, 100 µL of an oil mixture (10% v/v to polymeric solution), containing Barbatimão and Melaleuca was added in different proportions (Table 1), and the solution was maintained under magnetic stirring and heating for 5 min. The resulting solution was transferred to a 10 mL plastic syringe with an 18G beveled needle and connected to the electrospinning equipment, operating at an applied voltage of 10 kV. All samples were carried out in triplicates and the percentage ratios of polymeric matrix and Barbatimão extract/tea tree oil were defined as follows. The samples were called PCL, 20B/80M and 80B/20M, whose parameters are presented in Table 1.
2.3 Physicochemical characterization The samples were characterized after the formation of different structures by electrospinning. For the X-ray diffractrometry (XRD) analysis, a Bruker D2 Advance Diffractometer, with a copper tube (radiation Kα = 1,5418 Ǻ)was used. The voltage and current used in the tube were 30 kV and 10 mA, respectively. The diffractometer used has a θ–θ geometry. The goniometer speed was 0.05º/s, with a 2Ɵ interval of 5º
Table 1. List of samples obtained and the quantities of Barbatimão and melaleuca used. Sample PCL 80B2/20M 20B/80M
2/11
Quantity of Barbatimão (µL) 0 80 20
Quantity of Melaleuca (µL) 0 20 80
Voltage (kV) 10 10 10
Temperature (°C) 25 25 25
Tip-to- collector distance (cm) 13 13 13
Humidity (%) 40 40 40
Polímeros, 36(3), e20260031, 2026
Electrospun scaffolds loaded with Stryphnodendron adstringens extract and Melaleuca alternifolia oil to 70º. RAMAN spectroscopy was performed on a Renishaw In-Via Spectomer System equipment, with a 532 nm laser and a measurement range of 200-2000 cm-1. To measure the contact angle, a 10 μL drop of deionized water was carefully dripped onto the flat surface of the structures. Images for each drop were captured using a digital camera (Samsung, 12 MP, 45º telephoto lens). The contact angle was determined using Tracker® software. This assay was performed according to previously published methods[38].
2.4 Mechanical and morphological characterization Tensile tests were performed according to ASTM D882 standard (speed: 01 mm/min) and specimens measuring 50 x 15 mm in length and width, respectively, in triplicate. An EMIC universal testing machine, model DL-10000, with a 5 kN load cell was used. The sample thicknesses were 0.93 ± 0.06 mm, 1.00 ± 0.10 mm, and 1.07 ± 0.12 mm for PCL, 20B/80M and 80B/20M, respectively. The Kruskal-Wallis test, with a 95% confidence interval, was used to compare the samples, as the Shpiro-Wilk’s normality test indicated that the data did not follow a normal distribution (W = 0.75; p < 0.0001). The morphology of the formed fibers was evaluated using scanning electron microscopy (SEM). The samples were previously metallized and analyzed using a TESCAN ANALYTICS microscope (model VEGA 3-SBU). The fiber diameter was determined by measuring 50 different points for each sample.
2.5 In vitro characterization The MTT cell viability assay was used to evaluate the cytotoxicity of the different materials obtained. The protocol was based on that described in Wilms et al.[39] and all experiments were performed in triplicate for the PCL blank and for the samples containing both oils/extracts in their composition. Samples (5 x 5 mm) were used and placed in a 96-well plate. Culture medium containing only peripheral blood mononuclear cells (PBMC) was used as a negative control (CN). PBMC separation step was performed by density gradient (Histopaque®-1077) and centrifugation. The concentration of 2x10⁵ cells mL-1 was obtained by counting the cells in a Neubeuer chamber with 0.4% trypan blue. After seeding, the cells and samples were incubated in an environment with 5% CO2 at 37 °C for 24 hours. The PBMC were obtained from peripheral blood samples discarded from the Clinical Analysis Laboratory of the Franciscana University (LEAC), following approval by the Human Research Ethics Committee of the Franciscana University, nº (CAAE: 31211214.4.0000.5306), without access to identifiable data. The results were obtained as a function of optical density. They were calculated by spectrophotometry at a length of 570 nm, using an Anthos 2010 spectrometer (Biochrom®, London, UK) and Equation 1. For this trial, statistical analyzes with a 95% confidence interval were also used. The selected methods were one-way ANOVA followed by Dunnett’s post hoc test to compare the means between the samples and the negative control.
% Cell viability = 100 x
Polímeros, 36(3), e20260031, 2026
OD570e OD570b
(1)
where: OD570e: average value of the measured optical density of extracts from 100% of the test sample; OD570b: average value of the measured optical density of the blank samples.
2.6 Biofilm formation test The antibiofilm activity assay was performed using Staphylococcus aureus (ATCC 25923) and Pseudomonas aeruginosa (ATCC 13883), following the methodology described by Stepanovic[40]. For the test, 180 µL of TSB broth supplemented with 1% glucose was added to each well. Subsequently, 20 µL of the prepared inoculum was added to each well, except for the column reserved for sterility control. The sterility control had only TSB broth with 1% glucose and sterile saline. The samples were evaluated in triplicate for each formation along with the negative control (bacteria only). All plates were incubated at a temperature of 37 °C. After incubation, the wells were emptied and gently washed three times with sterile saline to remove non-adherent cells. The biofilm was fixed with 200 µL of methanol (P. A.) for 20 minutes. After fixation, the methanol was removed by inversion and the plate was allowed to dry at room temperature. The adhered biofilm was stained with 200 µL of per well for 15 minutes at room temperature. After staining, the violet crystal was removed solution was removed by inversion and the plate was washed 3 times with distilled water. The biofilm was re-sobulized in each well with 200 µL of 95% ethanol. Then, Ethanol was gently added to the wells and the plate was left covered with the lid at room temperature for 30 minutes without stirring. The results of biofilm formation were evaluated on an Anthos 2010 spectrophotometer (Biochrom®, London, UK) with a wavelength of 570 nm.
3. Results and Discussions The XRD patterns and Raman spectra obtained for the scaffolds are shown in Figure 1. In XRD (Figure 1A), it can be observed two characteristic peaks of pure PCL, the first at 21.6º, representing the crystalline plane of reflection d (110), and the second at 23.9º, representing the d (200) plane[41]. It was observed that the characteristic peaks of PCL are also present in the scaffolds with the incorporation of Barbatimão and Melaleuca. The XRD patterns showed no new crystalline phases, which was expected due to amorphous nature of the added compounds. Through Raman spectroscopy (Figure 1B), it was found planar and non-planar peaks of PCL. Bands at 1725 cm-1 are observed, representing the structure C=O, of 1466-1418 cm-1 relating to δCH2 and 1304-1284 cm-1, ωCH2, in 1110-1039 cm-1 characteristic of clusters and 958-914 cm-1 the structure C-COO[42]. It was also observed that the characteristic peaks of PCL were not altered when a higher concentration of Melaleuca was added[43]. However, it can be observed an intensity enhancement of the peaks when the concentration of Barbatimão was higher than that of Melaleuca. The increased intensity across the spectrum might be attributed to the complex polyphenolic structure of the Barbatimão extract[44]. Maximum stress values of the samples are presented in Table 2. It can be seen that the 20B/80M sample obtained 3/11
Pinheiro,L.D.S.M.,Oviedo,V.R.,Gomes,D.T.,Carvalho,L.O.,Fernandes,L.S.,Sagrillo,M.R.,Bertuol,D.A.,&RodriguesJr.,L.F.
Figure 1. X-ray diffraction diagram (A) and Raman spectrum (B) of scaffolds produced with PCL, Melaleuca auternifolia oil and Stryphnodendron adstringens extract.
Table 2. Maximum tension values obtained by tensile testing of polymeric scaffolds. Sample PCL 80B/20M 20B/80M
Maximum tension (MPa) 0.37 ± 0.21a 0.53 ± 0.23a 0.2 ± 0.01a
Table 3. Contact angle of scaffolds obtained from PCL, 20B/80M and 80B/20M. Sample PCL 20B/80M 80B/20M
Angle 97.4 99.4 84.8
Characteristic Hydrophobic Hydrophobic Slightly Hydrophilic
the lowest result, while the 80B/20M sample has maximum stress values that are very similar and higher than the PCL. This may suggest that the composition of Melaleuca oil makes PCL more fragile, while Barbatimão extract makes it more resistant. It is worth pointing out that, previous to statistical comparisons, the Shapiro-Wilk’s normality test was performed and justified the suitability of a parametric hypothesis test for the mechanical data (W = 0.920; p = 0.463). Despite the differences in maximum tension, the values can be considered statistically identical, according to the one-way ANOVA test (F = 2.17; p = 0.179), for a 95% confidence interval. This demonstrates that the addition of Barbatimão extract and Melaleuca oil did not significantly modify the maximum tension of the PCL. The associated statistical analyzes results can be found in Supplementary Material. 4/11
Table 3 shows the results obtained in the contact angle test, which is important for evaluating the hydrophobicity of the scaffolds. PCL showed a hydrophobic characteristic, with an angle greater than 90°, a result also found in the literature[45,46]. This characteristic was also found in sample 20B/80M, however in sample 80B/20M it presented an angle of 84.8°, showing it to be slightly hydrophilic[47]. Hydrophilicity in a dressing is an important parameter, as it facilitates the absorption of exudate and the maintenance of moisture at the wound site[48]. However, it is known that a hydrophobic surface on a dressing reduces the adhesion of bacteria to the target region[49]. In this sense, samples with more hydrophobic characteristics (PCL and 20B/80M) have the potential to prevent the formation of biofilms and significantly reduce bacterial resistance at the site of application, while the slightly hydrophilic sample (80B/20M) can promote greater cell adhesion during wound healing[50]. Scanning electron microscopy (Figure 2) showed that the resulting scaffolds had fibers in their structures, but none of the samples resulted in uniform fibers; all of them have very heterogeneous fibers, loaded with polymeric glomerates[51,52]. The scaffolds had average sizes of approximately 800 nm for the samples with PCL and 20B/80M, while the 80B/20M samples’ average size was around 200 nm. Figure 3 shows the results of the MTT cell viability test against PBMC cells. Basically, all samples did not show cytotoxicity to PBMC, as cell viability was greater than 70%[53]. It was noted that PCL (84.5%) resulted in a decrease in cell viability, when compared to NC. This also satisfies the biocompatibility requirements because, in the literature, decreases in cell viability of up to 30% in relation to NC are an indication that the material is not cytotoxic[54]. For the 20B/80M sample, it obtained a cellular observation 6% greater than the NC, providing non-cytotoxic characteristics to Polímeros, 36(3), e20260031, 2026
Electrospun scaffolds loaded with Stryphnodendron adstringens extract and Melaleuca alternifolia oil
Figure 2. SEM of the PCL (A), 20B/80M (C) and 80B/20M (E) scaffolds, and the average distribution of the PCL (B), 20B/80M (D) and 80B/20M (F) polymeric scaffolds.
Figure 3. Results obtained in the cell viability test, via MTT, for PCL, 20B/80M and 80B/20M samples. Data were presented as mean *p < 0.05, **p < 0.01 and ***p < 0.001 versus NC. Polímeros, 36(3), e20260031, 2026
5/11
Pinheiro,L.D.S.M.,Oviedo,V.R.,Gomes,D.T.,Carvalho,L.O.,Fernandes,L.S.,Sagrillo,M.R.,Bertuol,D.A.,&RodriguesJr.,L.F. PMBC. The 80B/20M sample, however, presented a favorable environment for cell proliferation, with a viability percentage of 113.34%, when compared to the NC. The cell viability results were promising and are in line with the literature, where PCL-based scaffolds were non-cytotoxic to PBMC and other cell lines. In the case of sample 80B/20M, it is assumed that the increase in cell viability is due to the properties of Barbatimão and Melaleuca[55], where Barbatimão, in higher concentration in this sample, presents topical or oral use as a good route of administration. Furthermore, the incubation time of 24 h is sufficient to guarantee the safety of such biomaterials intended for topical applications[53]. Figure 4 shows the results of the antibiofilm test against the bacteria gram-positive, Staphylococcus aureus and gran-negative Pseudomonas aeruginosa. Figure 4A
shows the results obtained for the P. aeruginosa strain, in which the samples did not show a statistical difference compared to the control group (p = 0.965). The PCL sample showed a reduction of 5.0% compared to the control, while the 20B/80M sample showed a 3.6% reduction in the formation of bacterial biofilm. In the case of 80B/20M sample, it showed an increase of 5.5% compared to PC, not inhibiting biofilm formation. The biofilm-forming capacity at 20B/80M is due to the ability of Melaleuca alternifolia to combat pathogenic microorganisms during the treatment of infectious diseases, due to the presence of the polyphenol epigallocatechin-3-O-gallate (EGCG), whose antimicrobial properties may justify the antibiofilm efficiency[56]. In PCL, biofilm inhibition can be attributed to its hydrophobic character, which makes it difficult for bacteria to adhere
Figure 4. Results of the antibiofilm test against Pseudomonas aeruginosa (A) and Staphylococcus aureus (B). Data were presented as mean *p < 0.05, **p < 0.01 and ***p < 0.001 versus PC. 6/11
Polímeros, 36(3), e20260031, 2026
Electrospun scaffolds loaded with Stryphnodendron adstringens extract and Melaleuca alternifolia oil to the surface and, consequently, reduces the possibility of biofilm formation[57]. Regarding the bacteria S. aureus (Figure 4B), only the 80B/20M sample showed a significant difference (p<0.001) compared to the control group. PCL proved to form biofilms, with an increase of 11.4% compared to PC, while the 20B/80M sample showed results close to PC, with only 3.5% less than PC. However, when comparing PC and sample 80B/20M, it was observed a greater inhibition of biofilm, with a reduction of 33.3%. This greater biofilm inhibition capacity might be due to the bioactive properties of Barbatimão, such as antimicrobial, antifungal activity and recently, efficiency against the formation of biofilms[58]. It was possible to observe that only 80B/20M samples presented characteristics of non-biofilm formation against S. aureus, indicating that Barbatimão could induce an antimicrobial property against gram-positive strains. As mentioned before, the associated statistical analyzes results can be found in Supplementary Material.
4. Conclusions It was possible to produce and evaluate scaffolds with different concentrations of Barbatimão and Melaleuca. Through the results obtained by X-ray diffraction and Raman spectroscopy, it can be concluded that there were no changes in the structure and crystallinity of PCL. Optical microscopy demonstrated that fibers were formed, but the scaffolds presented heterogeneous fibers, with some polymer agglomerates. The contact angle test demonstrated that the PCL 80B/20M mixture had a less hydrophobic characteristic compared to PCL and the other samples. The MTT assay showed that all the samples were not toxic to PBMC. The antibiofilm formation assay demonstrated that the proposed scaffolds did not inibited the biofilm formation against P. aeruginosa. On the other hand, samples with higher concentrations of Barbatimão displayed an enhanced reduction (33.3%) on biofilm formation against S. aureus. Therefore, the inclusion of Melaleuca alternifolia oil and Stryphnodendron adstringens extract in different quantities did not change the initial characteristics of PCL and, the obtained materials appear as a possibility in the manufacture of scaffolds for application in skin dressings.
5. Author’s Contribution • Conceptualization – Lailla Daiana Soltau Missio Pinheiro; Vinícius Rodrigues Oviedo; Daniela Tiepo Gomes; Lisiara Ouriques Carvalho; Liana da Silva Fernandes; Michele Rorato Sagrillo; Daniel Assumpção Bertuol; Luiz Fernando Rodrigues Jr. • Data curation – Lailla Daiana Soltau Missio Pinheiro; Vinícius Rodrigues Oviedo; Daniela Tiepo Gomes. • Formal analysis – Lailla Daiana Soltau Missio Pinheiro; Vinícius Rodrigues Oviedo; Luiz Fernando Rodrigues Junior. • Funding acquisition – Luiz Fernando Rodrigues Jr. • Investigation – Liana da Silva Fernandes; Lailla Daiana Soltau Missio Pinheiro; Vinícius Rodrigues Oviedo; Luiz Fernando Rodrigues Jr. Polímeros, 36(3), e20260031, 2026
• Methodology – Lailla Daiana Soltau Missio Pinheiro; Vinícius Rodrigues Oviedo; Daniela Tiepo Gomes; Michele Rorato Sagrillo; Daniel Assumpção Bertuol; Luiz Fernando Rodrigues Jr. • Project administration – Luiz Fernando Rodrigues Jr. • Resources – Lailla Daiana Soltau Missio Pinheiro; Vinícius Rodrigues Oviedo; Daniela Tiepo Gomes; Michele Rorato Sagrillo; Daniel Assumpção Bertuol; Luiz Fernando Rodrigues Jr. • Software – NA. • Supervision – Luiz Fernando Rodrigues Jr. • Validation – Lailla Daiana Soltau Missio Pinheiro; Luiz Fernando Rodrigues Jr. • Visualization – Lailla Daiana Soltau Missio Pinheiro; Vinícius Rodrigues Oviedo; Lisiara Ouriques Carvalho; Daniela Tiepo Gomes; Michele Rorato Sagrillo; Daniel Assumpção Bertuol; Luiz Fernando Rodrigues Jr. • Writing – original draft – Lailla Daiana Soltau Missio Pinheiro; Vinícius Rodrigues Oviedo; Daniela Tiepo Gomes; Lisiara Ouriques Carvalho; Michele Rorato Sagrillo; Daniel Assumpção Bertuol; Luiz Fernando Rodrigues Jr. • Writing – review & editing – Lailla Daiana Soltau Missio Pinheiro; Vinícius Rodrigues Oviedo; Daniela Tiepo Gomes; Liana da Silva Fernandes; Michele Rorato Sagrillo; Daniel Assumpção Bertuol; Luiz Fernando Rodrigues Jr.
6. Acknowledgements The authors acknowledge the Rio Grande do Sul Research Foundation (FAPERGS) for the financial support (Call 14/2022 - ARD/ARC, Grant No. 23/2551-0000825-4).
7. References 1. Guo, B., & Ma, P. X. (2018). Conducting polymers for tissue engineering. Biomacromolecules, 19(6), 1764-1782. https://doi.org/10.1021/acs.biomac.8b00276. PMid:29684268. 2. Lovett, M., Lee, K., Edwards, A., & Kaplan, D. L. (2009). Vascularization strategies for tissue engineering. Tissue Engineering. Part B, Reviews, 15(3), 353-370. https://doi.org/10.1089/ten.teb.2009.0085. PMid:19496677. 3. Guo, B., & Ma, P. X. (2014). Synthetic biodegradable functional polymers for tissue engineering: a brief review. Science China. Chemistry, 57(4), 490-500. https://doi.org/10.1007/s11426014-5086-y. PMid:25729390. 4. van Vlierberghe, S., Dubruel, P., & Schacht, E. (2011). Biopolymer-based hydrogels as scaffolds for tissue engineering applications: a review. Biomacromolecules, 12(5), 1387-1408. https://doi.org/10.1021/bm200083n. PMid:21388145. 5. Hao, D., Swindell, H. S., Ramasubramanian, L., Liu, R., Lam, K. S., Farmer, D. L., & Wang, A. (2020). Extracellular matrix mimicking nanofibrous scaffolds modified with mesenchymal stem cell-derived extracellular vesicles for improved vascularization. Frontiers in Bioengineering and Biotechnology, 8, 633. https://doi.org/10.3389/fbioe.2020.00633. PMid:32671037. 6. Murray, R. Z., West, Z. E., Cowin, A. J., & Farrugia, B. L. (2019). Development and use of biomaterials as wound healing therapies. Burns & Trauma, 7, s41038-018-0139-7. https://doi.org/10.1186/s41038-018-0139-7. 7/11
Pinheiro,L.D.S.M.,Oviedo,V.R.,Gomes,D.T.,Carvalho,L.O.,Fernandes,L.S.,Sagrillo,M.R.,Bertuol,D.A.,&RodriguesJr.,L.F. 7. Okur, M. E., Karantas, I. D., Şenyiğit, Z., Üstündağ Okur, N., & Siafaka, P. I. (2020). Recent trends on wound management: new therapeutic choices based on polymeric carriers. Asian Journal of Pharmaceutical Sciences, 15(6), 661-684. https://doi.org/10.1016/j.ajps.2019.11.008. PMid:33363624. 8. Nicks, B. A., Ayello, E. A., Woo, K., Nitzki-George, D., & Sibbald, R. G. (2010). Acute wound management: revisiting the approach to assessment, irrigation, and closure considerations. International Journal of Emergency Medicine, 3(4), 399-407. https://doi.org/10.1007/s12245-010-0217-5. PMid:21373312. 9. Puca, V., Marulli, R. Z., Grande, R., Vitale, I., Niro, A., Molinaro, G., Prezioso, S., Muraro, R., & Di Giovanni, P. (2021). Microbial species isolated from infected wounds and antimicrobial resistance analysis: data emerging from a three-years retrospective study. Antibiotics, 10(10), 1162. https://doi.org/10.3390/antibiotics10101162. PMid:34680743. 10. Pallavali, R. R., Degati, V. L., Lomada, D., Reddy, M. C., & Durbaka, V. R. P. (2017). Isolation and in vitro evaluation of bacteriophages against MDR-bacterial isolates from septic wound infections. PLoS One, 12(7), e0179245. https://doi.org/10.1371/journal.pone.0179245. PMid:28719657. 11. Krishnan, K. A., & Thomas, S. (2019). Recent advances on herb-derived constituents-incorporated wound-dressing materials: a review. Polymers for Advanced Technologies, 30(4), 823-838. https://doi.org/10.1002/pat.4540. 12. Dhilip Kumar, S. S., & Abrahamse, H. (2020). Advancement of nanobiomaterials to deliver natural compounds for tissue engineering applications. International Journal of Molecular Sciences, 21(18), 6752. https://doi.org/10.3390/ijms21186752. PMid:32942542. 13. Khan, A. U. R., Xiangyang, S., Ahmad, A., & Mo, X.-M. (2018). Electrospinning of crude plant extracts for antimicrobial and wound healing applications. SM Journal of Biomedical Engineering, 4(1), 1024. Retrieved in 2025, December 26, from https://www.researchgate.net/publication/352687194 14. Husen, A. (Ed.) (2023). Herbs, shrubs, and trees of potential medicinal benefits. Boca Raton: CRC Press. 15. Himesh, S., Singhai, A. K., & Sharma, S. (2012). Quantification of ascorbic acid in leaves of Annona squamosa. International Journal of Pharmacy and Pharmaceutical Sciences, 4(3), 144-147. Retrieved in 2025, December 26, from https://web. archive.org/web/20180413062416id_/http://ijppsjournal.com/ Vol4Issue3/3588.pdf 16. Dwivedi, R., Kumar, S., Pandey, R., Mahajan, A., Nandana, D., Katti, D. S., & Mehrotra, D. (2020). Polycaprolactone as biomaterial for bone scaffolds: review of literature. Journal of Oral Biology and Craniofacial Research, 10(1), 381-388. https://doi.org/10.1016/j.jobcr.2019.10.003. PMid:31754598. 17. Cipitria, A., Skelton, A., Dargaville, T. R., Dalton, P. D., & Hutmacher, D. W. (2011). Design, fabrication and characterization of PCL electrospun scaffolds: a review. Journal of Materials Chemistry, 21(26), 9419-9453. https://doi.org/10.1039/c0jm04502k. 18. Lim, M. M., Sun, T., & Sultana, N. (2015). In vitro biological evaluation of electrospun polycaprolactone/gelatine nanofibrous scaffold for tissue engineering. Journal of Nanomaterials, 2015(1), 303426. https://doi.org/10.1155/2015/303426. 19. Feng, B., Ji, T., Wang, X., Fu, W., Ye, L., Zhang, H., & Li, F. (2020). Engineering cartilage tissue based on cartilage-derived extracellular matrix cECM/PCL hybrid nanofibrous scaffold. Materials & Design, 193, 108773. https://doi.org/10.1016/j.matdes.2020.108773. 20. Permyakova, E. S., Polčak, J., Slukin, P. V., Ignatov, S. G., Gloushankova, N. A., Zajíčková, L., Shtansky, D. V., & Manakhov, A. (2018). Antibacterial biocompatible PCL nanofibers modified by COOH-anhydride plasma polymers and gentamicin immobilization. Materials & Design, 153, 60-70. https://doi.org/10.1016/j.matdes.2018.05.002. 8/11
21. Lima, T. C. D., Cardoso, M. V., Modesto, T., Oliveira, A. L. B., Silva, M. N., & Monteiro, M. C. (2016). Breve revisão etnobotânica, fitoquímica e farmacologia de Stryphnodendron adstringens utilizada na Amazônia. Revista Fitos, 10(3), 329-338. https://doi.org/10.5935/2446-4775.20160025. 22. Sper, F. L., Amêndola, I., Ramos, L. P., Santos, J. G., Freitas, E. T., Meccatti, V. M., Ferraz, L. F. F., Oliveira, J. R., Santamaria, M. P., Ribeiro, M. C. M., & Oliveira, L. D. (2021). Effect of Stryphnodendron adstringens (Mart.) Coville extract in aerobic and anaerobic microorganisms and mammalian cells. Research, Society and Development, 10(11), e364101119953. https://doi.org/10.33448/rsd-v10i11.19953. 23. Melo, R. N., Goes, V. F. F., Canelli, A. P., Aro, A. A., Moreira, B. O., Correia, J. R., Catirse, A. B. C. E. B., Reis, A. C., Costa, S. M., & Godoi, A. P. T. (2023). Antibacterial activity of barbatimão (Stryphnodendron adstringens) against periodontopathogens and cytotoxic effects on fibroblasts. Letters in Applied Microbiology, 76(6), ovad054. https://doi.org/10.1093/lambio/ovad054. PMid:37291703. 24. Gomes, P. W. P., Pamplona, T. C. D. L., Navegantes-Lima, K. C., Quadros, L. B. G., Oliveira, A. L. B., Santos, S. M., Silva, C. Y. Y., Silva, M. J. C., Souza, J. N. S., Quirós-Guerrero, L. M., Boutin, J. A., Monteiro, M. C., & Silva, M. N. (2021). Chemical composition and antibacterial action of Stryphnodendron pulcherrimum bark extract, “barbatimão” species: evaluation of its use as a topical agent. Arabian Journal of Chemistry, 14(6), 103183. https://doi.org/10.1016/j.arabjc.2021.103183. 25. Xavier-Silva, K. R., Bailão, E. F. L. C., Camilo-Cotrim, C. F., Leonardo-Silva, L., Caldeira, A. J. R., Almeida, L. M. A., de Paula, J. A. M., Borges, L. L., & Ayres, F. M. (2024). Biological activities of Stryphnodendron adstringens bark decoction. Acta Scientiarum. Biological Sciences, 46(1), e68903. https://doi.org/10.4025/actascibiolsci.v46i1.68903. 26. Zhang, X., Guo, Y., Guo, L., Jiang, H., & Ji, Q. (2018). In vitro evaluation of antioxidant and antimicrobial activities of melaleuca alternifolia essential oil. BioMed Research International, 2018(1), 2396109. https://doi.org/10.1155/2018/2396109. PMid:29854733. 27. Assmann, C. E., Cadoná, F. C., Bonadiman, B. S. R., Dornelles, E. B., Trevisan, G., & Cruz, I. B. M. (2018). Tea tree oil presents in vitro antitumor activity on breast cancer cells without cytotoxic effects on fibroblasts and on peripheral blood mononuclear cells. Biomedicine & Pharmacotherapy = Biomédecine & Pharmacothérapie, 103, 1253-1261. https://doi.org/10.1016/j.biopha.2018.04.096. PMid:29864906. 28. Southwell, I. A., Hayes, A. J., Markham, J., & Leach, D. N. (1993). The search for optimally bioactive Australian tea tree oil. Acta Horticulturae, (344), 256-265. https://doi.org/10.17660/ActaHortic.1993.344.30. 29. Carson, C. F., & Riley, T. V. (1995). Antimicrobial activity of the major components of the essential oil of Melaleuca alternifolia. The Journal of Applied Bacteriology, 78(3), 264-269. https://doi.org/10.1111/j.1365-2672.1995.tb05025.x. PMid:7730203. 30. Cox, S. D., Mann, C. M., Markham, J. L., Bell, H. C., Gustafson, J. E., Warmington, J. R., & Wyllie, S. G. (2000). The mode of antimicrobial action of the essential oil of Melaleuca alternifolia (tea tree oil). Journal of Applied Microbiology, 88(1), 170-175. https://doi.org/10.1046/j.1365-2672.2000.00943.x. PMid:10735256. 31. Lima, L. L., Bierhalz, A. C. K., & Moraes, Â. M. (2020). Influence of the chemical composition and structure design of electrospun matrices on the release kinetics of Aloe vera extract rich in aloin. Polymer Degradation & Stability, 179, 109233. https://doi.org/10.1016/j.polymdegradstab.2020.109233. Polímeros, 36(3), e20260031, 2026
Electrospun scaffolds loaded with Stryphnodendron adstringens extract and Melaleuca alternifolia oil 32. Unalan, I., Endlein, S. J., Slavik, B., Buettner, A., Goldmann, W. H., Detsch, R., & Boccaccini, A. R. (2019). Evaluation of electrospun poly(ε-caprolactone)/gelatin nanofiber mats containing clove essential oil for antibacterial wound dressing. Pharmaceutics, 11(11), 570. https://doi.org/10.3390/pharmaceutics11110570. PMid:31683863. 33. Ardekani-Zadeh, A. H., & Hosseini, S. F. (2019). Electrospun essential oil-doped chitosan/poly(ε-caprolactone) hybrid nanofibrous mats for antimicrobial food biopackaging exploits. Carbohydrate Polymers, 223, 115108. https:// doi.org/10.1016/j.carbpol.2019.115108. PMid:31426968. 34. Bressa, N. R., Oviedo, V. R., Machado, A. M. B., Almeida, W. L., Volkmer, T. M., Santos, L. A. L., Sagrillo, M. R., & Rodrigues, L. F., Jr. (2022). Incorporation of astrocaryum vulgare (tucuma) oil into PCL electrospun fibers. Polímeros: Ciência e Tecnologia, 31(3), e2021036. https://doi. org/10.1590/0104-1428.20210056. 35. Kumar, P., Lee, J.-H., Beyenal, H., & Lee, J. (2020). Fatty acids as antibiofilm and antivirulence agents. Trends in Microbiology, 28(9), 753-768. https://doi.org/10.1016/j.tim.2020.03.014. PMid:32359781. 36. Reneker, D. H., Kataphinan, W., Theron, A., Zussman, E., & Yarin, A. L. (2002). Nanofiber garlands of polycaprolactone by electrospinning. Polymer, 43(25), 6785-6794. https://doi.org/10.1016/S0032-3861(02)00595-5. 37. Luo, C. J., Stride, E., & Edirisinghe, M. (2012). Mapping the influence of solubility and dielectric constant on electrospinning polycaprolactone solutions. Macromolecules, 45(11), 4669-4680. https://doi.org/10.1021/ma300656u. 38. Pinheiro, L. D. S. M., Sangoi, G. G., Righi, N. C., Vizzotto, B. S., Moreno Ruiz, Y. P., Galembeck, A., Pavoski, G., Espinosa, D. C. R., Machado, A. K., & Silva, W. L. D. (2024). PLA/PCL polymer nanocomposite with silver and copper nanoparticles and lavender essential oil: Synthesis, characterization and application in tissue engineering. Surfaces and Interfaces, 55, 105391. https://doi.org/10.1016/j.surfin.2024.105391. 39. Wilms, L. C., Hollman, P. C. H., Boots, A. W., & Kleinjans, J. C. S. (2005). Protection by quercetin and quercetin-rich fruit juice against induction of oxidative DNA damage and formation of BPDE-DNA adducts in human lymphocytes. Mutation Research, 582(1–2), 155-162. https://doi.org/10.1016/j.mrgentox.2005.01.006. PMid:15781220. 40. Stepanović, S., Vuković, D., Hola, V., Di Bonaventura, G., Djukić, S., Ćirković, I., & Ruzicka, F. (2007). Quantification of biofilm in microtiter plates: overview of testing conditions and practical recommendations for assessment of biofilm production by staphylococci. APMIS : Acta Pathologica, Microbiologica, et Immunologica Scandinavica, 115(8), 891-899. https://doi.org/10.1111/j.1600-0463.2007.apm_630.x. PMid:17696944. 41. Abdelrazek, E. M., Hezma, A. M., El-khodary, A., & Elzayat, A. M. (2019). Spectroscopic studies and thermal properties of PCL/PMMA biopolymer blend. Egyptian Journal of Basic and Applied Sciences, 3(1), 10-15. https://doi.org/10.1016/j.ejbas.2015.06.001. 42. Schmidt, P., & Hendra, P. J. (1994). The application of Fourier-transform Raman spectroscopy to the determination of conformation in poly(ε-caprolactam) chains. Spectrochimica Acta. Part A: Molecular Spectroscopy, 50(11), 1999-2004. https://doi.org/10.1016/0584-8539(94)80211-4. 43. Baranowska-Korczyc, A., Warowicka, A., Jasiurkowska-Delaporte, M., Grześkowiak, B., Jarek, M., Maciejewska, B. M., Jurga-Stopa, J., & Jurga, S. (2016). Antimicrobial electrospun poly(ε-caprolactone) scaffolds for gingival fibroblast growth. RSC Advances, 6(24), 19647-19656. https:// doi.org/10.1039/C6RA02486F. Polímeros, 36(3), e20260031, 2026
44. Yokosuka, A., Kawakami, S., Haraguchi, M., & Mimaki, Y. (2011). Seven new triterpene glycosides from the pericarps of Stryphnodendron fissuratum. Phytochemistry Letters, 4(3), 259-266. https://doi.org/10.1016/j.phytol.2011.04.010. 45. Kumar, T. S. S., Chakrapani, V. Y., Natesan, P. V., Raj, D. K., & Kumary, T. V. (2017). Effect of molecular weight on electro spun PCL based composite fibrous mats. Biomedical Journal of Scientific & Technical Research, 1(4), 1127-1133. https://doi.org/10.26717/BJSTR.2017.01.000379. 46. Ku, S. H., & Park, C. B. (2010). Human endothelial cell growth on mussel-inspired nanofiber scaffold for vascular tissue engineering. Biomaterials, 31(36), 9431-9437. https://doi.org/10.1016/j.biomaterials.2010.08.071. PMid:20880578. 47. De Gennes, P. G. (1985). Wetting: statics and dynamics. Reviews of Modern Physics, 57(3), 827-863. https://doi.org/10.1103/ RevModPhys.57.827. 48. Krysiak, Z. J., Knapczyk-Korczak, J., Maniak, G., & Stachewicz, U. (2021). Moisturizing effect of skin patches with hydrophobic and hydrophilic electrospun fibers for atopic dermatitis. Colloids and Surfaces. B, Biointerfaces, 199, 111554. https://doi.org/10.1016/j.colsurfb.2020.111554. PMid:33421924. 49. Page, K., Wilson, M., & Parkin, I. P. (2009). Antimicrobial surfaces and their potential in reducing the role of the inanimate environment in the incidence of hospital-acquired infections. Journal of Materials Chemistry, 19(23), 3819-3831. https://doi.org/10.1039/b818698g. 50. Sridhar, R., Lakshminarayanan, R., Madhaiyan, K., Barathi, V. A., Lim, K. H. C., & Ramakrishna, S. (2015). Electrosprayed nanoparticles and electrospun nanofibers based on natural materials: applications in tissue regeneration, drug delivery and pharmaceuticals. Chemical Society Reviews, 44(3), 790-814. https://doi.org/10.1039/C4CS00226A. PMid:25408245. 51. Mohamadi, P. S., Hivechi, A., Bahrami, H., Hemmatinegad, N., & Milan, P. B. (2022). Antibacterial and biological properties of coconut oil loaded poly(ε-caprolactone)/gelatin electrospun membranes. Journal of Industrial Textiles, 51(1, Suppl), 906S-930S. https://doi.org/10.1177/1528083721991595. 52. Feng, D., Li, Y., Zheng, Y., Chen, J., Zhang, X., Li, K., Shen, J., & Guo, X. (2025). Study on the electrospinning fabrication of PCL/CNTs fiber membranes and their oil–water separation performance. Polymers, 17(12), 1705. https://doi.org/10.3390/polym17121705. PMid:40574240. 53. International Organization for Standardization – ISO. (2009). ISO 10993-5: biological evaluation of medical devices - part 5: tests for in vitro cytotoxicity. Geneva. Retrieved in 2025, December 26, from https://nhiso.com/wp-content/uploads/2018/05/ISO10993-5-2009.pdf 54. Cho, S. J., Jung, S. M., Kang, M., Shin, H. S., & Youk, J. H. (2015). Preparation of hydrophilic PCL nanofiber scaffolds via electrospinning of PCL/PVP-b-PCL block copolymers for enhanced cell biocompatibility. Polymer, 69, 95-102. https://doi.org/10.1016/j.polymer.2015.05.037. 55. Pellenz, N. L., Barbisan, F., Azzolin, V. F., Duarte, T., Bolignon, A., Mastella, M. H., Teixeira, C. F., Ribeiro, E. E., Cruz, I. B. M., & Duarte, M. M. M. F. (2018). Analysis of in vitro cyto- and genotoxicity of barbatimão extract on human keratinocytes and fibroblasts. BioMed Research International, 2018(1), 1942451. https://doi.org/10.1155/2018/1942451. PMid:30402464. 56. Souza-Moreira, T. M., Queiroz-Fernandes, G. M., & Pietro, R. C. L. R. (2018). Stryphnodendron species known as “barbatimão”: a comprehensive report. Molecules, 23(4), 910. https://doi.org/10.3390/molecules23040910. PMid:29662029. 57. Hong, G., Hu, Z., Zhou, Y., Chen, M., Wu, H., Lu, W., Jin, W., Yao, K., Xie, Z., & Shi, J. (2024). An integrated 9/11
Pinheiro,L.D.S.M.,Oviedo,V.R.,Gomes,D.T.,Carvalho,L.O.,Fernandes,L.S.,Sagrillo,M.R.,Bertuol,D.A.,&RodriguesJr.,L.F. dual-layer heterogeneous polycaprolactone scaffold promotes oral mucosal wound healing through inhibiting bacterial adhesion and mediating hgf-1 behavior. Research, 7, 0499. https://doi.org/10.34133/research.0499. PMid:39691765. 58. Ishida, K., Mello, J. C. P., Cortez, D. A. G., Dias, B. P., Fo., Ueda-Nakamura, T., & Nakamura, C. V. (2006). Influence of tannins from Stryphnodendron adstringens on growth and virulence factors of Candida albicans. The Journal of Antimicrobial
10/11
Chemotherapy, 58(5), 942-949. https://doi.org/10.1093/jac/dkl377. PMid:16973655. Received: Dec. 26, 2025 Revised: Apr. 17, 2026 Accepted: May 20, 2026 Associate Editor: Sebastião V. Canevarolo
Polímeros, 36(3), e20260031, 2026
Electrospun scaffolds loaded with Stryphnodendron adstringens extract and Melaleuca alternifolia oil
Supplementary Material Supplementary material accompanies this paper. Table S1. Shapiro-Wilk’s normality test results for mechanical assay. Table S2. Shapiro-Wilk’s normality test results for MTT assay. Table S3. Shapiro-Wilk’s normality test results for antibiofilm assay against Staphylococcus aureus. Table S4. Shapiro-Wilk’s normality test results for antibiofilm assay against Pseudomonas aeruginosa. Table S5. Kruskal-Wallis’ test results for antibiofilm assay against P. aeruginosa. Table S6. Kruskal-Wallis’ test results for antibiofilm assay against S. aureus. Table S7. Dunn’s post-hoc test results for antibiofilm assay against S. aureus. Figure S1. Contact angle measurements for PCL (A), 20B/80M (B), and 80B/20M (C). This material is available as part of the online article from https://doi.org/10.1590/0104-1428.20250123
Polímeros, 36(3), e20260031, 2026
11/11
ISSN 1678-5169 (Online)
https://doi.org/10.1590/0104-1428.20250105
Green fabrication of superhydrophobic poly(furfuryl alcohol)-coated melamine sponge Thi Nhat Thang Nguyen1* , Huu Trung Nguyen1 , Thao Quynh Ngan Tran1 and Xuan Thang Cao1* Faculty of Chemical Engineering, Industrial University of Ho Chi Minh City, Ho Chi Minh City, Vietnam
1
*nguyenthinhatthang@iuh.edu.vn; caoxuanthang@iuh.edu.vn
Abstract The increasing frequency of organic solvent pollution has raised urgent demands for efficient, sustainable, and recyclable materials for solvent-water separation. In this study, we report a green, facile strategy to fabricate a superhydrophobic melamine sponge (MS) modified with poly(furfuryl alcohol) (PFA) using a zinc-based deep eutectic solvent (DES) system. The DES, composed of choline chloride and ZnCl2, served dually as both the polymerization medium and catalytic agent for the in-situ polymerization of furfuryl alcohol on the MS skeleton. The resulting PFA-coated MS (PFA/MS) retained its intrinsic porous 3D network while acquiring significantly enhanced surface roughness and hydrophobicity. Water contact angle measurements confirmed superhydrophobicity (167.6°), and the sponge exhibited high selectivity and sorption capacity toward a wide range of organic solvents. This environmentally benign, scalable approach offers a promising platform for the development of reusable sorbents in oil spill cleanup and industrial wastewater treatment. Keywords: deep eutectic solvent, green synthesis, poly(furfuryl alcohol), solvent-water separation, superhydrophobic sponge. Data Availability: All data supporting the findings of this study are available from the corresponding author upon request. How to cite: Nguyen, T. N. T., Nguyen, H. T., Tran, T. Q. N., & Cao, X. T. (2026). Green fabrication of superhydrophobic poly(furfuryl alcohol)-coated melamine sponge. Polímeros: Ciência e Tecnologia, 36(3), e20260032. https://doi.org/10.1590/0104-1428.20250105
1. Introduction The release of petroleum-derived pollutants, industrial solvents, and organic contaminants into aquatic environments poses severe threats to both ecological systems and human health[1-4]. Oil - water mixtures resulting from accidental spills, industrial discharges, and daily operations are challenging to separate due to the immiscibility and persistence of the oil phase[5,6]. Conventional separation methods, including skimming, centrifugation, flotation, and membrane, often suffer from inefficiency, high energy consumption, or secondary pollution[7-9]. Therefore, the design of advanced sorbent materials with high selectivity, large sorption capacity, and excellent recyclability has become a crucial research direction in environmental remediation[10,11]. Among various sorbent materials, porous polymeric sponges have gained increasing attention due to their lightweight nature, high porosity, mechanical flexibility, and ease of recovery[12-15]. In particular, melamine sponge (MS), a commercially available open-cell foam, exhibits excellent structural integrity and chemical stability[16,17]. However, pristine MS is intrinsically hydrophilic, which severely limits its application in oil-water separation. To impart superhydrophobicity and oleophilicity, surface functionalization is required[18,19]. Numerous strategies have been reported for modifying MS surfaces, including physical coating, chemical grafting, carbonization, and silanization[20-26]. To date, various fabrication strategies such as dip-coating, blending, and chemical vapor deposition have been widely developed to construct superhydrophobic
Polímeros, 36(3), e20260032, 2026
melamine sponges for oil/water separation. In recent years, utilizing eco-friendly, green components and biological macromolecules to achieve fluorine-free superhydrophobicity has attracted significant attention[27]. For instance, functional micro/nanoparticles like lignin microspheres, TiO2, or MXene have been successfully assembled onto the MS skeleton to generate robust rough topologies without compromising environmental safety[28,29]. Although effective, many of these approaches often still rely on organic solvents, expensive reagents, or energy - intensive conditions, which may conflict with the principles of green chemistry. Hence, there is a pressing need for more environmentally friendly, cost-effective, and straightforward methods to develop functionalized sponges suitable for oil - water separation[30-32]. Deep eutectic solvents (DESs) have emerged as a class of green solvents with tunable properties, low toxicity, and easy preparation[33-36]. Typically formed by combining a hydrogen bond donor and acceptor, DESs can function as solvent media, reaction catalysts, and even structure-directing agents[37-40]. In particular, metal salt-based DESs such as ZnCl2 - choline chloride not only provide a medium for reactions but also exhibit Lewis acid properties, making them ideal for catalyzing polymerization processes[41]. Furfuryl alcohol (FA), a bio-derived monomer from agricultural waste, can be polymerized under acidic conditions to form poly(furfuryl alcohol) (PFA), a carbon-rich polymer with hydrophobic and thermally stable properties[42,43].
1/10
O O O O O O O O O O O O O O O O
Nguyen, T. N. T., Nguyen, H. T., Tran, T. Q. N., & Cao, X. T. By employing a DES containing ZnCl2 as a catalyst, furfuryl alcohol can be polymerized in situ on MS substrates, forming a uniform PFA coating. This strategy eliminates the use of hazardous acids or organic solvents and enables one-step functionalization under mild conditions. In this work, we propose a simple, green, and scalable route to fabricate superhydrophobic MS by coating it with PFA using a zinc-based DES system (Figure 1). The resulting PFA/MS composite maintains the original porous framework of MS while acquiring surface roughness and hydrophobicity critical for organic solvent sorption. The modified sponge exhibits strong selectivity for organic solvents, high adsorption capacity, and excellent reusability over multiple cycles. This study demonstrates the potential of DES-mediated in-situ polymerization as a versatile platform for developing eco-friendly sorbent materials for environmental applications.
2. Materials and Methods 2.1 Materials MS was purchased from Gigamall shopping center, Ho Chi Minh City, Vietnam (dimensions: 10.5 × 6 × 3 cm3). Furfuryl alcohol (FA, 98%), choline chloride (ChCl, >98%), and zinc chloride (ZnCl2, >98%) were purchased from Alfa Aesar. All other solvents and reagents used were of analytical grade and employed as received. Deionized (DI) water was used throughout the experiments.
2.2 Preparation of PFA-coated melamine sponge (PFA/MS) The ZnCl2: ChCl DES was prepared as our previous work[41]. Prior to use, MS was thoroughly cleaned with a
mixture of DI water and ethanol, then dried and cut into small blocks (2 × 1.5 × 1.0 cm3). The MS blocks were immersed in a FA solution in DI water (0.2 g/mL; 10 mL total volume) and sonicated in an ultrasonic bath for 2 h to ensure deep infiltration. The pretreated MS was then transferred into a mixture of DES (0.5 g) dissolved in 8.0 mL of DI water and stirred continuously at 60 °C for 3 h to induce polymerization. After reaction, the PFA/MS samples were washed thoroughly with DI water and dried to constant weight.
2.3 Organic solvent adsorption test The solvent adsorption capability of the PFA/MS composite was assessed using a biphasic system consisting of water and organic solvent. In a typical experiment, 200 µL of solvent was added to 100 mL of DI water in a 250 mL beaker, forming a two-phase mixture due to immiscibility. A pre-weighed sample of PFA/MS (50 mg) was gently placed into the center of the beaker without stirring. The adsorption time was recorded using a stopwatch, starting from the moment the sorbent contacted the liquid surface. The endpoint was defined as the point when the organic phase visibly disappeared or was fully absorbed into the sorbent, indicating complete uptake. This time was measured visually and averaged over at least three replicate trials for each solvent to ensure reproducibility. After adsorption, the sample was retrieved using tweezers, briefly dried on filter paper to remove excess water, and immediately weighed. The difference in mass before and after adsorption was used to calculate the amount of organic solvent absorbed. The adsorption efficiency (%) was calculated by comparing the absorbed mass to the initial mass of the added solvent.
Figure 1. Synthesis of hydrophobic PFA/MS for organic solvent adsorption. 2/10
Polímeros, 36(3), e20260032, 2026
Green fabrication of superhydrophobic poly(furfuryl alcohol)-coated melamine sponge 2.4 Reusability test of PFA/MS
3. Results and Discussions
The reusability of the PFA/MS composite was evaluated through repeated sorption–desorption cycles. In each cycle, 50 mg of PFA/MS was first used to absorb 200 µL of the target liquid in a biphasic system with 100 mL of DI water. After adsorption, the saturated sponge was removed and gently rinsed three times with 10 mL of ethanol to remove the adsorbed solvent. The cleaned PFA/MS was then dried at 40 °C in a vacuum oven prior to reusing in the next cycle. The adsorption capacity was recorded over five consecutive cycles to assess the retention of performance.
The stepwise transformation of the PFA/MS composite is illustrated in Figure 2. Initially, MS was added into a mixture of FA and DES. Upon stirring, the mixture gradually turned light yellow, indicating the onset of FA polymerization and its partial interaction with the sponge framework (Figure 2a). After polymerization and thorough washing, the modified sponge was dried to yield a dark brown porous monolith (Figure 2b). Figure 2c visually demonstrates the waterrepellent character of the modified sponge, where a water droplet rests on the surface without spreading suggesting a transition to a hydrophobic state. To complement this, the precise wettability was quantified via an optical contact angle meter, revealing an exceptional water contact angle (WCA) of 167.6° (Figure 2d). This exceptional water repellency can be attributed to the micro-/mesoporous structure formed during the polymerization and drying process, combined with the low surface energy of the crosslinked furanic matrix. The strong repulsion toward water enables efficient phase separation and facilitates rapid adsorption of organic contaminants, further reinforcing the potential application of PFA/MS materials in solvent cleanup and environmental remediation. The surface morphologies of the pristine MS and PFA/MS were examined using SEM.
2.5 Evaluation of chemical stability and mechanical durability The chemical stability of the superhydrophobic PFA/MS composite was evaluated by immersing the modified sponges into various corrosive media, including an acidic solution (HCl, pH 1), an alkaline solution (NaOH, pH 13), and a salt solution (NaCl, 5.0 wt%), at room temperature for 24 h. For the mechanical durability test, cyclic compression-release evaluations were performed by subjecting the composite sponge to repeated cyclic deformation strains. After the respective chemical treatments and mechanical cycles, the samples were rinsed thoroughly, completely dried at 60 °C, and their WCAs were re-measured.
Figure 2. Photographs and morphological characterizations: (a) MS immersed in DES/FA mixture; (b) PFA/MS composite after polymerization; (c) digital photograph of water droplet on PFA/MS surface; (d) optical WCA image of PFA/MS; SEM images of pristine MS at (e) 500× and (f) 1000× magnifications, and PFA/MS at (g) 500× and (h) 1000× magnifications. Polímeros, 36(3), e20260032, 2026
3/10
Nguyen, T. N. T., Nguyen, H. T., Tran, T. Q. N., & Cao, X. T. As shown in Figure 2e and f, the unmodified MS exhibits a typical three-dimensional open-cell network structure composed of interconnected, smooth struts forming a highly porous skeleton. The surface of the MS framework appears clean and uniform, with well-defined edges and sharp pore boundaries, consistent with its commercial fabrication. Upon surface modification with PFA, notable changes in surface characteristics were observed, while the overall 3D porous architecture was retained (Figure 2g and h). The PFA coating results in increased surface roughness and a visible loss of sharpness in the skeletal framework, indicating the formation of a continuous polymer layer over the melamine backbones. The once-smooth surfaces become irregular and textured, suggesting successful deposition and in-situ polymerization of FA throughout the skeleton. This roughened morphology is advantageous for enhancing surface energy and hydrophobic interactions, which is desirable for subsequent organic solvent adsorption. Furthermore, the uniform coverage of PFA across the sponge matrix implies effective penetration and catalytic polymerization throughout the DES-mediated process. These morphological features confirm that the DES-mediated polymerization proceeded effectively throughout the sponge matrix while maintaining
the essential macroporous structure critical for capillarydriven adsorption and separation performance. The FTIR spectrum of pristine MS reveals characteristic vibrational bands associated with its triazine-based polymeric structure (Figure 3a). Prominent peaks at 1556, 848, and 796 cm−1 are attributed to C=N stretching and ring breathing modes of the melamine backbone. A broad band centered at 1679 cm−1 is assigned to N–H bending vibrations, potentially coupled with conjugated C=N stretching. Notably, the appearance of a peak at 1749 cm−1 suggests the presence of residual carbonyl-containing groups, likely originating from processing additives of melamine-formaldehyde resins. Additionally, the high-frequency bands at 3739 and 3624 cm−1 may arise from N–H stretching or adsorbed moisture. These features indicate that the commercial MS sample contains both intrinsic melamine functionalities and minor polymeric additives from its manufacturing process. The FTIR spectrum of pure PFA, a broad absorption band around 3400 cm−1 corresponds to O–H stretching vibrations from residual hydroxyl groups or intra-/ intermolecular hydrogen bonding, which may result from incomplete polymerization or moisture uptake. A distinct peak at 3118 cm−1 is assigned to =C–H stretching of the furan ring, confirming the aromatic-like character of the polymer backbone.
Figure 3. Characterization of pristine MS, PFA, and PFA/MS composite: (a) FTIR spectra; (b) TGA curves; EDX spectra and elemental compositions of (c) MS and (d) PFA/MS. 4/10
Polímeros, 36(3), e20260032, 2026
Green fabrication of superhydrophobic poly(furfuryl alcohol)-coated melamine sponge Aliphatic C–H stretching vibrations of methylene and methyl groups are observed at 2922 and 2847 cm−1, respectively. In the fingerprint region, strong bands at 1560 and 1505 cm−1 are indicative of C=C stretching and ring vibration modes of the furan unit, while the peak at 1419 cm−1 corresponds to C–H in-plane deformation. The absorptions at 1213 and 1149 cm−1 are attributed to asymmetric C–O–C stretching, suggesting the formation of ether linkages during acid-catalyzed polymerization. A well-resolved band at 1009 cm−1 represents C–O stretching of alcohol or ether groups. The presence of a peak at 884 cm−1, assigned to out-of-plane =C–H bending of the furan ring, further confirms the preservation of furanic moieties in the polymer. These results are in good agreement with previously reported spectra, validating the successful formation of PFA. The FTIR spectrum of PFA/MS exhibits combined features from both the MS substrate and the PFA coating, confirming successful surface modification. The absorption band in the high-frequency region (~3745 and 3629 cm−1) arises from overlapping O–H and N–H stretching vibrations, indicative of hydrogen bonding and contributions from both components. The appearance of a medium-intensity peak at 1700 cm−1 may be associated with residual C=O stretching, possibly due to slight oxidation or unreacted functional groups on the surface. The peak at 1521 cm−1 reflects a convolution of C=C stretching from the furan rings and deformation vibrations of the triazine ring in MS, providing evidence of the chemical hybridization. A band at 1363 cm−1 corresponds to overlapping C–H and C–N bending modes. Characteristic PFA-derived bands at 1215 and 1039 cm−1 are attributed to asymmetric C–O–C stretching vibrations, confirming the formation of ether linkages. Finally, peaks at 837 and 769 cm−1 can be ascribed to out-of-plane bending vibrations of both the triazine and furan rings. Collectively, the FTIR data confirm the successful in-situ polymerization of FA on the MS framework, resulting in PFA/MS composite material that integrates the structural characteristics of MS with the surface chemistry of PFA-critical for the enhanced hydrophobic and oleophilic performance in organic solvent–water separation applications. The thermal stability of the materials was further evaluated by TGA, as illustrated in Figure 3b. The pristine MS exhibited a continuous weight loss starting from around 100 °C, which is mainly attributed to the evaporation of adsorbed moisture and the progressive degradation of organic components. A sharp decomposition step occurred between 300–500 °C, leading to a residual weight of less than 5%, indicating the presence of significant thermolabile components. In contrast, pure PFA demonstrated markedly enhanced thermal stability, with the main weight loss occurring between 350–600 °C and a final residue of approximately 40%. This two-stage degradation pattern corresponds to the thermal decomposition of crosslinked PFA chains and the charring of carbonaceous structures. Notably, the PFA/MS composite exhibited intermediate thermal behavior. Its onset of degradation was slightly delayed compared to MS, beginning around 200 °C, and showed a more gradual weight loss profile. The final residue of ~55% suggests that the incorporation of MS enhances the thermal resistance of PFA, likely due to the formation of a more stable hybrid structure and possible barrier effects exerted by the MS framework. Overall, the TGA results confirm that the integration of MS into the PFA matrix significantly improves its thermal stability, making the composite more suitable for high-temperature applications. Polímeros, 36(3), e20260032, 2026
The elemental compositions of pristine MS and PFA/MS composite were analyzed using EDX spectroscopy, as presented in Figure 3c and d. The spectrum of pristine MS (Figure 3c) revealed a high content of nitrogen (39.35 wt%) and carbon (35.33 wt%), consistent with the triazine-rich melamine structure. Oxygen was also detected at 18.04 wt%, possibly due to surface-bound hydroxyl or carbonyl functionalities. Interestingly, a significant amount of aluminum (6.24 wt%) was identified, along with detectable levels of magnesium and sodium. These additional elements are likely residues from commercial additives such as inorganic flame retardants or catalysts incorporated during the fabrication of the raw melamine sponge. In contrast, the EDX spectrum of the PFA/MS composite (Figure 3d) showed a marked increase in carbon content (63.95 wt%) accompanied by a sharp decrease in nitrogen and oxygen levels. The nitrogen signal, characteristic of melamine, was nearly absent—likely due to the complete encapsulation of the MS skeleton by the nitrogen-free PFA layer. Furthermore, aluminum and magnesium peaks disappeared, suggesting that these elements were either washed away during the polymerization and post-treatment steps or became undetectable beneath the uniform polymer coating. The presence of chlorine (4.64 wt%) and zinc (4.90 wt%) in the composite indicates residual components from the choline chloride–ZnCl2 DES used during in-situ polymerization. Altogether, these compositional changes confirm the successful modification of MS by PFA and the incorporation of DES-derived elements into the final structure. To further confirm the chemical states and surface functionalities before and after modification, XPS analysis was performed on both pristine MS and PFA/MS composite. Although nitrogen was not detected in the EDX spectra of PFA/MS due to its surface sensitivity limitations, XPS analysis confirms the presence of nitrogen-containing species (C=N) in the near-surface region. As shown in Figure 4a and 4d, the N 1s spectra of both pristine MS and PFA/MS exhibit a dominant peak centered at approximately 398.5 eV, which is attributed to the C=N bonds in the triazine rings of melamine. The deconvoluted C 1s spectrum of PFA/MS (Figure 4b) reveals three distinct components located at ~284.6, 286.0, and 288.2 eV, corresponding to C–C/C–H, C–N, and C–O species, respectively. The appearance of the C–O signal confirms the successful incorporation of oxygenated functional groups derived from the PFA network. The O 1s spectrum of PFA/MS (Figure 4c) displays a broad peak centered at ~532.5 eV, which is assigned to C–O–C bonds. This further supports the presence of ether functionalities introduced by the PFA coating. Taken together, these XPS results validate the successful surface modification of MS with PFA, which contributes to enhanced surface hydrophobicity and chemical functionality. To better evaluate the performance of PFA/MS, its WCA was compared with those of various modified sponge materials reported in the literature (Table S1, Supplementary Material). These reference materials employ a wide range of surface modifiers, including fluorinated silanes, long-chain alkyl groups, and hydrophobic polymers such as polydimethylsiloxane (PDMS), often combined with nanomaterials like Fe3O4, Ag, graphene oxide (GO), or carbon nanotubes (CNTs). 5/10
Nguyen, T. N. T., Nguyen, H. T., Tran, T. Q. N., & Cao, X. T.
Figure 4. High-resolution XPS core-level spectra of (a) pristine MS and (b) C 1s, (c) O 1s, and (d) N 1s regions of PFA/MS composite.
These combinations enhance surface roughness and reduce surface energy, leading to high WCAs in the range of 150– 170°. In comparison, the PFA/MS fabricated in this work demonstrates a superior WCA of 167.6°, which is among the highest reported values. Importantly, this high hydrophobicity was achieved through an eco-friendly, fluorine-free method using DES-induced in situ polymerization of FA. Unlike many prior studies that rely on complex multistep synthesis or the use of environmentally harmful reagents, our approach provides a simple, scalable, and green alternative without compromising performance. This highlights the potential of DES-based surface engineering as a sustainable platform for developing next-generation superhydrophobic materials. The solvent separation performance of the composite was assessed against a range of organic solvents, as shown in Figure 5. The PFA/MS composite exhibited variable separation efficiencies toward different organic solvents, ranging from 71.2% to 98.6%. The highest efficiency was observed for toluene (98.6%) and petroleum ether (95.8%), followed by ethyl acetate (90.4%) and tetrahydrofuran (89.3%). Lower efficiencies were recorded for n-hexane (76.0%), chloroform (73.1%), and dichloromethane (71.2%). These differences can be attributed to the physicochemical properties of the solvents, particularly their polarity, density, and molecular interaction with the PFA/MS surface. Nonpolar or low-polarity solvents such as toluene and petroleum ether exhibited stronger affinity with the hydrophobic and oleophilic surface of the sponge, facilitating capillary-driven adsorption. In contrast, dense solvents like chloroform 6/10
Figure 5. Separation efficiency of the PFA/MS for different organic solvents. The values represent the average of at least three measurements.
and dichloromethane may rapidly flow through the porous matrix, reducing contact time and thus lowering retention. Ethyl acetate and tetrahydrofuran, as moderately polar solvents, displayed intermediate uptake behavior due to balanced interactions with the sponge surface. Although the overall separation efficiencies were lower than some previously reported superabsorbent materials, it is worth noting that the current system emphasizes green synthesis Polímeros, 36(3), e20260032, 2026
Green fabrication of superhydrophobic poly(furfuryl alcohol)-coated melamine sponge and durability over multiple cycles, with no need for postsurface modification. Further optimization of the sponge porosity and surface energy could improve the uptake of heavier or polar solvents. The recyclability of the PFA/MS composite was assessed through five consecutive sorption–desorption cycles using petroleum ether and ethyl acetate as representative test liquids. As shown in Figure 6, the adsorption capacity gradually declined with each cycle. For petroleum ether, the efficiency decreased from 95.8% in the first cycle to 74.6% after five cycles, while ethyl acetate showed a reduction from 90.4% to 70.3% over the same period. This decline in performance may be attributed to partial blockage of pores or incomplete desorption of residual solvent after each regeneration step. Although ethanol washing effectively removed most of the absorbed liquids, trace residues likely remained within the porous structure, reducing available active sites. Additionally, mechanical handling during repeated drying and rinsing might have slightly altered sponge morphology or surface functionality. Nevertheless, the material retained over 70% capacity after five cycles, indicating moderate recyclability. These results confirm that PFA/MS is not only effective for one-time separation, but also viable for multiple uses in practical applications such as solvent recovery and oil–water remediation. For practical oil/water separation, sorbent materials must withstand harsh chemical environments and repeated physical deformations during oil recovery cycles. Therefore, the stability and durability of the PFA/MS composite were systematically investigated. As shown by the experimental results, the PFA/MS composite successfully retained its superhydrophobicity, exhibiting WCAs consistently greater than 150° after 24 h of exposure to strong acid (pH 1), strong base (pH 13), and hypersaline (5.0 wt% NaCl) solutions. Furthermore, the composite demonstrated reliable mechanical durability, maintaining its stable porous framework and surface superhydrophobicity without structural collapse or peeling of the coating after cyclic compression tests (data not shown). This excellent combined stability is in strong agreement with recently reported fluorine-free functionalized MS[28,29], where robust protective polymeric networks effectively reinforce the underlying sponge skeleton.
Due to the inherent chemical inertness, high stability, and robust interfacial adhesion of the cross-linked PFA coating, the surface chemistry and rough topology remain stable against chemical erosion and mechanical stress, ensuring dependable separation performance over long-term usage.
4. Conclusions In this study, a PFA/MS was successfully fabricated through a DES-assisted polymerization strategy. The resulting material exhibited a remarkably high WCA of 167.6°, placing it in the category of superhydrophobic materials and highlighting the potential of this green and fluorine-free approach for scalable surface engineering. Comprehensive physicochemical characterizations confirmed the structural and chemical integration of PFA onto the melamine sponge. FTIR spectra revealed characteristic peaks of triazine and furan rings, indicating the coexistence of MS and PFA networks. TGA showed enhanced thermal stability, with a residual mass of ~55% at 800 °C, supporting the thermal robustness of the composite. EDX analysis confirmed increased carbon content after modification, further evidence that PFA coating is successful. Importantly, XPS analysis provided insights into surface chemical states. The presence of C=N peaks in the N 1s region and the emergence of C–O functionalities in the C 1s and O 1s spectra confirmed the successful introduction of oxygenated groups from the PFA network. These findings validate the chemical modification of the sponge surface, which plays a crucial role in tuning hydrophobicity and interfacial properties. Functionally, the PFA/MS composite demonstrated rapid and selective adsorption of various organic solvents, with high efficiency for toluene (98.6%), petroleum ether (95.8%), and ethyl acetate (90.4%). The material also showed good reusability, retaining over 70% of its original adsorption capacity after five cycles for both petroleum ether and ethyl acetate. Overall, the PFA/MS composite offers a low-cost, durable, and environmentally friendly platform for hydrophobic contaminant separation. Its facile synthesis, robust physicochemical properties, and excellent separation performance highlight its potential for practical applications in industrial wastewater treatment and environmental cleanup technologies.
5. Author’s Contribution
Figure 6. Reusability of the PFA/MS composite over five sorption– desorption cycles. Polímeros, 36(3), e20260032, 2026
• Conceptualization – Thi Nhat Thang Nguyen; Xuan Thang Cao. • Data curation – Huu Trung Nguyen; Thao Quynh Ngan Tran. • Formal analysis – Thi Nhat Thang Nguyen; Huu Trung Nguyen. • Funding acquisition – Xuan Thang Cao. • Investigation – Thi Nhat Thang Nguyen; Thao Quynh Ngan Tran. • Methodology – Thi Nhat Thang Nguyen; Xuan Thang Cao. • Project administration – Xuan Thang Cao. • Resources – Thao Quynh Ngan Tran. • Software – NA. 7/10
Nguyen, T. N. T., Nguyen, H. T., Tran, T. Q. N., & Cao, X. T. • Supervision – Xuan Thang Cao. • Validation – Huu Trung Nguyen. • Visualization – Thao Quynh Ngan Tran. • Writing – original draft – Thi Nhat Thang Nguyen. • Writing – review & editing – Xuan Thang Cao; Huu Trung Nguyen; Thao Quynh Ngan Tran.
6. Acknowledgements The authors would like to thank the Industrial University of Ho Chi Minh City for general support and encouragement during this research.
7. References 1. Pereira, L. C., Souza, A. O., Bernardes, M. F. F., Pazin, M., Tasso, M. J., Pereira, P. H., & Dorta, D. J. (2015). A perspective on the potential risks of emerging contaminants to human and environmental health. Environmental Science and Pollution Research International, 22(18), 13800-13823. https://doi. org/10.1007/s11356-015-4896-6. PMid:26201652. 2. Jan, S., Mishra, A. K., Bhat, M. A., Bhat, M. A., & Jan, A. T. (2023). Pollutants in aquatic systems: a frontier perspective of emerging threat and strategies to solve the crisis for safe drinking water. Environmental Science and Pollution Research International, 30(53), 113242-113279. https://doi.org/10.1007/ s11356-023-30302-4. PMid:37864686. 3. Duarte, H., Aliaño-González, M. J., Romano, A., & Medronho, B. (2024). Advancements in detection and mitigation strategies for petroleum-derived contaminants in aquatic environments: a comprehensive review. Sensors (Basel), 24(11), 3284. https:// doi.org/10.3390/s24113284. PMid:38894076. 4. Du, Y., Xu, X., Liu, Q., Bai, L., Hang, K., & Wang, D. (2022). Identification of organic pollutants with potential ecological and health risks in aquatic environments: progress and challenges. The Science of the Total Environment, 806(Part 3), 150691. https:// doi.org/10.1016/j.scitotenv.2021.150691. PMid:34600995. 5. Tian, Y., Zhou, J., He, C., He, L., Li, X., & Sui, H. (2022). The formation, stabilization and separation of oil–water emulsions: A review. Processes (Basel, Switzerland), 10(4), 738. https:// doi.org/10.3390/pr10040738. 6. Gohil, J. M., Kwon, G., Bhunia, P., Dutta, K., & Boukherroub, R. (2022). Overview on oil/water separation techniques and working principles. In R. Boukherroub, K. Dutta & J. Gohil (Eds.), Oil–water mixtures and emulsions: membrane materials for separation and treatment (Vol. 1, pp. 247-304). Washington, DC: American Chemical Society. https://doi.org/10.1021/bk2022-1407.ch007 7. Rubio, J., Souza, M. L., & Smith, R. W. (2002). Overview of flotation as a wastewater treatment technique. Minerals Engineering, 15(3), 139-155. https://doi.org/10.1016/S08926875(01)00216-3. 8. Liu, B., Chen, B., Ling, J., Matchinski, E. J., Dong, G., Ye, X., Wu, F., Shen, W., Liu, L., Lee, K., Isaacman, L., Potter, S., Hynes, B., & Zhang, B. (2022). Development of advanced oil/water separation technologies to enhance the effectiveness of mechanical oil recovery operations at sea: potential and challenges. Journal of Hazardous Materials, 437, 129340. https://doi.org/10.1016/j.jhazmat.2022.129340. PMid:35728323. 9. Li, B., Qi, B., Guo, Z., Wang, D., & Jiao, T. (2023). Recent developments in the application of membrane separation technology and its challenges in oil–water separation: A review. Chemosphere, 327, 138528. https://doi.org/10.1016/j. chemosphere.2023.138528. PMid:36990363. 8/10
10. Ma, Q., Cheng, H., Fane, A. G., Wang, R., & Zhang, H. (2016). Recent development of advanced materials with special wettability for selective oil/water separation. Small, 12(16), 2186-2202. https://doi.org/10.1002/smll.201503685. PMid:27000640. 11. Odoom, J., Iorhemen, O. T., & Li, J. (2025). Advances in adsorption for oily wastewater treatment: eco-friendly adsorbents and analytical insights. Energy, Ecology & Environment, 10(1), 15-44. https://doi.org/10.1007/s40974-024-00332-w. 12. Wang, Z., Ma, H., Chu, B., & Hsiao, B. S. (2017). Superhydrophobic modification of porous natural polymer “luffa sponge” for oil absorption. Polymer, 126, 470-476. https://doi.org/10.1016/j.polymer.2017.05.068. 13. Koroleva, M. Y., Shirokikh, S. A., Khasanova, L. K., Babusenko, E. S., & Yurtov, E. V. (2019). Highly porous polymeric sponges for oil sorption. Mendeleev Communications, 29(2), 176-177. https://doi.org/10.1016/j.mencom.2019.03.020. 14. Gupta, S., & Tai, N.-H. (2016). Carbon materials as oil sorbents: A review on the synthesis and performance. Journal of Materials Chemistry. A, Materials for Energy and Sustainability, 4(5), 1550-1565. https://doi.org/10.1039/C5TA08321D. 15. Fouladi, M., Heidari, M. K., & Tavakoli, O. (2023). Development of porous biodegradable sorbents for oil/water separation: A critical review. Journal of Porous Materials, 30(3), 1037-1053. https://doi.org/10.1007/s10934-022-01385-0. 16. Shi, Y., Liu, G., Jin, R., Xu, H., Wang, Q., & Gao, S. (2019). Carbon materials from melamine sponges for supercapacitors and lithium battery electrode materials: A review. Carbon Energy, 1(2), 253-275. https://doi.org/10.1002/cey2.19. 17. Feng, Y., & Yao, J. (2018). Design of melamine sponge-based three-dimensional porous materials toward applications. Industrial & Engineering Chemistry Research, 57(22), 7322-7330. https://doi.org/10.1021/acs.iecr.8b01232. 18. He, L., Qi, X., He, J., Li, C., Wei, W., Zhang, X., & Gao, Z. (2024). Research progress in hydrophobic modification of melamine sponge and its application in oil–water separation field. Journal of Environmental Chemical Engineering, 12(3), 112536. https://doi.org/10.1016/j.jece.2024.112536. 19. Zhou, X., Li, D., Wang, L., Wang, Q., Wang, Z., Jing, Q., Marisol, R., & Li, L. (2025). Recent advances in the modification of melamine sponge for oil–water separation. Journal of Materials Science and Technology, 207, 209-224. https://doi. org/10.1016/j.jmst.2024.04.013. 20. Dong, H., Zhan, Y., Sun, A., Chen, Y., & Chen, X. (2023). Magnetically responsive and durable super-hydrophobic melamine sponge material. Colloids and Surfaces. A, Physicochemical and Engineering Aspects, 662, 130933. https://doi.org/10.1016/j.colsurfa.2023.130933. 21. Hojatjalali, M., Bahraminia, S., & Anbia, M. (2025). Superhydrophobic magnetic melamine sponge modified by flowerlike ZnO and stearic acid using dip coating method for oil and water separation. Scientific Reports, 15(1), 7378. https:// doi.org/10.1038/s41598-025-92246-8. PMid:40025248. 22. Zhang, T., Han, L., Yang, G., Schubert, D. W., & Duan, C. (2025). Optimizing melamine sponges modified with titanium dioxide nanoparticles for environmental and industrial applications. Journal of Applied Polymer Science, 142(13), e56661. https:// doi.org/10.1002/app.56661. 23. Stolz, A., Le Floch, S., Reinert, L., Ramos, S. M. M., TuaillonCombes, J., Soneda, Y., Chaudet, P., Baillis, D., Blanchard, N., Duclaux, L., & San-Miguel, A. (2016). Melamine-derived carbon sponges for oil–water separation. Carbon, 107, 198208. https://doi.org/10.1016/j.carbon.2016.05.059. 24. Lei, Z., Zhang, G., Deng, Y., & Wang, C. (2017). Thermoresponsive melamine sponges with switchable wettability by interfaceinitiated atom transfer radical polymerization for oil/water separation. ACS Applied Materials & Interfaces, 9(10), 89678974. https://doi.org/10.1021/acsami.6b14565. PMid:28229584. Polímeros, 36(3), e20260032, 2026
Green fabrication of superhydrophobic poly(furfuryl alcohol)-coated melamine sponge 25. Sun, Y., Wang, W.-R., Li, D.-Y., Xu, S.-Y., Lin, L., Lu, M.-L., Fan, K., Xing, C.-Y., Li, L.-F., & Li, J.-H. (2024). Superhydrophobic melamine sponge prepared by radiation-induced grafting technology for efficient oil–water separation. Nuclear Science and Techniques, 35(9), 147. https://doi.org/10.1007/s41365024-01507-0. 26. Pham, V. H., & Dickerson, J. H. (2014). Superhydrophobic silanized melamine sponges as high-efficiency oil absorbent materials. ACS Applied Materials & Interfaces, 6(16), 1418114188. https://doi.org/10.1021/am503503m. PMid:25039789. 27. He, Z., Wang, M., & Ma, S. (2024). Porous lignin-based composites for oil/water separation: A review. International Journal of Biological Macromolecules, 260(Pt 2), 129569. https://doi.org/10.1016/j.ijbiomac.2024.129569. PMid:38253151. 28. Qiao, L., Zhou, Z., Wang, M., & He, Z. (2025). Lignin Microsphere/TiO2 Composite-Based Melamine Sponge with Superhydrophobic and Photothermal Properties for Oil/Water Separation and Anti-Icing. Langmuir : The ACS Journal of Surfaces and Colloids, 41(21), 13233-13248. https://doi. org/10.1021/acs.langmuir.5c00913. PMid:40397029. 29. Wang, M., Qiao, L., Ma, S., & He, Z. (2024). Facile Preparation of photothermal superhydrophobic melamine sponge decorated with Mxene and Lignin Particles for efficient oil/water separation, fast crude oil recovery, and active deicing. Langmuir : The ACS Journal of Surfaces and Colloids, 40(11), 5978-5991. https://doi.org/10.1021/acs.langmuir.3c04006. PMid:38443344. 30. Peng, M., Zhu, Y., Li, H., He, K., Zeng, G., Chen, A., Huang, Z., Huang, T., Yuan, L., & Chen, G. (2019). Synthesis and application of modified commercial sponges for oil–water separation. Chemical Engineering Journal, 373, 213-226. https://doi.org/10.1016/j.cej.2019.05.013. 31. Farrokhi, S. J., Pakzad, H., Fakhri, M., & Moosavi, A. (2021). Superhydrophobic home-made polyurethane sponges for versatile and cost-effective oil and water separation. Separation and Purification Technology, 276, 119240. https://doi.org/10.1016/j. seppur.2021.119240. 32. Sam, E. K., Liu, J., & Lv, X. (2021). Surface engineering materials of superhydrophobic sponges for oil/water separation: A review. Industrial & Engineering Chemistry Research, 60(6), 2353-2364. https://doi.org/10.1021/acs.iecr.0c05906. 33. Hessel, V., Tran, N. N., Razi Asrami, M., Tran, Q. D., Long, N. V. D., Escribà-Gelonch, M., Osorio Tejada, J., Linke, S., & Sundmacher, K. (2022). Sustainability of green solvents: review and perspective. Green Chemistry, 24(2), 410-437. https://doi.org/10.1039/D1GC03662A. 34. Liu, J., Li, X., & Row, K. H. (2022). Development of deep eutectic solvents for sustainable chemistry. Journal of Molecular Liquids, 362, 119654. https://doi.org/10.1016/j. molliq.2022.119654.
Polímeros, 36(3), e20260032, 2026
35. Mushtaq, M., Butt, F. W., Akram, S., Ashraf, R., & Ahmed, D. (2024). Deep eutectic liquids as tailorable extraction solvents: a review of opportunities and challenges. Critical Reviews in Analytical Chemistry, 54(6), 1634-1660. https://doi.org/10.1 080/10408347.2022.2125284. PMid:36148704. 36. Prabhune, A., & Dey, R. (2023). Green and sustainable solvents of the future: deep eutectic solvents. Journal of Molecular Liquids, 379, 121676. https://doi.org/10.1016/j.molliq.2023.121676. 37. Abo-Hamad, A., Hayyan, M., AlSaadi, M. A., & Hashim, M. A. (2015). Potential applications of deep eutectic solvents in nanotechnology. Chemical Engineering Journal, 273, 551-567. https://doi.org/10.1016/j.cej.2015.03.091. 38. Khandelwal, S., Tailor, Y. K., & Kumar, M. (2016). Deep eutectic solvents (DESs) as eco-friendly and sustainable solvent/catalyst systems in organic transformations. Journal of Molecular Liquids, 215, 345-386. https://doi.org/10.1016/j. molliq.2015.12.015. 39. Liu, P., Hao, J.-W., Mo, L.-P., & Zhang, Z.-H. (2015). Recent advances in the application of deep eutectic solvents as sustainable media as well as catalysts in organic reactions. RSC Advances, 5(60), 48675-48704. https://doi.org/10.1039/C5RA05746A. 40. Gutiérrez, M. C., Carriazo, D., Ania, C. O., Parra, J. B., Ferrer, M. L., & del Monte, F. (2011). Deep eutectic solvents as both precursors and structure directing agents in the synthesis of nitrogen-doped hierarchical carbons highly suitable for CO2 capture. Energy & Environmental Science, 4(9), 3535-3544. https://doi.org/10.1039/c1ee01463c. 41. Cao, T. P., Hang, C. N., Vu-Quang, H., Kabtamu, D. M., Kumar, S., Nguyen, V. C., & Cao, X. T. (2022). Catalyst-free synthesis of poly(furfuryl alcohol) using deep eutectic solvents. New Journal of Chemistry = Nouveau Journal de Chimie, 46(8), 3786-3793. https://doi.org/10.1039/D1NJ05723E. 42. Tan, W. X., Chiang, P.-J., Tan, L. P., Ramanujan, R. V., Tan, M. J., Ong, A., Jangam, J. S. D., & Lai, C. Q. (2024). Adhesive and alloying properties of dual purpose polyfurfuryl alcohol binder for binder jet additive manufacturing of steel. Additive Manufacturing, 86, 104212. https://doi.org/10.1016/j.addma.2024.104212. 43. Acosta, A. P., Amico, S. C., Delucis, R. A., Missio, A. L., Rodrigues, M. B. B., Ribeiro, A. C. R., Goularte, M. P., & Gatto, D. A. (2024). Surface analysis of different wood polymer composites exposed to artificial weathering. Journal of Wood Chemistry and Technology, 44(2), 88-101. https://doi.org/10. 1080/02773813.2023.2299814. Received: Dec. 04, 2025 Revised: May 24, 2026 Accepted: May 28, 2026 Associate Editor: César L. Petzhold
9/10
Nguyen, T. N. T., Nguyen, H. T., Tran, T. Q. N., & Cao, X. T.
Supplementary Material Supplementary material accompanies this paper. Table S1. WCAs of different modified sponge materials and their surface modification strategies reported in the literature. This material is available as part of the online article from https://doi.org/10.1590/0104-1428.20250105
10/10
Polímeros, 36(3), e20260032, 2026
ISSN 1678-5169 (Online)
https://doi.org/10.1590/0104-1428.20250051
HDPE/geopolymer composites with improved thermal and acoustic insulation for aerospace applications Eliziane Medeiros Santos1 , Ricardo Pondé Weber1 , Flávio James Humberto Tommasini Vieira Ramos2 and Maria de Fátima Vieira Marques2* Departamento de Ciência de Materiais, Instituto Militar de Engenharia – IME, Rio de Janeiro, RJ, Brasil 2 Instituto de Macromoléculas Professora Eloisa Mano – IMA, Universidade Federal do Rio de Janeiro – UFRJ, Rio de Janeiro, RJ, Brasil
1
*fmarques@ima.ufrj.br
Abstract This work reports high-density polyethylene (HDPE) composites reinforced with geopolymers derived from ladle-furnace slag for aerospace insulation. Composites containing 10–30 wt% geopolymer were melt-processed with in-situ compatibilization, and their thermal and acoustic properties were systematically evaluated. Compared with neat HDPE, the best formulation (20 wt% geopolymer with compatibilization) increased the onset degradation temperature to 412 °C (≈ +52 °C), reduced thermal diffusivity to 0.24 mm2 s−1 (≈ −20%), and raised the noise-reduction coefficient to 0.27 (≈ +35%). Microstructural analysis indicated uniform particle dispersion and improved polymer–filler adhesion, which underpin the simultaneous gains in thermal stability and sound absorption. These results demonstrate a lightweight, sustainable route to multifunctional insulation materials based on industrial by-products, with clear potential for aircraft interior applications. Keywords: high-density polyethylene, geopolymer, composite, thermal diffusivity, acoustic absorption coefficient. Data Availability: All data supporting the findings of this study are available from the corresponding author upon request. How to cite: Santos, E. M., Weber, R. P., Ramos, F. J. H. T. V., & Marques, M. F. V. (2026). HDPE/geopolymer composites with improved thermal and acoustic insulation for aerospace applications. Polímeros: Ciência e Tecnologia, 36(3), e20260033. https://doi.org/10.1590/0104-1428.20250051
1. Introduction Environmental pollution remains a major global concern, with industrial effluents posing risks to ecosystems and public health[1]. To mitigate these effects, waste valorization and circular economy strategies have emerged as essential components of sustainable materials engineering[2]. Among various industrial residues, ladle furnace slag (LFS), a steelmaking byproduct, is a promising precursor for geopolymer synthesis due to its high SiO2 and Al2O3 content[3,4]. Geopolymers are inorganic aluminosilicate materials produced by alkaline activation reactions, forming semi-crystalline three-dimensional frameworks that exhibit high compressive strength, low shrinkage, excellent durability, and good thermal stability[5,6]. High-density polyethylene (HDPE) is a semicrystalline thermoplastic known for its low density, mechanical toughness, chemical resistance, and long service life exceeding 100 years[7-9]. HDPE-based composites are increasingly used in aerospace and automotive industries owing to their light weight, fatigue resistance, and insulation properties[10-12]. The integration of inorganic fillers such as fly ash, silica, and glass powder has been explored to improve HDPE’s thermal and mechanical performance[13-15]. However, there is still a lack of studies combining HDPE with geopolymeric fillers derived from industrial residues, aimed at simultaneously improving thermal and acoustic insulation performance.
Polímeros, 36(3), e20260033, 2026
The geopolymerization reaction involves dissolution of aluminosilicate sources, polycondensation, and gel formation, leading to a three-dimensional network composed of Si–O–Al bonds. This process transforms raw slag into an amorphous-to-semicrystalline material with strong covalent bonding and high-temperature resistance[16-18]. The resulting matrix exhibits exceptional durability and tunable porosity, which can contribute to improved sound absorption and reduced thermal diffusivity. Incorporating geopolymer fillers into polymers has been reported to enhance mechanical rigidity, flame retardancy, and barrier properties due to the inorganic network and residual hydroxyl groups capable of interacting with polymer chains [19,20]. Nonetheless, achieving good dispersion and interfacial adhesion remains challenging. Compatibilizers such as maleic anhydride (MA) and organic peroxides can promote chemical grafting between HDPE and the inorganic filler surface, thereby improving stress transfer and stability under thermal cycling[21,22]. To date, no studies have reported HDPE composites reinforced with geopolymer particles for combined thermal and acoustic insulation. This work addresses that gap by developing sustainable HDPE/geopolymer composites derived
1/10
O O O O O O O O O O O O O O O O
Santos, E. M., Weber, R. P., Ramos, F. J. H. T. V., & Marques, M. F. V. from ladle furnace slag, emphasizing the compatibilization strategy and characterization of the resulting materials. The expected outcome is a lightweight, high-performance composite suitable for aerospace interior insulation and other engineering applications, supporting circular economy principles.
2. Materials and Methods 2.1 Materials High-density polyethylene (HDPE, grade HS 5407, Braskem) was used as the polymer matrix. Geopolymer particles were synthesized from ladle furnace slag (LFS) supplied by USIMINAS (Brazil), targeting applications in thermal and acoustic insulation. All reagents were of analytical grade. Sodium hydroxide (NaOH, 98%) and sodium silicate (Na2SiO3, silica modulus Mₛ = SiO2/Na2O = 3.3), both purchased from Sigma-Aldrich, were employed as alkaline activators for geopolymer synthesis. The chemical composition of the original slag is summarized in Table 1. The high FeT content corresponds to total iron oxides, whereas FeO indicates the presence of divalent iron typical of reducing steelmaking environments. These oxide phases, along with SiO2 and Al2O3, serve as essential precursors for geopolymer network formation, promoting the development of calcium–aluminosilicate structures upon alkaline activation.
2.2 Methods 2.2.1 Geopolymer synthesis and composite preparation Geopolymer pastes were prepared by dry-mixing the slag powder with an activating solution composed of Na2SiO3 and NaOH (mass ratio 2.5:1, 8 M NaOH). The paste was cured
at 70 °C for 24 h, crushed, and ground in a Retsch ZM200 mill (9000 rpm, 15 min) followed by sieving (<75 µm). The macerated 1.4 geopolymer was selected for composite production due to its fine particle size distribution. HDPE pellets were cryogenically milled after exposure to liquid nitrogen for 2 h. In situ compatibilization was achieved using 3 wt% maleic anhydride (MA) and 0.5 wt% dicumyl peroxide (DCP) as a free-radical initiator to promote grafting between MA and the HDPE backbone. Composites were produced via melt extrusion in a Haake Minilab micro-extruder at 200 °C, 120 rpm, for 7 min. After extrusion, composite sheets were compression-molded using a Carver hot press at 200 °C and 5 tons for 7 min, followed by cooling under pressure for 5 min in a cold press. Table 2 details the formulations, with samples coded by the percentage of geopolymer (G), HDPE, and MA (e.g., 1.4.20:77:03). A control sample using untreated slag (E.20:77:03) was also prepared for comparison. 2.2.2 Characterization techniques FTIR spectroscopy was performed in ATR mode (Perkin Elmer Frontier FT-IR/FIR, 4000–400 cm−1, 4 cm−1 resolution, 128 scans) to identify chemical interactions and compatibilization evidence. Thermogravimetric analysis (TGA) was carried out using a Shimadzu DTG-60H analyzer under nitrogen from 25 °C to 1000 °C (10 °C/min). DTG curves were derived to determine Tonset, Tmax, Tend, and residual mass. Scanning electron microscopy (SEM) analyses were conducted using a FEI Quanta 250 FEG operating at 15 kV. Samples were sputter-coated with Au (16 nm, 180 s) using a Leica Ace600 coater. Average particle sizes were measured from 30 particles per image (n=30) using ImageJ software.
Table 1. Composition of the ladle furnace slag. Component
FeT
FeO
CaO
SiO2
MgO
MnO
Al2O3
S
ZnO
K2O
Na2O
wt%
53.58
26.42
17.30
7.11
5.35
2.09
3.97
0.68
<0.005
0.26
0.08
Table 2. Samples and their compositions. SAMPLE Macerated slag Sifted slag HDPE pellet Ground HDPE Maleic Anhydrid (MA) Geo. 1.4 chunk Geo. 1.4 macerated Geo. 1.4 sifted HDPE.00:00:00 1.4.20:80:00 1.4.10:87:03 1.4.20:77:03 1.4.30:67:03 E.20:77:03
%G 100 100 100 20 10 20 30 -
%E 100 100 20
%HDPE 100 100 100 80 87 77 67 77
%MA
100 3 3 3 3
%G = mass fraction of geopolymer (alkali-activated slag); %E = mass fraction of raw slag (escória) used directly as filler; %HDPE = mass fraction of high-density polyethylene matrix; %MA = mass fraction of maleic anhydride compatibilizer. Codes “1.4.x:y:z” denote geopolymerfilled formulations, whereas “E.x:y:z” denote raw-slag-filled formulations.
2/10
Polímeros, 36(3), e20260033, 2026
HDPE/geopolymer composites with improved thermal and acoustic insulation for aerospace applications Shore D hardness measurements followed ASTM D2240 with five replicates (n=5). Standard deviations were calculated and reported. Density measurements were performed using a 250 mL pycnometer with ethanol (0.793 g cm−3, 20 °C) as the immersion liquid. The sample density was calculated considering the measured masses of the empty pycnometer, the pycnometer with ethanol, and with the sample immersed, following the standard displacement method described in ASTM D792. Five replicates (n = 5) were conducted, and average values with standard deviations were reported. Thermal diffusivity was measured by Laser Flash Analysis (Netzsch LFA 457, ASTM-E-1461) at 25 °C using 9.75×9.75 mm disks (0.92 g/cm3). Acoustic absorption coefficient (AAC) was evaluated according to ASTM-E-1050 using an impedance tube equipped with two microphones and white noise between 100 and 3150 Hz. The was obtained as the average of the sound absorption coefficients at 250, 500, 1000, and 2000 Hz, following the ASTM C423 standard. The NRC value was calculated using Equation 1.
NRC=
(
)
(α 250 + α 500 + α1000 + α 2000 ) / 4 (1)
where, α = is the arithmetic mean of the values found for the acoustic absorption coefficients at a given frequency.
3. Results and Discussion 3.1 FTIR analysis The FTIR spectra of neat HDPE and its composites (Figure 1) revealed the characteristic absorption bands of polyethylene and confirmed the incorporation of geopolymer particles into the polymer matrix. The main CH2 stretching vibrations appeared at 2915 and 2848 cm−1, corresponding to asymmetric and symmetric stretching modes of the methylene groups, while the bending vibrations were observed at 1470 and 720 cm−1. A broad band at 3380–3400
cm−1 was attributed to hydroxyl groups, which became more pronounced in the compatibilized composites, indicating the presence of interfacial interactions between the polymer and the inorganic filler. In the geopolymer phase, typical Si–O–Al stretching vibrations appeared around 950–1000 cm−1, consistent with the formation of aluminosilicate networks. A noticeable shift in this band from 963 to 935 cm−1 suggested increased polymer–filler interactions and partial modification of the geopolymer surface due to the grafting reaction. The presence of new absorption at 1715 cm−1 in the compatibilized composites confirmed the formation of carbonyl groups from maleic anhydride (MA) grafting, which improved the interfacial adhesion between HDPE and the geopolymer particles[23-25]. These findings indicate that the peroxide-initiated MA compatibilization promoted chemical bonding at the interface, resulting in enhanced adhesion and dispersion. Similar behavior has been reported for MA-functionalized HDPE systems containing inorganic fillers[26,27].
3.2 Thermogravimetric analysis (TGA) The thermal stability of HDPE and its composites was evaluated by TGA and DTG (Figures 2 and 3). The main thermal parameters (Tonset, Tmax, Tend, and residue) obtained from the thermogravimetric curves are summarized in Table 3. Neat HDPE exhibited a single-stage degradation process starting at 359 °C and peaking at approximately 480 °C, typical of polyethylene decomposition under inert atmosphere[28]. Incorporation of geopolymer increased the onset degradation temperature for all composites, confirming the protective barrier effect of the inorganic phase. The 1.4.20:77:03 composite showed the highest Tonset (412 °C) and residue at 1000 °C (71.9%), far exceeding the expected inorganic fraction (~17%), which can be attributed to the formation of thermally stable calcium–aluminosilicate phases[29,30]. This improvement reflects the efficient dispersion of geopolymer and the formation of a cohesive interfacial layer that restricted polymer chain mobility and limited the diffusion of degradation products.
Figure 1. Fourier transform infrared (FTIR) spectrum of (a) HDPE, ladle furnace slag and geopolymer 1,4; (b) the 1.4:30:67:03 composite and HDPE. Polímeros, 36(3), e20260033, 2026
3/10
Santos, E. M., Weber, R. P., Ramos, F. J. H. T. V., & Marques, M. F. V.
Figure 2. Geopolymer 1,4 and ladle furnace slag. (a) TGA; (b) DTG.
Figure 3. TG (a) and DTG (b) of HDPE and composites manufactured with different concentrations of geopolymer 1,4, without and with compatibilizer.
Table 3. Data obtained in Thermogravimetric Analysis (TGA). SAMPLE
Tonset (°C)
Tmax (°C)
Tend (°C)
Residue (%)
Slag Geopolymer 1.4 HDPE 1.4.20:80:00 1.4.10:87:03 1.4.20:77:03 1.4.30:67:03 E.20:77:03
25.0 25.0 359.8 401.9 403.6 412.4 384.8 413.5
469.2 457.9 469.2 463.1 485.6 451.4
1000.0 1000.0 501.0 490.1 508.9 479.5 508.9 483.2
95.1 84.2 4.3 24.4 18.8 71.9 35.4 35.7
For the 1.4.30:67:03 sample, although higher filler content could potentially reduce the polymer continuity, the degradation profile remained stable due to the crosslinked and inorganic-rich network. The observed residue at 1000 °C confirmed the persistence of geopolymer structures and their contribution to enhancing the composite’s fire resistance[31-33]. 4/10
3.3 Scanning electron microscopy (SEM) SEM micrographs (Figure 4) of the raw ladle furnace slag and the geopolymer confirmed significant morphological transformation after alkaline activation. The slag particles exhibited irregular shapes with sharp edges, while the geopolymer showed smoother and more cohesive agglomerates, characteristic of gel consolidation. Polímeros, 36(3), e20260033, 2026
HDPE/geopolymer composites with improved thermal and acoustic insulation for aerospace applications
Figure 4. (A) Micrograph (2000x) of ladle furnace slag (a) and geopolymer 1.4 (b). (B) Images (250x) of macerated (a) and sieved 1,4 geopolymer (b).
In the HDPE composites, uniform dispersion of geopolymer particles was observed for the compatibilized 1.4.20:77:03 sample, while the non-compatibilized 1.4.20:80:00 presented visible interfacial gaps. This indicates that the use of MA and DCP improved the filler–matrix adhesion, leading to a more homogeneous microstructure. The improved dispersion was consistent with the FTIR evidence of interfacial bonding. Particle size analysis (Table 2) showed mean diameters of 91.1 ± 26.0 µm for macerated and 63.4 ± 7.4 µm for sieved geopolymers. The smaller particles favored improved packing, decreased interparticle voids, and enhanced interfacial wetting by the polymer matrix[34]. Such morphological refinement contributes directly to the observed increase in thermal stability and sound absorption.
3.4 Mechanical and physical properties The Shore D hardness results (Table 4) demonstrated a progressive increase with geopolymer content up to 20 wt%, followed by a slight reduction at 30 wt%. Neat HDPE exhibited 55 ± 2 Shore D, while the 1.4.20:77:03 composite reached 60 ± 2, confirming reinforcement by rigid filler particles. The minor decrease at 30 wt% may Polímeros, 36(3), e20260033, 2026
be due to particle agglomeration and stress concentration at interfacial voids. The densities of the composites (Table 5) ranged from 1.38 to 2.11 g/cm3, depending on geopolymer content and processing route. The compatibilized 10 wt% composite exhibited slightly lower density, associated with the incorporation of fine pores that improved insulation properties. This microvoid formation was beneficial for sound and heat insulation, as similar behavior has been reported for hybrid polymer–inorganic systems[35,36].
3.5 Thermal diffusivity and acoustic performance Thermal diffusivity results (Figure 5a) indicated that the incorporation of geopolymer effectively reduced heat conduction through the composite. The diffusivity decreased from 0.30 mm2/s for neat HDPE to 0.23 mm2/s for the 1.4.10:87:03 composite and remained low (0.24 mm2/s) for the compatibilized 1.4.20:77:03 sample. This reduction is attributed to the phonon-scattering effect caused by the dispersed inorganic particles and interfacial microvoids that hinder heat transfer[37]. The overall results confirm the inverse relationship between thermal diffusivity and acoustic 5/10
Santos, E. M., Weber, R. P., Ramos, F. J. H. T. V., & Marques, M. F. V. Table 4. Hardness test results. SAMPLE
MEASUREMENTS 1
2
3
4
5
AVERAGE ± SD
HDPE
56
56
55
53
48
55 ± 3.2
1.4.20:80:00
61
60
59
59
57
60 ± 1.6
1.4.10:87:03
58
58
58
59
59
58± 0.5
1.4.20:77:03
60
60
63
57
60
60 ± 2.0
1.4.30:67:03
52
60
55
55
50
56 ± 3.7
E.20:77:03
62
62
58
55
50
59± 4.5
m1 (g)
m2 (g)
Vp (cm3)
t
de (g/cm3)
Table 5. Density test results. DATA USED
23.388
43.528
25.397
20 °C
0.793
SAMPLE
m3 (g)
m4 (g)
me (g)
Ve (cm3)
Va (cm3)
da (g/cm3)
HDPE
0.551
43.672
19.733
24.884
0.513
1.074
1.4.20:80:00
0.540
43.782
19.854
25.037
0.361
1.497
1.4.10:87:03
0.549
43.762
19.825
25.000
0.397
1.382
1.4.20:77:03
0.604
43.905
19.913
25.111
0.286
2.110
1.4.30:67:03
0.648
43.990
19.954
25.163
0.235
2.763
E.20:77:03
0.526
43.867
19.953
25.161
0.236
2.231
m1 – mass of the empty pycnometer; m2 – mass of the pycnometer filled with liquid; Vₚ – volume of the pycnometer; t – measurement temperature; de – density of the immersion liquid; m3 – mass of the dry sample; m4 – mass of the pycnometer with liquid and sample; me – equivalent mass of displaced liquid (m2 + m3 – m4); Ve – effective (displaced) volume of the sample; Va – apparent volume; da – apparent density of the sample.
Figure 5. Acoustic Absorption Coefficients of (a) HDPE; (b) composites with geopolymer 1.4 with and without maleic anhydride.
absorption, validating the dual insulation functionality of the developed composites (Table 6).
composite (30 wt% geopolymer) exhibited lower AAC values, likely due to particle agglomeration and reduced damping.
Acoustic absorption coefficient (AAC) curves (Figure 5b) showed that neat HDPE reached a maximum absorption of 0.26 at 315 Hz, with its best response between 200–400 Hz, typical of dense thermoplastics with low internal damping. This limited response is associated with vibrational resonance rather than true sound absorption, due to the absence of internal porosity[38].
Table 7 summarizes the frequency ranges relevant to specific aircraft noise sources, confirming that the 1.4.20:77:03 composite is the most suitable for sound insulation in nearly all evaluated cases—except for Case 7 (1000–1200 Hz), where neat HDPE slightly outperformed due to resonance at that band.
Among the composites, 1.4.20:77:03 (20 wt% geopolymer and 3 wt% MA) presented the best acoustic performance, with a peak AAC of 0.38 at 315 Hz and superior absorption across most frequencies (Table 7). The addition of geopolymer increased internal friction and multiple reflections of sound waves, while MA improved particle–matrix adhesion, enhancing dissipation efficiency. Conversely, the 1.4.30:67:03 6/10
The results summarized in Table 8 highlight clear differences in NRC values among the samples[39]. Neat HDPE exhibited limited sound absorption (NRC = 0.20), consistent with its compact and non-porous structure. The 1.4.20:80:00 composite (20 wt% geopolymer, no compatibilizer) showed modest improvement (NRC = 0.23), primarily at 250 Hz, attributed to increased porosity introduced by the inorganic phase. Polímeros, 36(3), e20260033, 2026
HDPE/geopolymer composites with improved thermal and acoustic insulation for aerospace applications Table 6. Results of the Thermal Diffusivity Test (LFA). THERMAL DIFFUSIVITY (m2/s) Measure 1 Measure 2 Measure 3 0.30 0.29 0.29 0.30 0.30 0.29 0.23 0.23 0.24 0.25 0.24 0.24 0.29 0.28 0.28 0.38 0.38 0.38
SAMPLE HDPE.00:00:00 1.4.20:80:00 1.4.10:87:03 1.4.20:77:03 1.4.30:67:03 E.20:77:03
AVERAGE
Standard Deviation
0.29 0.30 0.23 0.24 0.28 0.38
0.01 0.01 0.01 0.01 0.01 0.00
Table 7. Most suitable composite for sound insulation under specific frequency conditions. CASE 1 2 3 4 5 6 7 8
PURPOSE OF INSULATION Excitation of flow and internal vibration of panels Turboprop engines Tail-mounted engines (jet aircraft) Wind noise Stronger excitation in a twin-engine turboprop aircraft Narrowband internal noise spectrum of an executive jet Noise band in medium-sized commercial jet aircraft with up to 140 passengers Noise band in medium-sized commercial jet aircraft with up to 140 passengers
FREQUENCY RANGE (Hz) 800 to 2000 60 to 400 100 to 500 Above 400 100 to 500 Up to 800 1000 to 1200 800 to 1800
Table 8. Noise Reduction Coefficient (NRC) values for HDPE/geopolymer composites. SAMPLE HDPE.00:00:00 1.4.20:80:00 1.4.10:87:03 1.4.20:77:03 1.4.30:67:03 E.20:77:03
250.00 0.25 0.29 0.25 0.32 0.28 0.26
CAA AVERAGE IN FREQUENCY 500.00 1000.00 0.20 0.18 0.22 0.17 0.22 0.17 0.31 0.18 0.20 0.15 0.20 0.15
The compatibilized 1.4.10:87:03 composite achieved a similar average (NRC = 0.23), but exhibited enhanced absorption at higher frequencies (2000 Hz), suggesting that maleic anhydride promotes better filler dispersion, improving the dissipation of short-wavelength acoustic waves. The 1.4.20:77:03 composite demonstrated the best overall NRC (0.27), with increased absorption at both 250 Hz and 500 Hz, confirming that proper compatibilization improved matrix–filler interactions and internal friction. In contrast, the 1.4.30:67:03 composite showed lower NRC (0.21), likely due to excessive stiffness and reduced vibrational damping. The slag-based composite (E.20:77:03) displayed an NRC comparable to neat HDPE (0.20), reinforcing that alkali activation is crucial to convert raw slag into an acoustically functional geopolymer filler. Overall, the 1.4.20:77:03 composite emerges as the most promising formulation for aerospace noise reduction applications, particularly in the low-to-mid frequency range (250–500 Hz), where cabin comfort and structural damping are most critical.
3.6 Overall discussion The combined results demonstrate that geopolymer incorporation not only enhanced the thermal and acoustic Polímeros, 36(3), e20260033, 2026
2000.00 0.19 0.24 0.28 0.28 0.22 0.19
NRC 0.20 0.23 0.23 0.27 0.21 0.20
performance but also improved the mechanical rigidity and thermal stability of HDPE. The MA/DCP compatibilization was essential to achieve homogeneous filler dispersion and efficient load transfer. The improved performance is explained by a hierarchical structure combining the ductile polymer matrix and rigid, thermally stable geopolymer particles. Such morphology creates multiple scattering interfaces, contributing to lower phonon propagation and higher acoustic damping. Overall, the developed composites meet the dual requirements of lightweight and multifunctionality, confirming the relevance of ladle furnace slag-derived geopolymers as sustainable fillers for high-performance polymeric insulation materials.
4. Conclusions This study successfully demonstrates the feasibility of using alkali-activated ladle slag as a functional filler in HDPE matrices. The incorporation of alkali-activated geopolymer fillers significantly enhanced the multifunctional performance of HDPE composites. The compatibilized system containing 20 wt% geopolymer and 3 wt% MA (1.4.20:77:03) presented the most balanced set of properties, combining superior 7/10
Santos, E. M., Weber, R. P., Ramos, F. J. H. T. V., & Marques, M. F. V. thermal stability, mechanical rigidity, and acoustic insulation while maintaining a low density desirable for aerospace and structural applications. Thermal analysis confirmed the formation of thermally stable calcium–aluminosilicate phases, which delayed degradation and increased residual mass at high temperatures. Morphological observations demonstrated effective filler dispersion and interfacial adhesion promoted by MA/DCP compatibilization, resulting in reduced interfacial voids and improved load transfer. Acoustic and thermal diffusivity tests revealed a synergistic behavior: as the inorganic phase increased internal scattering and porosity, heat conduction decreased while sound absorption improved, validating the dual-insulation functionality of the composites. Among all formulations, the 1.4.20:77:03 composite exhibited the best overall Noise Reduction Coefficient (NRC = 0.27), confirming its suitability for low- and mid-frequency noise attenuation in aeronautical environments. In summary, these results highlight the technological potential of ladle furnace slag–derived geopolymers as sustainable, high-performance fillers, enabling the development of lightweight polymeric composites with combined mechanical robustness, thermal protection, and acoustic damping capabilities. This strategy offers a sustainable pathway for valorizing metallurgical residues while advancing next-generation multifunctional materials for aerospace and construction sectors.
5. Author’s Contribution • Conceptualization – Eliziane Medeiros Santos; Ricardo Pondé Weber; Flávio James Humberto Tommasini Vieira Ramos; Maria de Fátima Vieira Marques. • Data curation – NA. • Formal analysis – Eliziane Medeiros Santos; Flávio James Humberto Tommasini Vieira Ramos. • Funding acquisition – Ricardo Pondé Weber; Maria de Fátima Vieira Marques. • Investigation – Eliziane Medeiros Santos; Flávio James Humberto Tommasini Vieira Ramos. • Methodology – Eliziane Medeiros Santos; Flávio James Humberto Tommasini Vieira Ramos; Maria de Fátima Vieira Marques. • Project administration – Ricardo Pondé Weber; Maria de Fátima Vieira Marques. • Resources – Ricardo Pondé Weber; Flávio James Humberto Tommasini Vieira Ramos; Maria de Fátima Vieira Marques. • Software – NA. • Supervision – Ricardo Pondé Weber; Flávio James Humberto Tommasini Vieira Ramos; Maria de Fátima Vieira Marques. • Validation – Eliziane Medeiros Santos; Ricardo Pondé Weber; Flávio James Humberto Tommasini Vieira Ramos; Maria de Fátima Vieira Marques. • Visualization – Eliziane Medeiros Santos; Ricardo Pondé Weber; Flávio James Humberto Tommasini Vieira Ramos; Maria de Fátima Vieira Marques. 8/10
• Writing – original draft – Eliziane Medeiros Santos. • Writing – review & editing – Ricardo Pondé Weber; Flávio James Humberto Tommasini Vieira Ramos; Maria de Fátima Vieira Marques.
6. Acknowledgements The authors thank CNPq for funding and acknowledge the support of IMA, the Navy Research Institute, the Acoustics and Vibrations Laboratory (UFRJ), and the Army Technological Center (CETx) for their contributions to the experimental work.
7. References 1. El Alouani, M., Saufi, H., Moutaoukil, G., Alehyen, S., Nematollahi, B., Belmaghraoui, W., & Taibi, M. (2021). Application of geopolymers for treatment of water contaminated with organic and inorganic pollutants: state-of-the-art review. Journal of Environmental Chemical Engineering, 9(2), 105095. https://doi.org/10.1016/j.jece.2021.105095. 2. Muraleedharan, M., & Nadir, Y. (2021). Factors affecting the mechanical properties and microstructure of geopolymers from red mud and granite waste powder: A review. Ceramics International, 47(10), 13257-13279. https://doi.org/10.1016/j. ceramint.2021.02.009. 3. Paul, D., Suresh, M., & Pal, M. (2021). Utilization of fly ash and glass powder as fillers in steel slag asphalt mixtures. Case Studies in Construction Materials, 15, e00672. https:// doi.org/10.1016/j.cscm.2021.e00672. 4. Lin, W. Y., Prabhakar, A. K., Mohan, B. C., & Wang, C.-H. (2020). A factorial experimental analysis of using wood fly ash as an alkaline activator along with coal fly ash for production of geopolymer-cementitious hybrids. The Science of the Total Environment, 718, 135289. https://doi.org/10.1016/j. scitotenv.2019.135289. PMid:31839313. 5. Hui-Teng, N., Cheng-Yong, H., Yun-Ming, L., Abdullah, M. M. A. B., Ern Hun, K., Razi, H. M., & Yong-Sing, N. (2021). Formulation, mechanical properties and phase analysis of fly ash geopolymer with ladle furnace slag replacement. Journal of Materials Research and Technology, 12, 1212-1226. https:// doi.org/10.1016/j.jmrt.2021.03.065. 6. Koriem, A., Ollick, A. M., & Elhadary, M. (2021). The effect of artificial weathering and hardening on mechanical properties of HDPE with and without UV stabilizers. Alexandria Engineering Journal, 60(4), 4167-4175. https://doi.org/10.1016/j. aej.2021.03.024. 7. Shahin, A., Barsoum, I., & Korkees, F. (2021). Analysis of a HDPE flanged connection with a time and temperature dependent constitutive behavior. International Journal of Pressure Vessels and Piping, 191, 104375. https://doi.org/10.1016/j. ijpvp.2021.104375. 8. Wang, H., Yang, D., Xiong, W., Liu, W., & Qiu, X. (2021). One-pot preparation of hydrophobic lignin/SiO2 nanoparticles and its reinforcing effect on HDPE. International Journal of Biological Macromolecules, 180, 523-532. https://doi. org/10.1016/j.ijbiomac.2021.03.091. PMid:33745976. 9. Nguyen, K. Q., Mwiseneza, C., Mohamed, K., Cousin, P., Robert, M., & Benmokrane, B. (2021). Long-term testing methods for HDPE pipe – advantages and disadvantages: A review. Engineering Fracture Mechanics, 246, 107629. https:// doi.org/10.1016/j.engfracmech.2021.107629. 10. Khouaja, A., Koubaa, A., & Ben Daly, H. (2021). Dielectric properties and thermal stability of cellulose high-density polyethylene bio-based composites. Industrial Crops Polímeros, 36(3), e20260033, 2026
HDPE/geopolymer composites with improved thermal and acoustic insulation for aerospace applications and Products, 171, 113928. https://doi.org/10.1016/j. indcrop.2021.113928. 11. Sadik, W. A., El-Demerdash, A.-G. M., Abokhateeb, A. E. A., & Elessawy, N. A. (2021). Innovative high-density polyethylene/ waste glass powder composite with remarkable mechanical, thermal and recyclable properties for technical applications. Heliyon, 7(4), e06627. https://doi.org/10.1016/j.heliyon.2021. e06627. PMid:33889767. 12. Dubiella, K., & Vicentini, D. (2018). Estudo de laminados de materiais compósitos no transporte aéreo. In 1º Simpósio de Transportes do Paraná / 2º Seminário em Aeroportos e Transporte Aéreo / 2º Urbanidade (pp. 31-40). Curitiba, PR: UFPR. https://doi.org/10.5380/1stpr2018.artcomp03p31-40. 13. Callister, W. D., & Rethwisch, D. G. (2018). Materials science and engineering: an introduction (10th ed.). Milton: Wiley. 14. Miao, J., Shen, Y., Tao, J., Zeng, X., Liu, S., & Wang, Z. (2023). Design and spraying-preparation of the gradient coatings with various diameters and contents of SiO2 nano-particles for the enhanced anti-impact and thermal insulation performance. Progress in Organic Coatings, 179, 107491. https://doi. org/10.1016/j.porgcoat.2023.107491. 15. Chauhan, S., & Bhushan, R. K. (2017). Study of polymer matrix composite with natural particulate/fiber in PMC: a review. International Journal of Advance Research. Ideas and Innovations in Technology, 3(3), 1168-1179. Retrieved in 2025, August 10, from https://www.ijariit.com/manuscript/studyof-polymer-matrix-composite-with-natural-particulatefiberin-pmc-a-review 16. Sekkal, W., & Zaoui, A. (2023). Thermal and acoustic insulation properties in nanoporous geopolymer nanocomposite. Cement and Concrete Composites, 138, 104955. https://doi.org/10.1016/j. cemconcomp.2023.104955. 17. Aly, N. M., Seddeq, H. S., Elnagar, K., & Hamouda, T. (2021). Acoustic and thermal performance of sustainable fiber reinforced thermoplastic composite panels for insulation in buildings. Journal of Building Engineering, 40, 102747. https:// doi.org/10.1016/j.jobe.2021.102747. 18. Dönmez Çavdar, A., Tomak, E. D., Boran Torun, S., & Arpaci, S. S. (2021). Accelerated weathering resistance of high-density polyethylene composites reinforced with microcrystalline cellulose and fire retardants. Journal of Building Engineering, 39, 102282. https://doi.org/10.1016/j. jobe.2021.102282. 19. Gupta, K. K., Chandra, H., Sagar, K., Sharma, K. K., & Devi, D. (2023). Degradation of high density polyethylene (HDPE) through bacterial strain from cow faeces. Biocatalysis and Agricultural Biotechnology, 48, 102646. https://doi.org/10.1016/j. bcab.2023.102646. 20. Salleh, M. N., Aziz, R. A., Shan, C. R., Musa, L., Razak, M. F. S. A., Nabiałek, M., & Jeż, B. (2022). Comparison between the tensile, water absorption and flammability properties of recycled high-density polyethylene/rice husk composite from twin-screw extruder and heated two-roll mill. Archives of Metallurgy and Materials, 67(2), 661-668. https://doi. org/10.24425/amm.2022.137803. 21. Lazorenko, G., Kasprzhitskii, A., Yavna, V., Mischinenko, V., Kukharskii, A., Kruglikov, A., Kolodina, A., & Yalovega, G. (2020). Effect of pre-treatment of flax tows on mechanical properties and microstructure of natural fiber reinforced geopolymer composites. Environmental Technology & Innovation, 20, 101105. https://doi.org/10.1016/j.eti.2020.101105. 22. Wang, C., Jin, Z., Liu, G., Dong, W., Pang, B., & Ding, X. (2023). Mechanisms of chloride transport in low carbon marine concrete: an alkali-activated slag system with high limestone powder. Journal of Building Engineering, 72, 106539. https:// doi.org/10.1016/j.jobe.2023.106539. Polímeros, 36(3), e20260033, 2026
23. Bai, T., Song, Z.-G., Wu, Y.-G., Hu, X.-D., & Bai, H. (2018). Influence of steel slag on the mechanical properties and curing time of metakaolin geopolymer. Ceramics International, 44(13), 15706-15713. https://doi.org/10.1016/j. ceramint.2018.05.243. 24. Akarken, G., & Cengiz, U. (2023). Fabrication and characterization of metakaolin-based fiber reinforced fire resistant geopolymer. Applied Clay Science, 232, 106786. https://doi.org/10.1016/j. clay.2022.106786. 25. Giannopoulou, I., Robert, P. M., Sakkas, K.-M., Petrou, M. F., & Nicolaides, D. (2023). High temperature performance of geopolymers based on construction and demolition waste. Journal of Building Engineering, 72, 106575. https://doi. org/10.1016/j.jobe.2023.106575. 26. Vahidi, G., Bajwa, D. S., Shojaeiarani, J., & Stark, N. M. (2022). Experimental investigation into the direct feeding of coupling agent, cellulose nanocrystals, and nano zinc oxide in high-density polyethylene. Composites Part C: Open Access, 8, 100287. https://doi.org/10.1016/j. jcomc.2022.100287. 27. Donmez Cavdar, A., Kalaycioglu, H., & Mengeloğlu, F. (2016). Technological properties of thermoplastic composites filled with fire retardant and tea mill waste fiber. Journal of Composite Materials, 50(12), 1627-1634. https://doi. org/10.1177/0021998315595113. 28. Sarfraz, M. (2016). Upgrading electrical, mechanical, and chemical properties of CNTs/Polybond® nanocomposites: pursuit of electroconductive structural polymer nanocomplexes. International Journal of Polymer Science, 2016(1), 2396817. https://doi.org/10.1155/2016/2396817. 29. Xu, B., & Yi, Y. (2022). Treatment of ladle furnace slag by carbonation: carbon dioxide sequestration, heavy metal immobilization, and strength enhancement. Chemosphere, 287(Pt 3), 132274. https://doi.org/10.1016/j.chemosphere.2021.132274. PMid:34562709. 30. Rashad, A. M., Khafaga, S. A., & Gharieb, M. (2021). Valorization of fly ash as an additive for electric arc furnace slag geopolymer cement. Construction & Building Materials, 294, 123570. https://doi.org/10.1016/j.conbuildmat.2021.123570. 31. Cong, P., & Mei, L. (2021). Using silica fume for improvement of fly ash/slag based geopolymer activated with calcium carbide residue and gypsum. Construction & Building Materials, 275, 122171. https://doi.org/10.1016/j. conbuildmat.2020.122171. 32. Joseph, M., Anugop, B., Vijesh, K. R., Balan, V., Nampoori, V. P. N., & Kailasnath, M. (2022). Morphology and concentrationdependent thermal diffusivity of biofunctionalized zinc oxide nanostructures using dual-beam thermal lens technique. Materials Letters, 323, 132599. https://doi.org/10.1016/j. matlet.2022.132599. 33. Atef, M., Bassioni, G., Azab, N., & Hazem Abdellatif, M. (2022). On the acoustical performance of eco-friendly cementitious composite with recycled fine rubber particles. Construction & Building Materials, 325, 126830. https://doi.org/10.1016/j. conbuildmat.2022.126830. 34. Lima, J. E. S., Assumpção, T. A. A., Azeredo, E. A., & Macedo, T. L. (2017). Estudo preliminar de reforço de material polimérico por meio de fibras de carbono. Revista Caleidoscópio, 9(1), 23-29. Retrieved in 2025, August 10, from https://ojs.eniac. com.br/index.php/Anais/article/view/451/542 35. Coates, J. (2000). Interpretation of infrared spectra: a practical approach. In R. A. Meyers (Ed.), Encyclopedia of Analytical Chemistry (pp. 10815-10837). Chichester: Wiley. https://doi. org/10.1002/9780470027318.a5606. 36. Stuart, B. (2021). Infrared spectroscopy: Fundamentals and applications (2nd ed.). Chichester: Wiley. 9/10
Santos, E. M., Weber, R. P., Ramos, F. J. H. T. V., & Marques, M. F. V. 37. American Society for Testing and Materials – ASTM (2022). ASTM E1461-22: standard test method for thermal diffusivity by the flash method. West Conshohocken: ASTM.
39. American Society for Testing and Materials – ASTM (2022). ASTM C423-22: standard test method for sound absorption and sound absorption coefficients by the reverberation room method. West Conshohocken: ASTM.
38. American Society for Testing and Materials – ASTM (2022). ASTM E1050-22: standard test method for impedance and absorption of acoustical materials using a tube, two microphones, and a digital frequency analysis system. West Conshohocken: ASTM.
Associate Editor: José A. C. G. Covas
10/10
Polímeros, 36(3), e20260033, 2026
Received: Aug. 10, 2025 Revised: Oct. 22, 2025 Accepted: Jun. 04, 2026
ISSN 1678-5169 (Online)
https://doi.org/10.1590/0104-1428.20260025
Injection overmolded polyamide 6 - Eucalyptus joints Giovana Zanetini Zanchetta1 , Gean Henrique Marcatto de Oliveira2 , Matheus Furlan1 , Vinicius Fiocco Sciuti1 , Rodrigo Bresciani Canto1 , Sergio de Traglia Amancio-Filho2 and Leonardo Bresciani Canto1* Programa de Pós-graduação em Ciência e Engenharia de Materiais – PPGCEM, Universidade Federal de São Carlos – UFSCar, São Carlos, SP, Brasil 2 Institute of Materials Science, Joining and Forming – Professorship “Aviation Materials and Manufacturing Techniques”, Graz University of Technology, Graz, Austria
1
*leonardo@ufscar.br
Abstract The development of polymer−wood joints addresses the growing demand for lightweight and environmentally sustainable structures. This study reports the development of joints combining polyamide 6 and Eucalyptus grandis, produced via direct-adhesion injection overmolding. Scanning electron microscopy (SEM) and X-ray microtomography analyses revealed a well-defined interface, with PA6 penetrating open wood vessels and forming protrusions (~50 µm) that promote mechanical interlocking. Mechanical testing showed good repeatability, with the joints reaching shear strength values up to 8.1 ± 0.6 MPa, which are comparable to those reported in the literature for polymer–wood overlap joints. Digital image correlation (DIC), coupled with mechanical tests, further indicated a more uniform strain distribution along the interface for the single-chamfer geometry, suggesting more efficient stress transfer during mechanical overloading. Keywords: direct-adhesion, hybrid joint, injection overmolding, wood. Data Availability: All data supporting the findings of this study are included in this article. How to cite: Zanchetta, G. Z., Oliveira, G. H. M., Furlan, M., Sciuti, V. F., Canto, R. B., Amancio-Filho, S. T., & Canto, L. B. (2026). Injection overmolded polyamide 6 - Eucalyptus joints. Polímeros: Ciência e Tecnologia, 36(3), e20260034. https://doi.org/10.1590/0104-1428.20260025
1. Introduction Hybrid structures combining polymers with other materials enable the synergistic integration of their most advantageous properties, fostering the design of advanced structural components. For instance, polymer–metal joints can combine the low density, chemical resistance, and shape flexibility of polymers with the high stiffness and strength of metals[1]. Meanwhile, the growing demand for sustainable materials has intensified research into renewable alternatives aimed at reducing environmental impact. Among renewable materials, natural wood has attracted interest due to its high strength-to-weight ratio, comparable to those of steel and aluminum alloys, in addition to its thermal and electrical insulation, good machinability, favorable acoustic properties, aesthetic appeal, abundance, and low cost. Furthermore, in addition to its ability to sequester CO2, wood production requires relatively low energy input and results in lower environmental impacts than polymers and metals[2-4]. Proper integration of wood with polymers in hybrid structures offers a promising strategy to combine the low density, renewability, and favorable mechanical performance of wood with the durability, processability, and design flexibility of polymers, thereby reducing environmental impact while maintaining functional performance. Such hybrid structures are particularly attractive for automotive applications[5], including
Polímeros, 36(3), e20260034, 2026
interior components and selected structural elements, where lightweight and sustainability are key requirements. Injection overmolding stands out as an efficient and industrially viable technique for producing polymer-based structures, as it enables polymer shaping and joining to the substrate in a single, fast, precise, and automated step[6-8]. This process allows precise control of parameters known to affect interfacial adhesion, such as polymer viscosity, pressure, and contact time[6,7]. Moreover, the organic chemical composition and naturally porous morphology of wood favor direct adhesion with polymers, eliminating the need for adhesives or additional interlayers. Since the wood substrate is exposed to relatively low temperatures and short residence times during injection overmolding, thermal degradation is avoided, allowing joining with engineering and specialty polymers beyond polyolefins. A recent study demonstrated the feasibility of producing mechanically robust polymer–wood joints by direct-adhesion injection overmolding. Stadlmann et al.[9] evaluated the lap-shear strength of polypropylene (PP)- and polyamide 6 (PA6)-based joints with birch (Betula pendula Roth.) and beech (Fagus sylvatica L.) hardwoods. Using SEM, the authors demonstrated that interfacial adhesion is governed by polymer penetration into surface wood vessels and fibers,
1/9
O O O O O O O O O O O O O O O O
Zanchetta, G. Z., Oliveira, G. H. M., Furlan, M., Sciuti, V. F., Canto, R. B., Amancio-Filho, S. T., & Canto, L. B. with penetration depths of approximately 100-200 µm. PA6 joints exhibited significantly higher shear strength than PP joints (approximately 6 MPa versus 2 MPa), with no statistically significant differences observed between the two wood species. This behavior was attributed to the higher polarity of PA6, which promotes stronger interfacial interactions and more effective bonding with the wood surface. Among the various wood species available for hybrid structures, Eucalyptus grandis is particularly attractive due to its wide availability from fast-growing plantations. This species presents a favorable combination of relatively high mechanical strength and low density, which is desirable for lightweight applications. In addition, its porous anatomical structure, characterized by the presence of vessels and fibers with relatively large lumens[10], may facilitate polymer penetration and mechanical interlocking during injection overmolding. In this study, joints composed of polyamide 6 and Eucalyptus grandis wood were developed by direct-adhesion injection overmolding. Two novel scarf-joint geometries with single- and double-chamfer configurations were designed and evaluated. The deformation behavior was investigated by mechanical testing coupled with digital image correlation (DIC), while the joining mechanisms were analyzed using scanning electron microscopy (SEM) and X-ray microtomography.
Eucalyptus grandis wood was obtained in the form of 1-inch-thick boards, which were dried at room temperature until reaching moisture equilibrium. The boards were then cut using a circular saw into bars with dimensions of 91 × 12.8 × 3.2 mm3 (length × width × thickness), taking into account the anisotropy and morphology of the wood and maintaining the longitudinal fiber orientation. Subsequently, chamfers were machined at one end of the bars using a circular saw in single (straight) and double (V-shaped) configurations, both with 45° angles.
2.2 Injection overmolding PA6−Eucalyptus joints with single- and double-chamfer scarf configurations (Figure 1) were employed. The geometry and dimensions of the joint specimens were adapted from ASTM D638 Type I tensile specimens, enabling the use of standard injection-molding cavities commonly available in research and development laboratories. The 45° scarf chamfers impose a combination of tensile and shear stresses at the interface when the joints are subjected to uniaxial tensile loading.
2. Materials and Methods
The joints were produced using a Battenfeld Plus 35/75 injection molding machine. The machine was operated in semi-automatic mode, where the wood piece was manually placed in the mold cavity before initiating the injection molding cycle. The injection molding parameters were set as follows: barrel temperature profile of 220/230/240 °C, injection speed of 21 cm3 s-1, holding pressure of 160 bar, holding time of 9 s, mold temperature of 30 °C, and cooling time of 40 s.
2.1 Materials
2.3 Mechanical testing
Polyamide 6 (PA6) is a medium-viscosity grade (Ultramid® C 200) supplied by BASF, with a density of 1.14 g cm-3 (ISO 1183), and is designed for injection molding. The PA6 pellets were dried in a vacuum oven at 60 °C for 12 h. This material was chosen because it is an engineering thermoplastic widely used as a matrix in polymer composites for structural and engineering applications.
The mechanical tests were carried out following a procedure adapted from ASTM D638, using an Instron 5569 universal testing machine. The distance between grips was set to 115 mm, and the tests were performed at a crosshead speed of 1 mm min-1. The specimens were conditioned in a desiccator for 48 h prior to the tests, which were conducted at 23 °C and 50% relative humidity. Five specimens were tested to determine the values of ultimate force and displacement.
Figure 1. Photographs of PA6–Eucalyptus scarf joints with single- and double- chamfer configurations. The geometry and dimensions of the joint specimens were adapted from ASTM D638 Type I tensile specimens. The thickness of the specimens is 3.2 mm. 2/9
Polímeros, 36(3), e20260034, 2026
Injection overmolded polyamide 6 - Eucalyptus joints 2.4 Scanning electron microscopy The mid-thickness of the joints were examined by scanning electron microscopy (SEM) using an FEI Inspect S50 microscope operated at an accelerating voltage of 5 kV and equipped with a secondary electron (SE) detector. The joints were sectioned at a distance of approximately 5 mm from the interface, cold-mounted in epoxy resin with a curing time of 24 h, and sequentially ground using P120, P240, P600, and P1200 grit sandpapers until reaching half of the specimen thickness, followed by polishing with a synthetic felt cloth. Finally, the samples were gold-coated, electrically grounded using silver paint, and analyzed. The fracture surfaces of the joints after mechanical testing were also analyzed by SEM using the same FEI Inspect S50 instrument operated at an accelerating voltage of 5 kV. The specimens were mounted on aluminum stubs and subsequently gold-coated and electrically grounded with silver paint prior to examination.
The joints were spray-coated with white paint and subsequently speckled with black spray paint to generate a random speckle pattern, enabling full-field displacement tracking throughout the test. For image acquisition, after applying a 10 N preload, 20 initial images were recorded to define the reference configuration, i.e., to evaluate the measurement uncertainty associated with the experimental setup, followed by the acquisition of one image every 2 s during the mechanical test. The speckle images were analyzed using Correli 3.0 software[11] to compute the fullfield displacement and strain maps developed during the mechanical test. A mesh composed of linear triangular finite elements (T3) was adopted, with an average characteristic element size of 100 px (≈ 3 mm). Virtual strain gauges with dimensions of 10 × 10 mm2 were defined on each joint component, corresponding to a region containing approximately 25 elements (highlighted in green in Figure 2).
2.5 Microtomography Micro-computed tomography (µCT) imaging was performed using a Werth TomoScope XS 160 system. The sample was sectioned approximately 5 mm from the interface and secured onto polystyrene foam supports. Acquisition parameters included a tube voltage of 80 kV, a current of 360 µA, and an exposure time of 1/3 s. A rotation step angle of 0.15° was used with a voxel size of 8.7 µm. Additionally, a 0.5 mm copper filter was employed to reduce beam hardening artifacts. Dragonfly software was utilized to process 2-D images obtained from µCT scans, generating 3-D volumetric reconstructions.
2.6 Mechanical testing with digital image correlation Digital image correlation (DIC) was coupled with the mechanical tests to compute the strain fields of the PA6−Eucalyptus joints. The mechanical tests were performed using an MTS Exceed E44.304 universal testing machine equipped with a 30 kN maximum capacity load cell, screw-tightened clamping grips, and universal joints. The tests were carried-out at a crosshead speed of 1 mm min-1. All mechanical tests were conducted in a climate-controlled room at a temperature of 23 ± 2 °C and a relative humidity of 50 ± 5%. The DIC hardware parameters are summarized in Table 1. Two cameras were positioned on opposite sides to simultaneously capture the front and back surfaces of the joint. Four cold white LED lamps were positioned diagonally at each side to ensure homogeneous illumination.
Table 1. DIC hardware parameters. Camera Lens Gray level amplitude Color filter Aperture Stand-off distance Shutter speed ISO Resolution
Canon EOS 5DS Canon EF 180 mm f/3.5L Macro USM 14 bits Bayer f/7.1 750 mm 1/30s 100 2920 × 4363 px
Polímeros, 36(3), e20260034, 2026
Figure 2. Schematic illustration of the specimens with single (left) and double (right) chamfer configurations and the digital image correlation (DIC) setup used for data analysis, showing the triangular finite-element mesh (T3) with an average characteristic element size of 100 px (≈ 3 mm), the positioning of virtual strain gauges (10 × 10 mm2) on each joint component, and the virtual longitudinal extensometer with a gauge length of 115 mm used to monitor the overall joint displacement. 3/9
Zanchetta, G. Z., Oliveira, G. H. M., Furlan, M., Sciuti, V. F., Canto, R. B., Amancio-Filho, S. T., & Canto, L. B. Within these regions, the strain components obtained from the DIC analysis were extracted, namely the longitudinal strain (ε y ), transverse strain (ε x ), and shear strain (ε xy ). The strain values reported for each virtual gauge correspond to the average of these components over the elements contained in the selected region, which reduces local measurement noise and provides a more robust estimate of the strain state. In addition, a virtual longitudinal extensometer with a gauge length of 115 mm (highlighted in blue in Figure 2) was defined to monitor the overall deformation of the joint. The elongation of the specimen was calculated from the difference in the longitudinal displacement component of the nodes located at the extremities of the gauge length. This procedure allows the global longitudinal strain of the specimen to be obtained directly from the displacement field. Beyond the measurements obtained from the virtual strain gauges and the virtual extensometer, the strain field over the entire joint was also analyzed. Spatial maps of an equivalent scalar strain measure (ε eq ) were evaluated to characterize the deformation distribution within the specimen, particularly along the joint interface. The equivalent strain was computed from the in-plane strain components obtained from the DIC analysis. As a simplified assumption, a planestrain state (= ε z ε= xz ε= yz 0) was adopted, resulting in Equation 1[12,13]:
2 3
2 ε eq = ⋅ ε x2 + ε y2 − ε xε y + 3ε xy
(1)
This scalar quantity provides a convenient measure of the local strain intensity and is used in the following sections to visualize the spatial distribution of strain concentration in the joint specimens.
3. Results and Discussion 3.1 Polymer-wood interface The mid-thickness SEM images of PA6−Eucalyptus scarf joints with single- and double-chamfer configurations are shown in Figure 3. The presented micrographs are representative of the features observed along the entire joint interface. For both joint configurations, well-defined interfaces are observed (Figure 3a and 3c), suggesting good wetting of the wood surface by molten PA6 during the injection overmolding process. Similar behavior was reported by Stadlmann et al.[9] for PA6–hardwood lap joints produced by injection overmolding, attributed to the low viscosity and polar nature of PA6, which promote effective wetting of wood constituents containing hydroxyl groups. SEM analysis further reveals penetration of PA6 into the wood substrate, indicated by the green arrows in Figure 3, images b and d. This feature is randomly distributed along the joint interface and exhibits characteristic dimensions on the order of 50 µm. The good wettability of PA6 on the eucalyptus cross-section promotes polymer spreading and penetration into the open lumens and surface irregularities of the wood during injection molding, favoring mechanical
Figure 3. Mid thickness SEM images of PA6–Eucalyptus scarf joints with single- (a,b) and double- (c,d) chamfer configurations. The polymer is located at the top and the wood at the bottom. The sample was rotated 45o to position the polymer-wood interface in the horizontal direction. 4/9
Polímeros, 36(3), e20260034, 2026
Injection overmolded polyamide 6 - Eucalyptus joints interlocking and interfacial interactions, such as hydrogen bonding, due to the hydrophilic nature of both components[14]. The porous and anisotropic cellular structure of the wood is also evident, with vessels predominantly oriented along the fiber direction and diameters ranging from 10 to 50 µm. SEM observations of the chamfered wood surface prior to joining (Figure 4) indicate that the circular saw machining partially collapsed vessels near the surface. This feature is also visible in the SEM images of the transverse cross-sections of the joints, extending over a layer of approximately 100 µm below the interface (Figure 3, images a and c). Nevertheless, some open vessels remain exposed, with diameters comparable to the polymer protrusions observed in the joints (Figure 3, images b and d), suggesting that these features act as mechanical sites for polymer penetration during injection overmolding. The X-ray microtomography image in Figure 5 reveals the penetration of the polymer into an open wood vessel, indicated by the green arrows. The image also allows the identification of the interface between the polymer and the wood, as well as the collapse of wood vessels in a layer located below the interface, as previously discussed. The analysis indicates a polymer penetration depth of approximately 50 µm, a value consistent with that observed in the SEM images presented in Figures 3 and 4.
3.2 Polymer-wood mechanical behavior The statistical distribution of the ultimate force and displacement for the PA6–Eucalyptus scarf joints with single- and double-chamfer configurations is presented in the box plots shown in Figure 6. For both joint configurations, the box plots exhibit narrow interquartile ranges and short whiskers, with mean and median values in close agreement, indicating low data dispersion, limited skewness, and high repeatability among the tested specimens. This aspect is particularly relevant for the hybrid system investigated, as local variations in wettability, polymer penetration into
Figure 4. SEM images of the chamfered surface of the wood substrate prior to joining with polymer. Polímeros, 36(3), e20260034, 2026
wood vessels, and differential shrinkage can significantly influence mechanical performance. The joint shear strength was approximately estimated assuming a uniform shear stress distribution on the 45° chamfer plane, given by τ o = F / 2 A, where F is the ultimate force 45 recorded during testing and A is the nominal cross-sectional area of the specimen. Accordingly, the average shear strength of the PA6–Eucalyptus scarf joints was 8.1 ± 0.6 MPa and 7.3 ± 1.0 MPa for the single- and double-chamfer configurations, respectively, values comparable to those reported in the literature for overlap polymer–wood joints, such as PA6–birch (5.7 ± 1.1 MPa) and PA6–beech (6.4 ± 1.5 MPa) produced by injection overmolding[9], PA6-15CF–beech (7.5 ± 1.2 MPa) manufactured by fused filament fabrication[15], and PA6-15CF–oak (9.2 ± 0.7 MPa) joined by ultrasonic joining[16]. It should be noted that, unlike overlap joints which experience significant load eccentricity and secondary bending[17], the interface of the scarf polymer−wood joints investigated here are predominantly subjected to in-plane shear with superimposed normal stresses due to the chamfered interface.
3.3 Fractography Figure 7 shows photographs of PA6–Eucalyptus scarf joints with single- (a) and double- (b) chamfer configurations after mechanical testing. The single-chamfer joints exhibited two distinct macroscopic failure modes. Three specimens showed mixed failure characterized by partial delamination and fracture on the PA6 side, whereas the remaining two specimens failed by interfacial delamination. In contrast, all five specimens of the double-chamfer configuration exhibited mixed failure, also characterized by partial delamination and fracture on the PA6 side.
Figure 5. Microtomography image showing the filling of a wood vessel by the polymer. The polymer is located in the upper portion of the image, and the wood in the lower portion. The 45° chamfer angle was maintained, and the figure was not rotated. 5/9
Zanchetta, G. Z., Oliveira, G. H. M., Furlan, M., Sciuti, V. F., Canto, R. B., Amancio-Filho, S. T., & Canto, L. B.
Figure 6. Box plots of the ultimate force and displacement values obtained from the mechanical tests of PA6–Eucalyptus scarf joints in single- and double-chamfer configuration.
Figure 7. Photographs of PA6–Eucalyptus scarf joints with single- (a,b) and double- (c,d) chamfer configurations after mechanical testing.
Figure 8 shows representative SEM images of the delaminated fracture surfaces of PA6–Eucalyptus scarf joints. Protrusions (~50 µm) on the PA6 surface and corresponding cavities on the wood surface (labeled 1–6) indicate mechanical interlocking at the interface, while wood fragments adhered to the PA6 surface indicate localized cohesive failure within the wood substrate. Overall, these features indicate a mixed adhesive–cohesive fracture mode.
3.4 Digital image correlation Figure 9 presents the stress–strain curves obtained from mechanical tests coupled with DIC for the PA6–Eucalyptus scarf joints in the single- and double-chamfer configurations, with results shown separately for the joint as a whole, for the PA6 component, and for the wood component, corresponding to the two faces of the joint. The global response of the joint (measured by the virtual longitudinal extensometer) lies between the individual responses of the components (measured by the virtual strain gauges), exhibiting intermediate stiffness. This behavior highlights the mechanical coupling between wood and 6/9
polymer and the efficiency of stress transfer at the interface for both chamfer configurations. The stiffness of the wood is approximately one order of magnitude higher than that of the polymer. As expected for hybrid structures, the joint exhibits an intermediate effective stiffness governed by the elastic properties of the constituent materials, their geometric distribution, and the interfacial mechanical coupling. The curves corresponding to the two faces, for each component as well as for the joint as a whole, show a high degree of agreement. Minor differences observed in the wood curves can be attributed to its intrinsic heterogeneity, associated with anisotropy and the non-uniform distribution of vessels. The strong overlap of the curves indicates nearly symmetric mechanical behavior across the joint thickness, with no evidence of significant strain gradients, suggesting negligible secondary bending effects during testing. Figure 10 presents the normalized equivalent strains obtained by DIC on each face of the components of the PA6–Eucalyptus joints with single- and double-chamfer configurations, calculated from the last image acquired immediately prior to joint failure. The equivalent strains Polímeros, 36(3), e20260034, 2026
Injection overmolded polyamide 6 - Eucalyptus joints
Figure 8. SEM images of the delaminated fracture surfaces of the PA6–Eucalyptus joints after mechanical testing. The polymer side is shown on the left (a) and the wood side on the right (b).
Figure 9. Longitudinal stress–strain curves obtained from mechanical tests coupled with DIC for the PA6–Eucalyptus scarf joints in the single- and double-chamfer configurations.
shown in Figure 10 were parameterized by dividing the value of each element by the corresponding mean value of each joint component obtained from the virtual strain gauges (Figure 2). This procedure was adopted due to the significant difference in stiffness between the materials (Figure 9). This parameterized strain therefore constitutes a type of strain concentration factor, allowing a direct comparison of the relative strain distribution within each joint component and enabling the identification of regions of strain concentration or redistribution along the joint interface. For the single-chamfer configuration, equivalent strain fields exhibit a more gradual and relatively homogeneous distribution along the interface, in both the polymer component and the wood substrate. This behavior indicates a more progressive load transfer between the materials along the chamfer region. In contrast, the double-chamfer configuration shows a more pronounced concentration of equivalent strains in the region of the upper chamfer vertex. The strain maps reveal steeper gradients in this region, suggesting that load transfer occurs in a more localized manner. Additionally, the strain fields in the wood exhibit a more spatially confined distribution, reflecting its higher stiffness, whereas in the PA6 component the strains extend over a broader region above the interface. This behavior Polímeros, 36(3), e20260034, 2026
highlights the role of the polymer in accommodating the overall deformation of the joint and in redistributing the stresses transferred to the wood substrate.
4. Conclusions Joints composed of polyamide 6 and Eucalyptus grandis wood were successfully produced by direct-adhesion injection overmolding using single- and double-chamfer scarf geometries. SEM and X-ray microtomography analyses revealed a well-defined polymer–wood interface, with PA6 penetrating open wood vessels and forming protrusions (~50 µm) that promote mechanical interlocking. Mechanical tests showed low dispersion and shear strengths of 8.1 ± 0.6 MPa and 7.3 ± 1.0 MPa for the single- and double-chamfer configurations, respectively, comparable to values reported for other polymer–wood joints. Fractographic observations indicated a mixed adhesive–cohesive failure mode, involving polymer extraction from wood vessels and localized cohesive failure within the wood and the polymer. DIC revealed effective mechanical coupling between the components, with the joint exhibiting an intermediate effective stiffness between those of the constituent materials. Strain-field analysis indicated that the single-chamfer configuration 7/9
Zanchetta, G. Z., Oliveira, G. H. M., Furlan, M., Sciuti, V. F., Canto, R. B., Amancio-Filho, S. T., & Canto, L. B.
Figure 10. Normalized equivalent strains obtained by DIC on each face of the components of the PA6–Eucalyptus joints with single- and double-chamfer configurations.
promotes a more uniform strain distribution along the interface, whereas the double-chamfer geometry leads to more localized strain concentrations.
• Investigation – Giovana Zanetini Zanchetta; Gean Henrique Marcatto de Oliveira; Matheus Furlan; Rodrigo Bresciani Canto; Leonardo Bresciani Canto.
5. Author’s Contribution
• Methodology – Rodrigo Bresciani Canto; Leonardo Bresciani Canto.
• Conceptualization – Leonardo Bresciani Canto. • Data curation – Giovana Zanetini Zanchetta; Gean Henrique Marcatto de Oliveira; Matheus Furlan; Rodrigo Bresciani Canto; Leonardo Bresciani Canto. • Formal analysis – Giovana Zanetini Zanchetta; Gean Henrique Marcatto de Oliveira; Matheus Furlan; Vinicius Fiocco Sciuti; Rodrigo Bresciani Canto; Leonardo Bresciani Canto. • Funding acquisition – Leonardo Bresciani Canto. 8/9
• Project administration – Leonardo Bresciani Canto. • Resources – Giovana Zanetini Zanchetta; Gean Henrique Marcatto de Oliveira; Rodrigo Bresciani Canto; Leonardo Bresciani Canto. • Software – Matheus Furlan; Vinicius Fiocco Sciuti. • Supervision – Gean Henrique Marcatto de Oliveira; Leonardo Bresciani Canto. • Validation – Giovana Zanetini Zanchetta; Gean Henrique Marcatto de Oliveira; Rodrigo Bresciani Canto; Leonardo Bresciani Canto. Polímeros, 36(3), e20260034, 2026
Injection overmolded polyamide 6 - Eucalyptus joints • Visualization – Giovana Zanetini Zanchetta; Gean Henrique Marcatto de Oliveira; Rodrigo Bresciani Canto; Leonardo Bresciani Canto. • Writing – original draft – Giovana Zanetini Zanchetta; Gean Henrique Marcatto de Oliveira; Leonardo Bresciani Canto. • Writing – review & editing – Giovana Zanetini Zanchetta; Gean Henrique Marcatto de Oliveira; Matheus Furlan; Vinicius Fiocco Sciuti; Rodrigo Bresciani Canto; Sergio de Traglia Amancio Filho; Leonardo Bresciani Canto.
6. Acknowledgements This study was financed in part by the Coordenação de Aperfeiçoamento de Pessoal de Nível Superior - Brasil (CAPES) – Finance Code 001. This study was supported by CNPq – National Council for Scientific and Technological Development, Brazil (307914/2023-2, 443861/2024-2, 309266/2022-0). This research was supported by the Brazilian National Council for Scientific and Technological Development (CNPq) through the INCT Circularity in Polymer Materials (406925/2022-4). This study was financed, in part, by the São Paulo Research Foundation (FAPESP), Brasil, process number # 2024/08861-0.
7. References 1. Amancio-Filho, S. T., & Blaga, L. A. (Eds.). (2018). Joining of polymer-metal hybrid structures: principles and applications. Hoboken: John Wiley & Sons. https://doi.org/10.1002/9781119429807. 2. Ding, Y., Pang, Z., Lan, K., Yao, Y., Panzarasa, G., Xu, L., Lo Ricco, M., Rammer, D. R., Zhu, J. Y., Hu, M., Pan, X., Li, T., Burgert, I., & Hu, L. (2023). Emerging engineered wood for building applications. Chemical Reviews, 123(5), 1843-1888. https://doi.org/10.1021/acs.chemrev.2c00450. PMid:36260771. 3. Schubert, M., Panzarasa, G., & Burgert, I. (2023). Sustainability in wood products: a new perspective for handling natural diversity. Chemical Reviews, 123(5), 1889-1924. https://doi.org/10.1021/acs.chemrev.2c00360. PMid:36535040. 4. Asada, R., Cardellini, G., Mair-Bauernfeind, C., Wenger, J., Haas, V., Holzer, D., & Stern, T. (2020). Effective bioeconomy? a MRIO-based socioeconomic and environmental impact assessment of generic sectoral innovations. Technological Forecasting and Social Change, 153, 119946. https://doi.org/10.1016/j.techfore.2020.119946. 5. Kohl, D., Link, P., & Böhm, S. (2016). Wood as a technical material for structural vehicle components. Procedia CIRP, 40, 557-561. https://doi.org/10.1016/j.procir.2016.01.133. 6. Vasconcelos, R. L., Oliveira, G. H. M., Amancio-Filho, S. T., & Canto, L. B. (2023). Injection overmolding of polymer-metal
Polímeros, 36(3), e20260034, 2026
hybrid structures: a review. Polymer Engineering and Science, 63(3), 691-722. https://doi.org/10.1002/pen.26244. 7. Oliveira, G. H. M., Amancio-Filho, S. T., & Canto, L. B. (2024). Processing understanding, mechanical durability and hygrothermal stability of PC/AA6061 hybrid joints produced via injection overmolding. International Journal of Adhesion and Adhesives, 130, 103617. https://doi.org/10.1016/j.ijadhadh.2023.103617. 8. Adauto, R., Oliveira, G. H. M., Morozo, M. A., Fiori, M. A., & Canto, L. B. (2025). Direct-joining of a polylactide acid-hydroxyapatite biocomposite with a titanium alloy. Polímeros: Ciência e Tecnologia, 35(1), e20250009. https://doi.org/10.1590/0104-1428.20240095. 9. Stadlmann, A., Mautner, A., Pramreiter, M., Bismarck, A., & Müller, U. (2021). Interfacial adhesion and mechanical properties of wood-polymer hybrid composites prepared by injection molding. Polymers, 13(17), 2849. https://doi.org/10.3390/polym13172849. PMid:34502888. 10. Palermo, G. P. M., Latorraca, J. V. F., Carvalho, A. M., Calonego, F. W., & Severo, E. T. D. (2015). Anatomical properties of Eucalyptus grandis wood and transition age between juvenile and mature wood. Holz als Roh- und Werkstoff, 73(6), 775-780. https://doi.org/10.1007/s00107-015-0947-4. 11. Leclerc, H., Neggers, J., Mathieu, F., Roux, S., & Hild, F. (2015). Correli 3.0. Paris: Agence pour la Protection des Programmes. 12. Lubliner, J. (2008). Plasticity theory. Mineola: Dover Publications. 13. Mendelson, A. (1968). Plasticity: theory and application. New York: Macmillan. 14. Gardner, D. J., Blumentritt, M., Wang, L., & Yildirim, N. (2014). Adhesion theories in wood adhesive bonding: a critical review. Reviews of Adhesion and Adhesives, 2(2), 127-172. https://doi.org/10.7569/RAA.2014.097304. 15. Oliveira, G. H. M., Awan, A., Auer, P., Egger, P.-M., Canto, L. B., Domitner, J., & Amancio-Filho, S. T. (2026). Direct-joining of short carbon fiber-reinforced polyamide 6 composite with wood by additive manufacturing. Progress in Additive Manufacturing, 11(5), 4917-4931. https://doi.org/10.1007/s40964-026-01632-9. 16. Awan, A., Oliveira, G. H. M., Carvalho, W. S., Auer, P., Domitner, J., & Amancio-Filho, S. T. (2024). Ultrasonic joining of carbon-reinforced polyamide with oak wood for manufacturing sustainable hybrid structures. Manufacturing Letters, 42, 26-29. https://doi.org/10.1016/j.mfglet.2024.09.068. 17. Oliveira, G. H. M., Sciuti, V. F., Canto, R. B., Arneitz, S., Minkowitz, L., Amancio-Filho, S. T., & Canto, L. B. (2025). Additive manufacturing of surface structured metal parts for high strength lightweight injection overmolded polymer-metal hybrid joints. International Journal of Adhesion and Adhesives, 141, 104045. https://doi.org/10.1016/j.ijadhadh.2025.104045. Received: Apr. 03, 2026 Revised: May 20, 2026 Accepted: June 10, 2026 Editor-in-Chief: Sebastião V. Canevarolo
9/9
ISSN 1678-5169 (Online)
https://doi.org/10.1590/0104-1428.20260003
Characterization, gas transport properties, and degradability potential of poly(lactic acid) membranesa Fernando Silva Dal Magro1 , Wendel Paulo Silvestre2* , Luis Rafael Bonetto1 and Camila Baldasso1,2 Programa de Pós-graduação em Engenharia de Processos e Tecnologias – PGEPROTEC, Universidade de Caxias do Sul – UCS, Caxias do Sul, RS, Brasil 2 Curso de Engenharia Química, Universidade de Caxias do Sul – UCS, Caxias do Sul, RS, Brasil
1
*wpsilvestre@ucs.br This article was partially presented at the 18th Brazilian Polymer Congress, held in Campos do Jordão, SP, from October 19 to 23, 2025.
a
Abstract PLA membranes containing 8 wt.% and 12 wt.% PLA were synthesized and their morphological characteristics, gas transport properties, and potential for degradability were assessed. Morphological analyses revealed dense asymmetric structures with pores distributed on the surface and a porous sublayer without formation of macrovoids. The increase in polymer concentration promoted greater thickness of the dense layer and changes in pore distribution, directly influencing compaction behavior and gas transport. The 12 wt.% membranes showed a higher permeate flux and a lower compaction factor compared to 8 wt.%, demonstrating greater structural stability. FTIR spectra confirmed the preservation of the chemical structure of PLA and indicated solvent removal after phase inversion. Degradability tests demonstrated a significant mass loss in 12 days of exposure to soil, indicating potential for degradation. The results obtained demonstrate the viability of producing biodegradable PLA membranes with properties for future applications involving gas transport and sustainable membrane separation technologies. Keywords: biodegradability, biopolymers, membrane separation processes, green membrane, sustainability. Data availability: All data supporting the conclusions of this study are included in this article and its supplementary materials. How to cite: Dal Magro, F. S., Silvestre, W. P., Bonetto, L. R., & Baldasso, C. (2026). Characterization, gas transport properties, and degradability potential of poly(lactic acid) membranes. Polímeros: Ciência e Tecnologia, 36(3), e20260035. https://doi.org/10.1590/0104-1428.20260003
1. Introduction Emerging as an alternative to conventional separation processes, membrane separation processes (MSPs) have received significant attention in recent years due to their ability to remove contaminants from water and fluids in general. They can also be combined with other separation processes and generate less waste[1]. Currently, this technique has proven to be quite useful and safe in terms of its effectiveness in refining and finalizing simple and complex separations, such as wastewater treatment, for example[2]. With growing concern for environmental preservation and a focus on sustainable alternatives, as well as the consolidation and dissemination of Green Chemistry concepts, the search for separation membranes made from environmentally friendly materials has grown exponentially. Among the wide range of biodegradable polymers, some stand out for their balance between efficiency and sustainability in PSMs, such as cellulose acetate and poly(lactic acid) (PLA)[3].
Polímeros, 36(3), e20260035, 2026
PLA has shown promise in the synthesis of membranes for separation processes and is the subject of this work for obtaining membranes via a phase inversion process. In gas separation using membranes, the driving force of the process is the chemical potential gradient, since the membrane acts as a selective barrier that separates the gaseous phases. To evaluate the process performance, two parameters must be considered: permeance, which determines the flow of a specific component through the membrane, and selectivity, which is the membrane’s ability to allow the passage of one component at the expense of others[4,5]. PLA is a versatile thermoplastic polymer due to its mechanical properties and low toxicity[6]. In addition to its interesting physical properties, it is highly biodegradable and does not use petrochemical derivatives as raw material, as it is derived from lactic acid, typically obtained from biomass fermentation[7]. Despite the environmental advantages associated
1/14
O O O O O O O O O O O O O O O O
Dal Magro, F. S., Silvestre. W. P., Bonetto, L. R., & Baldasso, C. with PLA, such as biodegradability, renewable origin, and low toxicity, there are still important limitations related to its application in gas separation processes. Among the main challenges reported in the literature are limited thermal and mechanical stability, sensitivity to humidity, tendency to structural compaction under pressure, and difficulties in simultaneously achieving high values of permeability and gas selectivity. In many cases, the incorporation of additives, fibers, or nanoparticles becomes necessary to improve the structural performance and transport properties of PLA membranes, highlighting the need for further studies aimed at optimizing these materials[6,7]. Regarding membrane production, Xing et al.[8] used the phase inversion method to obtain PLLA and PLLA/PU membranes in different solvents to observe parameters such as crystallinity and porosity. When using ethanol (solvent) and water (non-solvent), as well as dioxane (solvent) and water (non-solvent), the membranes formed exhibited a uniform sponge-like structure and high crystallinity. With the use of ethanol (solvent) and water (non-solvent), an increase in the diffusion of the reaction was observed with higher water concentration, but with a decrease in crystallinity as the water content increased. Furthermore, Wang et al.[9], based on the feasibility of constructing PLA membranes using the phase inversion (PI) technique and dioxane as solvent and hot water droplets as non-solvent, studied the influence of temperature on membrane pore formation. This study allowed us to observe a decrease in the size and thickness of the membrane pores with increasing preparation temperature, reaching peak pore uniformity in the range of 50 – 75 °C. Experimental data showed that the use of a hot water droplet system influenced the formation of polymer-rich and polymer-poor phases due to the high temperature, reducing the solidification time of the membranes. Consequently, a decrease in pore size was observed with increasing temperature compared to room temperature. In the current global scenario, gas separation in industrial chemical processes occurs through methods such as pressure swing adsorption (PSA), temperature swing adsorption (TSA), cryogenic distillation and, more recently, membrane separation processes. Iulianelli et al.[10] observed that the operational and economic advantages of gas separation using membranes, compared to other techniques, are very valuable and should be considered a strong alternative to current gas separation processes. Furthermore, the optimized processes presented by membrane engineering show even greater energy efficiency, reduced waste generation and a significant reduction in plant size when using PSM. Analyzing the application of PLA membranes for gas selectivity, Oliveira et al.[11] evaluated the permeation of CO2, N2, and CH4 through the produced membranes. They also synthesized PLA membranes reinforced with banana fibers to verify the effect of the fibers on the selectivity of the permeated gases. The results obtained for the produced membranes showed that, with adequate treatment, it is possible to use PLA, considered a sensitive polymer, to produce highly selective membranes. Furthermore, the authors’ results indicate that the banana fiber-reinforced 2/14
membranes were effective in increasing selectivity, demonstrating the possibility of combining this polymer with other biodegradable compounds to improve current membrane production techniques. Recent studies by Iulianelli et al.[10] focus on the production of PEEK-WC and PLA membranes for H2 separation. The results show that PLA membranes can permeate and separate gaseous mixtures such as CH4/H2, CO2/H2, O2/H2, and N2/H2 with high selectivity (above 80%), demonstrating that membranes made from this polymer can function in gas separation or purification processes. Through the cited studies, it was possible to evaluate the different methodologies used for the synthesis of PLA membranes, as well as characterize them by their morphology, chemical structure, thermal and mechanical properties. It was common among the authors to focus on the preparation of PLA solutions, regardless of the solvent chosen, aiming for greater uniformity in the membranes obtained. The wide variation in application areas among the mentioned studies demonstrates the flexibility of PLA membranes compared to conventional alternatives that use non-biodegradable materials, indicating strong growth for this polymer due to its characteristics and its potential for combination with other technologies. Although studies related to the production of PLA membranes for different applications exist, few works simultaneously address the use of dichloromethane (DCM) as a solvent in the phase inversion process, the evaluation of gas permeation properties using synthetic air, and the preliminary analysis of biodegradation potential in different soil types. Therefore, the main contribution of this work lies in the integrated evaluation of morphology, gas transport properties, and degradability potential of PLA membranes produced with an alternative solvent/non-solvent system, aiming at the development of more sustainable separation technologies aligned with the principles of Green Chemistry. Unlike many studies focused primarily on gas selectivity or the incorporation of additives to improve performance, this work seeks to discuss the initial viability of biodegradable membranes obtained from an alternative solvent/non-solvent system, relating morphology, compaction, permeation, and environmental behavior of the material after disposal. The main scientific contributions of this study consist of the production and characterization of PLA membranes obtained by phase inversion using dichloromethane as a solvent, the integrated evaluation of morphology, compaction, and preliminary gas transport properties, as well as the initial investigation of the degradability potential of the membranes in different soil types. The work also demonstrates the influence of polymer concentration on the structural formation of the membranes and their behavior during gas permeation tests, contributing to the development of more sustainable polymeric materials for future applications in membrane separation processes. Therefore, the objective of this study is to prepare and characterize poly(lactic acid) polymeric membranes using the phase inversion method, with dichloromethane (DCM) as the solvent and water as the non-solvent, to evaluate their effectiveness in gas permeation. This is an initial study on the feasibility of the process and verification of the Polímeros, 36(3), e20260035, 2026
Characterization, gas transport properties, and degradability potential of poly(lactic acid) membranes effectiveness of gas permeation of the obtained membranes based on characterization data. This initial study will serve as a basis for future research in the production of PLA composite membranes, discussing the process parameters for obtaining and characterizing the results, flow, and fate after the useful life period, without presenting significant risks to the environment due to their biodegradable potential.
2. Materials and methods
hood, with rubber stoppers preventing solvent evaporation due to the proximity of its boiling point (39.6 °C) to the laboratory room temperature (23 °C). The 8% and 12% by weight PLA concentrations were chosen and used based on references found in the works of Galiano et al.[1], Barbosa et al.[12], and More et al.[7], with the choice being reinforced by unsuccessful attempts to produce membranes at PLA concentrations of 5 wt.%, 6 wt.%, 10 wt.%, and 15 wt.%.
2.1 Preparation of solutions
Similarly, the choice of solvent for producing the membranes was carefully evaluated, as the objective was to choose an organic solvent with a lower level of toxicity and that would not present alterations in the membrane formation properties of the polymers. Thus, DCM is one of the most widely used, since it is considered one of the least hazardous organochlorine compounds and capable of dissolving most existing organic compounds. The choice of this solvent for use in the present work is based on these characteristics, in addition to being an alternative to chloroform, regarding toxicity. DCM is a non-flammable solvent, with low toxicity, high solvency power and high chemical stability, compared to other conventional solvents available on the market[8,10,11].
Homogeneous PLLA solutions with concentrations of 8 wt.% and 12 wt.% were prepared by dissolving the substance granules in DCM under stirring at room temperature (approximately 23 °C) for 24 h. The Erlenmeyer flasks in which the solutions were prepared were placed inside a fume
The choice of dichloromethane (DCM) was also based on comparative toxicological aspects reported in the literature. Although both DCM and chloroform are organochlorine solvents, DCM presents lower acute toxicity when compared to chloroform, presenting an oral LD50 in rats of approximately
Figure 1 shows a simplified block flow diagram of the work methodology. The reagents used in the preparation of the membranes were used following the manufacturers’ specifications and the methodology explored by Barbosa et al.[12] and Poletto[13]. Poly(lactic acid) (PLA) granules with an average molecular mass of 39.5 kDa, from Nature Works, LLC[14] were used; dichloromethane (DCM), used as solvent, from the Vetec brand and with a purity of 99.5%; distilled water was used as a non-solvent.
Figure 1. Flowchart of the experimental procedure. Polímeros, 36(3), e20260035, 2026
3/14
Dal Magro, F. S., Silvestre. W. P., Bonetto, L. R., & Baldasso, C. 1.600 mg⸱kg−1, while chloroform presents values close to 695 mg⸱kg−1. Furthermore, the occupational exposure limits established by OSHA for DCM are 25 ppm (8-h weighted average), while for chloroform the limit is only 2 ppm , reflecting the greater toxicity of the latter. Thus, DCM was considered a relatively safer alternative for membrane preparation processes that demand a high PLA solubilization capacity. Even so, all experimental procedures involving the solvent were performed in a fume hood and under controlled laboratory conditions, aiming to minimize exposure[8,10,11].
2.2 Phase inversion PLA membranes were prepared using the phase inversion (PI) technique. The system used for membrane formation was PLA/DCM/water. The previously prepared solution was placed on a glass support using a spatula, which was used to maintain a thickness of 0.2 mm. The solution was subjected to an evaporation time of approximately 1 min. The resulting film was immersed in a coagulation bath, composed of distilled water, at 23 °C. Immediately after contact with water, there was a change in the optical opacity property of the film, from transparent to opaque with a slightly whitish appearance, and after approximately 5 min, the membrane detached from the surface of the glass plate. The prepared membranes were kept for an additional 24 h in a fresh distilled water bath to make them suitable for analysis. For storage, they were immersed in saline solution (1.0% w/v NaCl) to minimize the effects of the degradability of the polymer used. It is worth noting that the membranes remained stored in this saline solution and were only properly dried when used in the analysis. The membranes were classified as 8 wt.% by weight and 12 wt.%, according to the percentage of PLA present in the original solution.
2.3 Membrane characterization The thickness of the produced membranes was determined using a digital micrometer. Ten measurements were taken at random points on the membrane, and the arithmetic mean of the measurements was expressed. The morphology of the obtained PLA membranes was evaluated using SEM (Scanning Electron Microscopy). Before analysis, the samples were coated with a thin layer of gold for 3 min. Images were obtained using a SHIMADZU SSX-550 electron microscope, with an acceleration voltage of 10 keV and magnifications ranging from 2000x to 5000x. The pore size of the membranes was determined from the SEM micrographs using digital image analysis with the aid of ImageJ® software. For each sample, micrographs with a magnification of 5000× were selected, in which individual measurements of the apparent pore diameters were performed in representative regions of the surface and cross-section of the membranes. The results were expressed in terms of mean±standard deviation, allowing for the evaluation of the approximate distribution of pore sizes formed during the phase inversion process. FTIR-ATR spectroscopy was used to identify the main functional groups in the obtained PLA membrane. The selected spectrum was recorded on a Nicolet iS10 spectrophotometer, with a nominal resolution of 4 cm−1 and in the spectral range 4/14
between 4000 cm−1 and 400 cm−1. The pellet used in the analysis was prepared in a ratio of 5 mg of sample to 95 mg of KBr (spectroscopic grade).
2.4 Membrane compaction and maximum flow Before the maximum flow test, it was necessary to compact the produced membranes so that their structure would not change under the pressure applied during operation. The membrane compaction time was approximately 20 h, as a constant flow was observed. Gas permeation tests were performed using transmembrane pressure in the range of 0.5 to 6.0 bar, with increments of 0.5 bar between measurements. After each pressure adjustment, the system remained in stabilization for approximately 10 min before collecting permeate flow data, in order to ensure steady-state operating conditions. Maximum flux is the property that evaluates the amount of permeate that passes through the membrane per unit of time and area. The compacted membranes were tested in a synthetic air permeation system at room temperature with controlled pressures up to 6 bar. The composition of the synthetic air used was a mixture of oxygen (O2) and nitrogen (N2) in a proportion like that found in the atmosphere (78% vol. N2 and 21% vol. O2, with very small amounts of other inert gases).
Jp =
V A * ∆T
(1)
where: Jp: synthetic air permeate flux (L·m-2·h-1); V: volume of synthetic air permeate (L); A: membrane area (m2); ∆T: time variation (h). In this work, the nomenclature J p was used to represent the permeate flux, since the evaluated system involves gaseous permeation using synthetic air. The notation J w , frequently used in the literature to represent water flux, was not employed due to the gaseous nature of the permeate analyzed. From the data obtained by analyzing the initial flux of the membranes, compared to the flux after the compaction time, it was possible to determine the compaction factor (CF) of the membranes using Equation 2, adapted from Oliveira et al.[11].
CF =
Jwinicial Jw final
(2)
where: CF: compaction factor (dimensionless); Jw: airflow of the synthetic permeate (L·m-2·h-1). All gas permeation tests were performed in triplicate, using different membrane samples produced under the same experimental conditions, to guarantee the reproducibility of the results obtained. The values presented throughout the work correspond to the average of the measurements accompanied by the respective standard deviation. Permeation measurements were performed under near steady-state conditions. After each transmembrane pressure adjustment, the system remained in stabilization for approximately 10 min before collecting permeate flux data. Additionally, the membranes were pre-compacted until approximately constant flux was achieved, minimizing structural changes during the gas permeation tests. Polímeros, 36(3), e20260035, 2026
Characterization, gas transport properties, and degradability potential of poly(lactic acid) membranes 2.5 Gas permeance The gas permeance of the obtained and previously compacted PLA membranes was determined through the slope coefficient obtained with the linear regression of the points on the graph relating to the pressure across the membrane and the permeate flux of the experiment performed. The calculation used to determine the permeance is described in Equation 3[14,15].
Lp =
Jw ∆P
(3)
where: Lp: gas permeance (L·m-2·h-1·bar-1); Jw: synthetic permeate air flux (L·m-2·h-1); ∆P: transmembrane pressure (bar).
2.6 Degradation test by disposal in simulated urban and rural soil. Degradation tests were performed according to an adaptation of the ASTM G160-12 standard[16]. The simulated soil was prepared by collecting fertile soil from floriculture, aged for one week, with controlled pH, temperature and humidity. Soils of rural and urban origin were collected and homogenized, where samples of the PLA membranes were subsequently placed to observe the effects of their biodegradability. Temperature, pH, and air humidity parameters were monitored daily during the test period. Photographic control of the samples was performed every two days, according to the instructions of ASTM G160-12.
2.7 Experimental design and statistical analysis The experiment followed a completely randomized design, with the concentration of PLLA (8 wt.% or 12 wt.%) used in membrane synthesis as a factor, and the tests were performed in triplicate. The data were subjected to Student ‘s t-test, with a significance level of 5%, using Jasp statistical software (Netherlands).
3. Results and discussion 3.1 Membrane characterization The visual appearance of the membranes produced at concentrations of 8 wt.% and 12 wt.% is shown in Figures S1 and S2 of the Supplementary Material. The dense membranes obtained exhibited transparent optical properties and a glossy surface, as can be seen in the images. Analyzing Figures S1 and S2 of the Supplementary Material, the produced membranes appeared homogeneous and without apparent defects. Samples of the produced membranes, approved for their initial characteristics, were then sent for specific tests to verify the actual quality of the synthesized product. The thickness of the produced membranes was determined by using a digital micrometer with a resolution of 0.001 mm. For each membrane, ten measurements were taken at random points distributed along the surface, aiming to minimize heterogeneity effects resulting from the phase inversion formation process. The results were expressed in terms of mean ± standard deviation. The thickness values of the produced membranes are presented in Table 1. In general, Polímeros, 36(3), e20260035, 2026
Table 1. Thickness of the membranes produced with different PLA concentrations. Membrane 8 wt.% 12 wt.% Coefficient of variation (%)
Thickness (µm) 193±0.14 b 202±0.47 a 0.30
Means followed by the same letter do not differ statistically by Student’s T-test at a 5% significance level.
thicker membranes tend to exhibit greater resistance to mass transport and, consequently, lower permeate fluxes. However, in the present study, it was observed that the permeation behavior did not depend exclusively on the total thickness of the membrane, but also on morphological factors, such as the ratio between the dense layer and the porous layer, in addition to the degree of structural compaction suffered by the membranes during the gas permeation tests. Based on the observed values, it was possible to observe an increase in membrane thickness with the polymer content used in the preparation of the solution. The values found for membrane thickness were relatively high (some commercial membranes reach 4 µm), which leads to a reduction in flux[11,12,17]. Figure 2 shows SEM images of the produced membranes, with 5000x magnification, to better understand their morphological aspects. This allows for comparison and provides preliminary insights into their performance. Micrographs with 2000x magnification can be seen in Figures S3, S4, S5, and S6 of the Supplementary Material. From the frontal view of the microscopy images obtained, it is possible to verify that the asymmetric membranes obtained present high porosity in their upper layer, with defined pores and symmetrical sizes between them, a factor that is related to the evaporation time of the solvent, which occurs before the phase inversion in a distilled water bath. Despite the porous surface, the resulting membranes are dense, since the pores do not extend through the membrane. This fact can be verified throughout the membrane. This can also be attributed to the diffusion of water into the polymer solution during the membrane formation process. Since water is the non-solvent of the polymer, when the polymer/solvent solution is submerged in the non-solvent, an immediate phase separation occurs. In this case, a thin interfacial layer with a low polymer concentration is formed, sufficient to hinder mass transfer between the solution layers below it and the coagulation bath. Thus, since the surface porosity is a function of the ratio between the solvent exit rate and the non-solvent entry rate, the greater the solvent exit, the more concentrated the polymer-rich phase will be at the time of precipitation and the less porous the filter skin, which is the surface layer of the membrane[18-20]. The membranes produced did not receive any additional coating after their synthesis, with the final structure resulting exclusively from the phase inversion process. Therefore, the values discussed refer to the thickness of the dense layer formed during polymer precipitation. From the cross-sectional micrographs obtained by SEM, it was estimated that the 8 wt.% membrane presented an approximate dense layer of 17.21 µm, while the 12 wt.% membrane presented a dense 5/14
Dal Magro, F. S., Silvestre. W. P., Bonetto, L. R., & Baldasso, C.
Figure 2. SEM images of membranes prepared with 8 wt.% and 12 wt.% concentrations. (a) 8 wt.%, surface, 5000x magnification; (b) 12 wt.%, surface, 5000x magnification; (c) 8 wt.%, cross section, 5000x magnification; (d) 12 wt.%, cross section, 5000x magnification.
layer of approximately 25.55 µm. In this work, contact with air during a brief solvent evaporation process initiated membrane formation, but with a low solvent elimination rate, leading to the formation of an entire surface of well-defined pores. Observations of the cross-sections of the produced membranes allow us to highlight properties inherent to the formation of the lower layer, obtain approximate measurements of the pore size formed by SEM analysis, and confirm that the resulting membrane is dense. The structure of the membrane sublayer is directly influenced by the type of interface formed. Thus, the denser this interface, the more complex the interaction between the polymer solution and the coagulation bath. Consequently, the more difficult the mass transfer between the solvent and the non-solvent becomes, the slower the process becomes. In the case of instantaneous interfacial separation, the entry of the non-solvent is hindered due to the rapid precipitation of the polymer at the interface, as observed previously. The instability generated by precipitation at the interface generates nuclei in the subsequent layer, which can grow according to the removal of the solvent from the polymer solution of the lower layers, which remain momentarily stable. This transfer occurs until the entry of the non-solvent 6/14
causes an increase in the viscosity of the polymer-rich phase, preventing the continuation of the process. Membranes whose nuclei have had time to expand are characterized by a structure with macrovoids[12,21]. The pores formed on the surface and inside the membrane are symmetrical and small. The dense phase of the membrane does not have large voids, as seen in Wan’s et al. studies[18]. Immediately after spreading the solution on the glass plate, it was possible to observe the formation of a polymeric film, due to the rapid evaporation of the DCM solvent, which has a boiling point of 39.6 °C. This film formation indicates the beginning of polymer precipitation solely by solvent evaporation, as discussed by Rihayat et al.[22]. This rapid precipitation process, which was completed in the phase inversion bath, is directly related to the type of structure found by Wan et al.[18] and Barbosa et al.[12]. Due to this factor, mass transfer between the solvent and non-solvent is hindered, allowing droplets of the polymer-poor phase to coalesce and move downwards with the precipitation front, forming voids. However, due to the affinity between the solvent and the non-solvent, a rapid interaction between the phases and a rapid membrane formation were observed, a factor that may explain the absence of macrovoids and Polímeros, 36(3), e20260035, 2026
Characterization, gas transport properties, and degradability potential of poly(lactic acid) membranes the presence of small pores in the dense phase of the membrane. These factors indicate that the structure found for the membranes in the present study is different from those discussed by Wang et al.[9] and Barbosa et al.[12] since no macrovoids were formed in the membrane structure. By observing the SEM images obtained, it was also possible to determine the average pore size of each membrane, showing that the 8 wt.% membrane presented pore sizes in the range of 0.43 µm to 0.85 µm in the section used to perform the SEM. In the 12 wt.% membrane, the pore size varied between 0.55 µm and 1.34 µm. By analyzing the SEM micrographs and quantifying the pores using ImageJ® software, it was possible to observe that the 8 wt.% membranes presented an average pore diameter of approximately 0.64±0.15 µm, while the 12 wt.% membranes presented an approximate average diameter of 0.95±0.28 µm. The observed distribution indicates a tendency for the average pore size to increase with increasing polymer concentration in the membrane-forming solution. The polymer concentration used in the forming solution directly influenced pore formation during the phase inversion process. Increasing the PLA concentration increased the solution’s viscosity, reducing molecular mobility and altering the solvent-nonsolvent exchange kinetics during polymer precipitation. Consequently, membranes with a thicker dense layer and differences in pore distribution and size were observed. This behavior highlights the strong influence of polymer concentration on the final morphology of membranes obtained by phase inversion. Comparatively, the porous layer of the 8 wt.% membranes is larger than that observed in the 12 wt.% membranes. This factor may be associated with the amount of polymer present in the solution, such that the higher the concentration, the smaller the porous layer formed due to the instantaneous
precipitation of the membrane’s surface layer in contact with the non-solvent during phase inversion, resulting in a larger dense layer. Thus, by enlarging the micrographs obtained, it can be observed that the dense layer of the 8 wt.% membrane is approximately 17.21 µm, smaller than that of the 12 wt.% membrane, which has a dense layer of approximately 25.55 µm, corresponding to an increase of 32.6 % compared to the membrane with the lowest concentration. The spectrum obtained by FT-IR analysis made it possible to evaluate the structural chemical composition of the synthesized samples. Figure 3 shows the FTIR spectrum obtained for the produced membranes. Regarding the PLA bands, the band at 1750 cm−1 is observed, characteristic of the axial deformation of the carbonyl (C=O) bonds of the ester, indicating the prior occurrence of a ring-opening reaction of the LLA isomer for the formation of the polyester. Furthermore, the absorption band at 1080 cm−1 characterizes the axial deformation of the carbon-oxygen (C-O) bonds. Another evident characteristic compared to the PLA spectrum is the band at 2900 cm−1, which is subtly highlighted due to the consumption of hydroxyl groups (OH−) in the polymerization process, indicating a reduction in the amount of carboxyl (COOH) and hydroxyl (OH−) groups, accentuating the band at 1750 cm−1. Furthermore, bands corresponding to the angular deformations of the methyl group (CH3) were observed at 1420 cm-1 with relatively displaced bands compared to the pure polymer, normally present at 1411 cm-1[5,12,22]. No characteristic bands inherent to DCM were observed, indicating that the solvent was eliminated during the phase inversion, and also inferring that the phase inversion process occurred satisfactorily. If it were possible to observe the presence of residual DCM in the membranes, higher intensity bands could be observed at 1250 cm-1 inherent to the out-of-plane
Figure 3. FTIR-ATR spectrum of the produced PLA membranes. Polímeros, 36(3), e20260035, 2026
7/14
Dal Magro, F. S., Silvestre. W. P., Bonetto, L. R., & Baldasso, C. oscillating methylene radical (CH2), 750 cm-1, characteristic of CH2 and characteristic of carbon-chlorine (C-Cl) bonds, and medium intensity bands at 3000 cm-1 and 1450 cm-1, characteristic of the asymmetric deformation of CH2[20].
3.2 Membrane compaction and maximum flow For compaction and permeate flux analyses, membranes with 8 wt.% and 12 wt.% were analyzed, with a compaction time of approximately 20 h. Compared to the beginning of the process, it was observed that the permeate flux decreases due to membrane compaction over time. Upon reaching a steady state, the membrane compaction period ends, allowing the membrane permeance test to be performed. The maximum flow rate was defined at the maximum pressure supported by the membrane module (6 bar). The observed flow values are presented in Table 2. It is worth noting that the membrane withstood the system pressure without rupture, demonstrating that the membrane is functional for this operating range. The maximum observed flux for the 8 wt.% membrane was 50.9 L∙m−2∙h−1, lower than that observed for the 12 wt.% membrane, where the maximum observed flux was 312.9 L∙m−2∙h−1. This can be explained by the compaction factor (CF) of each sample, since the higher the observed compaction factor, the lower the gas flux through the membrane due to the greater difficulty of gas transport through the compacted structure[4,21]. Although both membranes were produced using the same polymer, the difference in PLA concentration in the forming solution directly influenced the resulting morphology after the phase inversion process. SEM analyses indicated that the membrane produced with 8 wt.% showed a greater extent of porous layer and greater susceptibility to structural collapse of the pores during compaction under pressure. Thus, even with a smaller total thickness, this membrane underwent greater structural reorganization, resulting in a compaction factor approximately three times higher than that observed for the 12 wt.% membrane. In contrast, the higher concentration membrane initially presented a denser and more mechanically stable structure, reducing the effects of compaction during gas permeation tests. According to Chinyerenwa et al.[2], CF is related to membrane structure, mainly porosity. The higher the CF, the more compact the membrane, mainly due to the macropores in its structure. According to the SEM comparison, it was possible to verify the presence of a larger porous surface in the 8 wt.% membrane compared to the 12 wt.% membrane, in addition to the presence of macropores in both structures. Thus, the CF values found in the membranes used in this study suggest that the compaction of the first was greater
due to the proportions between the dense and porous layers. Furthermore, the CFs obtained explain the greater permeate flux to the 12 wt.% membrane due to the lower compaction of this sample. The compaction of the dense membranes obtained occurred due to the collapse of the pores in the surface layer, a factor that ended up influencing the mass transfer through the membrane.
3.3 Gas permeance After compaction of the membranes, they began to permeate synthetic air depending on the applied pressure. As can be seen in Figure 4, the flow tends to increase as the pressure increases[12,22]. The data presented in the Figure are the results of triplicate tests on three different membrane samples, totaling nine samples, to indicate the reproducibility of the experiment. In this study, synthetic air was chosen as the test gas to perform a preliminary evaluation of the gas transport capacity of the produced membranes. Individual tests with pure gases, such as CO2, N2 and CH4, as well as gas selectivity analyses, were not considered at this stage of the research due to the experimental and operational limitations of the laboratory system used. Thus, the results obtained should be interpreted as an initial investigation of the viability of PLA membranes for applications involving gas permeation, serving as a basis for future more in-depth studies involving selective separation of specific gases. The values obtained for the maximum flux of the membranes can be considered high compared to those observed by Oliveira et al.[11]. In their studies on the gas selectivity of PLA membranes using chloroform as solvent and reinforced with banana fibers at a concentration of 15% by weight of polymer, significantly lower gas fluxes were observed for a similar pressure range, working at pressures ranging from zero to 3 bar. The banana fibers used in the membranes produced by Oliveira et al.[11] were responsible for increasing the selective barrier to gases, significantly reducing the observed permeate flux. For the PLA membranes produced in this work, the flux values found indicate that the observed pores are relatively large for small molecules, as is the case with synthetic air. Compared to the results obtained by Zhang in his studies on membrane formation using polyethylene terephthalate (PET) as a polymer and DCM as a solvent, it was observed that the choice of this solvent contributed to the formation of the solution, which allowed the formation of a homogeneous membrane with a relatively standardized structure along its length, being a lower cost alternative for the manufacture of this material[5]. Similarly, Barbosa et al.[12] observed that, when using PLA as a polymer and DCM as a solvent for membrane formation,
Table 2. Determination of maximum flux, average flow rate and compaction factor in the permeation of synthetic air for PLA/DCM membranes produced with different concentrations of PLLA in the film-forming solution. Membrane 8 wt.% 12 wt.% Coefficient of variation (%)
Average flow rate
Maximum flux
(L∙h-1) 0.085 ±0.0007 b 0.520 ±0.0076 a 1.89
(L∙m-2∙h-1) 50.9 ±0.91 b 312.9 ±0.91 a 2.06
Compaction Factor (CF) 8.51 ±0.04 b 2.88 ±0.07 a 2.90
Means followed by the same letter in column do not differ statistically by Student’s t-test at a significance level of 5%.
8/14
Polímeros, 36(3), e20260035, 2026
Characterization, gas transport properties, and degradability potential of poly(lactic acid) membranes
Figure 4. Permeate flux as a function of pressure variation for PLA membranes using DCM as the solvent in concentrations of (a) 8 wt.% and (b) 12 wt.% of polymer in preparing the film-forming solution.
the results for gas permeation were positive, reinforcing the possibility of membrane formation with these reagents, as shown in the permeation results performed in Figure S5 of the Supplementary Material. The flux obtained indicates that the membranes were well compacted, especially the 8 wt.% membrane, which showed the lowest flux among the samples. However, the result obtained for the 12 wt.% membrane is also satisfactory, even with a lower flux rate than the 8 wt.%. A linear dependence of the flux on the pressure drop in the system can be observed, indicating the absence of porosity in the formed membrane. In fact, the membranes obtained are dense, which characterizes a linear relationship between the pressure gradient and the transmembrane flux, according to Fick’s diffusion equation. The equation of the straight line shown in the graphs was obtained through linear regression of the data presented in Polímeros, 36(3), e20260035, 2026
Figure S6 of the Supplementary Material. There is a linear relationship between permeate flux and the variation in transmembrane pressure, corroborating R2 = 0.9793 for the 8 wt.% membrane and R2 = 0.9533 for the 12 wt.% membrane. The difference between the experimental values obtained and the unit can be attributed to measurement errors inherent in the analysis or small pressure variations during the experiment. Equation 4 was obtained from the linear regression obtained with the data from Figure 4 for the 8 wt.% membrane and Equation 5 for the 12 wt.% membrane.
= Jp 8, 0993 *∆P − 1,356
(4)
= Jp 47,3650 * ∆P − 6, 794
(5)
where: Jp = airflow of the synthetic permeate (L∙m-2∙h-1); ∆P = transmembrane pressure (bar). 9/14
Dal Magro, F. S., Silvestre. W. P., Bonetto, L. R., & Baldasso, C. Table 3 presents the permeance values obtained through the slope of the regression lines and the gas permeance, in barrers, obtained for the membranes evaluated in this study. Gas permeance was lower for membranes with lower fluxes, which, in this case, may be related to the higher compaction factor. It is important to emphasize that the results of this work aim at gas permeation, with the objective of using these membranes in an application that demands a dense structure with restricted liquid permeation. At the proposed research level, gas permeation proved possible, but the composition of the outlet gases for the experiment was not determined, nor was the selectivity capacity of the produced membranes evaluated. It is suggested that, in future research opportunities with the production of these membranes, the selectivity capacity of the produced membranes be studied, verifying the application for gas separation in different proportions.
compaction suffered by the 8 wt.% membrane and the larger dense layer present in this membrane[13,23].
The results presented for permeate flux and permeance represent the average values obtained from triplicate tests, demonstrating satisfactory reproducibility of the experimental system used.
In line with the literature, the observed results are considered satisfactory, since several authors have obtained similar results in their research and incorporated additives into their membranes to improve factors such as permeance and selectivity. Damião evaluated and characterized PLA membranes combined with clay. The results obtained by the author indicated that the incorporation of clay into PLA membranes can improve their mechanical and gas permeance properties, increasing selectivity efficiency results by 35 %, expanding their applications in gas separation processes. It should be noted that the present study focused on the preliminary evaluation of the gas permeation capacity of membranes produced using synthetic air, without analyses of permeate composition or determination of selectivity between specific gases. Thus, the results obtained represent an initial stage of investigation of the gas transport properties of PLA membranes, serving as a basis for future studies focused on selective gas separation[13,14,17,23].
The permeation values obtained in this study have practical relevance as they demonstrate the initial gas transport capacity of PLA membranes produced via phase inversion. The results indicate that the polymer concentration used in the forming solution directly influences membrane compaction, dense layer thickness, and resistance to mass transport—important parameters for future applications involving permeation and gas separation. However, since selectivity or permeate composition analyses were not performed, the values presented should be interpreted as preliminary indicators of the gas transport behavior of the produced membranes.
Although the present study did not include gas selectivity analyses, the results obtained allow for a preliminary assessment of the potential of the produced membranes for applications involving gas transport. Parameters such as structural integrity, compaction behavior, morphological stability, and permeate flux response to transmembrane pressure represent important initial steps in the development of membranes intended for gas separation. Thus, the results presented should be interpreted as indicative of the initial viability of the material, and further investigations involving pure gases and selectivity determination are necessary for complete validation of applications in gas separation.
As mentioned earlier, membrane structure, such as morphology and thickness, is an important factor to consider in the analysis of membrane permeate flux. Thickness is an important parameter because flux decreases with increasing thickness, which increases resistance to mass transport across the membrane[23]. Comparing membranes of different thicknesses prepared with the same solvent, the results agree with the literature, where thinner membranes exhibit higher flux, while thicker membranes exhibit lower flux[13,23].
3.4 Biodegradation test by disposal in simulated urban and rural soil. The biodegradation test by disposal in simulated soil was performed by adapting the ASTM G160-12 standard, whose parameters observed during the test are presented in Table 4. Before the membranes were placed in the different soil types, the samples were previously dried and weighed on an analytical balance to determine the initial mass. The 8 wt.% membranes showed an average initial mass close to 0.059 g, while the 12 wt.% membranes showed an average initial mass close to 0.086 g, considering samples with similar dimensions used in the degradability tests. The degradability tests were performed in triplicate for each experimental condition, considering the different soil types and the 8 wt.% and 12 wt.% PLA concentrations.
Considering the mass percentage of polymer, the expected behavior was that the 8 wt.% membrane would exhibit a higher flux than the 12 wt.% membrane due to the membrane formation process and the greater amount of polymer in the membrane composition. However, it was observed that the 12 wt.% membrane exhibited a higher permeate flux. This fact can be explained by the greater
Table 3. Characterization parameters of the transport properties of PLA membranes prepared with 8% and 12% by weight of polymer in the film-forming solution. Membrane 8 wt.% 12 wt.% Coefficient of variation (%)
Permeability (L∙m-2∙h-1∙bar-1) 8.10±0.72 b 47.37±2.24 a
Gas permeability (barrer) 11.16 ± 2.43 b 18.21 ± 3.85 a
2.06
2.86
Means followed by the same letter in column do not differ statistically by Student’s T-test at a significance level of 5%.
10/14
Polímeros, 36(3), e20260035, 2026
Characterization, gas transport properties, and degradability potential of poly(lactic acid) membranes Table 4. Evaluation of mass loss of membranes placed in simulated urban and rural soil over 12 days. Membrane 8 wt.% 12 wt.% Coefficient of variation (%)
simulated soil 18.16 ±0.09 b 22.19 ±0.72 a 3.74
Mass loss (%) urban soil 10.88±0.54 b 13.37±0.83 a 11.21
rural soil 13.94±1.25 b 14.45±0.99 a 15.81
Means followed by the same letter in column do not differ statistically by Student’s t-test at a significance level of 5%.
The results presented correspond to the average values obtained for each condition evaluated. Potential degradability tests were conducted over a short period to assess how quickly PLA membranes at different concentrations would degrade under adverse conditions, exposed to moist soil and controlled temperature. Sampling ended when a mass loss greater than 10 % was observed in all soils, as can also be seen in Table 4. The tests performed in this study aimed to preliminarily evaluate the initial degradation potential of PLA membranes in different soil types and were not sufficient to completely confirm the biodegradability of the samples. Considering the nature of the PLA polymer and the mechanisms involved in its degradation, complete biodegradation processes generally require significantly longer periods, potentially occurring over weeks or months, depending on environmental, microbiological, temperature, and humidity conditions. Considering the three soil types, the mass loss for the 12 wt.% membrane was greater than that observed for the 8 wt.% membrane, a factor related to the higher polymer concentration and the greater availability of material to be biodegraded. Furthermore, a higher percentage was observed than that found by Mansi et al.[19] in their studies on the biodegradability of PLA with chitosan reinforcement, indicating that PLA membrane samples without reinforcements or additives in their structure are more easily biodegradable. The visual appearance of the membranes exposed to the three types of soil for 12 days is shown in Figure S7 and Figure S8 of the Supplementary Material. During the first two days, a difference was observed in the membranes with concentrations of 8 wt.% and 12 wt.%, which initially were malleable to the touch and became slightly rigid, visually like a commercial plastic film. However, between the first and third day, the membranes appeared thicker, which may indicate that the membranes were retaining water in the soil. After the fourth day of testing, it was possible to verify that the membranes began to lose thickness, becoming visually thinner and more sensitive, showing a loss of opacity and becoming transparent. From the sixth day onwards, the observed differences in thickness continued to occur, and it was possible to observe that the membranes became completely transparent, with the thickness continuing to reduce over the days, showing that the sample was beginning its biodegradation process in the soil. Considering the average biodegradation time of the PLA polymer (24 months), the results obtained in this initial testing period were interesting[6,24]. Unstable visual appearance of the membranes was observed, which may Polímeros, 36(3), e20260035, 2026
result from the moisture content of the material or due to differences in membrane flexibility[8,22]. As discussed earlier, PLA is produced from lactic acid. Therefore, membranes produced from this polymer, when placed in the soil, would likely begin to degrade, triggered by hydrolysis, becoming lactic acid again, serving as an energy source for microorganisms present in the soil, which, in turn, transformed the lactic acid into water and carbon dioxide. It is worth noting that, although PLA is presented as a biodegradable polymer, these so-called biodegradable materials must be disposed of in appropriate locations that promote their biodegradation. During the 12 days, visual differences in degradation were observed. However, the time elapsed to perform the degradation test on both soil samples was not sufficient to monitor the complete biodegradation process of the samples by the soils in which they were buried and to confirm that the membranes are, in fact, biodegradable. Nevertheless, their biodegradation potential was observed. In both cases, it is possible to verify that the samples placed in simulated soil showed greater degradability potential, which was confirmed by evaluating the mass loss of the samples over the days (Table 4). Another evident factor is the loss of opacity of the membranes due to contact with soil moisture, since they presented transparent optical properties during the elapsed days. Furthermore, it is possible to observe the formation of rough sections along the membrane structure from the 8th day onwards, which is a sign that the degradation process of the samples by the soil is effectively occurring[25]. To determine the degradability of the samples, it is expected that they will degrade in 45 days. The microorganisms present in the soil samples used in the tests were not microbiologically characterized in this study. Therefore, although it was possible to observe initial changes related to the degradability potential of the membranes, it was not possible to correlate the results obtained with specific microbial species or with the microbiological activity of the different soils evaluated. Future studies may include microbiological characterization and monitoring of soil biological activity for a better understanding of the mechanisms involved in PLA degradation. Although visual changes, partial mass loss, and modifications related to the transparency and surface integrity of the membranes were observed over the 12 days of exposure, the samples remained structurally preserved, indicating that the observed process corresponds only to the initial stages of degradation. Therefore, the results obtained should be interpreted as indicative of the initial degradability potential of the membranes produced. 11/14
Dal Magro, F. S., Silvestre. W. P., Bonetto, L. R., & Baldasso, C.
4. Conclusion This study contributes to the advancement of research involving PLA membranes by simultaneously correlating morphological parameters, compaction behavior, preliminary gas transport properties, and the initial environmental degradability potential of the produced membranes. Unlike many studies focused solely on improving selectivity through the incorporation of additives or complex structural modifications, this work seeks to evaluate the initial viability of biodegradable membranes obtained by a relatively simple phase inversion system, emphasizing both structural and environmental aspects related to the application and disposal of the material. PLA membranes prepared using the phase inversion method with DCM as a solvent showed similarities when evaluated morphologically and in relation to chemical structure and degradability. However, the observed transport properties showed significant differences between membranes with different concentrations (8 wt.% and 12 wt.% relative to polymer mass). It was possible to evaluate the effect of using different polymer concentrations on membrane morphology, finding that a higher concentration influences parameters such as thickness and other characteristics, such as transmembrane flux and permeance. The gas permeance of the obtained membranes demonstrated the membrane’s ability to permeate synthetic air. Regarding degradability, it was observed that the chosen DCM solvent did not affect the biodegradation properties of the polymer, since it was possible to visually verify the degradation of the membranes over the days in different soils. PLA membranes using DCM as a solvent and water as a non-solvent proved to be functional, according to the characterization, flux, and permeance tests performed. This reinforces the viability and potential application of this technology compared to conventional polymer membranes, meeting the precepts of Green Chemistry, which aim to reduce the use of non-renewable resources and the risks of environmental pollution, in addition to presenting a high potential for degradability. Future research could explore the full potential of PLA membranes, since this technology can be applied in various industrial and environmental sectors, such as in the separation of carbon dioxide (CO2) from industrial gases, such as those from thermal power plants, and in the separation of methane (CH4) from other gases present in natural gas, such as carbon dioxide (CO2) and nitrogen (N2), during the purification process. In the chemical industry, it can also be applied in the separation of gases and vapors during the manufacture of chemical products, especially in processes that require high purity of certain gaseous compounds. The degradability analyses carried out in this study represent a preliminary assessment of the behavior of PLA membranes in contact with different types of soil. Future studies should include longer exposure periods and complementary postdegradation characterization techniques, such as FTIR, SEM, and thermal analyses, aiming to confirm the structural, chemical, and morphological changes associated with the biodegradation process of the material. Despite the promising results obtained, the present study presents some important limitations. Selectivity analyses using pure gases were not performed, nor was the permeate composition determined, which limits the complete evaluation of the membranes’ potential for effective gas separation applications. Furthermore, 12/14
the degradability tests were conducted over a short period, representing only a preliminary assessment of the initial degradation potential of the membranes. The study also did not include post-degradation analyses such as FTIR, SEM, or microbiological characterization of the soils used. Therefore, future investigations involving longer degradation periods, complementary structural analyses, and gas selectivity tests are necessary for a more comprehensive validation of the performance and applicability of the membranes produced. Future studies should include permeation tests using pure gases such as CO2, N2, and CH4, as well as the determination of the gas selectivity of the produced membranes, aiming to more fully evaluate their potential for gas separation applications. Furthermore, optimization of phase inversion conditions is recommended, including evaluation of different polymer concentrations, solvent evaporation times, and solvent/non-solvent combinations, seeking greater control over the morphology and transport properties of the membranes. The incorporation of fillers, nanoparticles, or compatibilizing additives can also be investigated as a strategy to improve mechanical stability, resistance to compaction, and selective performance of PLA membranes.
5. Authors’ Contribution • Conceptualization – Fernando Silva Dal Magro; Luis Rafael Bonetto. • Data curation – Fernando Silva Dal Magro; Luis Rafael Bonetto; Wendel Paulo Silvestre. • Formal analysis – Fernando Silva Dal Magro; Wendel Paulo Silvestre. • Funding acquisition – NA. • Investigation – Camila Baldasso; Fernando Silva Dal Magro; Luis Rafael Bonetto; Wendel Paulo Silvestre. • Methodology – Camila Baldasso; Fernando Silva Dal Magro; Luis Rafael Bonetto. • Project administration –Luis Rafael Bonetto. • Resources – Camila Baldasso; Fernando Silva Dal Magro; Luis Rafael Bonetto. • Software – Fernando Silva Dal Magro; Wendel Paulo Silvestre. • Supervision – Camila Baldasso; Luis Rafael Bonetto; Wendel Paulo Silvestre. • Validation – Camila Baldasso; Fernando Silva Dal Magro; Wendel Paulo Silvestre. • Visualization – Fernando Silva Dal Magro; Wendel Paulo Silvestre. • Writing – original draft – Camila Baldasso; Fernando Silva Dal Magro; Luis Rafael Bonetto; Wendel Paulo Silvestre. • Writing – review & editing – Fernando Silva Dal Magro; Wendel Paulo Silvestre.
6. References 1. Galiano, F., Briceño, K., Marino, T., Molino, A., Christensen, K. V., & Figoli, A. (2018). Advances in biopolymer-based membrane Polímeros, 36(3), e20260035, 2026
Characterization, gas transport properties, and degradability potential of poly(lactic acid) membranes preparation and applications. Journal of Membrane Science, 564, 562-586. https://doi.org/10.1016/j.memsci.2018.07.059. 2. Chinyerenwa, A. C., Wang, H., Zhang, Q., Zhuang, Y., Munna, K. H., Ying, C., Yang, H., & Xu, W. (2018). Structure and thermal properties of porous polylactic acid membranes prepared via phase inversion induced by hot water droplets. Polymer, 141, 62-69. https://doi.org/10.1016/j.polymer.2018.03.011. 3. Choksia, N., & Desai, H. (2017). Synthesis of biodegradable polylactic acid polymer by using lactic acid monomer. International Journal of Applied Chemistry, 13(2), 377-384. Retrieved in 2026, February 3, from https://www.ripublication. com/ijac17/ijacv13v2_19.pdf 4. Mulder, M. (1996). Basic Principles of Membrane Technology (2nd ed.). Dordrecht: Kluwer Academic Publishers. https://doi.org/10.1007/978-94-009-1766-8. 5. Zhang, Z.-M., Gan, Z.-Q., Bao, R.-Y., Ke, K., Liu, Z.-Y., Yang, M.-B., & Yang, W. (2020). Green and robust superhydrophilic electrospun stereocomplex polylactide membranes: multifunctional oil/water separation and self-cleaning. Journal of Membrane Science, 593, 117420. https://doi.org/10.1016/j. memsci.2019.117420. 6. Auras, R., Lim, L.-T., Selke, S. E. M., & Tsuji, H. (2010). Poly(Lactic Acid): synthesis, structures, properties, processing, and applications. Newark: John Wiley & Sons, Inc. https://doi.org/10.1002/9780470649848 7. More, N., Avhad, M., Utekar, S., & More, A. (2023). Polylactic acid (PLA) membrane—significance, synthesis, and applications: a review. Polymer Bulletin, 80(2), 1117-1153. https://doi.org/10.1007/s00289-022-04135-z. 8. Xing, Q., Dong, X., Li, R., Yang, H., Han, C., & Wang, D. (2013). Morphology and performance control of PLLA-based porous membranes by phase separation. Polymer, 54(21), 5965-5973. https://doi.org/10.1016/j.polymer.2013.08.007. 9. Wang, H., Wang, L., Liu, C., Xu, Y., Zhuang, Y., Zhou, Y., Gu, S., Xu, W., & Yang, H. (2019). Effect of temperature on the morphology of poly (lactic acid) porous membrane prepared via phase inversion induced by water droplets. International Journal of Biological Macromolecules, 133, 902-910. https:// doi.org/10.1016/j.ijbiomac.2019.04.145. PMid:31026529. 10. Iulianelli, A., Algieri, C., Donato, L., Garofalo, A., Galiano, F., Bagnato, G., Basile, A., & Figoli, A. (2017). New PEEK-WC and PLA membranes for H 2 separation. International Journal of Hydrogen Energy, 42(34), 22138-22148. https://doi.org/10.1016/j.ijhydene.2017.04.060. 11. Oliveira, G. R., dos Santos, T., Pacheco, K., Grisa, A. M. C., & Zeni, M. (2013). Seletividade a gases de membranas de poli (ácido lático) reforçadas com fibra de bananeira. Revista Iberoamericana de Polímeros, 14(4), 179-186. Retrieved in 2026, February 3, from https://reviberpol.org/wp-content/ uploads/2019/07/2013-oliviera.pdf 12. Barbosa, J. C., Reizabal, A., Correia, D. M., Fidalgo-Marijuan, A., Gonçalves, R., Silva, M. M., Lanceros-Mendez, S., & Costa, C. M. (2020). Lithium-ion battery separator membranes based on poly(L-lactic acid) biopolymer. Materials Today. Energy, 18, 100494. https://doi.org/10.1016/j.mtener.2020.100494. 13. Poletto, P. (2010). Caracterização de membranas de poliamida 66 preparadas pelo método de inversão de fases (Master’s thesis). Universidade de Caxias do Sul, Caxias do Sul. Retrieved in 2026, February 3, from https://repositorio.ucs. br/handle/11338/573 14. Greenlee, L. F., Lawler, D. F., Freeman, B. D., Marrot, B., & Moulin, P. (2009). Reverse osmosis desalination: water sources, technology, and today’s challenges. Water Research,
Polímeros, 36(3), e20260035, 2026
43(9), 2317-2348. https://doi.org/10.1016/j.watres.2009.03.010. PMid:19371922. 15. Ho, W. S. W., & Sirkar, K. K. (1992). Membrane handbook. New York: Van Nostrand Reinhold. https://doi.org/10.1007/978-1-4615-3548-5 16. American Society for Testing and Materials. (2019). ASTM G160-12. Standard practice for evaluating microbial susceptibility of nonmetallic materials by laboratory soil burial. West Conshohocken: ASTM International. 17. Domingues, R. C. C. (2017). Desenvolvimento de membranas de poli(ácido lático) para aplicação como conduíte de guia neural (Doctoral Dissertation). Universidade Federal do Rio de Janeiro, Rio de Janeiro. Retrieved in 2026, February 3, from http://hdl.handle.net/11422/10157 18. Wan, C. F., Yang, T., Lipscomb, G. G., Stookey, D. J., & Chung, T.-S. (2017). Design and fabrication of hollow fiber membrane modules. Journal of Membrane Science, 538, 96-107. https://doi.org/10.1016/j.memsci.2017.05.047. 19. Mansi, A., Abdallah, H., Feng, F., Elhenawy, Y., Reda, A., Ashraf, M., & Bassyouni, M. (2024). Recycling reverse osmosis membranes: addressing the challenges of non-biodegradability and waste generation. International Journal of Industry and Sustainable Development, 5(1), 34-43. https://doi.org/10.21608/ ijisd.2024.253230.1043. 20. Karimpour-Motlagh, N., Khonakdar, H. A., Jafari, S. M. A., Mahjub, A., Panahi-Sarmad, M., Kasbi, S. F., Shojaei, S., Goodarzi, V., & Arjmand, M. (2020). Influence of polypropylene and nanoclay on thermal and thermo-oxidative degradation of poly(lactide acid): TG-FTIR, TG-DSC studies and kinetic analysis. Thermochimica Acta, 691, 178709. https://doi.org/10.1016/j.tca.2020.178709. 21. Nofar, M., Sacligil, D., Carreau, P. J., Kamal, M. R., & Heuzey, M.-C. (2019). Poly (lactic acid) blends: Processing, properties and applications. International Journal of Biological Macromolecules, 125, 307-360. https://doi.org/10.1016/j.ijbiomac.2018.12.002. PMid:30528997. 22. Rihayat, T., Hadi, A. E., Aidy, N., Safitri, A., Siregar, J. P., Cionita, T., Irawan, A. P., Hamdan, M. H. M., & Fitriyana, D. F. (2021). Biodegradation of polylactic acid-based bio composites reinforced with chitosan and essential oils as anti-microbial material for food packaging. Polymers, 13(22), 4019. https://doi.org/10.3390/polym13224019. PMid:34833315. 23. García-Pacheco, R., Lawler, W., Landaburu-Aguirre, J., García-Calvo, E., & Le-Clech, P. (2017). 4.14 End-of-life membranes: Challenges and opportunities. In E. Drioli, L. Giorno, & E. Fontananova (Eds.), Comprehensive Membrane Science and Engineering (2nd ed., pp. 293-310). Oxford: Elsevier. https://doi.org/10.1016/B978-0-12-409547-2.12254-1 24. Messin, T., Marais, S., Follain, N., Guinault, A., Gaucher, V., Delpouve, N., & Sollogoub, C. (2020). Biodegradable PLA/PBS multinanolayer membrane with enhanced barrier performances. Journal of Membrane Science, 598, 117777. https://doi.org/10.1016/j.memsci.2019.117777. 25. Stevens, E. S. (2002). Green plastics: an introduction to the new science of biodegradable plastics. Princeton: Princeton University Press. https://doi.org/10.1515/9780691214177. Received: Feb. 03, 2026 Revised: May 19, 2026 Accepted: Jun. 12, 2026 Editor-in-Chief: Sebastião V. Canevarolo.
13/14
Dal Magro, F. S., Silvestre. W. P., Bonetto, L. R., & Baldasso, C.
Supplementary Material Supplementary material accompanies this paper. Figure S1. Visual appearance of the membranes, produced by the phase inversion method, with concentrations of 8 wt.% of PLA in the film-forming solution. Figure S2. Visual appearance of the membranes, produced by the phase inversion method, with concentrations of 12 wt.% of PLA in the film-forming solution. Figure S3. SEM image of membranes prepared with concentrations of 8 wt.%, surface, 2000x magnification. Figure S4. SEM image of membranes prepared with concentrations of 12 wt.%, surface, 2000x magnification. Figure S5. SEM image of membranes prepared with concentrations of 8 wt.%, cross section, 2000x magnification. Figure S6. SEM image of membranes prepared with concentrations of 8 wt.%, cross section, 2000x magnification. Figure S7. Comparative evolution of the degradability of membranes containing 8 wt.% PLA in the film-forming solution over a period of 12 days by burial in simulated soil, urban soil and rural soil. Figure S8. Comparative evolution of the degradability of membranes containing 12 wt.% PLA in the film-forming solution over a period of 12 days by burial in simulated soil, urban soil and rural soil. This material is available as part of the online article from https://doi.org/10.1590/0104-1428.20260003.
14/14
Polímeros, 36(3), e20260035, 2026
ISSN 1678-5169 (Online)
https://doi.org/10.1590/0104-1428.20250041
Degradation of polychloroprene/natural rubber blend by photo-Fenton process. II-A solvent effect Adonilson Reis Freitas1,2* , Luciana Gaffo1 and Edvani Curti Muniz2 Grupo de Pesquisa em Ciências dos Materiais, Centro de Engenharias e Ciências Exatas, Universidade Estadual do Oeste do Paraná – Unioeste, Toledo, PR, Brasil 2 Grupo de Materiais Poliméricos e Compósitos, Centro de Ciências Exatas, Departamento de Química, Universidade Estadual de Maringá – UEM, Maringá, PR, Brasil 1
*adonilson.freitas@unioeste.br
Abstract Polymeric degradation is an irreversible chemical process influenced by various physical and chemical agents. This study investigates the effects of different solvents on the degradation of a polychloroprene (PCP) and natural rubber (NR) blend in a toluene solution, catalyzed by FeCl3·6H2O. Efflux time was measured using an Ubbelohde viscometer to monitor the degradation process. The results demonstrate that the dielectric constant and dipole moment of solvents play a significant role in determining the rate and extent of polymer degradation. Kinetic analysis revealed that the degradation process does not adhere to a first-order model throughout the reaction period. However, it aligns with a first-order kinetic model during the initial phase (0-200 minutes). With a longer reaction time of 510 minutes, only THF and toluene solvents exhibited a linear relationship consistent with a second-order kinetic model. This study underscores the critical influence of solvent characteristics on controlling polymer degradation. Keywords: polychloroprene, natural rubber, blend, degradation, solvent. Data Availability: Research data is available upon request from the corresponding author. How to cite: Freitas, A. R., Gaffo, L., & Muniz, E. C. (2026). Degradation of polychloroprene/natural rubber blend by photo-Fenton process. II-A solvent effect. Polímeros: Ciência e Tecnologia, 36(3), e20260036. https://doi.org/10.1590/0104-1428.20250041
1. Introduction Polymeric degradation is a chemical process that results in irreversible changes in polymer properties. This process can be triggered by physical or chemical agents and often involves one or more factors[1]. As noted by Reichardt[2], most chemical transformations typically occur in the liquid phase, within solutions. Solutions are homogeneous liquid phases composed of multiple components in variable proportions. One of these components, referred to as the solvent (which can be a mixture), is distinguished from the other components, known as solutes. Solvent properties can influence the course of reactions among other species in solution. Consequently, variations in solvent characteristics lead to significant changes in the binding properties of ligands[3]. Berthelot and Pen de St. Gilles[4] first observed the effect of solvent changes on reaction rates, and Menschutkin[5] conducted the first systematic study. For years, research on solvent effects was primarily conducted by physical-organic chemists. Hammett and Deyrup pioneered this growing field[6]. Subsequently, Hughes and Ingold, along with Grunwald and Winstein, advanced studies on solvent effects in 1948[6]. One of us (R.A.S.) had the privilege of attending Ingold’s lectures at Cornell, which later formed the basis of his seminal book[7]. E. B. vividly recalls Hughes and Ingold’s undergraduate lectures on the solvent’s role in nucleophilic substitution, which established the Hughes-Ingold Rules[8].
Polímeros, 36(3), e20260036, 2026
Inorganic chemists soon followed suit. Tobe and Burgess[9] remarked that, although the known mechanisms of inorganic substitution reactions have been used to probe solvation and the effects of solvent structure, the effects of the medium have played an important role in understanding electron transfer mechanisms. With a wide array of solvents available, selecting the most suitable ones for a catalytic process can significantly improve reaction outcomes. From a synthetic perspective, solvents profoundly affect reaction equilibria, influencing the formation of different isomers, reaction rates, and mechanisms[10]. However, the scission mechanism remains ambiguous. Schmid and Rommel[11] suggested that ultrasonic irradiation-induced polymer breaking was caused by friction between solvent and polymer molecules. Conversely, others claimed that cavitation is crucial for polymer chain scission. Researchers have demonstrated that cavitation is not always required for scission, suggesting that frictional forces between the solvent and polymer chain can be effective causes. Nonetheless, the interaction between polymer molecules in solution during rupture is still not completely understood. While numerous studies on the effects of solvents have yielded fascinating results, the influence of solvent variation on the rate and extent of degradation remains unclear.
1/6
O O O O O O O O O O O O O O O O
Freitas, A. R., Gaffo, L., & Muniz, E. C. This study aimed to assess the effect of four different solvents and their properties on the degradation of a polychloroprene and natural rubber blend in a solution catalyzed by FeCl3·6H2O. The dilute solution viscometry (DSV) technique was employed to evaluate changes to the polymer chains in solution. Efflux time measurements were taken using different solvents and correlated with their respective properties.
at a constant temperature, may be directly related to the degradation of the macromolecular chains[12-14]. Curves of the normalized efflux time of PCP/NR-FeCl3·6H2O in different solvents are presented in Figure 1. The normalized efflux times presented in Figure 1 were normalized using Equation 1,
2. Experimental Procedure
where TT=0 is the efflux time before the beginning of the reaction, i.e., t=0 is the moment when the FeCl3·6H2O/THF solution was poured into the viscometer containing the PCP/NR solution. TT and TR,T are the efflux times measured at time t and their respective normalized values. According to Varghese and Mushrif[15], the effect of solvents on catalytic reactions may manifest as enhanced reactivity or improved product selectivity. Freitas et al.[14] demonstrated that PCP may be degraded in a toluene solution with FeCl3·6H2O when exposed to polychromatic light, a reaction characterized as a photoFenton process[14]. Dragunski et al.[12] state that the ability of FeCl3 to generate free radicals at ambient temperature is lower than its effectiveness as a Lewis acid. FeCl3 is hygroscopic and can generate protons in the presence of trace amounts of water[16], according to the following reaction:
2.1 Materials A commercial sample of polychloroprene (PCP) was provided by Proquimil (Brazil), and FeCl3.6H2O was purchased from Sinth (Brazil). Both chemicals were used without further purification. Natural rubber (NR, Hevea brasiliensis) was purified by precipitation from toluene solution (3% w/v) into excess ethanol. The precipitate was dried under reduced pressure at room temperature. The dried sample was stored in the dark at -4 °C to prevent oxidation. Toluene and benzene were purchased from Synth (Brazil). Chloroform and tetrahydrofuran (THF) were purchased from Nuclear (Brazil). All solvents were of analytical grade and used as received. A commercial fluorescent lamp (low-pressure mercury and argon stream, 9 W) was used as a polychromatic light source.
2.2 Solvent influence on PCP/NR-FeCl3·6H2O reaction The effect of solvents on the degradation of PCP was examined through efflux time measurements using a Ubbelohde suspended-level glass capillary viscometer, Cannon (100/E534). A 2.5% (w/v) PCP/NR solution was prepared by dissolving the polymer in a test tube under constant stirring for 24 hours. Four stock solutions were created, each using an appropriate solvent (Toluene, THF, Benzene, and chloroform). A FeCl3·6H2O solution was freshly prepared by dissolving the solute in THF to achieve a 5% (w/v) concentration. Precisely 1.0 mL of this solution was added to 10.0 mL of the PCP/NR solution (from one of the four stock solutions) that was already in the viscometer. After brief homogenization, efflux times were recorded every 15 minutes until the reaction reached a total duration of 510 minutes. This experiment was repeated for each of the four solvents.
TR,t =
Tt Tt = 0
(1)
FeCl3 + H 2O FeCl2OH − + H +
(2)
These protons may interact with the double bonds of polyisoprene or polybutadiene and resulting in intermediates of varying stability[17]. The results presented in Figure 1 indicate that degradation occurs in all solvents, with the most pronounced effects observed in benzene. This finding aligns with those of Abdel-Bary et al.[18]. Based on the data from Figure 1 and the observations of these researchers, it is evident that NR-PCP photodegradation progresses more readily in benzene than in toluene, and more rapidly in toluene than in THF or chloroform. This trend suggests the solvent’s active involvement in the photoinduced reaction. Solvents can influence such reactions in several ways.
3. Results and Discussion 3.1 Efflux time measurements Efflux time measurement is a very useful technique for investigating polymer degradation because the viscosity of polymer solutions is generally higher than that of the respective low-molecular-weight compound solutions with comparable concentrations (mass/volume) of a given solvent. The high viscosity of polymer solutions is often due to the friction among the chains, and for polymers with high molecular weights, it is mainly due to polymer chain entanglements[12]. Large friction and an increased number of entanglements cause an increase in flow resistance and, consequently, in viscosity. In the absence of aggregation effects, a reduction in the viscosity of a polymer solution, 2/6
Figure 1. Normalized efflux time as a function of reaction time for the PCP-NR/FeCl3.6H2O system in different solvents. Polímeros, 36(3), e20260036, 2026
Degradation of polychloroprene/natural rubber blend by photo-Fenton process. II-A solvent effect Macromolecules may interact with inert solvent molecules through energy transfer. For this to occur, the acceptor must possess an appropriate energy level, one that is lower than the excited state of the donor. The transferred excitation energy may induce chemical changes or dissipate non-radiatively. As Abdel-Bary et al.[18] noted, a protective effect may arise when the excitation energy of the polymer molecules (P*) is transferred to the solvent (S):
P* + S → P + S *
(3)
whereas a high quantum yield is expected when the solvent transfers its excitation energy to the polymer
P + S * → P* + S
(4)
The chemical structure of the solvent determines the frequency of such interactions and influences whether the photodegradation process is retarded or sensitized. As can be inferred from the results in Figure 1, the ability of the investigated solvents to dissipate excitation energy follows this order: xylene > toluene > benzene. This hierarchy closely resembles the order of decreasing chain transfer constants of the corresponding solvents during free radical polymerizations of vinyl monomers.
The data set shows a linear adjustment for all curves, indicating that the process follows first-order kinetics. This result characterizes the degradation process as time-dependent with respect to a first-order kinetic. Since a satisfactory correlation was not obtained when the data set was treated as a first-order kinetic in the studied interval (515min), a second-order kinetic was considered. The following approach was used in this sense. The relationship[19,20] between DP n and time t in a random degradation process is given by:
− ln(1 −
1 DP n,t
) =kt − ln(1 −
1 DPn,0
)
(8)
where DP n,t and DP n,0 are the number-average degrees of polymerization at t = t and t = 0, respectively, and k is the rate constant. According to Sato and Nelepa[21], Equation 5 can be transformed to
1 1 = + k ′t M n,t M n,0
(9)
3.2 Kinetics According to Freitas et al.[13], the first-order kinetics can be evaluated using the following velocity law:
a kt = ln 0 a0 − x
(5)
where a0 is the initial reactant concentration, ( a0 − x ) is the remaining reactant at time t, and k is the rate constant. According to the literature, if contributions of entanglements are not considered and the temperature is constant and there are no aggregates, the efflux time should be proportional to the polymer molar mass ( M n,0)[1]. Then, Equation 5 can be rewritten taking M n,0 as the initial reactant concentration, M n,0 − x is the concentration of the remaining reactant at time t, and k is the rate constant, then the Equation 5 may be rewritten as follows:
(
)
1 kt = ln Mn, t
Figure 2. Curves of efflux time data treated according to Equation 7 as a function of reaction time.
(6)
In according with the literature M n,t = TR,t, therefore the Equation assume a form:
1 kt = ln TR,t
(7)
When the data set presented in Figure 1 is treated using Equation 7 over the entire time interval (510 min), no linear adjustment is obtained, regardless of the solvent used (Figure 2). It suggests that the degradation process does not follow first-order kinetics in this time interval. On the other hand, when the time interval was reduced to 150 min (Figure 3). Polímeros, 36(3), e20260036, 2026
Figure 3. Curves of efflux time data treated according to Equation 7 as a function of reaction time. 3/6
Freitas, A. R., Gaffo, L., & Muniz, E. C. where M n,t e M n,0 are the number-average molecular weight of the polymer at t = t and t = 0, respectively. According to the literature, if contributions of entanglements are not considered, and the temperature is constant and there are no aggregates, the efflux time should be proportional to the polymer molar mass[1]. Taking M n,0 as the initial reactant concentration, (MN,0 - x) is the concentration of the remaining reactant at time t, and k is the rate constant, Equation 6 can be rewritten as:
kt =
(
x
M n,0 M n,0 − x
)
(10)
By analogy, in this work, the following relations were used: MN,0 is equivalent to 1.0; the value of x at reaction time t is equivalent to (1-TR,T), and the value of (MN,0 -x) is equivalent to TR,T. Then, Equation 4 can be rewritten as follows:
kt =
(1 − TR,t ) TR,t
in solvents with a null electric constant when compared to other solvents used in this study (Figure 1). Freitas et al.[13] observed similar behavior when studying polychloroprene degradation by FeCl3 in different solvents. Abdel-Bary et al.[18] studied the effect of the chemical structure of the solvents (benzene, toluene, and xylene) on the photo-oxidation of PCP in solution and verified that the photodegradation of PCP proceeded more readily in benzene than in toluene. In xylene, however, the reaction was slower than in toluene. According to Abdel-Bary et al.[18], this observation may indicate the solvent’s participation in photo-induced reactions, resulting in a protective effect when energy is transferred from excited polymer molecules to the solvent.
(11)
The order of reaction was evaluated using the curves presented in Figure 1 and Equation 11, which are related to the second. Evaluating the data set in Figure 1, now considering the second-order kinetic model (Equation 11, it was found that when benzene is used as solvent over a time interval of 510 minutes, applying Equation 11 to the data set did not yield a linear fit. This indicates that this reaction does not follow second-order kinetics, as illustrated in Figure 4. On the other hand, all curves (toluene, THF, and chloroform) produced linear adjustment, indicating that the process follows a second-order kinetic process. Using the same analogy applied when evaluating the first-order kinetic process with a reduced reaction time interval, the results of evaluating the second-order process are presented in Figure 5. It is possible to observe that, within a reduced period of time, all curves showed a linear adjustment. This process can be characterized as a second-order kinetics in this interval (200 min). From a kinetic point of view, this is an interesting process because the degradation reaction depends on the solvent and reaction time.
Figure 4. Curves of efflux time data treated according to Equation 11 as a function of reaction time.
3.3 Solvent properties Some researchers[22,23] report no effect of the solvent on the degradation of cellulose nitrate and polyisobutylene. However, many other investigators have found that the type of solvent has a significant effect on degradation rates. One such example is the oxidation of isopropanol to acetone on Pt nanoparticles, where the gas phase reaction is 5-10 times faster than the liquid phase reaction[24]. The addition of water to the same reaction mixture in the liquid phase increased the reaction rate by 4 times and the conversion by 8 times, demonstrating the impact of solvents on reactivity[15]. In this study, the effect of solvents on the degradation of the PCP-NR blend in the presence of FeCl3.6H2O was examined. Table 1 presents some properties of the solvent used in this study. Figure 1 shows the curves of PCP-NR degradation in different solvents. The polymer degradation is more pronounced 4/6
Figure 5. Curves of efflux time data treated according to Equation 11 as a function of reaction time.
Table 1. Solvent properties[2]. Solvent Benzene Chloroform THF Toluene
Properties Dielectric Constant 2.28 4.80 7.60 2.38
Dipole 0.00 1.10 1.75 0.40
Polímeros, 36(3), e20260036, 2026
Degradation of polychloroprene/natural rubber blend by photo-Fenton process. II-A solvent effect The authors analyzed how the dipole moment of solvents influences the kinetic stability and chemical reactivity of multi-donor-acceptor systems[29]. The influence of the solvent’s dipole moment was also evaluated in this study. When the dipole moment of a solvent in a solution decreases, it can lead to faster degradation processes. This occurs because a lower dipole moment results in weaker dipole-dipole interactions between solvent molecules. These weaker interactions can result in less stability and more susceptibility to external factors such as heat, light, or mechanical stress[7]. Figure 7 shows the degradation as a function of the solvent’s dipole moment. In a solution where the solvent has a lower dipole moment, the solute molecules may not be stabilized as effectively. Figure 6. Extent of PCP/NR degradation at 510 min as a function of the solvents’ dielectric constant values (surface tension values are described in Table 1).
This can lead to increased molecular motion and collisions, which can accelerate degradation processes[7]. The above data set demonstrates that the solvent greatly impacts the degradation process of a PCP-NR blend. This study also found that benzene is the most interesting solvent for the degradation process of a PCP-NR blend.
4. Conclusion
Figure 7. Extent of PCP/NR degradation at 510 minutes as a function of the solvents’ dipole moment values (surface tension values are described in Table 1).
A high quantum yield is expected if the solvent transfers the excitation energy to the polymer chains[14]. Figure 6 illustrates the correlation between the dielectric constant and the degradation of the polymer blend. In 1920, BORN[25] showed that the transfer of an ion from the gas phase to the solution phase is accompanied by a significant decrease in free energy, i.e., a stabilization of the ion, as the dielectric constant of the solvent increases. This study verified that, as the dielectric constant increases, degradation decreases. The degradation process follows a photo-Fenton reaction, the principal agent of which is a radical. The degradation process may be influenced by numerous factors, including the dipole moment of the solvent[26]; highlight that surfactants with lower dipole moments can enhance stability by reducing moisture in the perovskite precursor solutions[27]. This emphasizes how the solvent environment, including its dipole moment, can significantly impact reaction rates and stability. According to Ross and Sack[28], a higher dipole moment generally predicts higher stability and lower reactivity. Polímeros, 36(3), e20260036, 2026
The PCP/NR blend in solution degrades in the presence of FeCl3.6H2O, whether exposed to polychromatic light or not. The solvent plays an important role in this process. Degradation was favored in a solvent with null polarity (benzene). The degradation process did not show linear adjustment when the data set was treated as a first-order kinetic model, in the complete time interval (0-510min). However, linear fit was verified for all curves in the initial phase (200 min). The second-order kinetic model was also evaluated; in the initial phase (0-200 min), all curves presented linearity; however, when the reaction time increased (0-510 min), only two curves were linear (THF and toluene). It was found that degradation proceeds more efficiently in benzene than in other solvents. Compared to the other three solvents, benzene has lower dielectric and dipole constants and a higher surface tension.
5. Author’s Contribution • Conceptualization – Adonilson Reis Freitas • Data curation – Adonilson Reis Freitas • Formal analysis – Luciana Gaffo • Funding acquisition – Edvani Curti Muniz • Investigation – Adonilson Reis Freitas • Methodology – Adonilson Reis Freitas • Project administration – Edvani Curti Muniz • Resources – Edvani Curti Muniz • Software – Adonilson Reis Freitas • Supervision – Edvani Curti Muniz • Validation – Adonilson Reis Freitas • Visualization – Adonilson Reis Freitas • Writing – original draft – Luciana Gaffo • Writing – review & editing – Luciana Gaffo 5/6
Freitas, A. R., Gaffo, L., & Muniz, E. C.
6. Acknowledgements The authors thank the Conselho Nacional de Desenvolvimento Científico e Tecnológico e CNPq-Brazil (Proc. 521533/96-1) and PADCT III-CNPq and Brazil (Proc. 62.0042/01 0 QEQ) for research grants.
7. References 1. Pan, J., & Chen, X. (2015). Modelling degradation of amorphous biodegradable polyesters: basic model. In J. Pan (Ed.), Modelling degradation of bioresorbable polymeric medical devices (pp. 15-31). Sawston: Woodhead Publishing. https://doi.org/10.1533/9781782420255.1.15. 2. Reichardt, C. (2007). Solvents and solvent effects: an introduction. Organic Process Research & Development, 11(1), 105-113. https://doi.org/10.1021/op0680082. 3. Payehghadr, M., & Hashemi, S. E. (2017). Solvent effect on complexation reactions. Journal of Inclusion Phenomena and Macrocyclic Chemistry, 89(3-4), 253-271. https://doi. org/10.1007/s10847-017-0759-8. 4. Berthelot, M., & Pen de St. Gilles, L. (1910). Untersuchungen über die affinitäte: über bildung und zersetzung der äther. Annales de Chimie et de Physique, 173, 225-385. 5. Menschutkin, N. (1890). Über die Affinitätskoeffizienten der Alkylhaloide und der Amine. Zweiter Teil. Über den Einfluss des chemisch indifferenten flüssigen Mediums auf die Geschwindigkeit der Verbindung des Triäthylamins mit den Alkyljodiden. Zeitschrift für Physikalische Chemie, 6(1), 41-57. https://doi.org/10.1515/zpch-1890-0607. 6. Buncel, E., & Stairs, R. A. (2015). Solvent effects in chemistry. Hoboken: John Wiley & Sons. https://doi. org/10.1002/9781119044307 7. Atkins, P., Paula, J., & Keeler, J. (2023). Atkins’ physical chemistry. Oxford: Oxford University Press. https://doi. org/10.1093/hesc/9780198847816.001.0001 8. Ingold, C. K. Structure and mechanism in organic chemistry. Ithaca: Cornell University Press; 1968. 9. Tobe, M. L., & Burgess, J. (1999). Inorganic reaction mechanisms. Essex: Longman. 10. Dyson, P. J., & Jessop, P. G. (2016). Solvent effects in catalysis: rational improvements of catalysts via manipulation of solvent interactions. Catalysis Science & Technology, 6(10), 3302-3316. https://doi.org/10.1039/C5CY02197A. 11. Schmid, G., & Rommel, O. (1939). Zerreißen von Makromolekülen mit Ultraschall. Zeitschrift für Physikalische Chemie, 185A(1), 97-139. https://doi.org/10.1515/zpch-1939-18508. 12. Dragunski, D. C., Freitas, A. R., Rubira, A. F., & Muniz, E. C. (2000). Influence of iron(III) chloride on the degradation of the polyisoprene and polybutadiene. Polymer Degradation & Stability, 67(2), 239-247. https://doi.org/10.1016/S0141-3910(99)00119-6. 13. Freitas, A. R., Rubira, A. F., & Muniz, E. C. (2010). Polychloroprene degradation by a photo-Fenton process: the effect of solvent. Journal of Molecular Liquids, 157(2-3), 146-150. https://doi. org/10.1016/j.molliq.2010.09.004. 14. Freitas, A. R., Vidotti, G. J., Rubira, A. F., & Muniz, E. C. (2005). Polychloroprene degradation by a Photo-Fenton process. Polymer Degradation & Stability, 87(3), 425-432. https://doi.org/10.1016/j.polymdegradstab.2004.10.003. 15. Varghese, J. J., & Mushrif, S. H. (2019). Origins of complex solvent effects on chemical reactivity and computational tools to investigate them: a review. Reaction Chemistry & Engineering, 4(2), 165-206. https://doi.org/10.1039/C8RE00226F. 16. Dietrich, K. (1989). Organic polymer chemistry. From K. J. SAUNDERS. Second edition. ISBN 0-412-27570-8. 6/6
London/New York: Chapman and Hall 1988. Cloth, 502 pp., £ 29.50. Acta Polymerica, 40(12), 750. https://doi.org/10.1002/ actp.1989.010401213. 17. Dechant, J. (1990). Polymer handbook. 3rd edition. J. BRANDRUP and E. H. IMMERGUT (editors). ISBN 0-471-81244-7. New York/Chichester/Brisbane/Toronto/Singapore: John Wiley & Sons 1989. Cloth bond, ca. 1850 pages, £ 115.00, $175.00. Acta Polymerica, 41(6), 361-362. https://doi.org/10.1002/ actp.1990.010410614. 18. Sarhan, A. A., Abdel-Razik, E. A., & Abdel-Bary, E. M. (1987). The photodegradation of cis-1,4-polybutadiene, polystyrenebutadiene and polyisoprene. Journal of Photochemistry and Photobiology A Chemistry, 41(1), 127-139. https://doi. org/10.1016/1010-6030(87)80014-X. 19. Wall, L. A. (1955). Degradation of vinyl polymers. H. H. G. Jellinek. vol. III of Physical Chemistry, A series of monographs. Eric Hutchinson, Ed. Academic Press, New York, 1955. 329 pp. Illus. $8.50. Science, 122(3160), 163. https://doi.org/10.1126/ science.122.3160.163.b. 20. Grassie, N. (1956). Chemistry of high polymer degradation processes. London: Butterworths Scientific Publications. 21. Sato, T., & Katila, D. A. (1978). Oxidative degradation of cellulose derivatives in aqueous solution of chromic acid. Polymer Journal, 10(4), 433-436. https://doi.org/10.1295/polymj.10.433. 22. Thomas, B. B., & Alexander, W. J. (1957). Ultrasonic degradation of cellulose nitrate. II. Effects of temperature, solvent, and other process variables. Journal of Polymer Science, 25(110), 285-303. https://doi.org/10.1002/pol.1957.1202511004. 23. Price, G. J., & Smith, P. F. (1993). Ultrasonic degradation of polymer solutions: III. The effect of changing solvent and solution concentration. European Polymer Journal, 29(2), 419-424. https://doi.org/10.1016/0014-3057(93)90114-U. 24. Wang, H., Sapi, A., Thompson, C. M., Liu, F., Zherebetskyy, D., Krier, J. M., Carl, L. M., Cai, X., Wang, L.-W., & Somorjai, G. A. (2014). Dramatically different kinetics and mechanism at solid/liquid and solid/gas interfaces for catalytic isopropanol oxidation over size-controlled platinum nanoparticles. Journal of the American Chemical Society, 136(29), 10515-10520. https://doi.org/10.1021/ja505641r. PMid:24992695. 25. Born, M. (1920). Volumen und Hydratationswärme der Ionen. The European Physical Journal A, 1(1), 45-48. https://doi. org/10.1007/BF01881023. 26. Camacho-Cáceres, J., Millán-Franco, M. A., Mejía-Vázquez, M. C., Arias-Ramos, C. F., Corpus-Mendoza, A. N., RodríguezRivera, M. A., Nicho, M. E., Sotelo-Lerma, M., & Hu, H. (2023). Ionic surfactants of different dipole moments as anti-solvent additives for air-processing MAPbI3−xClx perovskite thin films. Journal of Materials Science Materials in Electronics, 34(36), 2263. https://doi.org/10.1007/s10854-023-11670-6. 27. Pliego, J. R., Jr. (2021). The role of intermolecular forces in ionic reactions: the solvent effect, ion-pairing, aggregates and structured environment. Organic & Biomolecular Chemistry, 19(9), 19001914. https://doi.org/10.1039/D0OB02413A. PMid:33554992. 28. Alarfaji, S., Al-Sehemi, A., & Pannipara, M. (2022). Solvent effect, dipole moment, and DFT studies of multi donor-acceptor type pyridine derivative. Open Chemistry, 20(1), 1494-1501. https://doi.org/10.1515/chem-2022-0248. 29. Ross, I. G., & Sack, R. A. (1950). Solvent effects in dipole moment measurements. Proceedings of the Physical Society. Section B, 63(11), 893-906. https://doi.org/10.1088/0370-1301/63/11/307. Received: July 05, 2025 Revised: June 14, 2026 Accepted: June 18, 2026 Editor-in-Chief: Sebastião V. Canevarolo Polímeros, 36(3), e20260036, 2026
São Paulo 994 St. São Carlos, SP, Brazil, 13560-340 Phone: +55 16 3374-3949 Email: abpol@abpol.org.br 2021
2026