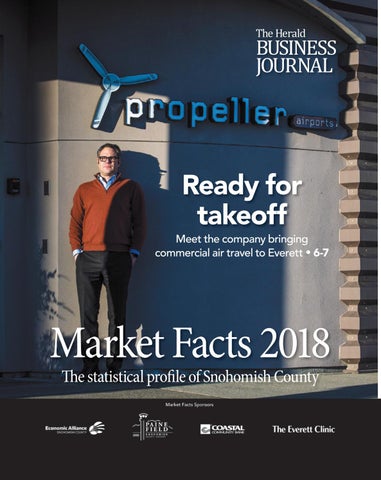
Ready for takeoff Meet the company bringing commercial air travel to Everett • 6-7
Market Facts 2018 The statistical profile of Snohomish County
2 THE HERALD BUSINESS JOURNAL – MARKET FACTS 2018
2007289
THE HERALD BUSINESS JOURNAL – MARKET FACTS 2018 3
TABLE OF CONTENTS
THANK YOU
to our investors! COURTESY OF WSU
These events that occurred in 2017 will shape the world of business in Snohomish County for decades to come. Pages 7-8
COVER STORY Thousands of details are going into the construction of the new air terminal at Paine Field, 6-7
BUSINESS NEWS
Taking stock of the publicly traded companies in Snohomish County. . . 5 A look at the major events in the county that will impact business. . 8-9 Leadership Snohomish County celebrates 20th anniversary . . . . . . 10 Snohomish County population could soon surpass 800,000. . . . . . . . . . . 12
STATISTICAL SNAPSHOT Breakdown of population by county, cities . . . . . . . . . . . . . . . . . . . . . . . . 13 Education, workforce training resources in Snohomish County . . . 14
Listing of banks with branches in county. . . . . . . . . . . . . . . . . . . . . . . 15 Wages, workforce averages for county. . . . . . . . . . . . . . . . . . . . . . . 16 Employment by sector over several years . . . . . . . . . . . . . . . . . . . . . . . . 17 Top public, private employers in county. . . . . . . . . . . . . . . . . . . . . . . 19 Unleaded gas and other energy prices over several years. . . . . . . . . 20 Selected social characteristics of county. . . . . . . . . . . . . . . . . . . . . . . 21 Commuting data for workers in county. . . . . . . . . . . . . . . . . . . . . . . 21 Selected demographic data for county in 2016. . . . . . . . . . . . . . . . . 23 Real estate prices for single-family homes, condos in 2017. . . . . . . 24-25 Housing permits in county over several years. . . . . . . . . . . . . . . . . . 26
NEWSROOM
ADVERTISING SALES
Editor: Jim Davis 425-339-3097; jdavis@heraldnet.com; businessnews@heraldnet.com
Sally Cravens 425-339-3054 Fax 425-339-3049 scravens@soundpublishing.com
Associate editor: Jocelyn Robinson
CUSTOMER SERVICE
Publisher Josh O’Connor 425-339-3007 joconnor@soundpublishing.com
SUBSCRIPTIONS 425-339-3200 www.theheraldbusinessjournal.com
425-339-3200 — Fax 425-339-3049 customersvc@heraldnet.com Send news, Op/Ed articles and letters to: The Herald Business Journal, P.O. Box 930, Everett, WA 98206, or email to businessnews@ heraldnet.com. We reserve the right to edit or reject all submissions. Opinions of columnists are their own and not necessarily those of The Herald Business Journal.
Interested in learning more about us? (P) 425.743.4567 info@economicalliancesc.org
COVER PHOTO Propeller Airports CEO Brett Smith outside of the company’s Everett offices. Ian Terry / The Herald
advocate • develop • connect 2005306
economicalliancesc.org
TULALIP 4 THE HERALD BUSINESS JOURNAL – MARKET FACTS 2018
SUCCESS IS BUSINESS MIXED
WITH PLEASURE Transform your meeting into an unforgettable event. Discover unrivaled luxury and flexible meeting spaces with state-of-the-art facilities - This is Tulalip.
3 0 M I N U T E S N O R T H O F S E AT T L E
888.272.1111 | TULALIPCASINO.COM 2009883
THE HERALD BUSINESS JOURNAL – MARKET FACTS 2018 5
How to get to Wall Street from here By Jim Davis
The Herald Business Journal
Funko joined a select club when it went public in November. The Everett toys and collectibles company became one of only eight publicly traded businesses headquartered in Snohomish County. Companies often sell stock to raise money for future expansion. In Funko’s case, the company cited paying down debt as one of the reasons to start trading on the Nasdaq stock exchange. It’s ticker symbol FNKO. Over the years, the number of publicly traded companies in the county have grown or shrunk for a variety of reasons, said Tim Raetzloff, who owns Abarim Computers in Edmonds. He has been tracking local stocks since the mid-1990s and until 2010 produced the Snohomish County Stock Index. At first, he wanted to keep track of his suppliers in the computer industry. Then he started tracking fluctuations of stock prices for county companies. He’s seen the number of publicly traded companies balloon to 15 at one point. That’s been whittled away as some companies were taken private and others have closed down. During the recession, three publicly traded banks went away — the bank holding companies for Frontier, Cascade and CityBank. Companies can even move headquarters. That’s what happened with Marina Biotech, which was based in Bothell but recently moved to City of Industry in California. Funko is the most recent company in the county to hold an initial public offering, or a sale of stock in the company. Headquartered at 2802 Wetmore Ave. in Everett, the company makes figurines of pop culture characters, from Marvel and DC Comics to Disney. Funko also makes apparel, home decor and stuffed animals. It had a disappointing launch in November, when it initially valued its stock at $12 a share. The price of a share promptly fell to just over $7 on that first day of trading. The stock market rebounded in December. Still, Funko comes in fourth in size of publicly traded companies in the county in terms of market cap, which is the value of the company figured by multiplying the per-share price by the total number of outstanding shares. As of early December, the company had a market cap of $449.3 million. The biggest publicly traded company in the county, by far, is Fortive. A relatively new company, Fortive broke off from industrial giant Danaher and opened its headquarters in 2016 at the Fluke campus in Everett. Fortive, which trades on the New York Stock Exchange under the ticker symbol FTV, had a market cap of $25.3 billion. Fortive owns more than two dozen smaller industrial companies, including Fluke. It’s not only the biggest publicly traded company headquartered in the county, but it’s also one of the biggest in the state.
PHOTO COURTESY OF NASDAQ
Funko CEO Brian Mariotti took his company public in 2017, joining just a handful of publicly traded companies based in Snohomish County.
Taking stock These eight publicly traded companies are headquartered in Snohomish County. Market valuation is as of Dec. 5. Company
City
Fortive Seattle Genetics Zumiez Funko FS Bancorp BioLife Solutions Neah Power Systems Seen on Screen TV
Everett Bothell Lynnwood Everett Ml Terrace Bothell Bothell Everett
Ticker symbol FTV SGEN ZUMZ FNKO FSBW BLFS NPWZ SONT
Market cap
Value of shares
$25.354 billion $8.067 billion $521 million $449.3 million $212 million $71.56 million $1.8 million $421,562
$74.23 $57.88 $21.35 $9.71 $57.50 $5.29 $0.0008 $0.001
Source: U.S. Securities and Exchange Commission; Yahoo Finance
Raetzloff notes that Fortive, by December, surpassed Paccar to become the sixth-largest company based in the state. It’s still behind Microsoft, Amazon, Costco, Starbucks and Weyerhaeuser. The second biggest publicly traded company in Snohomish County is Seattle Genetics, based in Bothell. It had a market cap of $8.067 billion in early December. Seattle Genetics is a biotech firm that’s one of the biggest in the Pacific Northwest. It’s developing several lines of drugs, but already has its cancer-fighting drug, Adcetris, on the market. Adcetris is used to treat Hodgkin’s lymphoma. It’s traded under the symbol SGEN. Adcetris is approved only to be used on
Hodgkin’s lymphoma patients who have failed other treatments. Seattle Genetics is seeking approval from the Food & Drug Administration to allow the drug to be used as a frontline treatment. If approved, that could cause the company’s value to soar. The third-largest company is Zumiez, which is based in Lynnwood. The youth-oriented clothing retailer went public in 2005 and is traded under the symbol ZUMZ. The market cap for the company was $521 million in early December. Zumiez operates 695 stores, including 607 in the United States, 51 in Canada, 31 in Europe and six in Australia. The company markets apparel and footwear for
skateboaders, snowboarders and surfers. The only bank that’s publicly traded and still based in the county is 1st Security Bank in Mountlake Terrace. It’s holding company is FS Bancorp. The company comes in fifth in the county in terms of market size at $212 million as of early December. It trades under the ticker symbol FSBW. The bank held its initial public offering in 2012. BioLife Solutions comes in next with a market cap of $71.56 million as of early December. Like Seattle Genetics, BioLife Solutions is also a Bothell-headquartered biotech company. The company bills itself as the leading developer, manufacturer and marketer of proprietary clinical grade cell and tissue hypothermic storage and cryopreservation freeze media. BioLife Solutions moved from Owego, New York, to Bothell a decade ago. The smallest two publicly traded companies in the county are Neah Power Systems and Seen On Screen TV. Neah Power Systems had a market cap value of $1.8 million in early December. The Edmonds company aims to change the way that batteries are made, used and perform. Seen On Screen TV is based in Everett and has a market cap of under a half million dollars. Seen On Screen TV bills itself as a global retailer selling products through websites and direct-response television advertising.
6 THE HERALD BUSINESS JOURNAL – MARKET FACTS 2018
COVER STORY
Air terminal is going to be ‘special’ Propeller CEO is shepherding thousands of details that go into look, feel of the project By Jim Davis
The Herald Business Journal
B
rett Smith has traveled a lot in his career. He’s been in and out of airports across the country. That’s given him valuable experience for his task at hand — developing Everett’s airport terminal. Smith is the founder and CEO of Propeller Airports, a for-profit company that’s building the commercial terminal at Paine Field. The terminal is scheduled to be finished in July and open in September. Two airlines, United and Alaska, have committed to flying out of it. In his travels, he’s seen beautiful, successful airports and ones that miss the mark. “The ones that are really good, a lot of thought has gone into it,” Smith said. “I can tell you that’s what I spend all of my time thinking about — Paine Field. It’s easy to put up a terminal, it’s hard to do it right.” The 27,000-square-foot, two-gate terminal between Paine Field’s administrative offices and the airport control tower was designed by Denver-based Fentress Architects and is being built by Fisher Construction Group of Burlington. The terminal should be popular. It can take an hour and a half or longer to get from Snohomish County to Seattle-Tacoma International Airport, the closest airport with scheduled air service. And Sea-Tac is becoming more crowded each year. Sea-Tac went from being the 13th-busiest airport in the U.S., with 20.1 million travelers in 2015, to the ninth-busiest, with 21.9 million travelers in 2016, according to data from the Federal Aviation Administration. Smith is not saying how much is being spent to build the Everett terminal. This is the first commercial passenger terminal for Propeller, which is leasing 11 acres from Snohomish County at Paine Field in exchange for $429,000 per year in rent, plus a share of flight and parking revenues. Smith has his hands in the thousands of details behind the look and feel of the terminal. He describes the project as having “a lot of glass, a lot of Pacific Northwest in it, a lot of wood, we really want it to match the region.” He also wants this airport to be one people choose not just because of proximity but also experience. He envisions the experience like that of
IAN TERRY / THE HERALD
CEO and founder of Propeller Airports, Brett Smith, stands in the construction site of his company’s new commercial airport terminal at Paine Field in Everett.
a hotel — people walk through the door into a lobby to meet a concierge. “Once you’re past security, you’ll walk into what looks like a living room with two fireplaces and a bar and a place to get something to eat,” Smith said. “There will be huge glass windows, you can look out onto the mountain range. I think it’s going to be special.” The terminal will feature two jet
bridges at the gates. Many smaller airports have people walk across the ramp to board the plane. That would save Propeller money. But it would also create a problem for travelers. “It rains a lot,” Smith said. “I don’t want people to go outside.” In fact, Propeller is splurging on glass jet bridges. “There’s such beautiful scenery, we’re
taking the extra step, we’re spending the extra money for glass so that by the time you walk into the terminal until the time you board the planes it will be pleasant experience,” he said. Building an air terminal from the ground up means the design can include the latest technology. For instance, he notes that most airports have only a handful of USB ports,
COVER STORY with small crowds huddled around them, trying to recharge their phones and devices. “You won’t have to do that here,” Smith said. “We’re doing painstaking measures to make sure every seat has it.” He’s not naming names for the restaurant or bar, but he said it won’t be what is seen in every airport. He said there will also be at least one or two coffee kiosks. “Can you not have a coffee bar in Seattle?” he joked. He said he’s been approached by car rental companies but hasn’t made any decisions on which ones will be in the terminal. Propeller is still determining the number of parking spaces. It will be a lot, not a parking garage. The company plans to offer valet parking. As a private company, Smith is trying to determine conveniences that travelers and business folks will be interested in. Maybe that means that travelers drop off their car with their laundry. When they return, they pick up their car and their freshly laundered clothing. Still, he notes there’s a balance between offering desired services and nickeling-and-diming customers. He wants to offer what travelers value and avoid making it feel like they’re opening their wallet at every turn. For instance, most airports charge a couple of dollars to lease luggage carts. The air terminal in Everett will offer the carts for free, Smith said. “We really want our customers to feel like they’re getting value for their money,” Smith said. Most of the airports in the U.S. are owned and operated by counties, cities or ports. Around the world, other airports have privatized such as Heathrow in London. Smith started in the software business, and he said he liked the business but he didn’t love it. Starting a business to build private airports is something he’s found that he loves. His company was looking for a place to build a private commercial air terminal and contacts at airlines mentioned Snohomish County. He then was approached by business people in the community. He flew in to stay at a hotel late on a Sunday night and drove from Sea-Tac to Mukilteo. “There’s no traffic at 10 o’clock on Sunday night, you can get here pretty quick if there’s zero traffic,” Smith said. “I was like, ‘Will this work?’ The next day, I missed three flights sitting in two hours of traffic and I’m like, ‘Now I understand.’” United announced six daily flights to its hubs in Denver and San Francisco. Alaska plans up to nine daily flights, but
THE HERALD BUSINESS JOURNAL – MARKET FACTS 2018 7
ARTIST RENDERINGS COURTESY OF PROPELLER AIRPORTS
The two-gate airport terminal being built by Propeller Airports at Paine Field will include two fireplaces, a bar and a restaurant and a full glass panel wall that will look onto the Olympic Mountains.
“The ones that are really good, a lot of thought has gone into it. ... It’s easy to put up a terminal, it’s hard to do it right.” — Brett Smith, Propeller Airports isn’t likely to announce specific destinations until early this year. Some possible contenders are thought to include Portland, Spokane, the Bay Area and southern California. Propeller has already reached out to Everett Transit and is planning a way for buses to drive to the airport and turn around, said Sabina Popa, program manager for the agency. Everett Transit already has one route that goes there throughout the day. Community Transit also has one route that stops by the new airport terminal, said Martin Munguia, a spokesman of the agency. The frequency of the route could go up once the airline schedules are released. Also, Community Transit is planning a Swift Line with stops several times an hour outside the terminal.
Alaska and United airlines have committed to flying out of the commercial passenger terminal at Paine Field. United plans to fly to hubs Denver and San Francisco. Alaska hasn’t announced its destinations.
Sound Transit is planning a light rail route that will run to the Boeing plant near Paine Field. Where the light-rail terminal will end — and how close it will be to the airport terminal — will be planned in 2020. Smith is cognizant that this terminal will serve thousands of Snohomish County travelers. “Seattle is not going to be listed in our
terminal. However, with that said, when you go to Expedia or go directly to Alaska (on the web), it will give you an option for all local airports,” Smith said. Inside the terminal, all signage will be about Everett. “This is Everett’s airport and that’s the end of it,” Smith said. Jim Davis: 425-339-3097; jdavis@ heraldnet.com; @HBJnews.
8 THE HERALD BUSINESS JOURNAL – MARKET FACTS 2018
YEAR IN REVIEW
Changing the business world forever Major news events in 2017 will impact the world of business in Snohomish County for decades to come By Jim Davis
Herald Writer
Each of these stories made major headlines in 2017, and the impacts will have a ripple effect in Snohomish County for years. Washington State University opened its Everett campus. Boeing started 777X production. Ground was broken for a commercial air terminal at Paine Field. The campus brings a major employer and attracts talent and youth to Everett. The plant ensures Boeing will retain a presence in the county for years to come. The terminal adds a vital transportation link that will help attract future businesses. The significance of each will be measured in the years to come. Here’s a look back at the biggest business news for the county in the past year:
1. WSU opens campus in Everett Very few things can change the face of a community like a college campus. That’s what Snohomish County leaders are banking will happen with WSU opening its doors in Everett. There’s an energy and excitement with a campus and the students it attracts. The fact that colleges double as a major employer is also a bonus. The four-story, $64.6 million glassand-brick building opened in August. The inaugural class of students started classes just days later. It’s small today. Only about 500 students are taking classes through WSU and its partner universities. But the campus building is big enough to grow to twice that number of students in the future. There already are discussions about the campus growing beyond this first building. Travel to any community with a college campus — Bothell, Bellingham, Tacoma — to see what the institution means to the surrounding community. Everett’s WSU campus is offering programs to complement existing businesses in the community — mechanical, electrical and software engineering, for instance. Some of the students taking those classes could begin their own businesses, creating the jobs far into the future.
2. Boeing starts production on 777X Boeing opened its first manufacturing
IAN TERRY / THE HERALD
Dr. Larry Schecter (left), associate dean for WSU North Puget Sound’s medical education programs, walks down the central staircase with Chancellor Paul Pitre at Washington State University Everett. The campus, which opened in 2017, will attract youth and talent to Everett and Snohomish County.
3. Air terminal cleared for takeoff at Paine Field
DAVE RZEGOCKI / THE HERALD
Boeing employees attend a gala at the composite wing center in October. The 777X started production in 2017, meaning that Boeing will retain a presence in Snohomish County for decades.
plant in Everett 50 years ago. With the new 777X program, it could be here for another 50. The aerospace company started assembly of the new wide-body jet at a stateof-the-art plant at the Everett factory at Paine Field. Test flights are expected in 2019, with delivery to airlines in 2020. The 777X builds on some innovations of the 787 that first flew in 2009. The aircraft will have the longest composite wings of any plane in the skies. Boeing agreed to build the 777X in
Everett after securing concessions from union machinists and state tax breaks that are expected to save the company an estimated $8.7 billion over several years. The company has said that 3,250 employees are expected to work on the program by 2018. Boeing workers realized the importance of the moment for the company as well as Everett and Washington. “I just wanted to be able to be a part of something that will help Boeing continue on for the next century,” rear spar mechanic Nick Just said.
It’s been a controversial topic for years in Snohomish County. Should a commercial air terminal open at Paine Field? This year, privately owned Propeller Airports got the OK to build the terminal. Alaska and United airlines both signed up to start flying out of Everett as soon as it opens. The scheduled opening is September. All of a sudden, travelers will no longer need to drive to Sea-Tac — a trip that can take a couple of hours or more from Everett. That’s appealing for business travelers who make up a large number of the passengers on many flight. It won’t be the deciding factor if a company decides to locate in Snohomish County or chooses to relocate elsewhere. But it could be one of the factors in any decision by a business.
4. Developer convicted of defrauding investors Lobsang Dargey will leave a legacy in Everett. During the recession, at a time when little development was occurring in the city, Dargey built a Potala Village, a mixed-use apartment and retail building, in downtown Everett. Then he started building Potala Place, another mixed-use project just a few blocks away. He had other projects in Seattle and the Eastside. From 2012 to 2015, Dargey and associ-
YEAR IN REVIEW
THE HERALD BUSINESS JOURNAL – MARKET FACTS 2018 9
ates raised $153.6 million from 282 Chinese investors. He was gaining a reputation for getting things done. But he was also defrauding investors and misusing tens of millions of dollars on trips to casinos and on personal purchases, including jewelry and a luxury home. In August, Dargey was sentenced to four years in prison and agreed repay $24.1 million to investors.
5. Median home sale price surpasses $400,000 For the first time, the median price for a homes climbed past $400,000 in Snohomish County. It broke that barrier in April and remained there through the fall. Location, of course, dictates prices, with homes closer to Seattle in the south county costing far more than homes in the north part of the county. But everywhere, home sale prices are higher now than before the recession. That’s led to questions about a housing bubble. One statistic that leads economists to downplay bubble fears: The area has seen a rapid growth, with more than 100,000 people moving into the county just in 10 years. That’s almost like adding another city of Everett.
IAN TERRY / THE HERALD
More than 2,000 people show up for a party with the opening of Funko’s flagship store in downtown Everett. The toys and collectibles company moved its headquarters to the downtown core in 2017.
6. Tulalips plan to build $100 million casino The Tulalip Tribes is one of the largest employers in Snohomish County. And many of those employees work at the tribes’ two casinos in Tulalip. This year, the tribes announced plans to spend $100 million on a replacement for Quil Ceda Creek Casino, the smaller of the two. The new casino will be 110,000-squarefeet on 15 acres across the street from the existing casino, at 6410 33rd Ave. NE in Tulalip. The casino will feature new entertainment and dining options, a spacious gaming floor and a 1,200-stall garage with a fast-ramp access. “About 68 percent of our workforce is non-tribal,” said Teri Gobin, vice chairwoman for the tribes. “What our businesses have done, what the casino has done, has not only benefited our community, it’s also benefited the surrounding communities and all of those businesses that have come up.”
7. A party the likes of which Everett had never seen It’s not every day that a company moves its headquarters to downtown Everett. And not very many companies are like Funko. The toys-and-collectibles maker went from a nondescript warehouse in a south Everett business park to the former Trinity Lutheran College, bringing a couple hundred creative workers to the city core. The company also opened a flagship store, a destination attraction with giantsized figures of pop culture characters, such as Marvel’s Spider-Man, Disney’s Malificient and Chewbacca of “Star Wars” outside. On the inside are worlds
to sell the medical group to kidney dialysis giant DaVita for $405 million. The deal was completed in 2016. The Everett Clinic kept its name and joined a corporation with deep pockets to fund expansion in the Puget Sound area. Just more than a year later, DaVita decided to get out of the medical group business. It struck a deal, pending regulatory approval, to sell all its medical groups, including The Everett Clinic, to Minnesota-based health insurer UnitedHealth Group. What this means for The Everett Clinic and its providers and patients remains to be seen.
CONTRIBUTED PHOTO
Construction was underway in 2017 on a major redevelopment of the Port of Everett’s central waterfront. The project is expected to bring a hotel, housing and shops to the area.
devoted to the best and geekiest of pop culture. Funko held a party for the grand opening, attracting celebrities and thousands of people from all over the world. That wasn’t all for this homegrown business. Funko’s CEO and president, Brian Mariotti, also took his company public in early November.
8. Port signs developers for housing, retail at waterfront Ten years ago, the Port of Everett worked with a developer on an ambitious plan to bring hundreds of condos to the Everett waterfront. Then the recession hit, and those plans fell apart. With the housing market recovered,
the port is again looking to bring people and businesses to the waterfront. The port wants to redevelop the central waterfront, and the project gained traction this past year as companies signed on to build a hotel and apartments and bring a mix of restaurants and shops. The waterfront development and scores of homes already being built along the Snohomish River could add hundreds of homes to the city of Everett on opposite sides of downtown.
9. The Everett Clinic sold for second time in two years The Everett Clinic was the largest independent medical group in Washington. That changed in 2015. The 250 physician-shareholders agreed
10. Everett Mall sold to California company Malls have been taking it on the chin in recent years with the rise of online retail. The Everett Mall is no different. The Macy’s store at the mall closed in the first few weeks after the 2016 holiday season. The storefront remained empty later in 2017. At least one company saw opportunity. California real estate investment firm Brixton Capital announced in October that it had purchased the mall for an undisclosed price. The 490,949-squarefoot mall, at 1402 SE Everett Mall Way, includes Sears, Regal 16 Cinemas, Burlington Coat Factory, Party, LA Fitness and other businesses. Jones Lang LaSalle Americas was selected to manage and lease the property. “Brixton Capital is very excited about the growth in the area and the long term sustainability of Everett Mall,” said Glen Bachman, the mall’s general manager, at the time of the sale. “We look forward to working with the new ownership to develop new strategies for the property.”
10 THE HERALD BUSINESS JOURNAL – MARKET FACTS 2018
Two decades of creating new leaders Leadership Snohomish County is celebrating its 20th anniversary this year By Jocelyn Robinson
For The Herald Business Journal
In the 20 years since Leadership Snohomish County formed, more than 600 people have made their way through the program. The goal of these alumni? To make Snohomish County a better place to live, work and play. Kathy Coffey, who has served as Leadership Snohomish County’s executive director for four years, believes those graduates will make an effort to improve their community. “We’ve created a network of individuals that care about where they live and want to make s difference,” she said. Board member Kurt Hintze said the program started in its current form in 1997 when several key leaders realized that the same people were on all of the boards and started to wonder who would replace them. Representatives of several local organizations, including the Boeing Co., the Chamber of Commerce and the United Way, came together to develop a leadership program modeled after similar programs across the state and the country. The program got to a turning point around 2005, Hintze said. At that time, recruitment into the program had started to lag. “The focus was on the class and not on how we could get a broader reach for the program,” said Hintze, who graduated from the program in 2003. The board developed the executive director position and eventually branched into its own nonprofit. Coffey was hired into the executive director role four years ago. Coffey came to Leadership Snohomish County after working in the academic field for 16 years. The executive director position turned out to be a good fit for her. “It aligns with my skill set and passion for community-building,” she said. “I’m helping people see their strengths and learning how to empower them. My definition of leadership is the empowering of others to make a difference in they best way the can.” Coffey noted that the outreach into the program had become somewhat Everett-centered in the early 2000s, with people in the program just one degree of separation from the Leadership Snohomish County board of directors. The program underwent a change in its application process; now, anyone can nominate anyone in the community. Coffey believes that has expanded the nonprofit’s reach. In addition, nominees often feel appreciated knowing that someone else has noticed their work. “People don’t take the time to say, ‘I
ANDY BRONSON / THE HERALD
Leadership Snohomish County Executive Director Kathy Coffey says people who take leadership roles in the community tend to stay in the community.
“All the work that leaders in the community are doing make this a healthier, more vibrant community for people.” — Angela Neubauer Edmonds Center for the Arts think you’re great,’” Coffey said. Since 2005, the number of applicants into the program has steadily increased. This year, there were 83 nominations for 65 spots in Leadership Snohomish County’s signature class. “It just grows every year because our economy is growing, with 200,000 people moving here in the next 10 years,” she said. LSC offers two classes for applicants: the Signature class, which is mostly for upper level managers, and the young professionals class, for people who may be in a mid-level management role. The young professionals class started seven years ago as a pilot program within Boeing. The class offers students the chance to learn how to manage and learn how to hone their leadership skills. Students do reading and develop a nonprofit project. “Once you’re involved in that work and you’ve done service, your chances of staying (in the community) increase because you have friends,” she said. “You understand where you are.” Leadership Snohomish County’s Sig-
nature program offers once a month classes on the different sectors in Snohomish County, including the courts, arts and heritage and health care. Angela Neubauer, the development manager at Edmonds Center for the Arts, graduated from the program this past summer. The connections she’s made through the program have been beneficial to her work, she said, as are the once-amonth luncheons Leadership Snohomish County holds for its alumni. Neubauer has researched the history of the program and said the idea for may actually stretch back to the early 1980s, when articles of incorporation were filed for a similar program. “The dedication to this work has really been alive in Snohomish County for quite a while now,” Neubauer said. Her research has led her to interview alumni from the program and others who have been involved throughout the years. Her favorite quote from one of her interviews was that “healthy communities don’t happen by accident.” “I think that is so true,” Neubauer said.
By the numbers 215 Community Impact Projects 23,650 hours of time to Snohomish County organizations 600 Alumni of the Signature and Young Professionals Programs 124 organizations have sent their employees through the program “All the work that leaders in the community are doing make this a healthier, more vibrant community for people.” Leadership Snohomish County plans to continue that work into the next 20 years, as more and more people move to Snohomish County. The board is planning an event for next April that takes a look at the next 20 years in the region. “It’s about who we are now and where we are going,” Coffey said. “Then once we define that, how do we build the bridge to get to that vision of where we’re going to be. “The Economic Alliance is really great at bringing businesses to our region to give the people who are moving here jobs,” she added. “But we need to make sure that those people have a place to live that’s desirable, with people invested in the community and it’s future. So we have to work together to get that done.”
THE HERALD BUSINESS JOURNAL – MARKET FACTS 2018 11
Snohomish County Employers
20,500 287,000 businesses
2
workers
By Employee Size share of employment
1
share of businesses
7.7%
0-4
66.6%
5-19
16.2%
29.4%
500+
9.0%
total jobs
Tulalip
29%
2,950
Top 10 Employers
Everett
Lake Stevens
Snohomish County Monroe
home to these corporations and brands fujifilm sonosite • philips healthcare • premera blue cross
6
Sultan
Lynnwood Edmonds snohomish county government
9
10
2,617 walmart 8 locations
2,312
Source: WA Employment Security Department
cascade coffee • electric mirror • funko • fortive
washington state government
includes colleges and Monroe Correctional Complex.
Marysville
goods-producing
Agriculture & Fishing 1% Fabricated Metal 5% Computer and Electronic 6% Other Manufacturing 12% Const., Mining & Logging 26% Aerospace 50%
5
3,200
Arlington
24% Trade, Transport, Utilities 20% Government 17% Education & Health Services 13% Leisure & Hospitality 13% Prof. & Business Services 5% Financial Services 5% Other Services 3% Information
287,000
2,987
Darrington
By Industry
serviceproviding
naval station everett
the tulalip tribes
Stanwood
0.2%
71%
3
34,500
100-499 1.4%
19.3%
4,775
the boeing company
22.8%
20-99
27.4%
4
providence regional medical center
the everett clinic
2,255
rick steve’s europe • SEATTLE GENETICS • zumiez
8 premera blue cross
2,600
7 edmonds school district
2,605
Snohomish County capitalizes on HQ2 RFP By: Patrick Pierce
OUR MISSION Economic Alliance Snohomish County exists to be a catalyst for economic vitality resulting in stronger communities, increased job creation, expanded educational opportunities, and improved infrastructure.
advocate • develop • connect (P) 425.743.4567 • info@economicalliancesc.org 808 134th St SW, Suite 101 • Everett, WA 98204 economicalliancesc.org
The dust has settled after the flurry caused by Amazon’s Second Headquarters (HQ2) search; amongst the 238 proposals was the Puget Sound Regional Proposal. Economic Alliance Snohomish County (EASC) partnered with counties, cities, educational institutions, and Tribes to showcase Snohomish County’s numerous assets. You may be thinking why bother? EASC recently conducted hundreds of interviews and surveys from business owners and community leaders. Two reoccurring themes emerged: continue to diversify our economy and promote our county’s growing number of assets. Capturing a share of the booming tech economy exploding in the region was not lost on anyone as both a means and ends to these goals. HQ2 provided an opportunity to promote our assets and exceptional sites in regional and national media, including a broadcast from the Arlington-Marysville Manufacturing Industrial Center, one of the largest
industrial properties in the entire region. Snohomish County is respected for its forthcoming commercial air service at Paine Field, the strength of our college and university system, over multi-billion road and transit investments, the relative affordability of our region, and our natural beauty. Our county continues to have strong aerospace and medical device industries, with over 36 and 12 times the national average of jobs, respectively. These industries make Snohomish County the center of innovation and help attract new industries (tech companies) which diversify our industry base and help our businesses compete globally. Submitting a proposal for HQ2 allowed us to highlight key sites for not only Amazon but other tech companies and leverage our assets. Yes HQ2 may be a long shot, but if we don’t “play” the game, we will never win. 2005307
12 THE HERALD BUSINESS JOURNAL – MARKET FACTS 2018
POPULATION
County population could pass 800,000 More than 100,000 people have moved to Snohomish County in just 10 years By Jim Davis
The Herald Business Journal
It’s just a number, but it’s a big number: 800,000. Snohomish County could reach that in population this year — if it
hasn’t already — if growth patterns keep pace with recent years. The county has been adding thousands of people each year, according to the Census and the Washington State Office of Financial Management.
The county has added just more than 100,000 people — that’s about the size of the city of Everett — during the past decade. The county saw a lull in growth during the recession, but has been gaining about 16,000 people each of the last three years. The county reached 789,400 people last year, according the state’s Office of Financial Management. To put that in perspec-
tive, Snohomish County is larger than four states — Wyoming, Vermont, Alaska and North Dakota — as well as the District of Columbia. The county seems likely to continue to grow. According to the Office of Financial Management, every city in Snohomish County gained at least some in population from 2015 to 2016. Large apartment complexes are being added in
Lynnwood, Mountlake Terrace and other south county cities. Everett is adding large housing developments both along the Snohomish River and potentially along the waterfront. The North Creek area between Mill Creek and Bothell has been labeled the hottest housing market in the state. The county labels this as a challenge in one of its recent reports on growth
NOTICING CHANGES IN MOM? Is your loved one in need of memory care due to Alzheimer’s or other cognitive impairments? We’re here to help you with this challenging transition. We offer: • Caregivers around the clock • Thoughtful interior design • Life enrichment programs • Restaurant-style dining • Support groups for families 2009607
Tour today! (425) 247-0715
4686 Pointes Drive Mukilteo, WA 98275
www.mukilteomemorycare.com
patterns. Growth hasn’t moved enough into cities such as Everett, Lynnwood and Bothell, which have services to handle growth. Instead, most of the population growth in the county — 53 percent between 2011 to 2016 — has been added in unincorporated parts of the county. In the past decade, growth slowed during the recession, but has picked up steam in the past three or four years. Since 2010, the county is averaging 10,886 new residents per year, according to the county. That’s only slightly more than the 10,731 new residents the county averaged between 2000 to 2010. And it’s also lower than the previous two decades; the county grew by 14,040 on average between 1990 and 2000 and 12,791 between 1980 and 1990. Percentage wise, the biggest growth gains for the county occurred between the 1950s and 1970s when the county grew at a clip of 4.4 percent each year. The county has grown at a more modest 1.5 percent since 2010. The county has added 13 percent of the state’s total population from 2010 to 2017, according to the county using figures from the Census and Washington State Office of Financial Management. Snohomish County remains the third largest county in the state behind King and Pierce counties. King County had a population of 2.153 million last year. Pierce County, which went over 800,000 in 2010, had a population of 859,400 last year. Snohomish County ranks as the 79th largest county in the U.S. and the 22nd largest county in the West. In the Pacific Northwest, including Washington, Alaska, Oregon and Idaho, the county ranks as the fourth largest county behind King, Pierce and Multnomah counties.
THE HERALD BUSINESS JOURNAL – MARKET FACTS 2018 13
SNOHOMISH COUNTY POPULATION, 2007-2017 Municipality
2017
2016
2015
2014
2013
2012
2011
2010
2009
2008
2007
Snohomish County
789,400
772,860
757,600
741,000
730,500
722,900
717,000
713,335
705,894
699,330
689,314
Unincorporated Snohomish County
349,800
338,995
330,260
320,335
312,500
308,445
304,435
302,292
329,476
326,382
321,055
Incorporated Snohomish County
439,600
433,865
427,340
420,665
418,000
414,455
412,565
411,043
376,418
372,948
368,259
Arlington
18,690
18,620
18,490
18,360
18,270
17,970
17,930
17,926
17,711
17,527
17,094
Bothell (part)
17,510
17,390
17,230
17,020
17,020
16,720
16,570
16,415
16,290
16,009
15,723
Brier
6,560
6,555
6,500
6,345
6,315
6,155
6,100
6,087
6,126
6,163
6,202
Darrington
1,400
1,350
1,350
1,350
1,350
1,345
1,345
1,347
1,365
1,371
1,380
Edmonds
41,260
40,900
40,490
39,950
39,950
39,800
39,800
39,709
39,846
39,828
39,758
Everett
109,800
108,300
105,800
104,900
104,200
103,300
103,100
103,019
102,520
101,413
100,980
Gold Bar
2,125
2,125
2,115
2,085
2,080
2,060
2,060
2,075
2,061
2,134
2,109
Granite Falls
3,485
3,395
3,390
3,390
3,385
3,380
3,370
3,364
3,359
3,274
3,186
Index
175
165
160
180
180
180
180
178
166
165
166
Lake Stevens
31,740
30,900
29,900
29,170
28,960
28,510
28,210
28,069
15,483
15,233
13,996
Lynnwood
36,950
36,590
36,420
36,030
35,960
35,900
35,860
35,836
35,430
35,411
35,279
Marysville
65,900
64,940
64,140
62,600
62,100
61,360
60,660
60,020
39,628
39,019
37,875
Mill Creek
19,960
19,900
19,760
18,780
18,600
18,450
18,370
18,244
18,036
17,526
17,442
Monroe
18,350
18,120
17,620
17,660
17,510
17,390
17,330
17,304
17,272
17,038
16,701
Mountlake Terrace
21,290
21,090
21,090
20,530
20,160
20,090
19,990
19,909
20,009
20,084
20,082
Mukilteo
21,240
21,070
20,900
20,540
20,440
20,360
20,310
20,254
20,210
20,161
20,049
Snohomish
10,010
9,625
9,385
9,270
9,220
9,215
9,200
9,098
8,926
8,841
8,829
Stanwood
6,785
6,635
6,585
6,530
6,340
6,300
6,220
6,231
6,073
5,885
5,593
Sultan
5,030
4,860
4,680
4,665
4,660
4,660
4,655
4,651
4,624
4,600
4,564
Woodway
1,340
1,335
1,335
1,310
1,300
1,310
1,305
1,307
1,283
1,266
1,251
SOURCE: WASHINGTON STATE OFFICE OF FINANCIAL MANAGEMENT
Count The Ways Your Business Can Save! Snohomish County PUD is here to help every type of business – large and small – find energy savings to help reduce your operating costs. Check our website or call for details about our rebates and custom incentives for: 1. HVAC & Controls, Heat Pumps & Thermostats 2. Advanced Rooftop Controllers & Variable Speed Drives 3. Compressed Air, Process Systems, & Engine Block Heaters 4. Refrigeration & Commercial Kitchen Equipment 5. Insulation & Windows (for electrically heated facilities) 6. Other Energy-Saving Opportunities
snopud.com • 425.783.1700 2005309
14 THE HERALD BUSINESS JOURNAL – MARKET FACTS 2018
EDUCATION AND WORKFORCE TRAINING Four-Year Universities Washington State University Everett Offers seven bachelor’s degrees available for juniors and seniors at a campus that opened in 2017. Phone: 425-405-1600 Email: everett.admission@wsu.edu Address: 915 N Broadway Everett, WA 98201 Website https://everett.wsu.edu/
Central Washington University-Lynnwood Partnership allows students to earn first two years of a bachelor’s degree at community college and complete a bachelor’s degree at CWU-Lynnwood. Phone: 425-640-1574 Email: cwu_lynnwood@cwu.edu Address: Snoqualmie Hall 20000 68th Ave. W Lynnwood, WA 98036 Website: www.cwu.edu/lynnwood/
Community Colleges
University of Washington Bothell
Everett Community College
Fastest-growing four-year public university with more than 5,000 students and 45 undergraduate and graduate degree programs. Phone: 425.352.5000 Email: uwbinfo@uw.edu Address: 18115 Campus Way NE Bothell, WA 98011-8246 Website: www.uwb.edu
Offers associate degrees in a variety of programs as well as transferable credits for up to 19,000 students a year. Phone: 425-388-9100 Email: admissions@everettcc.edu Address: 2000 Tower Street Everett, WA 98201 Website: www.everettcc.edu/
Edmonds Community College University Center of North Puget Sound Partnership of several colleges and universities to provide bachelor and graduate degrees for residents of north Snohomish, Island and Skagit counties. Phone: 425-405-1600 Email: everett.admission@wsu.edu Address: 915 N. Broadway Everett, WA 98201 Website: https://everettuc.org/
Offers one bachelor of applied science degree, 63 associate degrees and 64 professional certificates with more than 10,000 students a year. Phone: 425-640-1459 Email: admissions@edcc.edu Address: 20000 68th Ave. W Lynnwood, WA 98036 Website: www.edcc.edu/
Cascadia Community College Newest community college in the state,
which shares a campus with the UW Bothell and had an enrollment of 4,764 students in 2014-15. Phone: 425.352.8000 Email: info@cascadia.edu Address: 18345 Campus Way NE Bothell, WA 9801 Website: www.cascadia.edu
Aerospace-Advanced Manufacturing Training Advanced Manufacturing Training & Education Center Phone: 425-388-9570 Email: mfg@everettcc.edu Address: 909 N. Broadway Everett, WA 98201 Website: www.everettcc.edu/ccec/amtec
Center of Excellence for Aerospace and Advanced Manufacturing Phone: 425-388-9454 Address: 9711 32nd Place West, Bldg. C-80 Paine Field Everett, WA 98204 Website: www.coeaerospace.com
Washington Aerospace Technical Training and Research Center Phone: 425-347-8928 Email: watrc@edcc.edu Address: 3008 100th St. SW Everett, WA 98204
Website: washingtonaerospace.com
Embry-Riddle Aeronautical University Phone: 425-259-8939 Email: Everett@erau.edu Address: Embry-Riddle Aeronautical University C/O Applied Technology Training Center 2333 Seaway Blvd. Room 226 Everett, WA 98203 Website: https://worldwide.erau.edu/ locations/everett/
Workforce Training Workforce Snohomish Develops a plan that meets the needs of employers and job-seekers, sets standards for workforce training providers and oversees WorkSource Centers Phone: 425-921-3423 Address: 808 134th St. SW, Suite 105 Everett, WA 98204 Website: www.workforcesnohomish.org
Washington Workforce Training and Education Coordinating Board Oversees a workforce development system that includes 16 education and training programs. Phone: 360-709-4600 Email: workforce@wtb.wa.gov Address: 128 10th Avenue SW Olympia, WA 98504-3105 Website: http://wtb.wa.gov/ SOURCE: SNOHOMISH COUNTY
ROSANNE CASH DUO
Thursday, January 25, 2018 | $34–$69 Rosanne Cash has earned four GRAMMY® Awards and was inducted into the Nashville Songwriters’ Hall of Fame in 2015. Her latest release, The River and the Thread, is a collaboration with husband John Leventhal, who will be joining her on the ECA stage.
CANTUS:
DISCOVERY OF SIGHT
Thursday, February 15, 2018 | $19–$49 Vocal ensemble Cantus is widely known for its trademark warmth and blend as well as innovative programming. At its heart, Discovery of Sight revels in the mystery, science, and poetry of what it means to truly “see.”
MICHAEL FEINSTEIN
Saturday, February 24, 2018 | $59–$94 Michael Feinstein has built a dazzling career over the last three decades bringing the music of the Great American Songbook to the world. His work as an educator and archivist define Feinstein as one of the most important musical forces of our time.
ec4arts.org | 425.275.9595 410FOURTHAVENUENORTH EDMONDSWA98020 2007770
If you can find a piano of this status and condition for a lower price - BUY IT!
Probate/ Estate Sale of Vintage Grand Pianos Professionally rebuilt vintage pianos with genuine parts. 2011819
Your chance to view and play… ❋ Steinway “Model A” parlor grand 6’2” ❋ Steinway “Model B” classic grand 6’11” ❋ Steinway “Model O” living room grand 5’10.75” ❋ Steinway “Model D” concert grand 8’11.75” ❋ Steinway “Model M” studio grand 5’7” Or many others including Baldwin, Mason & Hamlin, Chickering, Knabe, Yamaha, Becstein & more!
Call 360-632-5440 to schedule a private showing by appointment at our showroom.
THE HERALD BUSINESS JOURNAL – MARKET FACTS 2018 15
SNOHOMISH COUNTY BANKS 1st Security Bank of Washington 6920 220th St. SW, Ste. 300, Mountlake Terrace, WA 98043 Website: www.fsbwa.com Branches (Snohomish County): 4 Deposits (Snohomish County): $384 million Market share: 3.32 percent CEO: Joseph Adams
Bank of America 100 N Tryon St., Charlotte, NC 28202 Website: www.bankofamerica.com Branches (Snohomish County): 21 Deposits (Snohomish County): $2.56 billion Market share: 22.1 percent CEO: Brian T. Moynihan
Bank of Hope 3200 Wilshire Blvd., Suite 1400, Los Angeles, CA 90010 Website: www.bankofhope.com Branches (Snohomish County): 2 Deposits (Snohomish County): $192 million Market share: 1.66 percent CEO: Kevin S. Kim
Banner Bank 10 S. First Ave., Walla Walla, WA 99362 Website: www.bannerbank.com Branches (Snohomish County): 6 Deposits (Snohomish County): $186.5 million Market share: 1.61 percent CEO: Mark J. Grescovich
Coastal Community Bank 2817 Colby Ave., Everett, WA 98201 Website: www.coastalbank.com Branches (Snohomish County): 10 Deposits (Snohomish County): $578 million Market share: 5 percent CEO: Eric Sprink
Columbia State Bank 1301 A St., Tacoma, WA 98402 Website: www.columbiabank.com Branches (Snohomish County): 5 Deposits (Snohomish County): $122 million Market share: 1.06 percent CEO: Hadley S. Robbins
First Interstate Bank 401 North 31st St., Billings, MT
Website: www.firstinterstatebank.com Branches (Snohomish County): 1 Deposits (Snohomish County): n/a Market share: n/a CEO: Edward Garding
First Financial Northwest Bank 201 Wells Ave. S, Renton,WA 98057 Website: www.ffnwb.com Branches (Snohomish County): 2 Deposits (Snohomish County): $39.5 million Market share: 0.34 percent CEO: Joseph W. Kiley III
Heritage Bank 201 Fifth Ave., SW, Olympia,WA 98501 Website: www.heritagebanknw.com Branches (Snohomish County): 8 Deposits (Snohomish County): $417 million Market share: 3.61 percent CEO: Brian Vance
HomeStreet Bank 601 Union St., Ste. 2000, Seattle, WA 98101 Website: www.homestreet.com Branches (Snohomish County): 4 Deposits (Snohomish County): $223 million Market share: 1.93 percent CEO: Mark Mason
JPMorgan Chase Bank 1111 Polaris Parkway, Columbus, OH 43240 Website: www.jpmorganchase.com Branches (Snohomish County): 25 Deposits (Snohomish County): $1.76 billion Market share: 15.2 percent CEO: James Dimon
KeyBank National Association 127 Public Square, Cleveland, OH 44114 Website: www.key.com Branches (Snohomish County): 18 Deposits (Snohomish County): $582 million Market share: 5.04 percent CEO: Beth Mooney
Mountain Pacific Bank 3732 Broadway, Everett, WA 98201 Website: www.mountainpacificbank.com Branches (Snohomish County): 2 Deposits (Snohomish County): $187 million
The Bank of Washington
Market share: 1.62 percent CEO: Mark Duffy
MUFG Union Bank 400 California St., San Francisco, CA 94104 Website: www.unionbank.com Branches (Snohomish County): 7 Deposits (Snohomish County): $498 million Market share: 4.30 percent CEO: Stephen Cummings
Opus Bank 19900 Macarthur Blvd., 12th Floor, Irvine, CA 92612 Website: www.opusbank.com Branches (Snohomish County): 9 Deposits (Snohomish County): $497 million Market share: 4.30 percent CEO: Stephen H. Gordon
Pacific Crest Savings Bank 3500 188th St., SW, Ste. 575, Lynnwood, WA 98037 Website: www.paccrest.com Branches (Snohomish County): 1 Deposits (Snohomish County): $169.1 million Market share: 1.46 percent CEO: Sheryl Nilson
Peoples Bank 3100 Woburn St., Bellingham, WA 98226 Website: www.peoplesbank-wa.com Branches (Snohomish County): 5 Deposits (Snohomish County): $144.5 million Market share: 1.25 percent CEO: Charles LeCocq
Skagit Bank 301 East Fairhaven Ave., Burlington, WA 98233 Website: www.skagitbank.com Branches (Snohomish County): 1 Deposits (Snohomish County): $48.9 million Market share: 0.42 percent CEO: Cheryl R. Bishop
Sound Community Bank 2001 Fifth Ave., Seattle, WA 98121 Website: www.soundcb.com Branches (Snohomish County): 1 Deposits (Snohomish County): $41.7 million Market share: 0.36 percent CEO: Laura Lee Stewart
5901 196th SW, Lynnwood, WA 98036 Website: www.the-bank.com Branches (Snohomish County): 4 Deposits (Snohomish County): $140 million Market share: 1.21 percent CEO: Marty Steele
U.S. Bank 425 Walnut Street, Cincinnati, OH 45202 Website: www.usbank.com Branches (Snohomish County): 12 Deposits (Snohomish County): $710 million Market share: 6.14 percent CEO: Andrew Cecere
Umpqua Bank 445 SE Main Street, Roseburg, OR 97470 Website: www.umpquabank.com Branches (Snohomish County): 2 Deposits (Snohomish County): $85.9 million Market share: 0.74 percent CEO: Raymond P. Davis
UniBank 19315 Highway 99, Lynnwood,WA 98036 Website: www.unibankusa.com Branches (Snohomish County): 1 Deposits (Snohomish County): $85 million Market share: 0.73 percent CEO: Daniel C. Lee
Washington Federal 425 Pike St., Seattle, WA 98101 Website: www.washingtonfederal.com Branches (Snohomish County): 8 Deposits (Snohomish County): $393.6 million Market share: 3.4 percent CEO: Roy M. Whitehead
Wells Fargo Bank 101 N. Phillips Ave., Sioux Falls, SD 57104 Website: www.wellsfargo.com Branches (Snohomish County): 20 Deposits (Snohomish County): $1.48 billion Market share: 12.8 percent CEO: Timothy J. Sloan
SOURCE: FDIC (JUNE 30, 2017)
ROTARIANS
at your service
PRINT PRINT Steven B. Shea ATTORNEY AT LAW COPY COPY Office › Advertising › Full Color Office › Advertising › Full Color
Office › Advertising › Full Color
2010685
425.252.5898 425.252.5898 www.paccopy.com www.paccopy.com
2009936
3502 Broadway, Broadway,Everett Everett 3502 Fax 425.259.6802 Fax 425.259.6802 M-F 88 am-6 am-6 pm pm M-F
Black & White ›› Full Full Color Black Color Black&&White White › Full Color
Tabbing Tabbing ››Presort Presort ››NCOA NCOA ›› CASS CASS Tabbing › Presort › NCOA › CASS
* LOWEST GUARANTEE!* LOWEST PRICE PRICE GUARANTEE! GUARANTEE! * LOWEST PRICE
(425) 258-4242
1712 Pacific Avenue, Suite 101, Everett, WA 98201 whidbeysteve@msn.com P.O. Box 1269, Everett, WA 98206-1269
2010063
PRINT ❘ COPY ❘ MAIL PRINT ❘ COPY ❘ MAIL
16 THE HERALD BUSINESS JOURNAL – MARKET FACTS 2018
WAGE & EMPLOYMENT STATISTICS
Snohomish County median hourly wages, 2006-2016 Median Hourly Wage, All Industries, Unadjusted for inflation 2006
2007
2008
2009
2010
2011
2012
2013
2014
2015
2016
Snohomish County
$19.71
$20.53
$21.23
$22.33
$23.03
$24.09
$24.77
$25.03
$25.40
$24.17
$25.03
State less King County
$16.70
$17.26
$17.78
$18.32
$18.73
$19.04
$19.24
$19.57
$19.85
$20.24
$20.68
State
$18.68
$19.42
$20.11
$20.87
$21.01
$21.59
$21.68
$22.09
$22.61
$23.15
$23.91
Median Hourly Wage, Private Sector Snohomish County
$18.79
$19.64
$20.25
$21.28
$21.95
$23.24
$24.05
$24.47
$24.84
$23.42
$24.30
State less King County
$15.53
$16.03
$16.47
$16.89
$17.30
$17.67
$17.98
$18.28
$18.51
$19.00
$19.36
State
$17.76
$18.38
$18.98
$19.48
$19.92
$20.25
$20.56
$21.00
$21.48
$22.03
$22.72
Median Hourly Wage, All Industries, Adjusted for Inflation (Using U.S. PCE Deflator) Snohomish, All Industries
$23.04
$23.41
$23.49
$24.72
$25.09
$25.61
$25.84
$25.77
$25.77
$24.43
$25.03
Snohomish, Private Sector
$21.96
$22.40
$22.41
$23.56
$23.91
$24.71
$25.09
$25.20
$25.20
$23.67
$24.30
State Less King
$19.52
$19.68
$19.67
$20.28
$20.40
$20.24
$20.07
$20.15
$20.14
$20.46
$20.68
State
$21.83
$22.14
$22.25
$23.11
$22.88
$22.95
$22.62
$22.75
$22.94
$23.40
$23.91
SOURCE: EMPLOYMENT SECURITY DEPARTMENT
Workforce averages for Snohomish County, 2012-2017 2017
Average
Jan.
Feb.
March
April
May
June
July
Aug.
Sept.
Oct.
Nov.
Dec.
Civilian Labor Force
419,376
415,996
420,487
420,392
418,563
418,571
417,123
417,682
421,299
424,271
n/a
n/a
n/a
Total Employment
403,284
398,671
405,024
405,775
405,512
404,104
400,370
400,974
403,188
405,937
n/a
n/a
n/a
Total Unemp.
16,092
17,325
15,463
14,617
13,051
14,467
16,753
16,708
18,111
18,334
n/a
n/a
n/a
Unemp. Rate
3.80%
4.20%
3.70%
3.50%
3.10%
3.50%
4.00%
4.00%
4.30%
4.30%
n/a
n/a
n/a
Civilian Labor Force
412,178
401,905
409,685
411,009
411,064
411,340
413,569
414,570
414,824
416,340
415,166
414,002
412,662
Total Employment
394,217
382,224
389,995
391,653
394,841
394,378
395,155
395,814
396,866
398,357
398,167
396,492
396,665
2016
Total Unemp.
17,961
19,681
19,690
19,356
16,223
16,962
18,414
18,756
17,958
17,983
16,999
17,510
15,997
Unemp. Rate
4.40%
4.90%
4.80%
4.70%
3.90%
4.10%
4.50%
4.50%
4.30%
4.30%
4.10%
4.20%
3.90%
Civilian Labor Force
401,834
394,304
400,580
400,265
402,320
402,678
403,713
403,934
403,233
403,536
402,888
402,084
402,470
Total Employment
383,202
375,033
381,361
382,027
386,850
385,097
384,992
384,485
384,812
384,582
383,833
381,678
383,668
Total Unemp.
18,632
19,271
19,219
18,238
15,470
17,581
18,721
19,449
18,421
18,954
19,055
20,406
18,802
Unemp. Rate
4.60%
4.90%
4.80%
4.60%
3.80%
4.40%
4.60%
4.80%
4.60%
4.70%
4.70%
5.10%
4.70%
2015
2014 Civilian Labor Force
396,508
389,620
396,342
397,039
396,351
396,630
398,293
399,880
396,340
397,521
397,797
396,689
395,591
Total Employment
375,864
367,311
373,140
374,378
377,789
376,711
376,951
377,740
375,520
377,368
378,653
376,811
377,991
Total Unemp.
20,644
22,309
23,202
22,661
18,562
19,919
21,342
22,140
20,820
20,153
19,144
19,878
17,600
Unemp. Rate
5.20%
5.70%
5.90%
5.70%
4.70%
5.00%
5.40%
5.50%
5.30%
5.10%
4.80%
5.00%
4.40%
389,163
382,420
387,322
386,059
388,460
390,140
392,700
392,878
389,341
391,497
388,765
390,156
3902,21
2013 Civilian Labor Force Total Employment
366,928
357,716
363,852
363,885
369,414
369,648
369,487
369,618
366,857
369,103
366,528
367,574
369,452
Total Unemp.
22,235
24,704
23,470
22,174
19,046
20,492
23,213
23,260
22,484
22,394
22,237
22,582
20,769
Unemp. Rate
5.70%
6.50%
6.10%
5.70%
4.90%
5.30%
5.90%
5.90%
5.80%
5.70%
5.70%
5.80%
5.30%
385,500
379,154
384,698
385,789
385,735
387,693
388,542
388,549
385,069
387,505
385,573
384,105
383,582
2012 Civilian Labor Force Total Employment
356,761
346,239
351,885
354,152
358,351
358,471
357,711
357,693
356,788
360,947
360,108
358,796
359,988
Total Unemp.
28,739
32,915
32,813
31,637
27,384
29,222
30,831
30,856
28,281
26,558
25,465
25,309
23,594
Unemp. Rate
7.50%
8.70%
8.50%
8.20%
7.10%
7.50%
7.90%
7.90%
7.30%
6.90%
6.60%
6.60%
6.20%
SOURCE: EMPLOYMENT SECURITY DEPARTMENT
THE HERALD BUSINESS JOURNAL – MARKET FACTS 2018 17
EMPLOYMENT BY SECTOR
Snohomish County employment by sector for select years Total Nonfarm
2017
2014
2011
286,656
272,708
255,433
Total Private
246,467
234,500
218,175
Goods Producing
81,956
80,592
73,300
22,711
17,475
15,000
Construction of Buildings
3,789
3,033
2,533
Heavy and Civil Engineering Construction
2,178
1,692
1,608
Mining, Logging, and Construction
Specialty Trade Contractors Manufacturing Durable Goods
16,522
12,500
10,633
59,244
63,117
58,300
55,433
59,917
54,467
Wood Product Manufacturing
889
1,067
1,208
Fabricated Metal Product Mfg.
3,978
3,800
3,500
Computer and Electronic Product Mfg.
5,033
5,558
4,917
Aerospace Product and Parts Mfg.
39,633
43,942
40,350
Nondurable Goods Service Providing Trade, Transportation, and Utilities
3,811
3,200
3,833
204,7
192,117
182,133
47,956
45,417
42,558
Wholesale Trade
8,189
7,950
8,075
Retail Trade
35,044
33,258
30,600
Motor vehicle and parts dealers
4,900
4,250
3,792
Food and beverage stores
6,522
6,375
5,967
General merchandise stores
7,778
7,542
7,242
Transportation, Warehousing and Utilities
4,722
4,208
3,883
5,900
5,717
5,742
3,922
4,125
4,125
Information Telecommunications Financial Activities Finance and Insurance Credit intermediation Insurance carriers
12,956
12,167
11,442
9,522
9,133
8,317
3,133
3,300
3,467
6,100
5,567
4,633
3,433
3,033
3,125
27,233
23,65
21,375
Professional, Scientific and Technical Services
11,867
10,592
9,408
Architectural, Engineering and Related Services
2,300
2,217
2,217
Administration, Support, Waste Management and Remediation
13,922
11,775
10,742
Real estate and rental and leasing Professional and Business Services
Employment services Educational and Health Services Ambulatory health care services
4,556
4,083
3,067
34,056
32,85
31,592
12,167
11,008
10,483
Nursing and residential care
5,078
5,067
4,908
Social assistance
9,222
9,883
9,267
Leisure and Hospitality
26,067
24,092
22,400
3,456
3,517
3,642
Arts, entertainment and recreation Food services and drinking places
REALLY?
YES, REALLY.
MOBILE BRANCHES We will pick up deposits at any location in Snohomish County. Leave the driving to us and have more time to focus on what really matters - your business. So if your bank claims to offer convenient locations, consider switching to a bank that can put a branch anywhere you need one.
21,111
19,208
17,725
Other Services
10,344
10,017
9,767
EVERETT 3732 BROADWAY 425.263.3500
Government
40,189
38,208
37,258
Federal Government
2,144
2,108
2,275
LYNNWOOD 19705 HIGHWAY 99 425.493.5200
State Government
6,267
6,192
5,725
BALLARD 2244 NW 56th St 206.397.3110
3,178
3,142
2,642
31,778
29,908
29,258
MOUNTAINPACIFICBANK.com
15,444
14,408
14,050
State Educational Services Local Government Local Educational Services SOURCE: EMPLOYMENT SECURITY DEPARTMENT
Member FDIC 2009827
18 THE HERALD BUSINESS JOURNAL – MARKET FACTS 2018
Our true reward is a healthier community. The Everett Clinic is honored to receive the William O. Robertson Patient Safety Award of Excellence from the Washington State Medical Association, for addressing the opioid epidemic in our community. But we know our work is not done. We’ll continue to do whatever it takes to make our neighbors’ lives better through health and healing. everettclinic.com | wsma.org
1984599
THE HERALD BUSINESS JOURNAL – MARKET FACTS 2018 19
STATISTICAL SNAPSHOT
Snohomish County’s largest employers Company/Agency
Business Line
public/ private
Total 2017*
Zodiac Aerospace
Aerospace supplier; composites
private
675
The Boeing Company
Aircraft manufacturing
private
34,500
Community Transit
Public transit
public
651
Providence Regional Medical Center
Medical services
private
4,775
Electroimpact
Aerospace tooling & private automation
620
The Tulalip Tribes
Gaming, real estate, public gov’t services
3,200
FUJIFILM Sonosite
Medical devices
private
600
Naval Station Everett
U.S. Navy Base
public
2,987
Travis Industries
Manufacturing - fireplaces
private
600
Washington State gov’t*
State government
public
2,950
Arlington School District
School district
public
594
Snohomish County Government
County government public
2,617
Frontier Communications Northwest
Communications
private
564
Edmonds School District
School district
public
2,605
B/E Aerospace
private
550
Premera Blue Cross
Health insurer
private
2,600
aerospace supplier, interiors
Walmart ( 8 locations)
Retail
private
2,312
City of Lynnwood
City government
public
533
The Everett Clinic
Health care
private
2,255
AMT | Senior Aerospace
Aerospace parts
private
500
Everett School District
School district
public
2,195
Cadence Aerospace
Aerospace parts
private
440
Philips Healthcare
Ultrasound technology
private
2,000
Canyon Creek Cabinets
Manufacturing - furniture
private
440
U.S. federal gov’t**
Government, federal
public
2,000
Panasonic Avionics
Aircraft equipment
private
430
Health care
private
430
Swedish Medical Center - Edmonds campus
Health care
private
1,850
Cascade Valley Hospital & Clinics (SRH) Hos Brothers Construction
private
400
Mukilteo School District
School district
public
1,755
Construction contractor
Edmonds Community College
Higher education
public
1,516
Funko
private
400
Albertsons / Safeway (21 locations)
Retail - grocery
private
1,500
manufacturing - collectibles
Fred Meyer / QFC (18 loc.)
Retail - grocery
private
1,350
Electric Mirror
Manufacturing
private
360
Marysville School District
School district
public
1,341
Jamco
Aerospace interiors
private
350
Comcast
Telecommunications public
1,300
Zumiez
clothing, speciality retailer
private
350
Fluke Corp. (Fortive)
Electronic test & measurement
private
1,200
Romac
Foundry products
private
330
City of Everett
City government
public
1,193
Molina Healthcare of WA
Health insurance, HMO
private
320
Snohomish School District
School district
public
1,117
Community Health Center of SnoCo
Health care
private
300
Aviation Technical Services
Aircraft repair/ maintenance/parts
private
1,000
Honeywell Scanning and Mobility
Wireless data collec- private tion; RFID
300
Lake Stevens School District
School district
public
983
National Food Corp.
Food distribution
private
300
Snohomish PUD
Electric utility
public
972
CMC Biologics
Biopharmaceuticals
private
300
Everett Community College
Higher education
public
954
Lakewood School District
School district
public
281
Stillaguamish Tribe
Gaming, gov’t services, investments
public
750
Granite Falls School District
School district
public
261
Seattle Genetics
Biotechnology
private
700
Sultan School District
School district
public
254
Crane Aerospace & Electronics
Aerospace electronics
private
700
Macy’s
Retail
private
225
Tect Aerospace
Aerospace
private
220
Aerospace electronics
private
CEMEX
Sand/gravel mining operations
private
100
Esterline Control Systems
680
Public employers only snapshot The Tulalip Tribes
Gaming, real estate, gov’t services
Private employers only snapshot
3,200
The Boeing Company
Aircraft manufacturing
34,500
Naval Station Everett
U.S. Navy Base
2,987
Providence Regional Medical Center
Medical services
4,775
Washington state gov’t
State government
2,950
Premera Blue Cross
Health insurer
2,600
Snohomish County Government
County government
2,617
Walmart ( 8 locations)
Retail
2,312
Edmonds School District
School district
2,605
The Everett Clinic
Health care
2,255
Ultrasound technology
2,000
Everett School District
School district
2,195
Philips Healthcare
U.S. federal gov’t
Government, federal
2,000
1,850
Mukilteo School District
School district
1,755
Swedish Medical Center | Edmonds Health care campus
Edmonds Community College
Higher education
1,516
Albertson’s / Safeway (21 locations)
Retail - grocery
1,500
Marysville School District
School district
1,341
Fred Meyer / QFC (18 loc.)
Retail - grocery
1,350
Comcast
Telecommunications
1,300
SOURCE: ECONOMIC ALLIANCE SNOHOMISH COUNTY
20 THE HERALD BUSINESS JOURNAL – MARKET FACTS 2018
STATISTICAL SNAPSHOT
Seattle metro area unleaded fuel prices, 1999-2017 Year
Jan
Feb
Mar
Apr
May
Jun
Jul
Aug
Sep
Oct
Nov
Dec
1999
$1.06
$1.02
$1.06
$1.38
$1.40
$1.34
$1.39
$1.44
$1.43
$1.38
$1.36
$1.39
2000
$1.39
$1.43
$1.60
$1.69
$1.63
$1.59
$1.64
$1.64
$1.71
$1.72
$1.70
$1.66
2001
$1.59
$1.55
$1.55
$1.54
$1.58
$1.62
$1.59
$1.52
$1.66
$1.63
$1.49
$1.28
2002
$1.20
$1.17
$1.23
$1.43
$1.46
$1.46
$1.48
$1.49
$1.47
$1.41
$1.41
$1.38
2003
$1.39
$1.64
$1.86
$1.79
$1.63
$1.55
$1.60
$1.76
$1.88
$1.66
$1.59
$1.52
2004
$1.61
$1.67
$1.79
$1.90
$2.20
$2.27
$2.01
$1.93
$1.99
$2.06
$2.06
$1.92
2005
$1.81
$1.92
$2.15
$2.44
$2.43
$2.30
$2.44
$2.60
$2.88
$2.80
$2.50
$2.23
2006
$2.24
$2.29
$2.40
$2.76
$3.11
$3.11
$3.02
$3.00
$2.80
$2.53
$2.44
$2.57
2007
$2.60
$2.47
$2.76
$3.08
$3.36
$3.14
$2.96
$2.79
$2.88
$2.98
$3.20
$3.13
2008
$3.08
$3.16
$3.46
$3.57
$3.86
$4.29
$4.27
$3.98
$3.74
$3.12
$2.19
$1.81
2009
$2.01
$2.16
$2.15
$2.30
$2.51
$2.84
$2.70
$2.84
$2.91
$2.76
$2.82
$2.79
2010
$2.87
$2.81
$2.98
$3.05
$3.01
$2.94
$2.98
$3.07
$2.94
$3.01
$3.08
$3.15
2011
$3.23
$3.34
$3.70
$3.92
$3.99
$3.86
$3.78
$3.75
$3.86
$3.80
$3.67
$3.44
2012
$3.44
$3.57
$4.00
$4.08
$4.16
$4.00
$3.57
$3.81
$4.01
$3.96
$3.47
$3.34
2013
$3.37
$3.62
$3.80
$3.64
$3.83
$3.79
$3.82
$3.79
$3.66
$3.44
$3.24
$3.29
2014
$3.37
$3.31
$3.58
$3.75
$3.87
$3.93
$3.96
$3.83
$3.75
$3.40
$3.00
$2.83
2015
$2.30
$2.31
$2.85
$2.70
$3.00
$3.05
$3.14
$3.03
$2.73
$2.49
$2.41
$2.35
2016
$2.33
$2.02
$2.12
$2.25
$2.44
$2.57
$2.56
$2.49
$2.60
$2.64
$2.59
$2.47
2017
$2.69
$2.67
$2.73
$2.79
$2.44
$2.72
$2.70
$2.77
$2.95
$2.81
n/a
n/a
SOURCE: U.S. BUREAU OF LABOR STATISTICS, DECEMBER 2017
Seattle metro area natural gas, per therm, 2007-2017 Year
Jan
Feb
Mar
Apr
May
Jun
Jul
Aug
Sep
Oct
Nov
Dec
2007
1.437
1.437
1.437
1.44
1.44
1.44
1.44
1.44
1.44
1.264
1.264
1.267
2008
1.267
1.267
1.267
1.268
1.268
1.268
1.268
1.268
1.268
1.4
1.463
1.463
2009
1.463
1.457
1.457
1.463
1.463
1.438
1.438
1.438
1.438
1.206
1.206
1.206
2010
1.207
1.207
1.207
1.224
1.224
1.249
1.249
1.249
1.249
1.25
1.274
1.274
2011
1.275
1.275
1.275
1.301
1.307
1.307
1.307
1.307
1.307
1.306
1.253
1.253
2012
1.253
1.253
1.253
1.246
1.264
1.264
1.264
1.264
1.264
1.266
1.175
1.175
2013
1.176
1.176
1.176
1.176
1.169
1.169
1.188
1.188
1.188
1.19
1.195
1.195
2014
1.195
1.195
1.195
1.195
1.187
1.187
1.187
1.187
1.187
1.186
1.214
1.214
2015
1.216
1.216
1.216
1.216
1.253
1.25
1.25
1.25
1.25
1.252
1.056
1.056
2016
1.056
1.056
1.058
1.058
1.085
1.123
1.123
1.123
1.119
1.119
1.122
1.122
2017
1.122
1.122
1.122
1.122
1.122
1.149
1.150
1.150
1.150
1.150
1.150
n/a
SOURCE: U.S. BUREAU OF LABOR STATISTICS, DECEMBER 2017
Seattle metro area electricity per kilowatt hour, 2007-2017 Year
Jan
Feb
Mar
Apr
May
Jun
Jul
Aug
Sep
Oct
Nov
Dec
2007
$0.075
$0.075
$0.075
$0.076
$0.076
$0.080
$0.080
$0.080
$0.081
$0.080
$0.080
$0.080
2008
$0.080
$0.080
$0.080
$0.073
$0.082
$0.082
$0.082
$0.082
$0.082
$0.081
$0.080
$0.080
2009
$0.080
$0.080
$0.080
$0.082
$0.082
$0.082
$0.082
$0.082
$0.082
$0.082
$0.082
$0.082
2010
$0.085
$0.085
$0.085
$0.088
$0.089
$0.089
$0.090
$0.090
$0.090
$0.089
$0.088
$0.088
2011
$0.088
$0.088
$0.088
$0.089
$0.090
$0.090
$0.090
$0.090
$0.090
$0.089
$0.089
$0.089
2012
$0.089
$0.089
$0.089
$0.092
$0.093
$0.093
$0.093
$0.093
$0.093
$0.092
$0.092
$0.092
2013
$0.093
$0.092
$0.092
$0.095
$0.095
$0.095
$0.096
$0.096
$0.096
$0.095
$0.094
$0.094
2014
$0.096
$0.096
$0.096
$0.098
$0.099
$0.096
$0.096
$0.096
$0.096
$0.095
$0.095
$0.083
2015
$0.096
$0.096
$0.096
$0.098
$0.098
$0.102
$0.102
$0.102
$0.102
$0.102
$0.102
$0.102
2016
$0.103
$0.103
$0.103
$0.106
$0.108
$0.108
$0.108
$0.108
$0.108
$0.105
$0.105
$1.105
2017
$0.104
$0.106
$0.106
$0.106
$0.111
$0.112
$0.112
$0.112
$0.112
$0.112
$0.109
n/a
SOURCE: U.S. BUREAU OF LABOR STATISTICS, DECEMBER 2017
THE HERALD BUSINESS JOURNAL – MARKET FACTS 2018 21
STATISTICAL SNAPSHOT
Selected social characteristics of Snohomish County in 2016 Total population
758,649
Sex and age
52.20%
Divorced or separated
14.00%
Private wage and salary workers
81.80%
Widowed
4.50%
Government workers
12.60%
Male
50.10%
Female
49.90%
School enrollment
Under 5 years
6.30%
5 to 17 years
16.80%
Population 3 years and over enrolled in school
18 to 24 years
8.60%
25 to 44 years
28.10%
45 to 54 years
15.00%
55 to 64 years
13.10%
65 to 74 years
7.30%
75 to 84 years
3.30%
85 years and over
1.50%
Median age (years)
37.8
Race and Hispanic or Latino Origin
183,766
Self-employed workers in own not incorporated business Unpaid family workers
5.40% 0.20%
Poverty rates for families for whom poverty status is determined
Nursery school, preschool
6.20%
Elementary school (grades K-8)
47.00%
High school (grades 9-12)
22.10%
College or graduate school
24.70%
With related children of the householder under 18 years
9.80%
517950
With related children of the householder under 5 years only
9.70%
Population 25 years and over Less than high school graduate
8.20%
Educational attainment
All families
Married-couple family
6.20%
3.00%
24.20%
With related children of the householder under 18 years
4.00%
Some college or associate’s degree
37.00%
With related children of the householder under 5 years only
4.20%
Female householder, no husband present, family
21.50%
With related children of the householder under 18 years
30.00%
With related children of the householder under 5 years only
29.10%
High school graduate (includes equivalency)
One race
94.40%
Bachelor’s degree
21.20%
White
78.00%
Graduate or professional degree
9.40%
Black or African American
2.70%
American Indian and Alaska Native
1.00%
Asian
9.70%
Population 5 years and over
710,589
0.50%
English only
80.60%
Language other than English
19.40%
Speak English less than “very well”
7.60%
Native Hawaiian and Other Pacific Islander
Class of Worker
Now married, except separated
Language spoken at home and ability to speak English
Owner-occupied housing units
184,237
Some other race
2.60%
Two or more races
5.60%
Hispanic or Latino origin (of any race)
9.60%
Population 16 years and over
603,188
White alone, not Hispanic or Latino
72.00%
Less than 30 percent
71.90%
In labor force
67.60%
30 percent or more
28.10%
Civilian labor force
67.00% Renter-occupied housing units
94,389
Household type
Employment status
Monthly owner costs as a percentage of household income in the past 12 months
In married-couple family
64.00%
Employed
62.80%
In other households
34.60%
Unemployed
4.10%
Average household size
2.69
Percent of civilian labor force
6.20%
Average family size
3.2
Armed Forces
0.60%
Less than 30 percent
52.80%
Not in labor force
32.40%
30 percent or more
47.20%
Marital status Population 15 years and over
612,826
Never married
29.20%
Civilian employed population 16 years and over
Gross rent as a percentage of household income in the past 12 months
378916
SOURCE: U.S. CENSUS
Snohomish County commuting characteristics for 2016 Workers 16 years and over
374,583
Means of transportation to work
Worked in county of residence
63.70%
Less than 10 minutes
8.50%
Worked outside county of residence
35.60%
10 to 14 minutes
10.40%
Car, truck, or van
86.20%
Worked outside state of residence
0.60%
15 to 19 minutes
12.50%
Drove alone
75.00%
355,412
20 to 24 minutes
13.10%
Carpooled
11.20%
Workers 16 years and over who did not work at home
25 to 29 minutes
6.60%
In 2-person carpool
8.50%
30 to 34 minutes
14.70%
In 3-person carpool
1.50%
35 to 44 minutes
8.70%
In 4-or-more person carpool
1.10%
45 to 59 minutes
11.60%
Workers per car, truck, or van
1.08
60 or more minutes
13.90%
Mean travel time to work (minutes)
31.2
Public transportation (excluding taxicab)
5.30%
Time leaving home to go to work 12:00 a.m. to 4:59 a.m.
8.30%
5:00 a.m. to 5:29 a.m.
5.80%
5:30 a.m. to 5:59 a.m.
7.40%
6:00 a.m. to 6:29 a.m.
10.60%
6:30 a.m. to 6:59 a.m.
9.60%
Vehicles available
Walked
1.80%
7:00 a.m. to 7:29 a.m.
12.50%
Bicycle
0.40%
7:30 a.m. to 7:59 a.m.
8.70%
Taxicab, motorcycle, or other means
1.20%
8:00 a.m. to 8:29 a.m.
8.10%
No vehicle available
1.80%
Worked at home
5.10%
8:30 a.m. to 8:59 a.m.
4.70%
1 vehicle available
15.90%
9:00 a.m. to 11:59 p.m.
24.20%
2 vehicles available
40.60%
3 or more vehicles available
41.70%
Place of work Worked in state of residence SOURCE: U.S. CENSUS
99.40%
Travel time to work
Workers 16 years and over in households
374,583
22 THE HERALD BUSINESS JOURNAL – MARKET FACTS 2018
A place where you can
touch & feel your shopping treasures!
8825 34th Ave. NE Tulalip, WA 98271
Cabela’s
®
World’s Foremost Outfitter 116th St. NE
N Seattle Premium Outlets
Seattle Premium Outlets Tulalip Resort Casino
99th Place NE
Quil Ceda Boulevard
27th Ave. NE
105th St.
Legendary brands. Real savings.
Cabela’s
Home Depot Walmart Tulalip Bingo
QCV Retail Center
Walmart
®
Save money. Live better .
Quil Ceda Way
Use exit 200 or 202 and turn west. TDS-20929
Find us on Facebook and QuilCedaVillage.com
Home Depot
®
More saving. More doing. 2003788
STATISTICAL SNAPSHOT
THE HERALD BUSINESS JOURNAL – MARKET FACTS 2018 23
Selected demographic data for Snohomish County in 2016 Race One race 716,207 Two or more races 42,442 One race White 591,763 Black or African American 20,511 American Indian and Alaska Native 7,368 Cherokee tribal grouping 151 Chippewa tribal grouping 235 Navajo tribal grouping 327 Sioux tribal grouping 142 Asian 73,386 Asian Indian 10,486 Chinese 11,135 Filipino 12,952 Japanese 3,585 Korean 11,846 Vietnamese 11,443 Other Asian 11,939 Native Hawaiian and Other Pacific Islander 3,661 Native Hawaiian 840 Guamanian or Chamorro 502 Samoan 443 Other Pacific Islander 1,876 Some other race 19,518 Two or more races White and Black or African American 7,110 White and American Indian and Alaska Native 9,449 White and Asian 13,276 Black or African American, American Indian 1,093
Race alone or in combination with one or more White 629,462 Black or African American 32,138 American Indian and Alaska Native 20,899 Asian 91,506 Native Hawaiian and Other Pacific Islander 8,264 Some other race 23,415 Hispanic or Latino Hispanic or Latino (of any race) 72,859 Mexican 53,551 Puerto Rican 3,276 Cuban 935 Other Hispanic or Latino 15,097 Not Hispanic or Latino 685,790 White alone 546,155 Black or African American alone 19,427 American Indian and Alaska Native alone 6,061 Asian alone 72,714 Native Hawaiian and other Pacific Islander alone 3,599 Some other race alone 952 Two or more races 36,882 Two races including some other race 563 Two races excluding some other race 36,319 Total housing units 297,178 Voting age by population Citizen, 18 and over population 534,199 Male 267,135 Female 267,064 SOURCE: U.S. CENSUS
2009575
Total population 758,649 Male 380,430 Female 378,219 Under 5 years 48,060 5 to 9 years 47,509 10 to 14 years 50,254 15 to 19 years 46,594 20 to 24 years 48,282 25 to 34 years 108,102 35 to 44 years 105,206 45 to 54 years 113,574 55 to 59 years 53,127 60 to 64 years 46,300 65 to 74 years 55,263 75 to 84 years 25,132 85 years and over 11,246 Median age (years) 38 18 years and over 582,828 21 years and over 556,520 62 years and over 117,362 65 years and over 91,641 18 years and over 582,828 Male 290,416 Female 292,412 65 years and over 91,641 Male 40,567 Female 51,074
24 THE HERALD BUSINESS JOURNAL – MARKET FACTS 2018
REAL ESTATE
Snohomish County Northwest Multiple Listing Service area zones
Snohomish County home sales and prices, Oct. 2016-Nov. 2017 November 2017 Residential and condos
730
316
306
3.27%
$481,500
$415,975
15.75%
740
415
327
26.91%
$410,000
$355,000
15.49%
750
132
133
-0.75%
$390,000
$353,000
10.48%
MLS Area
Sales 2017
Sales 2016
% change Median price 2017
Median price 2016
% change
760
172
147
17.01%
$365,000
$343,763
6.18%
610
163
197
-17.26%
$625,000
$520,000
20.19%
770
241
275
-12.36%
$352,000
$314,950
11.76%
730
292
275
6.18%
$471,250
$395,000
19.30%
Total
1466
1431
2.45%
$430,000
$377,000
14.06%
740
437
333
31.23%
$391,000
$350,000
11.71%
Camano 46
52
9.62%
$438,500
$357,475
22.67%
750
132
150
-12.00%
$409,000
$368,850
10.89%
760
166
193
-13.99%
$365,500
$350,000
4.43%
August 2017
770
238
216
10.19%
$340,000
$317,500
7.09%
Residential and condos
Total
1428
1364
4.69%
$415,000
$369,950
12.18%
-4.44%
$414,875
$388,500
6.79%
MLS Area
Sales 2017
Sales 2016
% change Median price 2017
Median price 2016
% change
45
610
193
272
-29.04%
$638,000
$519,950
22.70%
October 2017
730
359
329
9.12%
$479,950
$406,000
18.21%
Residential and condos
740
498
373
33.51%
$425,000
$363,000
17.08%
750
150
116
29.31%
$398,500
$384,237
3.71%
760
199
180
10.56%
$390,000
$326,075
19.60%
Camano 38
MLS Area
Sales 2017
Sales 2016
% change Median price 2017
Median price 2016
% change
610
163
197
-17.26%
$625,000
$520,000
20.19%
770
249
268
-7.09%
$351,000
$319,475
9.87%
730
292
275
6.18%
$471,250
$395,000
19.30%
Total
1648
1538
7.15%
$430,000
$380,000
13.16%
740
437
333
31.23%
$391,000
$350,000
11.71%
Camano 57
55
14.55%
$440,000
$340,000
29.41%
750
132
150
-12.00%
$409,000
$368,850
10.89%
760
166
193
-13.99%
$365,500
$350,000
4.43%
July 2017
770
238
216
10.19%
$340,000
$317,500
7.09%
Residential and condos
Total
1428
1364
4.69%
$415,000
$369,950
12.18%
-4.44%
$414,875
$388,500
6.79%
MLS Area
Sales 2017
Sales 2016
% change Median price 2017
Median price 2016
% change
45
Camano 38
610
230
239
-3.77%
$609,600
$519,000
17.46%
September 2017
730
319
305
4.59%
$470,000
$444,000
5.86%
Residential and condos
740
469
412
13.83%
$410,000
$365,000
12.33%
750
145
124
16.94%
$433,000
$322,475
34.27%
760
166
198
-16.16%
$380,000
$330,432
15.00%
MLS Area
Sales 2017
Sales 2016
% change Median price 2017
Median price 2016
% change
610
190
243
-21.81%
$507,950
19.35%
$606,250
THE HERALD BUSINESS JOURNAL – MARKET FACTS 2018 25
770
227
237
-4.22%
$355,000
$312,000
13.78%
730
149
155
-3.87%
$424,000
$376,000
12.77%
Total
1556
1515
2.71%
$430,000
$385,000
11.69%
740
242
261
-7.28%
$379,450
$320,000
18.58%
44
20.45%
$345,000
$280,000
23.21%
750
94
82
14.63%
$367,000
$290,500
26.33%
760
112
89
25.84%
$349,450
$285,000
22.61%
June 2017
770
167
158
5.70%
$315,000
$279,975
12.51%
Residential and condos
Total
904
848
6.60%
$387,250
$327,500
18.24%
19
131.58%
$360,000
$329,000
9.42%
Camano 48
MLS Area
Sales 2017
Sales 2016
% change Median price 2017
Median price 2016
% change
Camano 25
610
229
247
-7.29%
$610,000
$521,800
16.90%
January 2017
730
321
305
5.25%
$469,000
$410,000
14.39%
Residential and condos
740
425
379
12.14%
$404,000
$372,000
8.60%
127
122
4.10%
$425,000
$348,500
21.95%
MLS Area
Sales 2017
Sales 2016
% change Median price 2017
Median price 2016
% change
750 760
175
193
-9.33%
$375,000
$319,950
17.21%
610
136
117
16.24%
$589,975
$490,000
20.40%
770
276
247
11.74%
$347,750
$305,000
14.02%
730
187
175
6.86%
$449,997
$424,950
5.89%
Total
1553
1493
4.02%
$420,000
$372,150
12.86%
740
227
219
3.65%
$350,000
$343,000
2.04%
56
8.93%
$405,000
$334,497
21.08%
750
95
90
5.56%
$340,000
$326,950
3.99%
Camano 69
760
115
85
35.29%
$342,950
$285,000
20.33%
May 2017
770
178
125
42.40%
$320,750
$297,950
7.65%
Residential and condos
Total
938
811
15.66%
$380,000
$351,500
8.11%
27
70.37%
$360,000
$365,000
-1.37%
MLS Area
Sales 2017
Sales 2016
% change Median price 2017
Median price 2016
% change
Camano 25
610
241
198
21.72%
$629,950
$507,975
24.01%
December 2016
730
256
274
-6.57%
$482,500
$420,000
14.88%
Residential and condos
740
367
360
1.94%
$395,000
$360,000
9.72%
145
124
16.94%
$411,500
$360,000
14.31%
MLS Area
Sales 2016
Sales 2015
% change Median price 2016
Median price 2015
% change
750 760
164
164
0.00%
$391,250
$320,000
22.27%
610
160
162
-1.23%
$571,225
$495,000
15.40%
770
221
266
-16.92%
$350,000
$309,500
13.09%
730
239
262
-8.78%
$432,000
$367,250
17.63%
Total
1394
1386
0.58%
$420,000
$367,250
14.36%
740
298
337
-11.57%
$359,975
$319,500
12.67%
41
85.37%
$379,750
$329,000
15.43%
750
104
113
-7.96%
$362,500
$309,000
17.31%
760
138
118
16.95%
$337,475
$324,475
4.01%
April 2017
770
208
197
5.58%
$304,500
$280,000
8.75%
Residential and condos
Total
1147
1189
-3.53%
$379,350
$337,500
12.40%
41
-4.88%
$359,000
$310,000
15.81%
Camano 36
MLS Area
Sales 2017
Sales 2016
% change Median price 2017
Median price 2016
% change
Camano 45
610
160
174
-8.05%
$617,975
$496,250
24.53%
November 2016
730
229
237
-3.38%
$467,741
$400,000
16.94%
Residential and condos
740
284
330
-13.94%
$407,500
$356,000
14.47%
120
109
10.09%
$373,725
$351,500
6.32%
MLS Area
Sales 2016
Sales 2015
% change Median price 2016
Median price 2015
% change
750 760
133
151
-11.92%
$371,000
$306,000
21.24%
610
210
132
59.09%
$564,975
$487,780
15.83%
770
190
212
-10.38%
$330,000
$294,000
12.24%
730
241
196
22.96%
$420,000
$359,975
16.67%
323
299
8.03%
$365,000
$327,450
11.47%
1213
-8.00%
$416,668
$357,000
16.71%
740
29
68.97%
$369,000
$317,500
16.22%
750
125
86
45.35%
$355,000
$321,250
10.51%
760
149
108
37.96%
$329,950
$281,450
17.23%
March 2017
770
222
152
46.05%
$312,650
$274,950
13.71%
Residential and condos
Total
1270
973
30.52%
$379,950
$329,638
15.26%
43
-11.63%
$350,000
$326,980
7.04%
Total
1116
Camano 35
MLS Area
Sales 2017
Sales 2016
% change Median price 2017
Median price 2016
% change
Camano 27
610
181
201
-9.95%
$596,000
$525,290
13.46%
October 2016
730
220
203
8.37%
$430,750
$381,000
13.06%
Residential and condos
740
293
333
-12.01%
$385,000
$350,000
10.00%
117
93
25.81%
$375,000
$338,000
10.95%
MLS Area
Sales 2016
Sales 2015
% change Median price 2016
Median price 2015
% change
750 760
146
141
3.55%
$360,000
$307,500
17.07%
610
197
172
14.53%
$520,000
$480,000
8.33%
770
210
185
13.51%
$343,750
$286,500
19.98%
730
275
244
12.70%
$395,000
$378,000
4.50%
Total
1167
1156
0.95%
$396,000
$365,000
8.49%
740
333
341
-2.35%
$350,000
$339,900
2.97%
41
2.44%
$376,500
$319,000
18.03%
750
150
95
57.89%
$368,850
$299,950
22.97%
760
193
147
31.29%
$350,000
$291,000
20.27%
770
216
179
20.67%
$317,500
$279,000
13.80%
Total
1364
1178
15.79%
$369,950
$342,475
8.02%
33
12.12%
$388,500
$375,000
3.60%
Camano 45 February 2017
Residential and condos MLS Area
Sales 2017
Sales 2016
% change Median price 2017
Median price 2016
% change
610
140
103
35.92%
$499,950
19.65%
$598,200
SOURCE: NORTHWEST MULTIPLE LISTING SERVICE
Camano 45
26 THE HERALD BUSINESS JOURNAL – MARKET FACTS 2018
HOUSING PERMITS
Snohomish County housing permits by structure, 2009-2017 2017 (through October)
Total
2014
Total
2011
Total
Total Units
3,137
Total Units
3,483
Total Units
2,523
Units in Single-Family Structures
2,364
Units in Single-Family Structures
2,074
Units in Single-Family Structures
1,823
Units in All Multi-Family Structures
773
Units in All Multi-Family Structures
1,409
Units in All Multi-Family Structures
700
Units in 2-unit Multi-Family Structures
52
Units in 2-unit Multi-Family Structures
88
Units in 2-unit Multi-Family Structures
50
Units in 3- and 4-unit Multi-Family Structures
112
Units in 3- and 4-unit Multi-Family Structures
29
Units in 3- and 4-unit Multi-Family Structures
20
Units in 5+ Unit Multi-Family Structures
609
Units in 5+ Unit Multi-Family Structures
1,292
Units in 5+ Unit Multi-Family Structures
630
2016
Total
2013
Total
2010
Total
Total Units
3,908
Total Units
4,359
Total Units
2,126
Units in Single-Family Structures
2,689
Units in Single-Family Structures
1,984
Units in Single-Family Structures
1,859
Units in All Multi-Family Structures
1,219
Units in All Multi-Family Structures
2,375
Units in All Multi-Family Structures
267
Units in 2-unit Multi-Family Structures
62
90
Units in 2-unit Multi-Family Structures
76
Units in 3- and 4-unit Multi-Family Structures
139
Units in 2-unit Multi-Family Structures Units in 3- and 4-unit Multi-Family Structures
59
Units in 3- and 4-unit Multi-Family Structures
40
Units in 5+ Unit Multi-Family Structures
1,018
Units in 5+ Unit Multi-Family Structures
2,226
Units in 5+ Unit Multi-Family Structures
151
2015
Total
2012
Total
2009
Total
Total Units
3,583
Total Units
3,618
Total Units
2,183
Units in Single-Family Structures
2,386
Units in Single-Family Structures
2,179
Units in Single-Family Structures
1,782
Units in All Multi-Family Structures
1,197
Units in All Multi-Family Structures
1,439
Units in All Multi-Family Structures
401
Units in 2-unit Multi-Family Structures
66
Units in 2-unit Multi-Family Structures
92
Units in 2-unit Multi-Family Structures
124
Units in 3- and 4-unit Multi-Family Structures Units in 5+ Unit Multi-Family Structures
17 1,114
Units in 3- and 4-unit Multi-Family Structures Units in 5+ Unit Multi-Family Structures
62 1,285
Units in 3- and 4-unit Multi-Family Structures Units in 5+ Unit Multi-Family Structures
SOURCE: U.S. CENSUS BUREAU
Thanks for letting us serve you for the past 20 years! While so many things have changed since we began our journey in Everett over 20 years ago, we feel more things have remained the same. Coastal has always led with people. Our employees utilize their strengths to set the course and are empowered to do the right things for their clients. That means advocating for their customers when others wouldn’t, or championing their own causes because they feel personally invested. Our success is a direct result of making business personal and we have you to thank. -Eric Sprink, President and CEO
coastalbank.com 2009257
90 187
THE HERALD BUSINESS JOURNAL – MARKET FACTS 2018 27
2009253
28 THE HERALD BUSINESS JOURNAL – MARKET FACTS 2018
Dan Ollis, Whidbey Coffee Family man Mud runner Coffee connoisseur
Each and every one of us is an original. Shaped by unique inuences that make us who we are today. Here at Heritage Bank, we think differences can build a better bank, too. That’s why we share the best ideas from across all of our branches and local communities with one goal in mind: to serve our customers better every day. By sharing our strengths, we’re able to offer customers like Dan Ollis—and you—more than a community bank. But rather, a community oƒ banks.
W H AT ’ S YO U R H E R I TAG E?
HeritageBankNW.com | 800.455.6126
© 2018 Heritage Bank Member FDIC