MARKET FACTS 2013 The statistical profile of Snohomish County
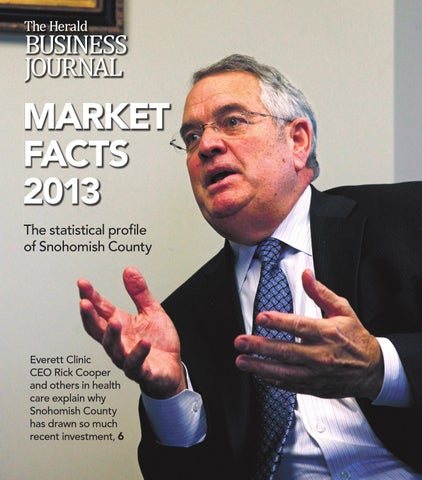
Everett Clinic CEO Rick Cooper and others in health care explain why Snohomish County has drawn so much recent investment, 6
THE HERALD BUSINESS JOURNAL 3
0001795036-01
MARKET FACTS 2013
WHAT’S INSIDE MARKET FACTS 2013 COVER STORY Health-care organizations are investing big in Snohomish County to meet the challenges of a growing population and to improve patient care at a lower cost .............................................5
FINANCE New bank capital regulations proposed by the Federal Reserve may make it harder for local businesses to get loans ...............................................8
EDUCATION Washington State University wants $2 million to bring more degree programs through the University Center of North Puget Sound ..............................8 Public and private colleges in Snohomish County offer an array of degree programs for students ........................15
MANUFACTURING Quantum Windows and Doors Inc. is reaping the benefits of the hard decisions made during the economic downturn ............................................16 Silicon Energy, one of the top manufacturers of solar modules, uses
locally sourced materials for their worldclass products .....................................20
BIOTECH Seattle Genetics in Bothell is leading the way in the fight against lymphoma with their drug Adcetris ...24
REAL ESTATE Investing in commercial property? Tom Hoban advises patience in the first quarter of 2013, but see the market “firming up” later in the year .............28 With home prices up and inventory down, the local real estate market currently favors sellers .............................29
AEROSPACE Cobalt Enterprise Inc., a Granite Falls company that manufactures precision machine parts, may fly under the radar, but is expected to bring in $6 million in sales ....................................34
TRANSPORTATION Construction on Highway 522 in Monroe may be cause congestion, but the project will lead to a smoother commute later ...........................................38
By adding GPS to its buses, Community Transit hopes to improved operations and customer service .......39
U.S. NAVY The USS Nimitz and Naval Station Everett provide an economic boon to Snohomish County and its communities .....................................................40
PROGRESS Economic Alliance of Snohomish County plans to build on the strong growth the organization experienced last year .............................................41
STATISTICAL SNAPSHOTS Snohomish County chartered banks and credit unions ............................ 12 Snohomish County commercial banks and savings, 1990-2011 ........12 Snohomish County unincorporated and incorporated population ...........13 Consumer Price Index, 1982-2012, Seattle-Tacoma-Bremerton area ......18 Snohomish County per capita income ...............................................21 Snohomish County new housing units building permits ..................22-23
2012 Snohomish County population by age, gender and race ..................26 Snohomish County home sales and prices, 2005-2012 ........................31-32 Snohomish County housing, 20002012 ...................................................33 Snohomish County aerospace companies ............................................35-37 Snohomish County’s largest public and private employers ......................37 Snohomish County PUD electricity sales and new connections ...............41 Seattle metro area unleaded fuel prices, 1998-2012 .............................42 Seattle metro area piped natural gas, per therm, 1998-2012 ..............42 Seattle metro area eletricity per kilowatt hour, 1998-2012 .................42 Quantity indexes for Real GDP, Seattle Metropolitan Area................43 Gross Domestic Product, Seattle metro area .........................................44 Snohomish County civilian labor force and employment, 20002012 ...................................................45 Taxable retail sales of select industries in Snohomish County, 20042012 ...................................................46 Snohomish County occupational employment projections, 2010-2012 .......................................................47-50
4 THE HERALD BUSINESS JOURNAL
MARKET FACTS 2013
On the cover: Why the big investment in health care? Health care providers have been investing a lot of capital in Snohomish County over the last few years for a number of reasons. To serve a growing, aging population. To update and improve their own facilities to serve that population in better hospitals and clinics with newer, more advanced diagnostic equipment and treatment options. And because the competition demands it and consumers use it. But another reason for all the investment —
some $680 million here since 2007 — is the drive to make health-care delivery more efficient and less expensive. All providers are striving to set new standards of performance and reduce costs. “Right now, we’re working to lower the cost of care by an audacious goal of 25 percent over the next five years, and our more efficient facilities and programs are designed to help us do that,” said Rick Cooper, CEO of The Everett Clinic (at left).
To that end, Snohomish County health-care consumers are seeing more partnerships and cooperation among onetime health business rivals. The first milestone came with the building of the $62 million Providence Regional Cancer Partnership in Everett in 2007, an alliance of Providence Regional Medical Center, The Everett Clinic, Western Washington Medical Group and Northwest Radiation Oncology Associates. The alliances are growing. The Everett Clinic and Group Health Cooperative now share patients’ electronic medical records. Cascade Valley Hospital and Skagit Valley Hospital teamed up to open and operate the Cascade Skagit Health Alliance medical
clinic in Smokey Point in early 2012. Providence and Swedish Medical Center, which took over management of Stevens Hospital in Edmonds, are forming their own business alliance. “We’re very competitive but we also know we’re all in this health-care business together and we always have an eye on collaboration opportunities,” said Dave Brooks, CEO of Providence Regional Medical Center Everett. “The Everett Clinic, for instance, has been a great partner. No institution alone could create what we have to offer because of our partnership with institutions that said ‘enough is enough’ and decided it’s time to work together for a greater good.” — Kurt Batdorf, HBJ Editor
PUBLISHER
CONTRIBUTING EDITOR
COVER DESIGN
David Dadisman 425-339-3007 — ddadisman@heraldnet.com
Jocelyn Robinson
Kurt Batdorf
CONTRIBUTING WRITERS
COVER PHOTO
ADVERTISING SALES THE HERALD BUSINESS JOURNAL Copyright 2013 The Daily Herald Co. Everett, Washington
Susan Bonasera 425-339-3445 — Fax 425-339-3049 sbonasera@heraldnet.com
EDITOR Kurt Batdorf 425-339-3102 — kbatdorf@heraldnet.com
Eric Fetters, M.L. Dehm, Christina Harper, Debra Smith and John Wolcott
Annie Mulligan
SUBSCRIPTIONS
CONTRIBUTING PHOTOGRAPHER
425-339-3200 www.theheraldbusinessjournal.com
Annie Mulligan
CUSTOMER SERVICE 425-339-3200 — Fax 425-339-3049 customersvc@heraldnet.com
COVER STORY
Health-care investment is big business By John Wolcott
HBJ Freelance Writer
PHOTOS BY ANNIE MULLIGAN / FOR HBJ
ABOVE: The Cascade Skagit Health Alliance clinic in Smokey Point opened on March 26, 2012. The new facility was built to improve health services for the community and in hopes of attracting physicians to the area. LEFT: Construction has begun on the new Providence Medical Building in Monroe. The clinic is scheduled to open in October 2013.
First, reduce costs Striving to improve services and maintain quality medical staff for its
295,000 patients has made The Everett Clinic one of the most successful and well recognized medical care providers in the Northwest, said Cooper, who also plays leadership roles in local, state and national medical groups. The Everett Clinic has grown into the largest independent medical group in the region and the fifth-largest private Snohomish
Continued on Page 6
THE HERALD BUSINESS JOURNAL 5
and providing a facility designed to provide faster ways of getting to see medical staff, eliminating much of the time patients sit in waiting rooms.
County employer, with 450 health-care providers among its 1,740 employees. “Right now, we’re working to lower the cost of care by an audacious goal of 25 percent over the next five years, and our more efficient facilities and programs are designed to help us do that,” Cooper said. All health-care providers are striving to set new standards of performance and reduce costs. In a recent presentation to the Everett Rotary Club, Cooper said he sees a future of market shakeout and consolidation for efficiencies, more emphasis on disease management and prevention, increased accountability, fixed budgets, shared savings, direct contracting, more
MARKET FACTS 2013
2013 will mark $35 million in construction of new health-care facilities in Snohomish County, each providing additional space, medical staff and the latest in high-tech diagnostic and treatment equipment in preparation for the future. Those investments are part of $680 million in major health-care expansions, upgrades and new locations launched by several health-care organizations since 2007 to meet the challenges of a growing and aging population, protecting market sectors and gaining efficiencies that provide improved patient care at lower costs. From the $62 million establishment of the Providence Regional Cancer Partnership in Everett in 2007, the list includes a $46 million expansion of Cascade Valley Hospital in Arlington; Community Health Center’s $10 million Everett expansion; the $30 million Swedish/Mill Creek Emergency Center at I-5 and 128th Street SE; Providence Regional Medical Center Everett’s $460 million medical tower; the $12 million Cascade Skagit Health Alliance medical center and The Everett Clinic’s $25 million facility, both in Smokey Point; Community Health Center’s $13 million clinic in Edmonds; and the $22 million Providence Clinic in Monroe. The last two are due for completion in 2013. Just as significant as the brick-andmortar structures has been the intertwining alliances in recent years by major health-care providers that, as Everett Clinic CEO Rick Cooper explains, must balance “competing and collaborating” at the same time. In a far-ranging interview, Cooper described the massive health-care investments in the county and the growing number of partnerships among competitors as a time of major changes in services, access and market structure. “When we decided to build our $25 million Smokey Point facility, we felt we needed a presence between Marysville and Stanwood to serve our many clients in that area but also because north Snohomish County is expected to grow in population as well as reflecting the aging of the area’s residents,” he said. “We’re delighted that in the first week after Thanksgiving we saw 1,600 patients there, ahead of what we had forecast.” Cooper said The Everett Clinic focuses on new programs and services as well as its facilities and technology, such as the move to electronic records
COVER STORY Continued from Page 5
DOLLAR FOR DOLLAR
transparency and emphasis on results, value and cost containment. The federal Affordable Care Act aims to reduce insurance costs in 2013 and in 2014. Those who don’t have insurance coverage will be able to buy it through the government’s new exchanges, Cooper said. “But the cost of care increasingly requires attention, too, as a part of our health-care future,” he said. Innovative approaches to health-care needs and costs are already producing positive results, he said. For instance, The Everett Clinic recently partnered with the Boeing Co. to focus on chronically ill workers and dependents to improve their health. That program resulted in a 60-minute program that the Public Broadcasting Service aired last February. “We’ve learned from the Boeing experience, where our work resulted in a drop in emergency room visits and fewer hospital stays,” Cooper said. “Programs like that are more labor intensive but they can reduce costs. This is the kind of work we’ll see for years to come, including reducing the costs of prescriptions. We’ve saved our patients $90 million by being out in front on solving medical-care issues.”
Recent Snohomish County health-care investments: Providence Clinic, Monroe. Opens late 2013. $22 million Community Health Center, Edmonds. Opens June 2013. $13 million Cascade Skagit Health Alliance, Smokey Point. March 2012. $12 million The Everett Clinic, Smokey Point. September 2012. $25 million Community Health Center, Broadway Expansion, Everett. January 2011. $10 million Swedish/Mill Creek Emergency Center, Everett. February 2011. $30 million Providence Regional Medical Center Everett tower. Summer 2011. $460 million Swedish/Edmonds. Swedish Health Care-Stevens Hospital management agreement. September 2010 Cascade Valley Hospital expansion, Arlington. February 2010. $46 million Providence Regional Cancer Partnership, Everett. June 2007. $62 million
6 THE HERALD BUSINESS JOURNAL
MARKET FACTS 2013
Competition will grow Dave Brooks, CEO of Providence Regional Medical Center Everett and its myriad facilities in Snohomish County, said the growing competitiveness in the health-care market is a reality affecting the whole region, yet collaboration and alliances with those competitors have become just as essential. “The need for working together in a changing health-care delivery market began being recognized five years ago in the region, including in King County where health-care organizations realized they had to get tentacles into Snohomish County where they had so many patients,” Brooks said. “But Providence was changing the market and they couldn’t compete like they did a decade ago when people thought King County had superior services. That’s been a major accomplishment, convincing Snohomish County residents they didn’t have to make that long trip anymore because the same quality of care was available in communities where they live.” Brooks said Providence and other providers are focused on being competitive and constantly raise the bar on services and performance to survive. “The downside is that increasing costs sometimes shut out the marginalized people, which we (as a Catholic
ANNIE MULLIGAN / FOR HBJ
Everett Clinic CEO Rick Cooper talks during an interview on Monday, Dec. 3, in his office in The Everett Clinic administration building.
organization) are particularly sensitive to,” Brooks said. “We’re faced, too, with serving the Northwest’s share of the 45 million people in America without insurance. That’s why five years ago most health-care organizations began evaluating their clinical and strategic development strategies.” For Providence, that meant expanding its collaborative alliances as well as building its new Everett hospital tower and expanding its network of clinics. The most recent example was the November 2012 groundbreaking for its $22 million Monroe clinic that will be twice the size of its present one. “We’re very competitive but we also know we’re all in this health-care business together and we always have an eye
on collaboration opportunities,” Brooks said. “The Everett Clinic, for instance, has been a great partner. No institution alone could create what we have to offer because of our partnership with institutions that said ‘enough is enough’ and decided it’s time to work together for a greater good.” A major milestone in collaboration came with the building of the $62 million Providence Regional Cancer Partnership in Everett in 2007, an alliance of Providence Regional Medical Center, The Everett Clinic, Western Washington Medical Group and Northwest Radiation Oncology Associates. The result has been a highly concentrated focus on offering a variety of cancer treatments, providing Seattle-level cancer
patient care within Snohomish County and bringing a major coalition of competitors to the table to work out a plan for working together for common goals. Competition still exists not only within the county but also from neighboring health-care providers, which is why Swedish Medical Center is reaching out to its present and potential patients in Snohomish County. Two years ago, Seattle-based Swedish Medical Center began creating a major new presence in Snohomish County “to provide health care much closer to where people live and work,” Kevin Brown, Swedish Medical Center senior vice president and chief administrative officer, said at the time. One of the major changes came when Swedish took over management of Stevens Hospital in Edmonds, where new signage proclaims it Swedish/Edmonds. Brown said at the time that Swedish took a comprehensive look at the region and the market study showed significant areas, such as south Snohomish County, where adequate health-care facilities have not kept pace with the growing population. Since Swedish had already partnered with Stevens Hospital on many
COVER STORY
ANNIE MULLIGAN / FOR HBJ
Jane Root, chief administrative officer for Skagit Regional Clinics, shows the features of one of 58 primary care rooms in the new Cascade Skagit Health Alliance clinic in Smokey Point.
programs over the past 20 years, it was a natural path for Swedish to take when it assumed management of the hospital’s operations to provide improved services for county residents. Swedish also opened a three-story, $30 million Swedish/Mill Creek emergency room facility in 2011 at I-5 and 128th Street SE on the site of the former Puget Park Drive-In theater.
Collaboration amid the competition
MARKET FACTS 2013 0001803361-01
THE HERALD BUSINESS JOURNAL 7
Collaboration among competing health-care providers in Snohomish County is getting complicated and that trend may not be over. The result of competitors working together ultimately provides more services in specialized facilities, lower costs and a wider range of care providers to serve patients. As never before, patients are finding care coming from organizations they’ve never belonged to, but referrals get people the care they need in highly efficient ways unheard of in recent years, said Brooks, the Providence CEO. Providence Regional Medical Center, for instance, is teaming with Swedish Health Services to form a new nonprofit health-care system, a regional division of Providence Health & Services. Both organizations will continue to operate independently but the new affiliation
will enable them to share resources, such as having a Swedish neurosurgeon treat a Providence patient from Everett. Also, a blood conservation program that Providence pioneered in Everett could be shared with Swedish, helping patients heal more quickly while reducing costs. Western Washington Medical Group announced in November that it would add Marysville Family Medicine to its roster of medical specialties beginning Jan. 2, 2013. The Everett Clinic is forming a new alliance with Group Health Cooperative to expand its Snohomish County footprint. The two organizations have worked together since 2010, offering such services as Group Health’s ClearCare Medicare Advantage health plan. The Everett Clinic and Group Health already exchange secure electronic medical records between their systems. Considering the past years of major expenditures for facilities, staff and equipment and the increasing collaboration of long-time competitors, the intense pace of building and investment isn’t expected to continue at the same level, Cooper said. Much has already been put into place to change healthcare delivery in Snohomish County. Ultimately, the providers survive and grow and those who need medical care are finding it easier and faster than ever before, often at lower cost.
FINANCE
Banking accord could hamper local lending Everett banker sees trouble making loans to small businesses under Basel III By Debra Smith
8 THE HERALD BUSINESS JOURNAL
MARKET FACTS 2013
HBJ Freelance Writer
EVERETT — Those who wish to expand or start a small business can still find credit in the local market, but it’s more difficult than before the 2008 financial meltdown. It’s likely to get even tougher because of bank capital rules proposed by the Federal Reserve. It’s no surprise that accessing credit has become far more difficult since the meltdown and subsequent recession. Especially hard to obtain are commercial and industrial loans, the type used to finance inventory and buy equipment. It’s also difficult for businesses to get a construction loan. “There is credit available. It’s just the underwriting is tougher than it was five years ago,” said Mark Duffy, CEO and president of Mountain Pacific Bank in Everett. The loss of small banks in Snohomish County is partly to blame, he said. Community banks often are the go-to place for small businesses to get a loan because they’re generally more flexible than large banks. Since 2008, the number of community banks countywide has dropped from 15 to six. Large banks, of course, have advantages that smaller ones don’t, including the ability to make far bigger loans and to offer more products. Interest rates offered by larger banks can sometimes be lower. Community banks often evaluate customers on more than credit scores and financial statements. Loan officers at community banks also consider soft factors — such as character and business relationships — that might make a small-business owner a better bet than they appear on paper. Bank capital rules proposed by the Federal Reserve will likely make it more difficult for local businesses and individuals to obtain credit and could even drive more community banks out of business, say some financial experts. That would stifle smaller businesses, the lifeblood of the local economy. The new federal rules enact an international banking agreement known as
ANNIE MULLIGAN / FOR HBJ
Glen Bayha, of Arlington, owner of Cascade Door and Hardware, poses in his office in a building that was funded by a smallbusiness loan from Mountain Pacific Bank in Everett.
Basel III, named for the city in Switzerland where it was negotiated. International regulators conceived Basel III to create a more resilient banking sector by strengthening global capital and liquidity rules. Mark Duffy Regulators want to put a stop to laissez-faire lending practices by the mega banks that led to the global financial crisis in 2008. They want banks to rely more on equity than debt to fund themselves. The international accord and the federal proposal would require banks to maintain capital equal to 7 percent of their risk-bearing assets. That’s about
three times what’s required now. The rules would be phased in between 2013 and 2019. In a comment letter to the Federal Reserve, the Independent Community Bankers of America asked regulators to exempt community banks from the proposed capital standards. Applying the capital standards to community banks would shift the definition of regulatory capital, minimum capital requirements and risk sensitivities, representatives from the national organization wrote. The standards were “never intended to apply to a domestic community bank.” They added that the proposals would significantly erode community bank profitability and credit availability and drive community banks out of business. Requiring banks to have higher levels
of minimum capital on hand is a positive change, said Duffy, the CEO and president of Mountain Pacific Bank. He objects to the one-size-fits-all approach to calculating the risk of loans. The rules are needlessly complicated for small banks, which generally don’t offer complex investment and loan products. On some loans, the rules assign higher amounts of risk than before, which means a bank would have to hold onto more capital. That in turn limits the amount of money the bank can loan out. Take a loan with a balloon feature. Mountain Pacific Bank doesn’t handle many mortgages, but when they do, they typically offer a fixed interest rate for the first five years. After five years, Continued on Page 10
MARKET FACTS 2013
THE HERALD BUSINESS JOURNAL 9
0001798463-01
FINANCE Continued from Page 8
10 THE HERALD BUSINESS JOURNAL
MARKET FACTS 2013
the loan is repriced. This type of loan is given a much higher risk score under Basel III. The new rules also change how capital assets are calculated. Some assets that are now considered part of a bank’s capital would not factor into the equation, which means small banks would be on the hook to raise even more capital they couldn’t loan. Duffy estimates that the new requirements will decrease Mountain Pacific’s lending capacity by $11 million annually. That’s about 10 percent of the bank’s current outstanding loans. His own bank, Mountain Pacific, got stuck with some troubled loans when the economy fell apart, causing the Federal Deposit Insurance Corp. to place a cease-and-desist order on lending. FDIC has since lifted that order, after Mountain Bank raised $10.5 million in additional capital, increased liquidity and added to its loan-loss reserve fund. The solution, Duffy said, is to let the regulators who directly oversee local banks calculate the lending risk formulas, not an international banking committee.
0001795783-01
ANNIE MULLIGAN / FOR HBJ
Cascade Door and Hardware occupies a huge, functional space outside of Arlington that was funded by a small-business loan from Mountain Pacific Bank three and a half years ago.
MARKET FACTS 2013
THE HERALD BUSINESS JOURNAL 11
0001803119-01
FINANCE
Snohomish County chartered banks and credit unions Banks The Bank of Washington 5901 196th St. SW, Lynnwood President and CEO: Bruce Clawson 425-275-5600 www.the-bank.com Coastal Community Bank 10520 19th Ave. SE, Everett President: Eric Sprink 425-257-9000 www.coastalbank.com 1st Security Bank of Washington 6920 220th St. SW, Suite 300, Mountlake Terrace CEO: Joe Adams 425-771-5299 or 800-683-0973 www.1stsecurityofwa.com
MARKET FACTS 2013 12 THE HERALD BUSINESS JOURNAL
Mill Town Credit Union 2516 W. Marine View Drive, Everett Manager: Laura Leuze 425-252-5139 800-819-9093 www.milltowncu.org
Northwest Plus Credit Union 2821 Hewitt Ave., Everett CEO: Douglas Bennett 425-297-1000 800-456-6481 www.nwpluscu.com
UniBank 16929 Highway 99, Suite 110, Lynnwood CEO: Daniel Changyol Lee 425-275-9700 www.unibankusa.com
MountainCrest Credit Union 3710 168th St. NE, Suite A108, Arlington CEO: Mark Morrison 360-435-5400 877-601-0000 www.mountaincrestcu.com
SnoCope Credit Union 3130 Rockefeller Ave., Everett CEO: Steve Ellis 425-388-3481 www.snocope.org
Credit unions Community Healthcare Federal Credit Union 1503 Pacific Ave., Everett 425-259-6446 www.commhealthcu.org Fluke Employees Credit Union 9028 Evergreen Way, Everett 425-446-5930
0001802426-01
Mountain Pacific Bank 3732 Broadway, Everett President: Mark A. Duffy 425-263-3500 www.mountainpacificbank.com
Pacific Crest Savings Bank 3500 188th St. SW, Suite 575, Lynnwood President: Sheryl Nilson 425-670-9600 www.pacificcrestbank.com
1ST & 2ND MORTGAGES • PURCHASES • REFINANCING FIXED RATE HOME EQUITY LINES OF CREDIT • LOCAL LENDER
Source: Washington State Department of Financial Institutions, December 2012
Snohomish County commercial banks and savings, 1990-2011 Commercial banks (FDIC insured) Commercial banks as of June 30, 1990 Commercial banks as of June 30, 1991 Commercial banks as of June 30, 1992 Commercial banks as of June 30, 1993 Commercial banks as of June 30, 1994 Commercial banks as of June 30, 1995 Commercial banks as of June 30, 1996 Commercial banks as of June 30, 1997 Commercial banks as of June 30, 1998 Commercial banks as of June 30, 1999 Commercial banks as of June 30, 2000 Commercial banks as of June 30, 2001 Commercial banks as of June 30, 2002 Commercial banks as of June 30, 2003 Commercial banks as of June 30, 2004 Commercial banks as of June 30, 2005 Commercial banks as of June 30, 2006 Commercial banks as of June 30, 2007 Commercial banks as of June 30, 2008 Commercial banks as of June 30, 2009 Commercial banks as of June 30, 2010 Commercial banks as of June 30, 2011
Offices 76 80 79 80 86 91 94 97 95 97 100 103 107 113 109 130 141 145 148 174 169 173
Total deposits $1,881,197,000 $1,932,323,000 $1,953,104,000 $2,026,911,000 $2,107,730,000 $2,213,178,000 $2,278,726,000 $2,142,081,000 $2,202,679,000 $2,493,694,000 $2,700,445,000 $3,007,771,000 $3,392,000,000 $3,870,000,000 $4,067,000,000 $5,009,000,000 $5,787,000,000 $6,659,000,000 $7,489,000,000 $9,145,000,000 $7,590,000,000 $7,211,522,000
Savings institutions (FDIC insured) Savings institutions as of June 30, 1990 Savings institutions as of June 30, 1991 Savings institutions as of June 30, 1992 Savings institutions as of June 30, 1993 Savings institutions as of June 30, 1994 Savings institutions as of June 30, 1995 Savings institutions as of June 30, 1996 Savings institutions as of June 30, 1997 Savings institutions as of June 30, 1998 Savings institutions as of June 30, 1999 Savings institutions as of June 30, 2000 Savings institutions as of June 30, 2001 Savings institutions as of June 30, 2002 Savings institutions as of June 30, 2003 Savings institutions as of June 30, 2004 Savings institutions as of June 30, 2005 Savings institutions as of June 30, 2006 Savings institutions as of June 30, 2007 Savings institutions as of June 30, 2008 Savings institutions as of June 30, 2009 Savings institutions as of June 30, 2010 Savings institutions as of June 30, 2011
Offices 16 32 34 32 35 34 40 46 54 56 61 60 50 53 57 47 39 38 37 14 17 17
Total deposits $494,041,000 $998,784,000 $1,077,481,000 $1,030,470,000 $997,975,000 $983,304,000 $1,194,564,000 $1,607,633,000 $1,701,950,000 $1,808,881,000 $1,871,721,000 $2,044,936,000 $2,033,000,000 $2,214,000,000 $2,365,000,000 $2,229,000,000 $2,289,000,000 $2,196,000,000 $2,213,000,000 $967,000,000 $1,253,000,000 $819,937,000
Source: U.S. Census Bureau
STATISTICAL SNAPSHOT
Snohomish County unincorporated and incorporated population Change and rank, April 1, 2010, to April 1, 2012 2011 2012 2010 OFM OFM Numeric Numeric Numeric population, pop. pop. change, change, change, U.S. Census estimate estimate ‘10-’11 ‘11-’12 ‘10-’12 Snohomish County 713,335 717,000 722,900 3,665 5,900 9,565 Unincorporated 302,292 304,435 308,445 Incorporated 411,043 412,565 414,455 Arlington 17,926 17,930 17,970 4 40 44 Brier 6,087 6,100 6,155 13 55 68 Bothell (inc. King Co.) 33,505 33,720 34,000 215 280 495 Bothell (exc. King Co.) 16,415 16,570 16,720 Darrington 1,347 1,345 1,345 -2 0 -2 Edmonds 39,709 39,800 39,800 91 0 91 Everett 103,019 103,100 103,300 81 200 281 Gold Bar 2,075 2,060 2,060 -15 0 -15 Granite Falls 3,364 3,370 3,380 6 10 16 Index 178 180 180 2 0 2 Lake Stevens 28,069 28,210 28,510 141 300 441 Lynnwood 35,836 35,860 35,900 24 40 64 Marysville 60,020 60,660 61,360 640 700 1,340 Mill Creek 18,244 18,370 18,450 126 80 206 Monroe 17,304 17,330 17,390 26 60 86 Mountlake Terrace 19,909 19,990 20,090 81 100 181 Mukilteo 20,254 20,310 20,360 56 50 106 Snohomish 9,098 9,200 9,215 102 15 117 Stanwood 6,231 6,220 6,300 -11 80 69 Sultan 4,651 4,655 4,660 4 5 9 Woodway 1,307 1,305 1,310 -2 5 3
% share % share % share Percent of state of state of state change, tot. pop. tot. pop. tot. pop. ‘10-’12 ‘10-’11 ‘11-’12 ‘10-’12 1.34 10.61 10.59 10.60
Percent change, ‘10-’11 0.51
Percent change, ‘11-’12 0.82
0.02 0.21 0.64
0.22 0.90 0.83
0.25 1.12 1.48
0.267 0.091 0.498
0.265 0.090 0.498
-0.15 0.23 0.08 -0.72 0.18 1.12 0.50 0.07 1.07 0.69 0.15 0.41 0.28 1.12 -0.18 0.09 -0.15
0.00 0.00 0.19 0.00 0.30 0.00 1.06 0.11 1.15 0.44 0.35 0.50 0.25 0.16 1.29 0.11 0.38
-0.15 0.23 0.27 -0.72 0.48 1.12 1.57 0.18 2.23 1.13 0.50 0.91 0.52 1.29 1.11 0.19 0.23
0.020 0.591 1.532 0.031 0.050 0.003 0.417 0.533 0.893 0.271 0.257 0.296 0.301 0.135 0.093 0.069 0.019
0.020 0.588 1.523 0.030 0.050 0.003 0.417 0.530 0.896 0.271 0.256 0.295 0.300 0.136 0.092 0.069 0.019
Pop. chg. Pop. chg. Rank by due to due to pop. annex. annex. 2012 ‘10-’11 ‘11-’12 3 NA NA
Rank by pop. 2010 3
Rank by pop. 2011 3
0.264 0.090 0.499
54 109 30
54 109 31
54 109 31
0 0 0
18 0 0
0.020 0.584 1.515 0.030 0.050 0.003 0.418 0.527 0.900 0.271 0.255 0.295 0.299 0.135 0.092 0.068 0.019
183 25 6 160 132 273 39 29 15 52 59 48 47 85 107 122 187
185 26 7 160 133 272 39 30 16 52 59 48 47 84 107 123 187
185 26 7 161 133 272 39 30 17 52 59 48 47 84 108 123 187
0 0 0 0 0 0 0 0 0 0 0 0 0 0 0 0 0
0 0 0 0 0 0 0 0 0 0 21 0 0 0 0 0 0
Source: Washington State Office of Financial Management, Forecasting Division. November 2012
MARKET FACTS 2013 THE HERALD BUSINESS JOURNAL 13
0001803123-01
EDUCATION
WSU wants $2M to expand its EvCC degrees Electrical engineering, communications and hospitality would be new By Jerry Cornfield Herald Writer
OLYMPIA — Washington State University wants an infusion of state dollars in 2013 to add courses and teach more students in Everett. WSU is seeking $2 million to offer bachelor’s degrees in electrical engineering, communications and hospitalitybusiness management through the University Center of North Puget Sound on the campus of Everett Community College. If the money materializes, WSU could greatly expand its presence on the campus where it launched a mechanical engineering program in September. “We’re still in the infancy of what we’re hoping to do there. We think this represents a meaningful expansion of the center,” said Chris Mulick, director of
state relations for WSU. University officials wrote the $2 million into the school’s 2013-15 budget request they sent to Gov. Chris Gregoire in October. Gregoire will consider whether to fund it in her final budget proposal to lawmakers in December. Final action won’t be taken until the spring when the next Legislature and incoming Gov. Jay Inslee act on a budget. “We certainly think it’s doable,” said Mulick, noting he’s outlined the university’s request to lawmakers serving Snohomish, Island and Skagit counties. Gretchen Rowe, University Center’s associate dean, is hopeful it works out. “The University Center is all about increasing baccalaureate degree offerings to the Everett Community College students and the folks in our region,” she said. WSU chose programs it perceived would best serve the needs of the north Puget Sound region and gain the university a higher profile in the community. With electrical engineering, there is a very clear demand, Mulick said.
The hospitality-business management program began in 1932 and is the third oldest of its kind in the nation. It produces graduates who manage hotels and tourist destinations, he said. Leaders of the Tulalip Tribes, which owns a casino and resort hotel a few miles north of the Everett campus, expressed interest in WSU bringing their program to Everett, he said. Finally, WSU is looking to offer an integrated communications degree through its renowned Edward R. Murrow College of Communication. “It gives us a chance to bring a signature WSU program to Everett,” Mulick said. From the University Center’s perspective, “communication has always been a degree we’ve wanted to bring here,” Rowe said. WSU envisions enrolling 20 third-year students in each program for the 2013 school year. In 2014, and every year after, there would be 20 fourth-year students and 20 third-year students for a total of 40 in each program and 120 in total each year. Adding the mechanical engineer-
ing students, WSU, by 2015, would have 180 students enrolled in the University Center — a collaboration of WSU, University of Washington-Bothell, Western Washington University, Central Washington University, Eastern Washington University, The Evergreen State College, St. Martin’s University and Hope International University — providing bachelor’s and master’s degree courses. A 2011 state law prescribes a path for EvCC to hand over administration of the center to WSU by mid-2014. In the meantime, if WSU secures funds for the additional offerings, it will almost certainly renew talk of establishing a full WSU branch campus in Everett. Mulick said that is a whole different conversation. “There are a series of very specific steps to creating a branch campus,” Mulick said. “We’re focused on this expansion of the University Center and additional expansions of the center in years to come.” Jerry Cornfield: 360-352-8623; jcornfield@heraldnet.com.
0001804254-01
0001803102-01
14 THE HERALD BUSINESS JOURNAL
MARKET FACTS 2013
Advertising 2013
Contact Susan Bonasera, Advertising Manager sbonasera@heraldnet.com
www.TheHeraldBusinessJournal.com
EDUCATION
Public or private, county’s colleges offer plenty of options HBJ staff Snohomish County has numerous educational institutions offering a wide array of choices in degree programs.
Edmonds Community College, Lynnwood Website: www.edcc.edu Two-year associate and transfer degrees Specialized offerings: materials science technology; aerospace mechanicalelectrical-composites assembly; CATIA 3-D design, aerospace emphasis; energy-construction management; medical device certificate; fire officer.
Everett Community College, Everett Website: www.everettcc.edu Two-year associate and transfer degrees Specialized offerings: airframe and powerplant FAA Part 147; composites; medical technology; nursing (jointly with University of Washington); precision machining; welding and fabrication.
Cascadia Community College, Bothell Website: www.cascadia.edu Two-year associate and transfer degrees Specialized offerings: information technology; energy management-solar photovoltaics; health care; environmental technologies-sustainability.
Website: www.cwu.edu/lynnwood BA degrees, Secondary Mathematics Teaching Certificate, Supply Chain Management Institute.
CityUniversity of Seattle, Everett
Columbia College, Marysville Website: www.ccis.edu/nationwide/ main.asp?marysville AA, BA, MA degrees targeted to military personnel.
DeVry University, Lynnwood Website: www.devry.edu/locations/ campuses/loc_lynnwood.jsp
University Center of North Puget Sound, Everett Website: www.uceverett.org Partnership with Washington State Univ., Western Washington Univ., Central Washington Univ., Eastern Washington Univ., Univ. of Washington-Bothell, The Evergreen State College, St. Martin’s Univ. and Hope International Univ. to offer bachelor degrees at EvCC.
University of Phoenix, Lynnwood Website: www.phoenix.edu
Western Washington University (branch at EvCC), Everett Website: www.wwu.edu BA, Human Services
University of Washington Website: www.washington.edu BA, BS, MA, MS, PhD degrees The UW is the state’s leading research university and has a world-class academic medical center.
UW-Bothell Website: www.uwb.edu BA, BS, MA, MS degrees
ITT Technical Institute, Everett Website: www.itt-tech.edu
Lake Washington Institute of Technology, Kirkland Website: www.lwtech.edu Offers two- and four-year degrees.
Washington Aerospace Training and Research Center, Everett Website: www.washingtonaerospace.com Mechanical, electrical, composite assembly certificates for aerospace.
Sno-Isle TECH Skills Center, Everett Website: www.snoisletech.com Public school offering technical training for high school students.
0001803355-01
THE HERALD BUSINESS JOURNAL 15
Website: www.cityu.edu
Website: www.erau.edu AS, BS, MS degrees
MARKET FACTS 2013
Central Washington University (branch at EdCC), Lynnwood
Embry-Riddle Aeronautical University, Everett
MANUFACTURING
PHOTOS BY ANNIE MULLIGAN / FOR HBJ
A look into the production rooms at Quantum Doors and Windows in Everett.
16 THE HERALD BUSINESS JOURNAL
MARKET FACTS 2013
Quantum weathers economic storm New leadership builds on manufacturer’s successful formula By Christina Harper HBJ Freelance Writer
EVERETT — Throughout the last few years of the 2008 recession, many Snohomish County businesses have been forced to close their doors. Staff have been laid off, machines ground to a halt, and all that’s left in some cases are empty rooms or factory floors where the ghosts of people who worked hard to make a living still linger. But there are some companies that managed to keep their business running when times were difficult. And now that the economy is looking up, the tough
LEARN MORE Quantum Windows and Doors Inc. 2720 34th St. Everett, WA 98201 www.quantumwindows.com stance some businesses took is now paying off. “Over the years we’ve weathered the storm,” said Melissa Benton, director of client services at Quantum Windows and Doors Inc. Quantum is an Everett business that is now reaping the benefits of the hard decisions made by staff in the wake of the 2008 economic downturn. At its height, the manufacturer of high-end windows and doors employed 120 workers. That number has been
The management team at Quantum Doors and Windows includes (from left) Paul Humphreys, Jeff Quillen, Tim Kummer and Melissa Benton.
MANUFACTURING Classic and Signature window and door systems, can be found in upscale resorts and Pike Place Market among other installations. While Quantum can design and engineer one front door, the likelihood is that the company will make all doors for a customer’s home. Variation on design is a key feature, Humphreys said. Quantum earned the Energy Star award last year and clients, particularly with large glazing projects, can rely on the benefit of reduced energy costs.
Staff works with clients near and far, some in challenging areas, when it comes to doors and windows. From the Pacific Northwest to other shoreline climates where salt affects doors and windows, to high altitudes exposed to desert heat and ultraviolet light, they find solutions. Products are made to the highest standard, craftsmanship and quality and are tested in independent labs. “Our products weather very well,” Humphreys said.
This closeup shows the tight grain and careful milling details in a wood plank at Quantum Windows and Doors.
MARKET FACTS 2013
0001802463-01
THE HERALD BUSINESS JOURNAL 17
lower than the approximately 50 there today. Quantum had to let go good workers throughout the work drought as the housing market went through a severe contraction. “We have highly trained, highly skilled staff continuing to produce highend work,” Benton said. “We were letting go good core people.” Now, Quantum has quoted and bidded more work in the past year than at any other time during Benton’s almost 10-year tenure. “There’s an upward swing,” she said. The strengthening economy and more positive figures in the housing market means for some companies like Quantum that they can rehire some employees. A few Quantum workers, including one due to start shortly before Christmas, have returned to their former employer and are once again helping to create quality product for homes, businesses and other buildings throughout the U.S. and Canada. Quantum opened its doors in 1981 when two men, Paul Vexler and Herb Hulse, were looking for local sources to supply windows and doors for their construction business. The product, windows and doors made of mahogany, Douglas fir, teak, oak and other woods, is made to an architect’s or customer’s specifications in Everett. Milling the wood, assembly, painting and staining and glass installation are all done at the workshop. Some oversized window projects require that glass be installed on site because of weight. Many custom homes fitted with Quantum doors or windows are those costing up to $5 million. But that’s not always the case. The company’s wellengineered products are used in smaller homes and business buildings. Other changes at Quantum have included management personnel with new president John Humphreys coming on board in July and doubling his duties in a sales director role. He says that what has partly kept the company going and able to keep its doors open could be due to its longevity. “The bottom line is the company has been around for 30 years,” Humphreys said. The Everett business has focused on higher end architecture and continues to build a strong reputation in and around the U.S. “Our clients are intimate with who we are,” Humphreys said. During the last two years, Quantum has been hiring new sales people. The company has also increased business in British Columbia, California and Hawaii. Quantum’s core product lines, its
STATISTICAL SNAPSHOT
Consumer Price Index, 1982-2012, Seattle-Tacoma-Bremerton area Year 1982 1983 1984 1985 1986 1987 1988 1989 1990 1991 1992 1993 1994 1995 1996 1997 1998 1999 2000 2001 2002 2003 2004 2005 2006 2007 2008 2009 2010 2011 2012
Jan. 97.1 97.6 101.3 104.8 107.3
Feb.
166.5 170.6 176.1 184.0 187.6 191.3 193.5 197.6 203.6 211.704 221.728 224.737 226.085 229.482 235.744
March 96.2 97.7 101.8 105.4 106.6
April
166.4 172.2 177.8 184.2 188.8 192.3 194.3 201.3 207.4 215.767 223.196 225.918 226.513 231.314 237.931
May 98.8 98.7 102.7 105.3 106.1
June
167.5 172.7 179.2 186.3 189.4 191.7 195.3 199.8 208.2 215.510 228.068 227.257 226.118 233.250 239.540
July 97.3 99.7 103.1 105.6 106.2
Aug.
168.5 173.4 180.3 186.8 190.3 194.4 194.6 199.9 209.6 215.978 227.745 227.138 227.645 233.810 240.213
Sept. 99.1 100.5 103.8 105.6 107.0
Oct.
169.3 174.7 182.1 187.9 190.9 193.7 196.5 203.3 209.8 218.427 225.915 226.277 227.251 235.916 241.355
Nov. 97.6 100.7 104.4 106.3 106.9
Dec.
106.8
165.0 169.4 174.4 181.5 186.1 190.0 191.0 195.1 200.9 209.3 218.966 222.580 225.596 226.862 234.812
Annual 97.7 99.3 103.0 105.6 106.7 109.2 112.8 118.1 126.8 134.1 139.0 142.9 147.8 152.3 157.5 163.0 167.7 172.8 179.2 185.7 189.3 192.3 194.7 200.2 207.6 215.656 224.719 226.028 226.693 232.765
HALF1
HALF2
102.1 105.2 106.6 108.2 111.9 116.7 124.2 133.0 137.8 141.9 146.4 151.2 155.6 161.9 166.6 171.6 177.3 184.4 188.3 191.6 194.0 199.2 205.8 213.810 223.569 225.580 226.195 230.815 237.344
103.9 106.0 106.7 110.3 113.8 119.6 129.4 135.2 140.2 143.9 149.2 153.3 159.4 164.1 168.9 174.0 181.1 186.9 190.3 193.1 195.4 201.3 209.5 217.502 225.869 226.475 227.190 234.715
0001803343-01
0001803362-01
18 THE HERALD BUSINESS JOURNAL
MARKET FACTS 2013
Note: 1982-84=100. Only semiannual CPI statistics were compiled between December 1986 and December 1997. Source: U.S. Bureau of Labor Statistics, November 2012
Advanced Skin Therapy of Smokey Point
Stressed and Tired?
19910 Poplar Way Lynnwood JaguarSeattle.com
Pure Comfort for Your Building.
0001803414-01
✦ Office Buildings ✦ Data Rooms ✦ Business Parks LIC # NORTHSH940PL ✦ Shopping Centers ✦ Design ✦ Installation ✦ Service ✦ Maintenance
888-623-HVAC
www.northstarheating.com
Experts in Servicing Medical Facilities & Sensitive Environments.
Green Science, Great Neighbors Since 1991
0001803184-01
360-629-7378
www.prattpest.com
1105 10th St. in Marysville
360-651-8343
www.SmokeyPointSkin.com
CLEAR-VIEW GLASS COMPANY
Auto•Household•Tinting •Vinyl Windows Rock chip repair $24.95 Serving Snohomish County Since 1980 4317 Rucker • Everett 425.258.9399
www.clearviewglass.com
Serving Boeing Employees for over 12 Years! Top 1% of Coldwell Banker Teams in North America.
0001803426-01
Jean Sittauer-Gouge 425-478-7712
Automatic & Standard
TRANSMISSION SERVICE SERVING THE NW FOR OVER 50 YEARS
E-mail: JeanSittauer@cbbain.com
Frederick G. Gouge 425-478-3550
E-mail: FredGouge@cbbain.com
Eric S.Gouge 425-530-85342
E-mail: EricGouge@cbbain.com
Put Our Knowledge, Trust & Experience on Your Side
Transmissions Our Speciality Not a Sideline 425.252.2161 • 1811 Everett Ave. • Everett
0001803641-01
Coldwell Banker Bain - 108 5th Ave S Edmonds,WA 98020
THE HERALD BUSINESS JOURNAL 19
Commercial Pest Solutions
0001803022-01
MARKET FACTS 2013
0001803421-01
Eva of your facility!
(425) 512-9277
16404 Smokey Point Blvd, Suite 205 Arlington, WA 98223
0001803475-01
Serving the Greater Puget Sound Area
FRluEatEion
Body & Brain Yoga & Tai Chi 1319 Hewitt Ave. Everett, WA 98201
bodynbrain.com/everett
Planning + Experienced Installation + Quality =
ay Call Tod a r o f
The yoga and tai chi program at Body & Brain can help you release stress and bring more energy to your life so you can become healthier, happier, more positive and peaceful.
Advanced Aesthetics affordable, cutting-edge, noninvasive therapies that simply Bring Results!
0001803431-01
0001802383-01
0001798411-01
425-640-9222
■ LED Light, MicroCurrent (LIFT) ■ Oxygen, Cellulite Reduction ■ Chemical Peels ■ Mens/Womens Full Body Waxing ■ Broken Capillary, Age Spot Removal & more
Stress relief, more energy, pain management (head, back), core strengthening, improve flexibility and balance, organ health, meditation, breathing, relaxation and more.
MANUFACTURING
Silicon Energy marches into a bright future By M.L. Dehm
20 THE HERALD BUSINESS JOURNAL
MARKET FACTS 2013
HBJ Freelance Writer
MARYSVILLE — Rainy, gray Western Washington may seem an odd location for a solar energy business. But one of the top manufacturers of world-class solar photovoltaic (PV) modules is actually headquartered in a business park in Marysville. Silicon Energy was the first solar module manufacturer in Washington state. The company stands out among the competition for offering customers an almost-unheard-of 30-year power warranty on its systems. “We’re one of the best in the world at doing this and we’re very proud of that,” said Silicon Energy President Gary Shaver. That’s not always the case in an industry that’s booming due to the growing number of federal and state incentives for consumer installation and the ready availability of cheap solar panels from China. Solar companies have popped up all over the U.S. ready to become Silicon Energy’s competition. But that competition doesn’t worry Shaver at all. He knows that the high quality of his company’s products and the fact that their materials are almost all locally sourced swings the balance in his company’s favor. Local sourcing is important to Shaver. “We’re not anti-Chinese. We just want to take care of our village,” he said. “We look very hard for local manufacturers. If we can’t get a local manufacturer, we look for a distributor in Washington.” The metal on the units is fabricated in Seattle. It’s powder coated in Arlington and the actual construction occurs in Marysville. The difference between Silicon Energy’s panels and other solar panels is clear even to the untrained eye, which is why the company welcomes visitors to its showroom. Customers are able to compare competing products side by side. Solar cells are extremely fragile and require sturdy encasement to prevent damage. The Silicon Energy modules are solid and resist movement. The competition’s panels show some give, suggesting that the solar cells inside maybe easily damaged under high wind or pressure. Silicon Energy’s panels feature a double-glass construction. “It gives us amazing durability,” Shaver said. The glass panels are hermetically sealed against moisture. Moisture damage is the most common reason for solar panel failure. In testing conducted by the U.S.
M.L. DEHM / FOR HBJ
Gary Shaver, president of Silicon Energy, points out features that have made their photovoltaic solar modules unique in the industry. Because of their track record in the field and outstanding results in independent laboratory tests, Silicon Energy offers a 30-year guarantee on their panels.
Department of Energy’s National Renewable Energy Laboratory, Silicon Energy’s modules proved to be the most durable modules tested. The laboratory put them through a simulated 80-year performance test and noted no measurable performance loss. Some of the competition exhibited hot spotting and dead zones after a simulated 18 years. “In almost four years now, we’re less than one percent failure rate in the field,” Shaver said. Another feature unique to Silicon Energy is the frame design. Their Cascade model is essentially frameless. Water, snow or ice can easily slip off and there is no place for moss to gain a foothold between the frame and glass. The sleek appearance of the modules, their ability to allow light to pass through along with the option to custom color the hardware means consumers have a lot more flexibility as to where they install their modules.
In addition to traditional roof installations, the modules can be ground mounted or used as patio covers, on carports or on boat docks. The Woodland Park Zoo in Seattle incorporated them as a design feature in the roof of the carousel cover. Wiring for the modules is routed inside the mounting hardware, not only for appearance but also for safety. Enclosed wiring prevents squirrel or rodent damage and reduces the hazard of electrical shock for those working around the system. Safety is another focus for Silicon Energy. Nothing leaves the facility that hasn’t been tested and the modules have earned a high fire safety rating. “We have the highest safety rating in the industry,” Shaver said. Conscious of both safety and environmental impact, the company also ensures workers at the Marysville plant are exposed to no chemicals stronger
than isopropyl alcohol, Shaver said. Water used to clean the modules has to be ultra cleaned itself prior to use in order to ensure a perfect hermetic seal. This means that water leaving the facility may actually be cleaner than it was when it came in. Consumers in the Pacific Northwest are known for being environmentally conscious. In 2008, Seattle was named a Solar America City for its large number of solar installations. Despite the amount of rain received, the state actually receives more sunlight per year than Germany, the world’s solar energy leader. With these statistics in mind, it’s not surprising that Washington should become home to a leading solar power manufacturer. “And we’re not done yet,” Shaver said. “We’re just going to continue to march onwards and upwards.” Learn more information about Silicon Energy at www.silicon-energy.com.
STATISTICAL SNAPSHOT
Snohomish County per capita income, 1969-2011 Personal income $1,030,870,000 $1,042,319,000 $1,043,460,000 $1,104,942,000 $1,243,997,000 $1,635,140,000 $1,635,140,000 $1,864,739,000 $2,122,837,000 $2,584,341,000 $3,201,251,000 $3,714,885,000 $4,144,026,000 $4,380,490,000 $4,584,880,000 $4,975,619,000 $5,411,034,000 $5,937,863,000 $6,434,889,000 $7,176,750,000 $8,171,352,000 $8,978,961,000 $9,651,158,000 $10,455,543,000 $10,978,012,000 $11,692,077,000 $12,383,384,000 $13,578,519,000 $15,356,792,000 $16,512,113,000 $17,359,636,000 $18,893,772,000 $19,826,949,000 $20,136,581,000 $20,627,988,000 $21,632,182,000 $23,200,836,000 $25,578,064,000 $28,328,071,000 $30,427,333,000 $29,482,068,000 $29,858,602,000 $31,266,357,000
Population 1 262,756 265,442 267,945 262,648 266,082 265,883 273,486 279,239 286,965 303,351 323,357 340,545 351,169 356,563 359,921 368,105 377,091 388,967 404,871 425,190 446,325 471,080 484,450 500,283 513,959 523,911 533,870 545,612 568,184 587,350 597,931 609,185 622,390 631,526 635,612 643,533 654,849 670,706 683,997 694,622 706,302 715,358 722,400
Per capita income 2 $3,923 $3,927 $3,894 $4,207 $4,675 $5,315 $5,979 $6,678 $7,398 $8,519 $9,900 $10,909 $11,801 $12,285 $12,739 $13,517 $14,349 $15,266 $15,894 $16,879 $18,308 $19,060 $19,922 $20,899 $21,360 $22,317 $23,196 $24,887 $27,028 $28,113 $29,033 $31,015 $31,856 $31,886 $32,454 $33,615 $35,429 $38,136 $41,415 $43,804 $41,741 $41,739 $43,281
MARKET FACTS 2013
Year 1969 1970 1971 1972 1973 1974 1975 1976 1977 1978 1979 1980 1981 1982 1983 1984 1985 1986 1987 1988 1989 1990 1991 1992 1993 1994 1995 1996 1997 1998 1999 2000 2001 2002 2003 2004 2005 2006 2007 2008 2009 2010 2011
0001803318-01
THE HERALD BUSINESS JOURNAL 21
1: Census Bureau midyear population estimates. Estimates for 2000-2011 reflect county population estimates available as of April 2012. 2: Per capita personal income was computed using Census Bureau midyear population estimates. Estimates for 2000-2011 reflect county population estimates available as of April 2012. Note: All state and local area dollar estimates are in current dollars (not adjusted for inflation). New estimates for 2011; revised estimates for 2009-2010. Last updated Nov. 26, 2012. Source: U.S. Bureau of Labor Statistics, Bureau of Economic Analysis. November 2012
STATISTICAL SNAPSHOT
Snohomish County new housing units building permits, 2002-2012
22 THE HERALD BUSINESS JOURNAL
MARKET FACTS 2013
Snohomish County unincorporated area only YTD total 1,021 35 918 13 8 18 2,013
YTD unit change NA NA NA NA NA NA NA
YTD percent change NA NA NA NA NA NA NA
92 0 88 0 2 2 184
1,189 44 348 25 17 5 1,628
79 -16 212 6 13 5 299
7% -27% 156% 32% 325% NA 22%
79 0 4 1 2 0 86
83 0 0 2 1 0 86
1,110 60 136 19 4 0 1,329
-58 -46 73 -10 -1 0 -42
-5% -43% 116% -34% -20% NA -3%
160 10 0 3 0 0 173
99 14 8 3 0 0 124
136 2 4 3 0 0 145
1,168 106 63 29 5 0 1,371
-22 -4 -101 -25 -9 -1 -162
-2% -4% -62% -46% -64% -100% -11%
67 6 7 6 1 0 87
70 10 0 0 2 0 82
46 16 0 7 1 0 70
41 14 0 4 0 1 60
1,190 110 164 54 14 1 1,533
-1,300 -28 -169 -8 2 -1 -1,504
-52% -20% -51% -13% 17% -50% -50%
153 14 148 9 1 0 325
95 10 29 3 5 0 142
121 28 24 4 1 0 178
130 0 13 7 1 0 151
87 10 6 3 1 0 107
2,490 138 333 62 12 2 3,037
-773 -22 103 -16 0 2 -706
-24% -14% 45% -21% 0% NA -19%
279 14 0 6 2 0 301
289 20 0 4 1 0 314
231 12 5 5 1 0 254
247 18 169 11 0 0 445
166 0 0 5 0 0 171
206 14 24 2 0 0 246
3,263 160 230 78 12 0 3,743
-644 18 98 -21 4 0 -545
-16% 13% 74% -21% 50% NA -13%
348 16 62 5 2 0 433
421 10 0 14 0 0 445
346 8 0 7 0 0 361
276 10 14 14 1 0 315
293 8 0 11 1 0 313
305 16 0 6 1 0 328
3,907 142 132 99 8 0 4,288
833 -22 -91 -34 -3 0 683
27% -13% -41% -26% -27% NA 19%
2012 SF DUP (units) MF (units) MH ADU Other TOTAL
Jan. 81 4 12 2 1 0 100
Feb. 95 0 0 0 0 1 96
March 112 0 372 4 0 2 490
April 125 2 36 3 1 0 167
May 125 2 0 0 1 0 128
June 130 10 4 1 0 2 147
July 127 13 8 1 2 4 155
Aug. 119 4 145 0 2 6 276
Sept. 107 0 341 2 1 3 454
Oct.
Nov.
Dec.
2011 SF DUP (units) MF (units) MH ADU Other TOTAL
97 6 0 1 3 0 107
100 0 8 1 0 0 109
108 8 0 2 2 0 120
89 8 175 6 0 0 278
83 4 8 3 0 0 98
131 2 21 3 4 0 161
69 6 40 1 1 0 117
124 2 4 2 0 0 132
105 2 0 2 3 1 113
91 2 0 2 1 1 97
100 4 4 2 1 1 112
2010 SF DUP (units) MF (units) MH ADU Other TOTAL
146 2 0 1 0 0 149
107 14 4 2 0 0 127
132 0 0 0 0 0 132
95 14 11 2 0 0 122
60 0 0 2 0 0 62
95 0 0 3 0 0 98
82 0 0 2 1 0 85
54 14 15 2 0 0 85
73 16 5 2 0 0 96
104 0 97 0 0 0 201
2009 SF DUP (units) MF (units) MH ADU Other TOTAL
62 4 11 1 1 0 79
43 2 0 3 0 0 48
51 8 11 0 0 0 70
79 0 13 2 0 0 94
102 10 16 3 1 0 132
114 12 0 0 2 0 128
124 2 0 4 1 0 131
73 36 0 2 0 0 111
125 6 0 5 0 0 136
2008 SF DUP (units) MF (units) MH ADU Other TOTAL
148 12 32 2 1 0 195
127 14 7 4 0 0 152
155 4 8 5 1 0 173
136 10 7 2 1 0 156
88 4 24 5 2 0 123
99 4 75 7 2 0 187
100 2 0 8 3 0 113
113 14 4 4 0 0 135
2007 SF DUP (units) MF (units) MH ADU Other TOTAL
254 12 6 5 0 0 277
239 2 0 4 1 0 246
312 22 36 8 0 1 379
311 6 16 5 2 0 340
276 10 22 3 0 1 312
286 8 9 5 0 0 308
226 16 24 6 0 0 272
2006 SF DUP (units) MF (units) MH ADU Other TOTAL
265 12 0 8 0 0 285
302 20 0 5 2 0 329
343 14 0 10 1 0 368
267 4 32 9 0 0 312
340 12 0 2 3 0 357
328 20 0 11 2 0 361
2005 SF DUP (units) MF (units) MH ADU Other TOTAL
250 4 0 4 0 0 258
296 28 7 6 2 0 339
372 8 19 8 0 0 407
343 12 23 6 0 0 384
295 12 0 8 0 0 315
362 10 7 10 1 0 390
STATISTICAL SNAPSHOT 2004 SF DUP (units) MF (units) MH ADU Other TOTAL
Jan. 156 18 13 7 0 0 194
Feb. 220 10 6 7 3 0 246
March 259 34 6 12 0 0 311
April 318 18 3 10 0 0 349
May 252 8 6 10 0 0 276
June 379 18 15 12 0 0 424
July 341 2 7 12 1 0 363
Aug. 237 20 11 16 4 0 288
Sept. 208 6 63 13 0 0 290
Oct. 264 8 7 8 0 0 287
Nov. 185 18 0 15 3 0 221
Dec. 255 4 86 11 0 0 356
YTD total 3,074 164 223 133 11 0 3,605
YTD unit change 582 2 -65 10 2 0 531
YTD percent change 23% 1% -23% 8% 22% NA 17%
2003 SF DUP (units) MF (units) MH ADU Other TOTAL
191 6 0 9 1 0 207
161 6 0 13 0 0 180
197 20 30 9 0 0 256
188 8 21 10 1 0 228
264 16 36 7 2 0 325
183 14 0 13 1 0 211
248 6 0 14 1 0 269
276 6 0 17 3 0 302
208 20 139 9 0 0 376
213 24 14 11 0 0 262
174 16 36 7 0 0 233
189 20 12 4 0 0 225
2,492 162 288 123 9 0 3,074
33 -88 63 -39 -17 -1 -49
1% -35% 28% -24% -65% -100% -2%
2002 SF DUP (units) MF (units) MH ADU Other TOTAL
169 14 24 15 2 0 224
153 10 14 10 2 0 189
176 20 36 9 1 0 242
259 46 12 11 2 0 330
203 18 12 14 3 0 250
279 26 39 10 3 0 357
263 10 50 12 2 1 338
204 26 26 12 2 0 270
201 42 0 23 2 0 268
228 20 0 18 5 0 271
180 10 0 10 2 0 202
144 8 12 18 0 0 182
2,459 250 225 162 26 1 3,123
Terms and abbreviations SF: Single-family detached units (one-unit structures) DUP: Duplex units (units within structure containing two units) MF: Multi-family units (units within structures containing three or more units; includes condominiums) MH: Mobile homes ADU: Accessory dwelling units, or accessory apartments Other: New dwelling units created that aren’t counted in other categories NA: Not applicable Source: Snohomish County Planning and Development Services, November 2012
Compassionate. Affordable. Accessible. www.chcsno.org
Welcoming Medicare Patients No Part B Annual Deductible CLINIC LOCATIONS: Free Annual Wellness Visit Everett 1424 Broadway Personalized Prevention Plan S. Everett 1019 112th St. SW Free Annual Flu Shots Lynnwood 4111 194th St. SW Discounted Fee Program for Co-Pay Edmonds 21701 76th Ave. W Ongoing Care for Chronic Diseases (coming soon) Diabetic and Nutrition Counseling Evening and Saturday Appointments Convenient On-Site Pharmacies for CHC Patients 0001770026-01
THE HERALD BUSINESS JOURNAL 23
■ ■ ■ ■ ■ ■ ■ ■ ■ ■
MARKET FACTS 2013
Call Us Today 425-789-3789
BIOTECH
Seattle Genetics leads with new cancer drug Bothell company’s drug Adcetris is approved to fight lymphoma Story by Eric Fetters Photos by Annie Mulligan
24 THE HERALD BUSINESS JOURNAL
MARKET FACTS 2013
HBJ Freelance Staff
BOTHELL — Blazing a trail, staying ahead of the pack and building a lasting business at the same time is hard for any company to accomplish. In the risky field of biotechnology, it can be doubly difficult. Seattle Genetics, which marks its 15th year in 2013, has accomplished that so far and quietly become one of the region’s largest biotech companies. The Bothell-based company’s first approved drug, Adcetris, is being used to treat patients with Hodgkin’s lymphoma, a cancer of the body’s lymphatic system. But Seattle Genetics’ targeted therapies are being tested against a much longer list of cancers. “We are very focused on Adcetris, on making a difference in the lives of patients with this drug,” said Clay Siegall, chief executive officer and co-founder of Seattle Genetics. “Our vision is that this gets approved for many, many other types of lymphomas.” Seattle Genetics’ anti-cancer drugs aren’t going after easy targets. Upon its approval in August 2011, Adcetris became the first new treatment approved by the U.S. Food and Drug Administration for Hodgkin’s lymphoma in 34 years. Causing the enlargement of lymph nodes, spleen, chronic fever, weight loss, fatigue and other symptoms, about 8,800 new cases of Hodgkin’s lymphoma diagnosed in the U.S. each year, with about 1,300 annual deaths, according to the National Cancer Institute. In studies that led to its approval, Seattle Genetics’ drug was able to shrink tumors in 73 percent of patients with recurring Hodgkin’s lymphoma. In patients with systemic anaplastic largecell lymphoma, for which the drug also was approved, 86 percent saw improvement after using the drug. Adcetris uses an antibody-drug conjugate, a technology in which Seattle Genetics is an acknowledged leader. The company has figured out a better way to attach drugs to antibodies
Scientists perform experiments at lab stations at Seattle Genetics, the leading biotech company in Snohomish County. Seattle Genetics focuses on new cancer medications.
ABOVE: Empty vials fill a yellow bin at Seattle Genetics. They will be used for future experiments at the facility. LEFT: Scientists use a pipette to deliver solutions into bottles for experiments at Seattle Genetics. The company has three drugs currently in clinical trials.
BIOTECH
A research scientist at Seattle Genetics places empty vials in preparation for an experiment.
LEARN MORE Seattle Genetics Inc. Headquarters: Bothell Founded: 1998 Employees: Approximately 550 Stock symbol: SGEN Website: www.seattlegenetics. com
from licensing, collaborations and Adcetris sales. Additionally, with a market value
of more than $3 billion as of early December, Seattle Genetics can boast to being the most valuable publicly
THE HERALD BUSINESS JOURNAL 25
Two scientists at Seattle Genetics work at their lab stations in the Bothell biotech research company.
held company based in Snohomish County. The last biotech company to hold that title was Icos Corp., which grew rapidly ahead of the FDA’s approval of Cialis, an erectile dysfunction drug it developed and marketed with help from Eli Lilly & Co. At its height, Icos employed more than 700 people before it was acquired by Lilly for more than $2 billion in early 2007. That’s not the future Siegall would prefer for Seattle Genetics, he said. “The reason I co-founded this company and the reason we exist is to make a difference in people’s lives. I don’t put much effort into thinking about being acquired,” he said. “Right now, Seattle Genetics has never been stronger.”
MARKET FACTS 2013
that can target specific proteins found in cancer cells. That “smart-bomb” approach can reduce some of the toxic effects of traditional chemotherapy while more potently affecting the targeted cancer. Abbott, Bayer, Genentech, GlaxoSmithKline, Pfizer and others in the biotech and pharmaceutical fields have licensed Seattle Genetics’ “empowered antibodies” and are collaborating on approximately two dozen drug development programs, generating millions in fees for the company. Millennium: The Takeda Oncology Co., a division of a Japanese drug company, is Seattle Genetics’ partner for Adcetris. In the third quarter of 2012, sales of Adcetris — which also has been approved in the European Union — reached $33.7 million, and hit just under $103 million for the first nine months of 2012. That didn’t meet some analysts’ expectations, which had been raised by a fast start when the drug hit the market. But others say the longterm potential for the drug is great. David Miller, president of Biotech Stock Research LLC in Seattle, said he thinks most Wall Street analysts’ estimates are low. “Seattle Genetics is one of those companies I worry about the least. They’re clearly doing what they need to make Adcetris successful and to make the company successful,” said Miller, whose firm has followed Seattle Genetics since 2002. He tends to side with Siegall’s prediction that if Adcetris is approved for the treatment of other cancers, it could eventually become a “blockbuster” drug, one that generates more than $1 billion in annual sales. At present, Adcetris is being tested in more than 20 trials against a variety of cancers in addition to its approved uses, Siegall said. The company has three other drug candidates in clinical trials, with plans to start human trials on three more in the next year. It’s important to keep developing new drugs in order to keep growing, Siegall said. That may delay the point at which Seattle Genetics becomes a consistently profitable enterprise, Siegall said, but it’s an investment in the long-term future of the company. He also pointed out the company’s expenses are smaller than they were before Adcetris was approved. “Our revenues are growing fast enough where we can continue to do research and development without raising more capital,” Siegall said. The company, which has about $300 million on hand and no debt, hasn’t had to raise outside capital in more than two years, thanks to revenues
STATISTICAL SNAPSHOT
2010 Snohomish County population by age, gender and race Grand total White Black Age Total M F Total M F Total 0-4 50,682 25,897 24,785 40,429 20,691 19,737 1,345 5-9 49,954 25,729 24,225 40,880 21,078 19,802 1,155 10-14 49,260 25,207 24,053 40,940 20,978 19,961 1,047 15-19 48,534 24,792 23,742 39,886 20,370 19,516 1,196 20-24 46,203 24,068 22,135 37,532 19,486 18,046 1,617 25-29 51,029 25,771 25,259 41,983 21,250 20,733 1,448 30-34 50,279 25,638 24,641 42,121 21,545 20,576 1,347 35-39 53,023 27,388 25,635 45,236 23,520 21,716 1,286 40-44 53,772 27,742 26,030 46,623 24,198 22,426 1,114 45-49 54,461 27,554 26,908 47,485 24,117 23,369 964 50-54 51,341 25,550 25,791 45,549 22,764 22,785 715 55-59 45,052 22,261 22,791 40,279 19,920 20,359 529 60-64 35,793 17,483 18,310 31,648 15,526 16,121 407 65-69 24,040 11,330 12,709 21,666 10,293 11,373 226 70-74 15,975 7,385 8,590 14,708 6,839 7,870 103 75-79 12,098 5,286 6,813 11,456 5,002 6,454 67 80-84 8,938 3,575 5,363 8,551 3,431 5,120 33 85+ 10,664 3,411 7,253 10,319 3,270 7,049 34 Total 711,100 356,070 355,030 607,291 304,278 303,013 14,632
M 674 581 547 676 1,032 920 870 799 701 620 429 327 210 126 53 31 15 6 8,619
Am. Indian-Am. Native Asian-Pacific Islander Two+ races F Total M F Total M F Total M F 670 935 441 493 3,881 2,032 1,849 4,093 2,058 2,035 574 908 467 441 3,854 2,010 1,844 3,157 1,593 1,564 500 974 499 474 3,755 1,947 1,808 2,544 1,235 1,309 519 981 506 475 4,353 2,213 2,140 2,120 1,028 1,092 584 925 467 458 4,432 2,265 2,167 1,697 818 879 528 903 450 453 5,222 2,423 2,799 1,473 728 745 477 779 390 389 4,840 2,238 2,602 1,192 596 596 487 811 403 408 4,620 2,135 2,486 1,070 531 539 413 779 384 395 4,260 1,967 2,294 995 493 502 344 773 390 383 4,323 1,983 2,340 915 443 472 285 645 299 346 3,753 1,705 2,048 679 352 327 202 593 289 305 3,094 1,457 1,638 557 269 287 197 500 262 237 2,720 1,209 1,511 518 275 243 100 236 106 130 1,648 672 976 264 133 131 50 122 61 61 881 351 530 161 82 79 36 63 27 36 435 187 248 78 39 39 19 32 8 24 265 101 164 57 21 37 27 35 13 21 200 86 114 76 35 41 6,013 10,991 5,462 5,529 56,538 26,980 29,558 21,647 10,730 10,917
26 THE HERALD BUSINESS JOURNAL
MARKET FACTS 2013
Grand total Total non-Hispanic White non-Hispanic Age Total M F Total M F Total M F 0-4 44,541 22,671 21,870 35,176 17,923 17,253 1,223 612 611 5-9 44,975 23,122 21,853 36,580 18,851 17,730 1,040 522 518 10-14 45,162 23,130 22,032 37,436 19,206 18,230 980 511 469 15-19 44,462 22,609 21,854 36,391 18,491 17,900 1,087 616 470 20-24 40,951 21,002 19,949 32,873 16,708 16,165 1,477 945 532 25-29 45,930 22,846 23,084 37,407 18,613 18,794 1,364 866 498 30-34 45,833 23,176 22,657 38,168 19,356 18,812 1,251 808 443 35-39 49,541 25,553 23,989 42,148 21,884 20,264 1,210 753 456 40-44 50,891 26,182 24,709 44,086 22,825 21,261 1,040 652 387 45-49 52,415 26,464 25,951 45,695 23,156 22,540 919 605 314 50-54 49,949 24,869 25,080 44,375 22,171 22,204 680 414 266 55-59 44,147 21,804 22,343 39,526 19,535 19,991 518 319 199 60-64 35,247 17,193 18,054 31,224 15,304 15,920 401 210 192 65-69 23,669 11,160 12,509 21,382 10,170 11,212 220 126 94 70-74 15,713 7,273 8,441 14,494 6,744 7,750 97 50 47 75-79 11,928 5,223 6,705 11,318 4,944 6,374 56 26 30 80-84 8,813 3,532 5,281 8,446 3,390 5,055 30 15 16 85+ 10,590 3,380 7,210 10,249 3,244 7,006 34 6 27 Total 664,759 331,188 333,570 566,975 282,514 284,460 13,627 8,056 5,571
0-4 5-9 10-14 15-19 20-24 25-29 30-34 35-39 40-44 45-49 50-54 55-59 60-64 65-69 70-74 75-79 80-84 85+ Total
Total Hispanic Total M 6,142 3,227 4,979 2,607 4,097 2,077 4,072 2,184 5,252 3,066 5,099 2,924 4,446 2,463 3,482 1,836 2,881 1,561 2,046 1,090 1,392 681 905 458 546 290 371 170 262 113 170 62 125 43 74 31 46,341 24,881
F 2,915 2,372 2,020 1,888 2,186 2,175 1,983 1,646 1,321 956 711 448 256 200 149 108 83 43 21,460
White Hispanic Total M F 5,253 2,769 2,484 4,299 2,227 2,072 3,503 1,772 1,731 3,495 1,879 1,616 4,659 2,778 1,881 4,576 2,636 1,939 3,953 2,189 1,764 3,088 1,637 1,451 2,538 1,373 1,165 1,790 961 829 1,174 593 581 753 385 368 424 223 201 284 123 161 214 94 120 138 58 80 105 41 65 70 27 43 40,317 21,764 18,553
Black Hispanic Total M 121 63 115 59 67 36 109 60 139 87 84 54 97 63 76 46 75 48 45 16 35 15 11 8 6 0 5 0 6 3 10 5 3 0 0 0 1,005 563
F 59 56 31 49 53 30 34 31 26 30 20 3 6 5 3 6 3 0 443
Black non-Hispanic AIAN non-Hispanic API non-Hispanic Two+ races, non-Hisp. Total M F Total M F Total M F Total Me F 743 358 385 3,716 1,937 1,779 3,683 1,842 1,841 6,142 3,227 2,915 780 387 394 3,710 1,934 1,776 2,864 1,429 1,436 4,979 2,607 2,372 830 425 405 3,599 1,870 1,728 2,317 1,117 1,200 4,097 2,077 2,020 827 426 401 4,217 2,129 2,088 1,942 947 995 4,072 2,184 1,888 799 407 392 4,275 2,186 2,089 1,527 756 772 5,252 3,066 2,186 781 374 407 5,071 2,358 2,714 1,306 635 671 5,099 2,924 2,175 674 323 351 4,672 2,164 2,508 1,068 525 543 4,446 2,463 1,983 733 366 368 4,466 2,058 2,408 984 492 492 3,482 1,836 1,646 689 336 354 4,160 1,914 2,245 916 455 462 2,881 1,561 1,321 708 358 349 4,239 1,929 2,310 854 416 438 2,046 1,090 956 596 282 314 3,666 1,672 1,994 633 331 302 1,392 681 711 572 275 297 3,002 1,423 1,578 529 251 278 905 458 448 480 247 233 2,643 1,167 1,476 499 266 233 546 290 256 232 104 128 1,580 632 949 254 128 126 371 170 200 118 61 57 847 337 510 157 80 77 262 113 149 61 27 34 415 187 228 78 39 39 170 62 108 28 6 21 252 101 151 57 21 37 125 43 83 33 12 21 200 86 114 74 33 41 74 31 43 9,685 4,773 4,912 54,730 26,084 28,645 19,743 9,761 9,982 46,341 24,881 21,460 AIAN Hispanic Total M 192 84 127 80 144 74 154 80 126 60 122 76 105 67 77 37 90 48 65 32 49 18 21 13 19 15 4 2 4 0 2 0 4 2 2 2 1,307 690
F 108 47 70 74 66 46 38 40 42 33 32 8 4 2 4 2 2 0 617
API Hispanic Total M 165 95 144 76 156 77 136 83 157 79 151 65 167 73 154 77 101 52 84 54 88 34 92 33 78 42 68 41 34 13 20 0 13 0 0 0 1,808 895
F 70 68 80 52 78 85 94 78 48 30 54 59 35 27 21 20 13 0 913
Two+ races, Hispanic Total M F 411 217 194 293 164 129 227 119 108 178 81 97 170 62 108 167 93 74 124 71 53 86 39 47 79 38 40 61 27 34 46 21 25 27 18 9 19 10 9 9 5 5 5 2 2 0 0 0 0 0 0 2 2 0 1,904 970 935
Notes: The 2010 population estimates by age, gender, race and Hispanic Origin contain 2010 total population estimates by age, gender and race; 2010 non-Hispanic population estimates by age, gender and race; and 2010 Hispanic population estimates by age, gender and race. 2010 non-Hispanic population estimates by age, gender and race; and 2010 Hispanic population estimates by age, gender and race. Please note small numbers in the estimates do not imply precision. They are presented rather than suppressed in order to have all the characteristics add up to the total. Source: Washington State Office of Financial Management, December 2012
0001803360-01
We’re Providence Medical Group. And we’re here for you, Snohomish County.
THE HERALD BUSINESS JOURNAL 27
Call 1-855-4PROVMG (477-6864) or visit www.ProvidenceClinics.org/nw-wa for more information or to make an appointment.
MARKET FACTS 2013
Conveniently located throughout Snohomish County, Providence Medical Group offers your family everything from primary care and extended-hours walk-in urgent care clinics to specialized services in cardiology, neurosurgery, obstetrics, gynecology, sleep health and plastic surgery. And because Providence Medical Group is affiliated with Providence Regional Medical Center in Everett, the region’s most advanced hospital, you can rest assured that you’ll receive some of the best care available, anywhere. It’s good to know this kind of experience is right around the corner when you need it.
REAL ESTATE
JOHN WOLCOTT / FOR HBJ
Quil Ceda Village on the Tulalip Reservation continues to be a growing commercial and shopping hot spot, featuring the Tulalip Resort Casino and hotel, Walmart, Home Depot, Cabela’s and Seattle Premium Outlets with 110 stores.
Commercial market payoff will take patience By John Wolcott
28 THE HERALD BUSINESS JOURNAL
MARKET FACTS 2013
HBJ Freelance Writer
Tom Hoban, CEO of The Coast Group of commercial real estate companies in Everett, predicts the first quarter of 2013 will be sluggish but he sees “a firming up of the market” later in the year. Hoban, also a real estate columnist for The Herald Business Journal, bases his vision of the 2013 commercial real estate market on his 25 years of experience. His property management, investment and brokerage businesses, founded and operated by Hoban and his brother, Shawn, employ 350 people in five Northwestern states and manage properties valued at more than $1 billion. “Commercial property investors and owners are going to need to be very patient through the first quarter,” he said. “There’s just too much uncertainty about the economy that’s carrying over into the new year.” However, he thinks there will be
improvement by the second or third quarter when “previously weak office and retail sectors should firm up … while apartment demand should continue to be strong because the economy is down,” Hoban said. “The unemployed and underemployed can’t afford financing for homes so they’re going to be staying in the rental pool longer.” The big factor to watch is interest rates, he said. “In recent years, we’ve been enjoying very low rates consistently, held low by federal policies, but that won’t last forever. When inflation and higher interest rates kick in, demand will change again and more people will be living in rental housing,” he said. In his own business planning, he’s used high unemployment rates as “the new norm in the American economy” for the past three years, he said. He didn’t expect high unemployment to continue, but after the recent presidential election he’s simply extending that assumption further.
“Since a majority of Americans voted for more of the same, we are forecasting that way as well,” he said. Hoban said he’s seeing more home buyers and apartment renters, particularly young families, explore the strengths of school districts and local schools in deciding where to live. “In just the last year, the frequency of that question from prospective renters has moved from fifth place to third,” he said. “But we believe it’s also about stable schools, without bomb threats and gang problems, as much as it is about what’s going on in the classroom itself. Families with children are sick of the bullying and violence at schools and are paying attention to that when they look for a place to live. People are looking for stability in their lives and their neighborhoods.” Hoban said he expects parts of north and south Snohomish County to have their own individual growth areas. “As for commercial development, there’s a very different outlook for the
southern half than the northern half,” he said. “In the Bothell, Mill Creek and Edmonds areas, the economy is tied more directly to aerospace jobs in the Everett area, driven by Boeing’s hiring and a growing backlog of aircraft orders. “For north county, where much of the county’s future growth is expected, the explosive growth of the Tulalip Tribes’ Quil Ceda Village is the game changer there. The village creates its own employment center all by itself, operating independently of the aerospace industry. There are different dynamics there and you could make a good case for a firming up of housing values and commercial real estate in 2013 simply because of the presence of the Tulalips’ developments.” Hoban has long-term concerns about the length of the weak economy. “I am worried that we could produce a whole class of people, a whole generation of younger Americans who are going to be left behind, a generation
REAL ESTATE
Residential market gathers momentum By M.L. Dehm
HBJ Freelance Writer
JOHN WOLCOTT / FOR HBJ
Seattle Premium Outlets, at the north end of Quil Ceda Village, offers shopping at more than 100 stores. Construction is under way on an additional 100,000 square feet of retail space that will add more than a dozen new stores in 2013.
ers are battling with lenders over foreclosure and refinancing, future viability could be questionable, he said. Its window of opportunity may have come and gone with the growth of retail centers at Alderwood and Quil Ceda Village. “Everett’s heavy dependence on Boeing and below-average household income for its citizens is a real problem for outside interests looking to bring opportunities to Everett,” Hoban said. For 2013, he anticipates the strongest investment categories will be in apartments and mobile home parks, with industrial development being next thanks to aerospace businesses. “In the health-care arena, the strengths of Providence, The Everett Clinic and Swedish Medical Center will with other medical offerings create growth as a sector, while Class A retail space will thrive and Class B and C space will continue struggling in many locations,” Hoban said. “There’s an upward movement from the weaker locations to the stronger ones in retail. That will continue into 2013,” but new businesses will move into spaces left by Blockbuster, Circuit City and others if they’re located in good retail centers.
Continued on Page 30
MARKET FACTS 2013
that could be the first to not live as well as their parents, a generation not used to having our traditional growth patterns and what the effect will be on the economy without the natural upward mobility that we usually expect as people grow older and their earning power improves,” he said. However, even in bad economies there are still wants and needs, Hoban added. The future should be a strong market for big-box stores and discount centers. Also, when people don’t have gainful employment and growth, they remain in apartments longer, which will strengthen that market. “Presently in the county, commercial vacancy rates are still in the teens, and office space — outside of medical and dental space — is still struggling to get filled,” he said. “But apartments and other forms of affordable housing are holding up very well, thriving even.” “But business growth in and around Quil Ceda Village in north county and Alderwood mall in south county will continue to do well because they each have a concentration of economic activity that will power them,” Hoban said. As for the Everett Mall, whose own-
Prices are up and inventory is down. The local residential real estate market favors sellers at the moment. But many potential sellers are sitting back to see what happens rather than put their property up for sale. That’s what Anthony Young and his wife, Briana, of Lake Stevens did for a long time. The Youngs originally put their home on the market in 2011 but took it off after six months produced little interest. “It was getting close to the holidays and we just weren’t getting that much action,” Anthony Young said. The couple sat back and waited, watching to see what the market would do. Recently, they were contacted by their real estate agent to let them know that there were now buyers eager to look at their home. The Youngs have relisted and now hope for a quick sale. It seems likely. Diedre Haines, a regional managing broker in Snohomish County for Coldwell Banker Bain and chairwoman of the board of directors for Northwest Multiple Listing Service, sees many houses bringing in multiple offers. “A lot of buyers out there are very motivated to buy and very frustrated by the fact that there is nothing much to buy,” she said. “We’re just standing at a
place where there is no inventory. The last report I saw was that we had less than a month of standing inventory in Snohomish County.” According to recent statistics from Northwest Multiple Listing Service, housing inventory around Western Washington has reached its lowest level since February 2006. There is a lot of speculation as to what is responsible for the inventory shortage. One contributing factor may be that people think that they can’t sell their house for more than they owe on it. That may not be true anymore. “The best piece of advice that I can give to the consumer is that your house may be worth more than you think and this is a really good time to sell,” Haines said. There are also fewer bank-owned properties going on the market. HAMP, the Home Affordable Modification Program, and HARP, the Home Affordable Refinance Program, have helped struggling home owners with loan modifications, preventing many foreclosures that resulted after the housing bubble burst and led to the 2008 recession. Lack of land for sale has affected the new-home market as well. Lynn Eshleman, a past president of the Master Builders Association of King
M.L. DEHM / FOR HBJ
Realtor Barbara Nachlinger gets ready to open a model home for prospective buyers in Larimer Highlands near Mill Creek.
THE HERALD BUSINESS JOURNAL 29
JOHN WOLCOTT / FOR HBJ
The RAM Restaurant and Brewery opened Dec. 3 at the east side of the Seattle Premium Outlets at Quil Ceda Village. RAM has restaurants across the Pacific Northwest and in several Midwestern states.
REAL ESTATE Residential housing inventory in Snohomish County is at its lowest point since 2006. Recent reports suggest there is less than a month of standing inventory, creating a seller’s market that’s driving up prices and putting builders back to work trying to meet demand. M.L. DEHM FOR HBJ
30 THE HERALD BUSINESS JOURNAL
MARKET FACTS 2013
Continued from Page 29
and Snohomish Counties, no longer sees “ghost developments” up for sale that banks repossessed in the recession. That means less available land for builders to start new plats. “The bankowned and FDIC-owned properties are pretty much gone,” Eshleman said. “There are a few here and there but most of them have been bought up.” Those that have been purchased are generally owned by larger development companies waiting for the right time to start building, Haines said. That time may be now. She has noted increased activity at old building sites as she drives by them. Eric Sprink, president and CEO of Coastal Community Bank, has also seen the recent resurgence in residential home building, but through a different indicator.
“We finance construction loans for home builders and we’re seeing the demand for construction loans increase pretty dramatically because the sales volume is increasing dramatically,” he said. Sprink has also seen, along with continued low interest rates, more first-time home buyers applying for loans and other borrowers refinancing wherever they can. Buyers want to strike deals before mortgage rates increase or home prices climb any higher. In October, the median price for single-family homes and condominiums in Snohomish County was up more than 10 percent compared with October 2011. Trends suggest home values may continue to appreciate if new sales listings remain scarce. Haines said price appreciation depends primarily on a home’s neighborhood. South Snohomish County was once considered the prime local real estate area because of its proximity to King County and its robust job market. But these days many buyers are finding north Snohomish County more desirable. With more biotech and aerospace related firms moving north, fewer workers have to cross the county line for employment. From the builders’ perspective, Eshleman still prefers south Snohomish County for location. But one thing that Haines, Eshleman and Sprink all agree on is that the county is in pretty good shape overall. That means continued recovery in the realestate market. “Yields for the year, at least for us, are higher than our original projections,” Eshleman said. “All our
indications are that we are moving forward quickly.” Looking closer to home, Haines believes an economic crisis would have to be pretty severe to affect Snohomish County now. “We’ve got so many positives going on in our county,” Haines said. “I would say, over the three major counties of the Puget Sound (King, Pierce and Snohomish), we may be in the best position of the three.” Sprink sees the local picture in terms of the number of business loan requests that pass through the doors of his bank. “The trends are positive. We’re seeing it,” he said. But the real proof is not just whether sellers can sell but whether they can find a replacement to buy. Fortunately for the Youngs, they found a home to buy as they wait for their own to sell. “It’s a house that had been foreclosed on but it’s in beautiful condition for the price,” Anthony Young said.
STATISTICAL SNAPSHOT
NORTHWEST MULTIPLE LISTING SERVICE
Snohomish County Northwest Multiple Listing Service area sales zones
Snohomish County home sales and prices, 2005-2012 Year-end median $379,950 $337,400 $305,000 $275,000 $251,500 $251,950 $297,000
$355,000 $304,700 $279,900 $271,950 $247,950 $250,000 $279,950
Notes: All dollar figures shown are based on the closing sales price. Sales figures and amounts for 2012 are based on figures available through Oct. 31, 2012. Source: Northwest Multiple Listing Service, November 2012
Year-end median $439,950 $382,450 $356,000 $316,225 $297,950 $289,950 $345,369 $225,000 $214,000 $197,250 $209,500 $215,000 $212,950 $209,950 $419,000 $345,925 $327,950 $310,000 $293,000 $287,000 $325,000
Data continued on Page 32
THE HERALD BUSINESS JOURNAL 31
$189,775 $209,950 $177,990 $185,000 $190,000 $184,400 $187,000
Single-family homes, 2006 MLS Sales, Sales, Average sales price area 2006 2005 YTD 2006 YTD 2005 610 1,773 1,909 $468,308 $402,764 730 2,551 2,579 $431,520 $378,068 740 3,658 4,058 $388,981 $330,922 750 1,390 1,659 $357,408 $301,484 760 1,643 1,503 $315,431 $277,623 770 2,767 3,041 $315,201 $270,475 Total 13,782 14,749 $380,295 $327,259 Condominiums, 2006 610 292 276 $239,598 $197,987 730 1,047 950 $236,923 $231,484 740 1,098 1,106 $208,518 $183,398 750 70 82 $216,562 $199,007 760 81 101 $211,734 $186,146 770 105 89 $209,750 $191,010 Total 2,693 2,604 $223,286 $203,345 Combined single-family homes, condos 2006 610 2,065 2,185 $435,969 $376,897 730 3,598 3,529 $374,894 $338,606 740 4,756 5,164 $347,320 $299,326 750 1,460 1,741 $350,655 $296,658 760 1,724 1,604 $310,560 $271,863 770 2,872 3,130 $311,347 $268,215 Total 16,475 17,353 $354,631 $308,664
MARKET FACTS 2013
Single-family homes, 2005 MLS Sales, Sales, Average sales price area 2005 2004 YTD 2005 YTD 2004 610 1,909 1,707 $402,764 $340,038 730 2,579 2,416 $378,068 $318,585 740 4,058 3,729 $330,923 $283,602 750 1,659 1,360 $301,484 $262,832 760 1,503 1,522 $277,624 $237,750 770 3,041 2,826 $270,476 $227,554 Total 14,749 13,560 $327,259 $278,029 Condominiums, 2005 610 276 204 $197,988 $192,206 730 950 857 $231,485 $200,092 740 1,106 1,040 $183,398 $174,377 750 82 45 $199,007 $144,395 760 101 74 $186,147 $153,956 770 89 78 $191,010 $144,881 Total 2,604 2,298 $203,346 $183,304 Combined single-family homes, condos, 2005 610 2,185 1,911 $376,898 $324,258 730 3,529 3,273 $338,607 $287,558 740 5,164 4,769 $299,326 $259,783 750 1,741 1,405 $296,658 $259,038 760 1,604 1,596 $271,863 $233,864 770 3,130 2,904 $268,216 $225,334 Total 17,353 15,858 $308,664 $264,302
32 THE HERALD BUSINESS JOURNAL
MARKET FACTS 2013
STATISTICAL SNAPSHOT Single-family homes, 2007 MLS Sales, Sales, Average sales price area 2007 2006 YTD 2007 YTD 2006 610 1,595 1,773 $499,919 $468,308 730 1,984 2,551 $461,164 $431,520 740 2,616 3,658 $411,759 $388,980 750 955 1,390 $385,745 $357,408 760 1,239 1,643 $349,430 $315,431 770 2,059 2,767 $345,105 $315,201 Total 10,448 13,782 $411,694 $380,294 Condominiums, 2007 610 334 292 $255,654 $239,598 730 844 1,047 $300,783 $236,923 740 1,026 1,098 $245,244 $208,518 750 95 70 $207,675 $216,561 760 69 81 $227,819 $211,733 770 124 105 $228,856 $209,750 Total 2,492 2,693 $262,719 $223,285 Combined, single-family homes, condos, 2008 610 1,929 2,065 $457,625 $435,968 730 2,828 3,598 $413,299 $374,894 740 3,642 4,756 $364,849 $347,319 750 1,050 1,460 $369,634 $350,655 760 1,308 1,724 $343,015 $310,559 770 2,183 2,872 $338,501 $311,346 Total 12,940 16,475 $383,004 $354,631 Single-family homes, 2008 MLS Sales, Sales, Average sales price area 2008 2007 YTD 2008 YTD 2007 610 1,055 1,595 $451,470 $499,918 730 1,096 1,984 $407,605 $461,163 740 1,562 2,616 $383,554 $411,758 750 548 955 $359,103 $385,745 760 835 1,239 $326,878 $349,429 770 1,195 2,059 $316,903 $345,105 Total 6,291 10,448 $376,821 $411,694 Condominiums, 2008 610 155 334 $286,372 $255,654 730 558 844 $293,926 $300,782 740 584 1,026 $249,178 $245,244 750 29 95 $238,170 $207,675 760 149 69 $271,444 $227,818 770 76 124 $223,494 $228,856 Total 1,551 2,492 $269,668 $262,719 Combined single-family homes, condos, 2008 610 1,210 1,929 $430,322 $457,624 730 1,654 2,828 $369,254 $413,299 740 2,146 3,642 $346,985 $364,849 750 577 1,050 $353,024 $369,634 760 984 1,308 $318,484 $343,014 770 1,271 2,183 $311,319 $338,501 Total 7,842 12,940 $355,628 $383,004 Single-family homes, 2009 MLS Sales, Sales, Average sales price area 2009 2008 YTD 2009 YTD 2008 610 1,051 1,055 $396,593 $451,470 730 1,320 1,096 $359,857 $407,605 740 1,640 1,562 $323,531 $383,553 750 522 548 $302,182 $359,102 760 816 835 $281,207 $326,877 770 1,295 1,195 $266,394 $316,903 Total 6,644 6,291 $324,294 $376,820 Condominiums, 2009 610 182 155 $272,049 $286,371 730 459 558 $262,074 $293,925 740 495 584 $227,786 $249,177 750 20 29 $165,803 $238,170 760 87 149 $250,955 $271,444 770 88 76 $205,174 $223,494 Total 1,331 1,551 $244,751 $269,668 Combined single-family homes, condos, 2009 610 1,233 1,210 $378,210 $430,321 730 1,779 1,654 $334,628 $369,254 740 2,135 2,146 $301,333 $346,984 750 542 577 $297,149 $353,023 760 903 984 $278,292 $318,483 770 1,383 1,271 $262,497 $311,318 Total 7,975 7,842 $311,018 $355,627
Year-end median $471,708 $400,975 $369,950 $340,000 $321,000 $320,000 $371,000 $242,700 $270,000 $229,950 $192,500 $222,900 $235,000 $239,999 $440,000 $369,521 $334,990 $329,725 $316,875 $315,000 $349,500 Year-end median $429,000 $369,950 $349,350 $322,000 $302,500 $296,999 $345,000 $275,000 $249,245 $228,000 $225,000 $279,990 $229,990 $247,000 $411,450 $335,000 $320,075 $315,000 $299,249 $292,800 $325,000 Year-end median $380,000 $325,000 $299,950 $275,000 $258,000 $250,000 $299,950 $260,225 $250,000 $219,779 $158,250 $256,000 $206,000 $235,000 $360,000 $305,000 $284,900 $270,000 $258,000 $246,945 $289,491
Single-family homes, 2010 MLS Sales, Sales, Average sales price area 2010 2009 YTD 2010 YTD 2009 610 1,077 1,051 $382,427 $396,592 730 1,284 1,320 $342,555 $359,857 740 1,829 1,640 $309,095 $323,531 750 632 522 $271,466 $302,182 760 935 816 $259,810 $281,207 770 1,335 1,295 $252,541 $266,393 Total 7,092 6,644 $305,792 $324,293 Condominiums, 2010 610 176 182 $215,115 $272,049 730 368 459 $241,045 $262,074 740 475 495 $202,933 $227,786 750 38 20 $167,555 $165,803 760 97 87 $231,912 $250,954 770 74 88 $183,293 $205,174 Total 1,228 1,331 $216,111 $244,751 Combined single-family homes, condos, 2010 610 1,253 1,233 $358,926 $378,209 730 1,652 1,779 $319,944 $334,628 740 2,304 2,135 $287,207 $301,333 750 670 542 $265,573 $297,149 760 1,032 903 $257,188 $278,292 770 1,409 1,383 $248,906 $262,497 Total 8,320 7,975 $292,556 $311,018 Single-family homes, 2011 MLS Sales, Sales, Average sales price area 2011 2010 YTD 2011 YTD 2010 610 1,161 1,077 $356,390 $382,426 730 1,519 1,284 $303,954 $342,555 740 1,998 1,829 $266,745 $309,094 750 696 632 $244,048 $271,466 760 900 935 $220,544 $259,809 770 1,497 1,335 $217,307 $252,541 Total 7,771 7,092 $270,504 $305,792 Condominiums, 2011 610 188 176 $183,312 $215,115 730 556 368 $214,722 $241,045 740 540 475 $152,383 $202,932 750 45 38 $107,058 $167,555 760 53 97 $168,614 $231,911 770 163 74 $165,605 $183,293 Total 1,545 1,228 $179,212 $216,110 Combined single-family homes, condos, 2011 610 1,349 1,253 $332,270 $358,926 730 2,075 1,652 $280,044 $319,943 740 2,538 2,304 $242,413 $287,206 750 741 670 $235,728 $265,573 760 953 1,032 $217,656 $257,187 770 1,660 1,409 $212,229 $248,905 Total 9,316 8,320 $255,364 $292,555 Single-family homes, through October 2012 MLS Sales, Sales, Average sales price area YTD 2012 YTD 2011 YTD 2012 YTD 2011 610 1,174 967 $359,405 $356,753 730 1,460 1,260 $319,462 $301,287 740 1,977 1,609 $284,062 $267,524 750 661 567 $248,195 $245,873 760 876 743 $233,374 $221,282 770 1,406 1,235 $217,280 $215,510 Total 7,554 6,381 $281,167 $270,338 Condominiums, 2012 610 183 161 $151,018 $183,890 730 481 472 $187,586 $220,822 740 513 435 $154,450 $156,381 750 43 35 $136,658 $105,582 760 52 44 $160,352 $171,933 770 107 136 $156,329 $166,820 Total 1,379 1,283 $165,366 $183,794 Combined single-family homes, condos, 2012 610 1,357 1,128 $331,303 $332,081 730 1,941 1,732 $286,782 $279,359 740 2,490 2,044 $257,360 $243,871 750 704 602 $241,384 $237,717 760 928 787 $229,282 $218,523 770 1,513 1,371 $212,970 $210,679 Total 8,933 7,664 $263,291 $255,850
Year-end median $360,000 $300,000 $280,000 $246,750 $243,990 $232,500 $275,000 $224,500 $230,000 $200,000 $159,500 $241,000 $180,395 $210,000 $343,500 $289,000 $262,000 $240,000 $242,973 $230,000 $265,000 Year-end median $336,450 $265,000 $245,000 $225,000 $210,000 $195,000 $243,000 $152,500 $184,873 $125,000 $80,000 $182,000 $171,500 $162,000 $320,335 $248,000 $223,250 $215,000 $209,900 $189,900 $230,000 YTD median $349,945 $285,000 $265,000 $225,000 $225,000 $201,250 $259,900 $122,500 $158,000 $130,000 $75,000 $167,500 $172,500 $144,000 $328,500 $259,780 $241,175 $219,450 $220,000 $199,500 $241,604
STATISTICAL SNAPSHOT
Snohomish County housing, 2000-2012 Stanwood
Sultan
Woodway
Granite Falls 873 634 185 54 944 699 191 54 1,028 730 244 54 1,090 786 250 54 1,132 824 254 54 1,150 842 254 54 1,157 849 254 54 1,198 890 254 54 1,233 924 254 55 1,257 934 260 63 1,344 990 274 80 1348 994 274 80 1351 997 274 80
Snohomish
Gold Bar 769 517 31 221 778 529 31 218 789 533 33 223 798 537 35 226 807 541 35 231 813 546 35 232 821 552 35 234 841 569 35 237 855 583 35 237 828 588 35 205 837 525 28 284 831 525 28 278 832 525 28 279
Mukilteo
Everett 38,512 18,571 18,720 1,221 40,391 19,420 19,537 1,434 40,923 19,499 20,027 1,397 41,228 19,647 20,180 1,401 41,560 19,762 20,336 1,462 41,981 19,868 20,651 1,462 43,304 20,572 21,260 1,472 43,580 20,747 21,377 1,456 43,895 20,967 21,519 1,409 44,384 21,142 21,833 1,409 44,609 21,299 22,076 1,234 44,656 21,349 22,088 1,219 44,765 21,436 22,101 1,228
Mountlake Terrace
Edmonds 17,519 11,392 6,035 92 17,521 11,394 6,036 91 17,506 11,375 6,038 93 17,614 11,428 6,093 93 17,727 11,480 6,154 93 17,873 11,502 6,276 95 18,152 11,582 6,475 95 18,231 11,620 6,515 96 18,326 11,643 6,586 97 18,419 11,675 6,647 97 18,378 11,685 6,664 29 18,396 11,701 6,665 30 18,414 11,704 6,683 27
Monroe
Darrington 505 386 32 87 569 404 34 131 590 416 34 140 600 423 34 143 610 430 34 146 621 440 34 147 638 453 34 151 643 458 34 151 648 465 34 149 653 468 34 151 644 485 35 124 644 486 35 123 644 486 35 123
Mill Creek
Brier 2,115 2,067 29 19 2,135 2,087 29 19 2,140 2,092 29 19 2,145 2,096 29 20 2,153 2,103 29 21 2,161 2,111 29 21 2,165 2,114 29 22 2,165 2,114 29 22 2,163 2,110 32 21 2,166 2,115 32 19 2,220 2,162 31 27 2,226 2,168 31 27 2,249 2,191 31 27
Marysville
Bothell (exc. King Co.) 5,321 3,742 895 684 5,603 3,750 1,169 684 5,779 3,760 1,335 684 5,773 3,756 1,333 684 5,811 3,794 1,333 684 5,863 3,838 1,341 684 5,973 3,925 1,358 690 6,114 4,007 1,417 690 6,228 4,078 1,442 708 6,334 4,132 1,442 760 6,702 4,396 1,510 796 6,780 4,474 1,510 796 6,817 4,511 1,510 796
Lynnwood
Arlington 4,588 3,060 1,237 291 4,982 3,343 1,259 380 5,200 3,552 1,271 377 5,487 3,748 1,358 381 5,655 3,900 1,374 381 5,762 3,977 1,404 381 5,953 4,118 1,454 381 6,476 4,436 1,659 381 6,624 4,506 1,735 383 6,655 4,530 1,742 383 6,929 4,564 1,771 594 6,931 4,566 1,771 594 6,941 4,587 1,773 581
Lake Stevens
Incorp. Snoho. Co. 127,219 75,439 46,863 4,917 131,498 77,705 48,181 5,612 133,709 78,733 49,371 5,605 136,046 79,895 50,544 5,607 137,842 81,001 51,211 5,630 139,913 82,052 52,106 5,755 145,610 86,110 53,737 5,763 150,426 89,951 54,614 5,861 152,323 91,523 55,051 5,749 153,897 92,608 55,494 5,795 168,634 104,713 57,939 5,982 169,346 105,402 57,994 5,950 170,028 106,041 58,034 5,953
100 2,234 90 1,778 6 456 4 101 2,335 91 1,874 6 460 4 1 101 2,371 91 1,910 6 460 4 1 100 2,420 90 1,955 6 464 4 1 100 2,483 90 2,017 6 464 4 2 100 2,502 90 2,032 6 468 4 2 101 3,536 90 2,849 6 655 5 32 102 5,009 90 3,938 6 955 6 116 100 5,486 90 4,415 6 955 4 116 100 5,611 90 4,544 6 951 4 116 116 10,414 103 8,240 6 1,801 7 373 117 10,470 104 8,293 6 1,804 7 373 117 10,583 104 8,398 6 1,812 7 373
13,808 6,992 6,236 580 13,877 7,037 6,264 576 13,896 7,049 6,264 583 14,149 7,110 6,471 568 14,278 7,191 6,523 564 14,482 7,260 6,558 664 14,533 7,378 6,593 562 14,629 7,443 6,627 559 14,680 7,497 6,643 540 14,713 7,523 6,652 538 14,939 7,640 6,748 551 14,947 7,648 6,748 551 14,961 7,661 6,749 551
9,730 5,977 2,718 1,035 10,392 6,258 2,731 1,403 10,712 6,568 2,735 1,409 11,004 6,822 2,770 1,412 11,215 7,046 2,798 1,371 11,464 7,235 2,847 1,382 12,517 7,874 3,207 1,436 14,228 9,526 3,239 1,463 14,548 9,826 3,256 1,466 14,824 10,081 3,272 1,471 22,363 17,197 3,935 1,231 22,649 17,488 3,940 1,221 22,868 17,701 3,940 1,227
4,769 3,185 1,541 43 4,981 3,353 1,598 30 5,400 3,406 1,966 28 5,727 3,448 2,252 27 6,038 3,498 2,517 23 6,265 3,520 2,722 23 7,371 4,615 2,732 24 7,442 4,684 2,732 26 7,493 4,762 2,732 (1) 7,729 4,996 2,732 1 7,923 5,060 2,854 9 7,991 5,129 2,854 8 8,005 5,143 2,854 8
4,427 3,043 1,271 113 4,543 3,140 1,291 112 4,648 3,205 1,329 114 4,753 3,303 1,337 113 4,899 3,441 1,346 112 5,067 3,577 1,379 111 5,160 3,619 1,429 112 5,239 3,690 1,433 116 5,311 3,730 1,469 112 5,339 3,743 1,483 113 5,306 3,740 1,477 89 5,326 3,760 1,477 89 5,359 3,793 1,477 89
8,217 5,061 3,037 119 8,226 5,063 3,044 119 8,291 5,095 3,074 122 8,343 5,130 3,091 122 8,375 5,150 3,103 122 8,456 5,187 3,147 122 8,480 5,214 3,144 122 8,487 5,221 3,144 122 8,540 5,243 3,174 123 8,555 5,251 3,180 124 8,602 5,293 3,207 102 8,643 5,322 3,220 101 8,684 5,364 3,218 102
7,146 4,589 2,538 19 7,289 4,701 2,569 19 7,377 4,789 2,569 19 7,680 4,857 2,804 19 7,731 4,908 2,804 19 7,781 4,958 2,804 19 7,876 5,034 2,823 19 8,019 5,108 2,892 19 8,040 5,129 2,892 19 8,076 5,159 2,897 20 8,547 5,469 3,070 8 8,574 5,496 3,070 8 8,590 5,512 3,070 8
3,444 2,078 1,269 97 3,478 2,100 1,281 97 3,486 2,101 1,287 98 3,549 2,142 1,308 99 3,559 2,144 1,316 99 3,641 2,173 1,364 104 3,730 2,226 1,400 104 3,747 2,238 1,406 103 3,756 2,269 1,419 68 3,807 2,305 1,426 76 3,959 2,380 1,524 55 4,013 2,411 1,545 57 4,017 2,415 1,545 57
1,508 1,028 480 1,538 1,038 500 1,581 1,064 517 1,635 1,091 544 1,718 1,128 588 2 1,885 1,289 588 8 1,993 1,343 642 8 2,098 1,452 642 4 2,214 1,565 646 3 2,256 1,605 646 5 2,584 1,851 727 6 2,586 1,854 727 5 2,608 1,877 727 4
1,291 908 147 236 1,469 1,080 151 238 1,526 1,135 153 238 1,564 1,141 185 238 1,590 1,155 197 238 1,621 1,184 199 238 1,713 1,268 207 238 1,739 1,283 218 238 1,743 1,283 222 238 1,746 1,284 224 238 1,752 1,168 201 383 1,752 1,168 201 383 1,756 1,169 201 386
343 341 2 346 344 2 365 363 2 387 385 2 401 399 2 425 423 2 437 435 2 439 437 2 440 438 2 445 443 2 466 466 466 466 467 467 -
Index
Unincorp. Snoho. Co. 108,986 79,739 15,799 13,448 109,969 80,496 16,051 13,422 113,103 82,621 16,895 13,587 115,918 84,850 17,354 13,714 118,812 87,200 17,795 13,817 121,849 89,765 18,162 13,922 122,087 90,559 17,793 13,735 122,815 91,360 17,782 13,673 125,242 93,345 18,193 13,704 126,821 94,542 18,549 13,730 118,025 86,980 17,613 13,432 119,093 87,871 17,771 13,451 120,564 88,977 17,613 13,475
Notes: The 2010 counts for total housing units represent federal census counts, special city census counts, or OFM adjusted counts that control for annexations occurring between Jan. 1 and April 1 in the decennial census year. Estimates of housing units by structure type for 2010 are developed using an allocation procedure based on Census 2010 Summary File 1 data, housing completion data reported by cities and counties (2000-2009), annexation census data (2000-2009), and Census 2000 Summary File 3 data. The resulting 2010 estimates maintain the 2010 census counts of total housing units, occupied housing units and population in housing units. Housing unit estimates after 2010 are developed using housing completion data reported by cities and counties (2011 to present), and annexation census data (2011 to present). Historical postcensal housing unit estimates are revised in cases where more accurate data become available. Source: Washington State Office of Financial Management, November 2012
THE HERALD BUSINESS JOURNAL 33
236,205 155,178 62,662 18,365 241,467 158,201 64,232 19,034 246,812 161,354 66,266 19,192 251,964 164,745 67,898 19,321 256,654 168,201 69,006 19,447 261,762 171,817 70,268 19,677 267,697 176,669 71,530 19,498 273,241 181,311 72,396 19,534 277,565 184,868 73,244 19,453 280,718 187,150 74,043 19,525 286,659 191,693 75,552 19,414 288,439 193,273 75,765 19,401 290,592 195,018 76,146 19,428
MARKET FACTS 2013
2000 total housing units 2000 one-unit housing units 2000 2+ unit housing units 2000 mobile homes, specials 2001 total housing units 2001 one-unit housing units 2001 2+ unit housing units 2001 mobile homes, specials 2002 total housing units 2002 one-unit housing units 2002 2+ unit housing units 2002 mobile homes, specials 2003 total housing units 2003 one-unit housing units 2003 2+ unit housing units 2003 mobile homes, specials 2004 total housing units 2004 one-unit housing units 2004 2+ unit housing units 2004 mobile homes, specials 2005 total housing units 2005 one-unit housing units 2005 2+ unit housing units 2005 mobile homes, specials 2006 total housing units 2006 one-unit housing units 2006 2+ unit housing units 2006 mobile homes, specials 2007 total housing units 2007 one-unit housing units 2007 2+ unit housing units 2007 mobile homes, specials 2008 total housing units 2008 one-unit housing units 2008 2+ unit housing units 2008 mobile homes, specials 2009 total housing units 2009 one-unit housing units 2009 2+ unit housing units 2009 mobile homes, specials 2010 total housing units 2010 one-unit housing units 2010 2+ unit housing units 2010 mobile homes, specials 2011 total housing units 2011 one-unit housing units 2011 2+ unit housing units 2011 mobile homes, specials 2012 total housing units 2012 one-unit housing units 2012 2+ unit housing units 2012 mobile homes, specials
Snohomish County
Postcensal housing estimates, April 1, 2000, to April 1, 2012
AEROSPACE
Tech manufacturer flourishes in Granite Falls By M.L. Dehm
34 THE HERALD BUSINESS JOURNAL
MARKET FACTS 2013
HBJ Freelance Writer
GRANITE FALLS — Aerospace is a key industry in Washington state, one that is still growing, and Snohomish County is home to many leading aerospace related firms. One local company that manufactures precision machine parts and assemblies for aerospace, defense and other commercial industries is the AS9100-certified Cobalt Enterprises Inc. in Granite Falls. Cobalt Vice President Paul Clark admits the company tends to run under the radar. “We don’t have a sales force,” he said. “Work comes in by word of mouth.” Even so, the company that is housed in two small warehouses off the Mountain Loop Highway is projected to bring in more than $6 million in sales this year. Some of their customers include Crane Aerospace, Northwest Aerospace, Jamco America, Systima Technologies and General Dynamics. It’s an impressive list for a company that is just eight years old. “I started it in a garage,” said company President Frederick Schule. What he often doesn’t tell people are the stressful circumstances around the start up. The company that Schule had been working for had closed. His wife, Debbie, who had a pre-existing heart condition, found she needed openheart surgery. Because the company shut down, she was left with no health insurance. “COBRA (the federal Consolidated Omnibus Budget Reconciliation Act that allows former employees to remain on a company’s insurance plan) doesn’t apply if the company goes out of business,” Schule said. “Most people don’t know that.” The medical bills began to pile up along with his worries for her health. Meanwhile, some customers at the company he used to work for had been left hanging. Schule had to choose between accepting some offers to work for someone else or take a chance, start his own company and take on these customers. He decided to start Cobalt Enterprises Inc. After four or five months of working out of his garage, Schule noticed some warehouses being built nearby. It seemed like a good location. It was certainly an easy commute and the quality of life was good in Granite Falls. By 2005, Cobalt had moved into the new warehouses and continued to grow.
M.L. DEHM / FOR HBJ
Machinist Steve Beak sets up parts by one of Cobalt Enterprise’s state-of-theart Mori Seiki milling machines. Even when finances were tight, company President Frederick Schule was determined to buy the highest quality equipment available.
M.L. DEHM / FOR HBJ
Hailey Francis assembles panels at Cobalt Enterprises’ warehouses in Granite Falls. The company that began as a precision machine shop in 2004 now also offers assemblies and paint for customers. Vertical integration is one of Cobalt’s goals, said company President Frederick Schule.
From the start, Schule laid a few ground rules for his new company that he felt sure would lead to success. He would not do sub-tier work — work for other machine shops. No customer should take more than 25 percent of Cobalt’s manufacturing capacity and quality was paramount. Better to be a little late than to compromise quality, he believed. “We were even growing during the tough times because of the quality,” Schule said. He brought in the best state-of-theart equipment from top company Mori Seiki. It’s a name that carries a lot of weight with customers who are in the know. Then Cobalt started to vertically integrate. Currently they not only offer machining, they can also do assemblies and paint for customers. When Cobalt was founded, the company’s customers came from a variety of commercial industries. By the time of the 2008 economic downturn, the focus had shifted more towards aerospace. The timing of the shift was good. But because the level of equip-
ment they were purchasing was very high, there were still significant economic constrictions. In late 2008, Schule met with his employees and let them decide whether they would accept an across-the-board wage cut or if they should let some coworkers go instead. The employees opted to take the wage cut and keep the team intact. The team’s move impressed Schule and left him touched by their dedication both to the company and to one another. “I never heard any complaints,” he said. After Cobalt posted some profitable quarters, he was glad to be able to restore the employees’ wages. It was around the time of the economic downturn that Cobalt began taking on additional business from companies that were going under. They were also able to start making small motors for defense industry UAVs, the unmanned aerial vehicles more commonly referred to as drones. In 2011, Clark joined Cobalt as vice president. A banker introduced Schule
to Clark, thinking they would be a good match. They were. “We come at it from opposite ends,” Clark said. “Fred’s from the production side and I’m coming from the financial industry.” Together they plan to refine and grow the business. They are researching lean practices and discovering ways that they can include more vertical integration, not just building a part and sending it but making full assemblies for their customers. “This level of equipment and capability isn’t usually found in a little town like Granite Falls,” Schule said. While most of Cobalt’s employees live in the Granite Falls and Lake Stevens area, there are a few that live farther away. These are often the employees who hand-deliver parts to their customers as part of the company’s service. Another person who delivers parts for the company is Debbie Schule. “She’s doing great,” Schule said. Remembering his own troubles with health insurance, Schule makes sure his employees are fully covered. He also makes sure they are fully trained in-house and is willing to listen to any suggestions they may have for the firm. “The only thing we’re not open minded about is quality,” he said.
SNOHOMISH COUNTY AEROSPACE COMPANIES City Snohomish Everett Everett Arlington Arlington Bothell Mukilteo Arlington Snohomish Everett Mukilteo Everett Marysville Marysville Everett Arlington Everett Arlington Arlington Mill Creek Bothell Mukilteo Mukilteo Arlington Mukilteo Everett Lynnwood Everett Everett Marysville Everett Everett Everett Arlington Everett Everett Everett Everett Marysville Everett Everett Mukilteo Everett Woodinville Everett Granite Falls Mukilteo M. Terrace Arlington Mukilteo Arlington Everett Marysville Lynnwood Everett Everett Mukilteo Monroe Mukilteo Mukilteo Everett Mukilteo Edmonds Everett Arlington Everett Everett Mukilteo Arlington Mukilteo Everett Arlington Arlington
Contact 425-742-7665 www.aepetsche.com www.aaronelectronics.com www.absolutemfg.com www.americanboilerworks.com www.accramfg.com 425-745-0227 acromachining.com www.agmco.net 425-787-9968 aeromacinc.com www.aeroacoustics.com www.aerocell.us www.aeroforminc.com www.aeromechinc.com www.aerotestsvc.com 425-377-9525 www.aerospacemachine.net www.amtnw.com www.lrt-inc.com www.aint.com www.apacheaerospace.com www.asco.be www.aviationcovers.com www.aviationinstrument.com www.atsmro.aero www.avtcorp.com www.avtcorp.com www.tyeeair.com www.beaerospace.com www.ballardtech.com www.bartonmachine.com www.bluestreak-finishers.com 360-435-3928 www.boeing.com www.blrvgs.com www.bridgeways.org www.bucher-group.com www.zodiac.com www.canamaero.com cannonaircraftinteriors.com www.cascade-aviation.com www.castlecookeaviation.com www.cnaflextool.com www.coastal-mfg.com www.cobaltent.com 425-743-4910 www.askogroup.com 360-403-7800 www.cpc-web.com www.compositesone.com www.contouraerospace.com 360-658-1977 www.craneaerospace.com www.crownaviation.com 425-355-4422 www.d3tech.com www.damarmachine.com www.godiversified.com www.eaton.com www.edjprecision.com www.electroimpact.com 425-775-2100 www.esterline.com/korry 360-403-8994 www.exotictoolwelding.com www.alcoa.com www.fokker.com 360-435-5966 www.geaviationsystems.com www.giddens.com www.glasairaviation.com globalmachineworks.com
Description Offers specialized deburring and blending finishes Supplier of high-performance interconnect products and related services Engineering and contract assembly and manufacturing (formerly Bilocon) Specializes in production CNC milling and CNC turning. ISO 9002 Designs and manufactures fixed and mechanical tooling for aerospace. ISO 9001:2000 Manufactures machined aerospace and electronic subassembly parts CNC machining, hardware installation and mechanical assembly Manufactures precision parts; assembles computer-controlled milling machines Provides precision grinding on components for aerospace and other industries Provides shot-peening services for the aerospace industry. ISO 9001:2000 Provides services to manufacturers seeking FAA certification standards. ISO 9001-2000 Honeycomb sandwich panels, core details, prepregs, resins, adhesives, pottings, edge fills Produces precision sheet-metal parts and assemblies Involved in engineering, development and design of new and modified aircraft Engineering consultants for aviation industry Repairs aircraft components on aircraft or in shop CNC machining, stretch forming, aluminum, steel, sheet-metal. ISO 9001:2000 Aircraft engine parts, tooling and ground-support equipment. ISO 9001:2000 Designs automated tooling for manufacturing industries. ISO 9001:2000 Supplier of specialty aircraft tooling since 1982 Design and manufacture of high lift structures, complex mechanical assemblies, major components Aircraft covers FAA-licenced repair facility servicing the airline community since 1972 One of 23 worldwide BF Goodrich Aerospace aviation repair and overhaul facilities Design, develop and manufacture electronic systems Engineer and manufacture aircraft structural components Specializing in freighter conversions, crew rest/bunk installations, interior reconfigurations Test cards for aerospace electronics, avionics, flight controls, engines. ISO 9001:2000 Provides first-class customer service with a reputation for manufacturing excellence Capabilities include 3x8x30-foot processing tanks, shot peen, NDT, paint. ISO 9001:2000 Machine shop (PTAC) Designs, engineers, produces and assembles 747, 767, 777 and 787 commercial aircraft Performance-safety modifications for light-medium twin-engine aircraft. ISO 9001:2000 Bridgeways provides contract manufacturing services Manufactures carts and galleys for the aircraft industry. ISO 9001:2000 Aircraft interiors, autoclave composites, primary composite structures. ISO 9001:200 Product certification; design of interiors, avionics-electrical, structures and systems Avionics and interiors for light aircraft, refurbishing and interior electronics Aircraft interior modification specialist. ISO 9001:2000 Fueling and aircraft support services for transient and tenant-based aviation customers Provider of aerospace tooling solutions Precision machined parts and assemblies for aerospace, defense and commercial industries Protective paint finishing and removal for industrial and commercial applications Provides prototype, CNC, water-jet machining, sheet metal, CAD/CAM/engineering Distribution center for composite materials for the marine industry and kit planes Commercial and military aircraft parts and components. ISO 9001:2000 Crane Aerospace & Electronics offers sensing, braking systems, electronics and more Small aircraft maintenance facility Flight-systems support D3 Technologies works with clients on state-of-the-art engineering solutions Systems integration, kitting, point-of-use delivery, supply-chain management services Offers cable assembly, mechanical assembly, kitting and bonding. ISO 90001-2000 Produces a broad range of products and services that safely guide commercial aircraft Close-tolerance CNC turning and milling, four-axis vertical milling. ISO 9001:2000 Design and manufacture state-of-the-art aircraft assembly equipment. ISO 9001:2000 Integrated solutions for display and control Precision machining of aircraft parts and equipment. ISO 9001:2000 Qualified in commercial aerospace, defense and military specifications Fairchild is comprised of a network including Camloc, Screwcorp and Tridair. Design, development and manufacturing of lightweight structures, modules and landing gear
Giddens Industries provides world-class team support and advanced quality concepts Provides CNC machining for aerospace and medical industries. ISO 9001:2000
THE HERALD BUSINESS JOURNAL 35
Services Finishing Wiring, supplies Engineering Machining Machining Machining Machining Machining Machining Machining Machining Consulting, design Materials, plastics Sheet metal, welding RSVM certification Design, certification Consulting, design Component repair Machining Maintenance, parts Consulting, design Manufacturing, tooling Engineering Aircraft covers Avionics repair Maintenance Instrumentation Manufacturing Manufacturing Manufacturing, systems Electronics, design Machining Finishing Machining Manufacturing Manufacturing Manufacturing Manufacturing Composites Avionics Interiors Interiors Fixed-base operator Manufacturing Sheet metal Manufacturing Machining Finishing Machine shop Machining Composites Machining Machine shop Manufacturing General aviation Manufacturing Consulting, design Machining Sheltered workshops Semiconductors Machining Tooling Consulting, design Electronics Machining Sheet metal, welding Materials, metals Engineering Machining Components Materials, plastics Kit planes Machining
MARKET FACTS 2013
Company A&B Quality Finishers Inc. A.E. Petsche Aaron Electronics Corp. Absolute Manufacturing Inc. ABW Technologies Inc. Accra Manufacturing Inc. Accurate Machining ACRO Machining Inc. Action Grinding and Machining Advanced Designs (B&C Mfg.) Aero Mac Inc. AeroAcoustics Inc. Aerocell Inc. (Zodiac) Aeroform Inc. AeroMech Inc. Aeronautical Testing Service Inc. Aerospace Consulting Aerospace Machining Specialists AMT Aircraft Maintenance and Support AIT Design Inc. Apache Aerospace ASCO USA Aviation (Cunningham) Inc. Aviation Instrument Service Int’l. Aviation Technical Services (ATS) Aviation Technologies Inc. AvtechTyee AvtechTyee B/E Aerospace Ballard Technology Inc. Barton Machine Blue Streak Finishers Ltd. BMG Industries Boeing Commercial Airplanes Boundary Layer Research Inc. Bridgeways Bucher Aerospace Corp. C&D Zodiac (NW Composites) Can Am Aerospace Cannon Aircraft Interiors Cascade Aviation Services Inc. Castle and Cook Aviation CNA Manufacturing Systems Inc. Coastal Manufacturing Cobalt Enterprises Inc. Coleman Machine Color-Tech (Division of ASKO) Commet Precision Products Component Products Corp. Composites One Contour Aerospace Covelet Machine and Design Inc. Crane Aerospace — Eldec Corp. Crown Aviation Curtiss-Wright Flight Systems D3 Technologies Damar Machine Co. Inc. Diversified Industrial Services Eaton Aerospace EDJ Precision Machine Inc. ElectroImpact Erickson International Inc. Esterline Control Systems Excell Aerofab Exotic Tool Welding Fairchild Fasteners (Alcoa) Fokker Aerostructures G&M Manufacturing GE Aviation Systems Giddens Industries Inc. Glasair Aviation Global Machine Works Inc.
36 THE HERALD BUSINESS JOURNAL
MARKET FACTS 2013
SNOHOMISH COUNTY AEROSPACE COMPANIES Company Gompf Brackets Inc. Greenpoint Technologies H&H Machine Honeywell ID Integration Inc. IDL Precision Machining Infinity Fabrication Inc. Innovative Technologies Inc. Integrated Technologies (Intec) J.R. Engineering (Quietly Superior) Jamco America JL Manufacturing K&T Machine Kaas Taylored Kaman Aerosystems King Machine Inc. KitPlanes Northwest Koch Machine and Tool Labinal Inc. LaFarge & Egge Inc. Lamar Technologies Corp. Laz Tool & Manufacturing Inc. Liebherr-Aerospace SAS Lord Corp. Messier Bugati Metal Motion Metal Tech Inc. Microjet Miller Screw Products Inc. Monogram Systems (Zodiac) MOOG Aircraft Group Morgan Aero Products Morgan Branch CNC New Breed Logistics New Tech Industries Inc. Newell Corp. Northway Products Inc. Northwest Aerospace Technologies Nova-Tech Engineering Omega Precision Onamac Industries Orion Technologies PAC-Aero Inc. Pacifica Engineering Inc. Panasonic Avionics Corp. Para-Phernalia Inc. Professional CAD Services Inc. Pentar Avionics Systems Pineda Precision Plexus Manufacturing Inc. Polaris Machining and Sheet Metal Precision Airmotive Corp. Precision Circuits Inc. Precision Engines Corp. Precision Fuel Components LLC Precision Logistics LLC Primus International Pro Tool Manufacturing Procam Machine Inc. Quality Industrial Services Qualtest Consultants Inc. Rockwell Collins Rolls Royce North America Inc. Royell Manufacturing Inc. Ryerson-Microjet Scott Aviation Seacast Inc. Sealth Aero-Marine Sextant Avionique SKF Aerospace Skills Inc. Smiths Aerospace Soundair Aviation Services Inc.
Services Materials, plastics Interiors Machining Components Consulting, design Machining Machining Materials, plastics Composites Consulting, design Interiors Manufacturing Machining Interiors Consulting, design Machining Manufacturer Machining Manufacturing Sheet metal, welding Manufacturing Manufacturing Manufacturing Composites Wheels, tires, brakes Machining Manufacturing Materials, metals Machining Manufacturing Manufacturing Maintenance Machining Logistics Consulting, design Maintenance Machining Conversion Consulting, design Manufacturing Machining Consulting, design Machining Consulting, design Avionics Supplies Consulting, design Avionics Machining Materials, plastics Machining Manufacturing Manufacturing General aviation Manufacturing Supplies Swaging Manufacturing Machining Sheet metal, welding Consulting, design Manufacturing Consulting, design Machining Sheet metal, welding Materials, other Machining Materials, metals Materials, other Manufacturing Sheet metal Manufacturing Maintenance
City Mukilteo Everett Edmonds Everett Mukilteo Mukilteo Arlington Everett Everett Everett Everett Everett Lynnwood Mukilteo Everett Mukilteo Arlington Arlington Everett Lynnwood Marysville Snohomish Everett Bothell Everett Arlington Monroe Monroe Bothell Everett Everett Everett Arlington Everett Mukilteo Arlington Mukilteo Everett Lynnwood Mukilteo Everett Snohomish Everett Mukilteo Bothell Arlington Bothell Bothell Everett Mukilteo Marysville Marysville Lynnwood Everett Everett Silvana Woodinville Everett Mill Creek Everett Everett Bothell Everett Everett Marysville Snohomish Marysville Mill Creek Everett Monroe Arlington Mukilteo Snohomish
Contact www.gompf.com www.greenpnt.com 425-776-1994 n/a www.id-integration.com 425-315-8080 www.infinityfabrication.com innovativetechnologies.biz www.in-tec.com www.quietlysuperior.com www.jamco-america.com www.jlmanufacturing.com 425-347-2157 www.kaastailored.com www.kaman.com 425-743-5464 www.kitplanesnorthwest.com 360-474-8017 www.labinal.com www.lafargeinc.com www.lamartech.com www.laztool.com www.liebherr.com www.lord.com www.messier-bugattiusa.com www.metalmotion.com 360-794-1945 360-805-9400 253-939-7340 www.monogramsystems.com www.moog.com www.morganaero.com 360-435-7170 www.newbreed.com www.newtechind.com www.newellcorp.com northwayproducts.com www.natdesign.com www.ntew.com www.ometech.net www.onamac.com www.oriontechnologies.net 425-258-2741 pacifica-engineering.com www.mascorp.com www.softieparachutes.com www.procadservices.com www.pentar.com 425-290-5928 www.plexusman.com www.polarismachining.com www.precisionairmotive.com 425-778-4980 www.precisionengines.com www.precisionfuel.com www.skypac.com www.primusint.com www.ptmcorp.com www.procammachine.com 425-348-8825 n/a rockwellcollins.com www.rolls-royce.com www.royell.com www.ryerson.com 360-668-7793 www.seacast.com www.sealth.com 206-355-7112 www.qpm2000.com www.skillsinc.com www.smiths-aerospace.com www.soundair.com
Description Provides brackets, bezels and retainers to customer specifications Provider of interiors to VIP, corporate, government, commercial and head-of-state clients Flight-systems support Provides expertise in SPEC2000 part and tool marking and tracking. ISO 9001:2000 Full-service machine shop providing milling, turning and assembly Offers precision sheet metal and machined components in aluminum, steel and alloys Encapsulated electronics, custom-molded rubber parts and cast urethane Designs, engineers, tests, machines and fabricates advanced material systems Specializes in aircraft noise measurements and analysis. FAA/DOT, JAA, ICAO approved Manufactures galleys, inserts, bar counters and lavatories. ISO 9001:2000 Manufactures aircraft parts and equipment Manufactures high-quality upholstered and sewn products. ISO 9001:2000 Engineering technical services, DER, DAR structure aircraft compliance. ISO 9001:2000 Precision machining of small to medium-sized aircraft components. ISO 9001:2000 Assists completion of kit-plane projects, inspections, maintenance, modifications Aircraft fans, wiring harnesses, filters, brake accessories. FAA repair station Provides hydraulic tube bending and sheet metal fabrication services. ISO 9001:2000 Manufactures starters, electrical components and voltage controls for aircraft Features many automated machining and fabrication services for industry Supplies digital air supply and cabin air conditioning systems for Boeing 747-8 Offers vibration and noise-control products Supplies wheels and carbon brakes for more than 3,500 commercial aircraft worldwide AS9100, ISO 9002, ISO 9001:2000 CNC machine shop offers 3-, 4- and 5-axis assemblies Provides metal finishing for the sheet metal, machining and aerospace industries Water-jet cutting Screw machine job shop produces bushings, screws and washers Water and waste systems for aircraft Provides airplane parts to Boeing, assists on 787 Dreamliner Aircraft ground support, aircraft testing, missile testing and ground support equipment Machine shop (PTAC) Provides distribution services, reverse logistics and repair, supply-chain consulting Provides products for aerospace, defense and commercial applications Services petroleum, steel mill, aircraft and hydroelectronic industries Provides precision-machined components for maritime, aerospace and commercial uses Commercial aircraft modification programs, FAA/Foreign Regulatory Agency approval Nova-Tech Engineering has designed and built many products for difficult applications High-mix, low-volume aerospace, commercial, medical, military parts. ISO 9001:2000
Program management of aircraft and aerospace tooling, flight structures. ISO 9001:2000 Supplier of in-flight entertainment and communications systems. ISO 14000 Manufactures parachute systems for pilots PCSI has a diverse staff engaged in industry design, engineering and manufacturing Supplies advanced, PC-based automatic test equipment, software and displays Provider of small to medium precision components for commercial and military Custom injection molder for aerospace, sporting goods and construction marketplace Provides small to medium-sized machined parts, assemblies and sheet metal to suppliers Manufactures piston engine fuel control systems for aircraft, helicopters and kit planes Serves small to mid-size high-tech and instrumentation customer World’s premier large radial engine and accessory overhaul facility Specializes in small turbine fuel controls; Honeywell authorized warranty-repair station Provides Parker and Stratoflex hoses Primus International is a Tier II integrator of composites, metallic parts and assemblies CNC machine shop that solves manufacturing needs Manufactures aerospace and aircraft parts Fabrication, manufacturing assistance via subcontractors, DI-9000 certified machine shops Provides nondestructive inspection/NDT Level III consulting and training services Engineering and logistical support for Boeing 787 flight test and production Provides CNC and conventional machining and provides assemblies Fabrication in laser or water-jet cutting, forming, welding and assembly services Ferrous and nonferrous investment castings. ISO 9001:2000 Latching and hinging mechanisms for aerospace and transportation applications QPM Aerospace supplies aerospace and defense industries with three divisions Sheet metal, machining and fabrication for aerospace and commercial customers Works with Boeing at this facility Rotables, engines, airframes, parts; aircraft window, windshield and glass repair-overhaul
SNOHOMISH COUNTY AEROSPACE COMPANIES Company Star Aviation Steel-Fab Inc. Stoddard International LLC Structural Integrity Engineering TNT Enterprises Talon Manufacturing Inc. TCI Scales Inc. TECT Aerospace Terry’s Machine and Manufacturing TRW — Lucas Aerospace Turning Point Machining TyeeAvtech Umbra Cuscinetti Inc. Universal Aerospace Co. Inc. UTC Aerospace-Landing Gear UTC Aerospace Cargo Systems UTC Aerospace-Aerostructures UTC Aerospace-Interior Products Valberg LLC Vaupell Vector Industries Inc. Walter Dorwin Teague (Teague) Westwood Precision Inc. Wood Associates XP Modifications
Services Engineering Materials, metals Composites Consulting, design Sheet metal, welding Machining Accessories Manufacturing Machining Manufacturing Machining Manufacturing Machining Manufacturing Structures Manufacturing Repair, overhaul Maintenance Manufacturing Manufacturing Machining Consulting, design Machining Consulting, design Manufacturing
City Everett Arlington Arlington Everett Mill Creek Arlington Snohomish Everett Mukilteo Everett Marysville Everett Everett Arlington Everett Everett Everett Lynnwood Monroe Everett Everett Everett Everett Snohomish Arlington
Contact www.staraviation.com www.steel-fab.com www.stoddardintl.com www.sieinc.com www.tntsheetmetal.com 360-403-8910 www.tciscales.com www.tectcorp.com terrysmachine.com 425-407-1191 425-252-7300 n/a www.umbragroup.it www.universalaerospace.com www.goodrich.com www.goodrich.com www.goodrich.com www.goodrich.com www.valbergllc.com www.vaupell.com www.vectorindustries.com www.teague.com www.westwoodprecision.com 425-335-1327 www.xpmods.com
Description Services include retrofit modifications and new design engineering Fabricates aluminum, stainless and mild steel for aerospace, marine and other industries Manufactures composite aircraft parts Aircraft and component certification, structural design and analysis and materials testing Provides precision sheet metal manufacturing Handles all types of machined parts, regardless quantity or complexity Electronic monitoring and weighing Aerostructure components, sheet metal parts, aircraft tooling, precision machining Quickly manufactures high-quality, cost-effective parts
Manufactures gears and gear components for aircraft Manufactures interior aircraft parts and auxillary equipment Landing Gear Division customers include Boeing, Gulfstream, Sikorsky, Fairchild Dornier
Aircraft interiors Electronic design and manufacturing, control panels and harness building Assembly and painting of aircraft interior components Turnkey production, manufacturing, nondestructive testing, final treatments Design services for textiles, visual communications, interiors, 3D imagery, exterior markings Produces prototypes and provides long and short production runs Aviation safety consulting and audits, accident investigation and reconstruction Aircraft parts and products for the general aviation industry
Source: Economic Alliance Snohomish County, December 2012
Snohomish County’s largest public and private employers Public employers with 400 or more full-time-equivalent workers Name Naval Station Everett Washington State (including colleges) Snohomish County Edmonds School District Everett School District City of Everett Marysville School District Monroe Correctional Complex Snohomish County Public Utility District Community Transit Edmonds Community College Everett Community College Cascade Valley Hospital
Description U.S. Navy base state government county government K-12 public education K-12 public education city government school district State Department of Corrections electric utility public transit higher education higher education medical services
FTE 6,000 6,000 2,500 2,000 1,900 1,200 1,200 1,000 950 650 615 600 430
Website www.cnic.navy.mil/everett/index.htm access.wa.gov www.co.snohomish.wa.us www.edmonds.wednet.edu www.everett.k12.wa.us www.ci.everett.wa.us www.msvl.k12.wa.us www.doc.wa.gov/facilities/prison/mcc/default.asp www.snopud.com www.commtrans.org www.edcc.edu www.everettcc.edu www.cascadevalley.org
Description aircraft manufacturing medical services real estate, retail and gaming health insurer health care ultrasound technology health care electronic test and measurement equipment aircraft repair, maintenance and parts sand and gravel mining operations communications aerospace electronics aerospace supplier and composites aerospace electronics wireless data collection and RFID medical devices aircraft equipment
Sources: Economic Alliance Snohomish County, InfoUSA, Manta. December 2012
FTE 39,000 3,500 3,100 2,400 2,100 2,000 1,700 1,100 1,000 850 800 750 620 600 400 400 400
Website www.boeing.com www2.providence.org www.tulaliptribes-nsn.gov www.premera.com www.everettclinic.com www.medical.philips.com www.swedish.org www.fluke.com www.atsmro.aero www.cemexusa.com www.frontier.com www.craneae.com www.cdaerospace.com/home.aspx www.esterline.com www.intermec.com www.sonosite.com www.panasonic.aero
THE HERALD BUSINESS JOURNAL 37
Name Boeing Providence Regional Medical Center Tulalip Tribes Enterprises Premera Blue Cross The Everett Clinic Philips Medical Systems Swedish Edmonds Hospital Fluke Corp. (Danaher) Aviation Technical Services CEMEX Frontier Communications Northwest Crane Aerospace C&D Zodiac Esterline Control Systems Intermec Technologies Sonosite Panasonic Avionics
MARKET FACTS 2013
Private employers with 400 or more full-time equivalent workers
TRANSPORTATION
Congestion now will lead to easier drive for years to come By Christina Harper
38 THE HERALD BUSINESS JOURNAL
MARKET FACTS 2013
HBJ Freelance Writer
MONROE — If you are one of the 28,000 commuters a day that drives to and from Monroe and surrounding areas on U.S. 2, you may be wondering when all the congestion due to road work will end. The Washington State Department of Transportation is a year and a half into a three-year project to widen Highway 522 from two to four lanes just west of the Snohomish River Bridge to 179th Avenue SE in Monroe. The project also includes four new bridges, including one across the Snohomish River where steel girders on the east side of the bridge are being fitted. This bridge will be one-third of a mile long. “We are working on three bridges,” right now, said Janice Fahning, project engineer overseeing the Highway 522 and U.S. 2 project. Crews are also working on the Elliott Road Bridge west of Monroe. Pouring decks, working on concrete barriers and rock blasting will continue throughout the winter. Closures and delays are less of a headache for drivers who find out information on the DOT website before making their journeys. “People have been really good about it,” Fahning said. The project is on time and the $128 million budget funded mostly by the 2003 Gas Tax is on target. Once finished, drivers can enjoy the smoother traffic flow and feel safer with a concrete median separating opposing lanes. “The result will be a four-lane roadway with safety,” Fahning said. DOT statistics show 100 collisions on this stretch of Highway 522 from 2006 to 2010. Three of those were fatal collisions and four serious injuries. There were another 54 collisions at the Highway 522-164th Street SE-Main Street interchange. The improvement to the highway should make it safer and last for about 50 years. Construction is set to be complete in late 2014.
LEARN MORE For more information, go to www.wsdot.wa.gov and click on “Find a Project.” Until the entire Highway 522 corridor is completed, it will be difficult to calculate the time that drivers will save on the road, DOT public information officer Kris Olsen said. There are still two more widening projects that need to be completed where the highway will remain at two lanes until funding from the Legislature can be secured. “Drivers will likely see big travel time improvements if we get the go ahead to move forward on those projects,” Olsen said. The on-hold plan involves, among other things, replacing the existing intersection at Highway 522 and Paradise Lake Road in Maltby with a new interchange to alleviate congestion that occurs during morning and afternoon commutes. A new traffic signal with a freeway interchange, onramps, exits and a new bridge are all part of this proposed effort. The end result will be easier traffic flow and as well as safer roads for drivers. Once project funding is received, it will take three years or more to complete. Other plans in the works include a seismic retrofitting to the existing Snohomish River Bridge and a onemile paving project in summer 2013 between the bridge and Echo Falls Road. The pavement is a maintenance job. Construction on our roads may be a great hindrance to drivers, but feedback on recent road improvements is very positive, Fahning said. The ramp built from eastbound Highway 522 to eastbound U.S. 2 in Monroe has made congestion and drive time a lot easier for some. The final work was completed in October. “We realize it is hard for drivers when we are making improvements,” Fahning said. “We really appreciate everyone’s patience.”
MICHAEL O’LEARY / HERALD FILE 2012
The Washington State Department of Transportation is building a second bridge over the Snohomish River near Monroe, a major component of a long-standing project to widen Highway 522 between Monroe and Highway 9 in Woodinville. This photo shows a bridge pier support after its completion in July 2012.
DAN BATES / HERALD FILE 2011
The Highway 522 bridge over the Snohomish River, shown here in March 2011, now carries traffic in both directions. A second two-lane span, currently under construction, will carry eastbound traffic into Monroe while the current bridge will carry two lanes of westbound traffic.
TRANSPORTATION
A Community Transit dispatcher sits at a new display terminal used to manage buses. The various screens show where each bus is and provides information on schedule performance such as on time or delays, as well as text conversations with drivers on the road. COMMUNITY TRANSIT PHOTO
Community Transit puts GPS on its buses By Christina Harper HBJ Freelance Writer
money. The updated systems will give bus drivers more direct communication with CT operations. For a driver to make a call out from a bus it has to be safe for him or her to pick up the radio. “It’s kind of hit and miss,” Mungia said. With Transit Technologies, drivers will be able to hit a button for a canned yes or no reply to dispatch when they might need help or a back-up bus. Even with installation, training for drivers, dispatchers and other staff, the project will continue soon. “Starting in early 2013 a lot of customers that take local rides will see the new technology,” Munguia said. During that time, real-time bus information will be launched. Instead of a schedule posted at stops, riders will be able to call a four-digit number or use it to access CT’s website and find out when their bus will arrive. “We can’t control traffic and weather conditions,” Munguia said. “But people can find out for themselves if the bus is going to be at my stop when scheduled.”
THE HERALD BUSINESS JOURNAL 39
The technology being used, including global positioning systems (GPS), on CT buses means that bus locations can be tracked to improve on-time performance. Next-bus arrival signs will be installed at SWIFT stations and other major transit centers. On-board electronic signs, as well as speakers, will let passengers know what stop is next, giving them ample time to prepare to disembark. Lasers on each bus door will detect when people walk on and off the vehicle. Now, passengers are counted when they pay their fare. “When you get into the million of passengers per year, you get inaccuracies,” Munguia said. Pair that technology with GPS, and planners will have tremendous amounts of information to determine how many passengers are boarding buses, when and where. “If you save five minutes on one trip you can save tens of thousands of dollars per year,” Munguia said. It’s not just about passengers and
MARKET FACTS 2013
EVERETT — It’s cold and dark, and maybe raining. You are standing at the bus stop just aching to be at home. Did I miss the bus? Is it running late? These are questions every rider asks and can’t have answered until a bus arrives. But thankfully for bus riders in and around Snohomish County, Community Transit is making it easier to get bus information, get on board and get to where people want to be — on time. “We called the project Transit Technologies,” said Martin Munguia, public information officer at Community Transit in Everett. “It will improve operations as well as customer service.” Transit Technologies was launched on commuter buses to Seattle in July 2012. A rollout on more CT routes will take place in spring 2013. The project will cost about $10 million, Munguia said. It started three years ago with design and planning. Then the recession hit
and budgets got tight. “We might have had it up and running a couple of years ago,” Munguia said. But CT staff spread the project out longer to make sure they got it right without sacrificing service to passengers to pay for it. The few buses already equipped with new technology are on the EverettUniversity of Washington route. The remainder of the 30 buses will be ready in a few months. After those vehicles are up and running, CT staff plan to start adding GPS to local buses. Nine buses serving two different routes were chosen as the pilot vehicles. Local buses equipped with new technology are SWIFT vehicles that run between Everett and Shoreline on Highway 99. The last buses for this year rolled out just before Thanksgiving. “When we started out there was a bunch of problems,” Munguia said. “Just like any pilot.” At SWIFT bus stations electronic signs will tell customers if the bus is late. There is a 12-minute maximum on wait times.
U.S. NAVY
Navy, Nimitz provide economic power By John Wolcott
40 THE HERALD BUSINESS JOURNAL
MARKET FACTS 2013
HBJ Freelance Writer
EVERETT — When huge tugboats nestled the CVN-68 up to its new berth at Naval Station Everett on June 6, 2012, Mayor Ray Stephanson proclaimed USS Nimitz Appreciation Day. The $6,000 proceeds from a welcoming business and community luncheon organized by Economic Alliance Snohomish County and United Way of Snohomish County were presented to the Navy-Marine Corps Relief Society for military and their families. “Our community is enriched by the vitality, spirit and diversity of Navy families,” Stephanson said. “We look forward to engaging the USS Nimitz family as neighbors, friends and colleagues.” Earlier announcements that CVN-68 would fill the space at the dock previously occupied by CVN-72, the USS Abraham Lincoln, brought obvious relief to civic and economic development leaders as well as nonprofit organizations, schools and churches where Navy personnel and their families always become deeply involved. Economically, too, the arrival of the USS Nimitz and its crew of 6,000 sailors shored up spirits, restoring the Navy base to a full contingent of battle group ships, including neighboring frigates and destroyers. Troy McClelland, CEO of Economic Alliance Snohomish County, told his audience that Naval Station Everett’s economic impact on its neighboring communities is estimated at $463 million annually in salaries, goods and services for the ship, plus sailors’ spending at local businesses, car dealerships and in the housing market. Navy involvement includes volunteering with local community groups and contributing $1.5 million to the Combined Federal Campaign, managed by United Way of Snohomish County. Since Naval Station Everett began operating in 1994, its presence has played a major role in the nation’s military forces. One of the most modern and popular bases in the U.S. Navy, the Everett port employs more than 6,300 active-duty military and civilians. An extension of the base is the 52-acre Navy Support Complex north of Marysville that provides a commissary, base exchange, family support service center, thrift shop, education offices, bachelor and visitor living quarters, a chapel and religious education center, auto hobby shop, ball fields and courts, a 50-room
MARK MULLIGAN / HERALD FILE
Lt. Cdr. Russell Lawrence (right) explains features of the USS Nimitz flight deck control room to members of the Everett Silvertips on a Sept. 18 tour of the U.S. Navy aircraft carrier in Everett.
Navy Lodge and long-term parking for personnel assigned to ships while on deployment. The Navy estimates payrolls for base personnel reach approximately $160 million annually, but notes that $130 million is added to the economy by the 10,000 jobs related directly or indirectly to the Navy’s presence. Also, retired military of all service branches in the county receive $138 million in annual pensions that further support the local economy. Also based in Everett are two guidedmissile destroyers, the USS Shoup and USS Momsen, and three guided-missile frigates, the USS Ford, USS Ingraham and USS Rodney Davis. Other ships assigned to the Everett facility include two U.S. Coast Guard cutters, the USCGC Henry Blake and the USCGC Blue Shark, plus the USNS Shasta, part of the Military Sealift Command. The base became even more valuable to both the Navy and Snohomish County in 2010 when the $10.3 million Fleet Region Readiness Center was built as a major training center for West Coast Navy personnel. It provides as many as 50 programs
“Our community is enriched by the vitality, spirit and diversity of Navy families. We look forward to engaging the USS Nimitz family as neighbors, friends and colleagues.” Ray Stephanson, Everett mayor for 2,000 military personnel each year. The increase in technology and training capabilities will more than double the course offerings previously available at the base. Three Navy training centers — the Center for Surface Combat Systems, Center for Service Support and Center for Information Dominance — will use the new facility to train sailors in the use of Navy weapons systems, information technology and Navy logistics.
Classrooms are equipped with networked computers that provide access to e-learning and exportable training for sailors on the waterfront. In addition, the building includes lab and office space for courses such as radar navigation, torpedo maintenance and voyage maintenance systems. The Navy also completed new bachelor enlisted barracks at the base in 2010, with room to house 500 sailors, and finished building 141 family housing units in Lake Stevens. Then, in 2011, the $32.9 million Everett-Seattle Armed Forces Reserve Center opened to provide a 160,000-square-foot training center and a 20,000-square-foot vehicle maintenance shop. Seahurst Electric of Everett provided all of the wiring and related work for the new center. Secretary of the Navy Ray Mabus said the decision to base the USS Nimitz in Everett ensures long-term strategic dispersal of aircraft carriers on the West Coast and saves the Navy more than $100 million due to the reduced cost of moving to Everett and lower housing costs than in San Diego, the ship’s previous home base.
PROGRESS
Economic Alliance plots growth strategy By John Wolcott
HBJ Freelance Writer
EVERETT — Last year was a period of strong growth for Economic Alliance Snohomish County and its leaders predict they will build on those achievements in 2013, particularly in spreading the message that the county is a key location for economic growth in Washington state. “At our March annual luncheon meeting, we’ll be unveiling the most comprehensive strategic plan for the EASC we’ve created to date,” said CEO Troy McClelland. “It addresses major goals for our growth, attracting and retaining businesses and promoting Snohomish County.” Founded in 2011 with the merger of the Snohomish County Economic Development Council, the Everett Area Chamber of Commerce and the South Snohomish County Chamber of Commerce, EASC has gained the strength, support and goal-setting skills and resources it needs to contribute to the economic health of the county, he said in an interview with The Herald Business Journal, accompanied by Shannon Affholter, EASC’s vice president for business and economic development. “For the past year we’ve also had growing investments in our organization, up for the first time in years (including support for the previous Snohomish County Economic Development Council),” McClellan said. “We’ve also streamlined the EASC, becoming smaller and more efficient. Our pro-
grams have become more effective due to a high-performing core team working in various areas.” Nearly a dozen businesses in the county were retained by EASC efforts in 2012, through efforts that helped the businesses to either grow their business in Snohomish County or allow them to stay here, he said. “On the recruitment front during 2012 we’ve seen more businesses interested in Snohomish County because, I believe, of our strong outbound conversations about the strengths of the county as a great place to live, work and do business. From those contacts we’ve found more businesses thinking about the county as a place to be,” McClelland said. He said EASC also had a strong legislative session in 2012, with support for education getting traction, particularly in moving ahead with plans for a fouryear university through WSU’s developing presence in Everett and support for community and technical colleges. “The EASC has been called out by name around the state as an important partner in economic development,” he said, “and our core revenue is stable. We’ve invested a lot of time and energy in advocacy for businesses, our small-business programs are more active, counseling is up and we’ve put new Department of Transportation and Department of Defense programs in our 2013 strategic plan.” He said EASC will continue to be a strong advocate for regional surface transportation, including rail and freight
shipping that play key roles in bringing business to the county and sustaining it. EASC has also strengthened its partnership with Workforce Development Council of Snohomish County, high school technical skills training and highereducation programs, including supporting the University of Washington-Bothell. Also, EASC is actively involved with the Aerospace Joint Apprenticeship Committee, Edmonds Community College’s workforce development and training courses, Everett Community College’s Aerospace Solutions Group, the Sno-Isle Tech Skills Center and the Washington Aerospace Training and Research Center at Paine Field, Embry-Riddle Aeronautical University and Everett Community College’s Corporate and Continuing Education Center. “No matter how busy we get, we can’t take our eye off the ball in the aerospace industry,” he said. “It’s a dynamic market right now and we want to continue being a greater supporter for those businesses.” Another fast-developing area is the increase in aerospace and manufacturing industries in Arlington’s business park around the airport, including the former Meridian boat manufacturing company, where empty buildings and land are being marketed to new employers, particularly in aerospace, he said. “Arlington is a great place for businesses to locate and grow,” McClelland said. “We’re very strong advocates of supporting technical and education programs there as well helping to improve their transportation infrastructure to
help businesses succeed.” Many businesses want to locate in smaller communities such as Arlington and Snohomish, McClelland said, which are “proving to be good places for business development and we’re supporting that.” Affholter said the county is competing with other parts of the state and with other states for business development, particularly in aerospace, and it’s important to continue building a strong EASC to represent the area and its businesses. “We’ve worked hard on this, including reaching out to chambers of commerce and elected officials around the county,” he said. “We have to be strong locally, statewide and nationally. We have a larger manufacturing index than any other region in the state and we’re growing stronger in supporting it.” When EASC goes to Olympia, it has more strength now to advocate for the region with its 45,000 aerospace manufacturing jobs, McClelland said, plus the need for supporting more transportation and business investment. “In 2013 we’ll continue our work, including supporting Naval Station Everett, its community base in Marysville and the schools, infrastructure and transportation resources needed to serve the base,” said McClelland. “We value the entire base, its ships and personnel as having about a $400 million annual impact on our economy, not including the Navy’s Jim Creek station north of Arlington and the new Armed Forces Reserves training center just opened recently in Marysville.”
STATISTICAL SNAPSHOT Operating revenues from retail electricity sales (in thousands) Jan. $53,810 $53,878 $50,974 $53,279 $50,577 $52,849
Feb. $45,958 $53,240 $51,569 $45,359 $45,336 $51,340
March $43,410 $45,868 $46,788 $45,329 $51,404 $47,436
April $42,448 $40,319 $42,037 $41,117 $42,216 $42,876
May $33,677 $36,252 $34,847 $35,068 $38,749 $36,291
June $30,992 $35,123 $35,127 $35,458 $36,063 $35,367
July $33,733 $35,517 $33,854 $34,567 $32,643 $35,254
Aug. $33,742 $31,655 $34,210 $35,447 $36,319 $34,947
Sept. $32,991 $35,332 $36,273 $35,508 $35,255 $34,215
Oct. $43,007 $42,392 $42,113 $42,228 $41,265 $44,707
Nov. $45,408 $40,651 $44,106 $45,804 $47,666 NA
Dec. $52,604 $61,633 $60,195 $54,007 $57,694 NA
YTD $491,861 $511,859 $512,094 $503,171 $515,186 $415,282
July 518 409 350 222 241 199
Aug. 706 274 294 218 227 282
Sept. 575 393 367 238 192 255
Oct. 584 431 489 259 214 NA
Nov. 509 193 254 248 188 NA
Dec. 464 316 286 292 239 NA
YTD 7,255 4,438 4,049 3,187 2,685 2,256
New service connection comparison, 2007-2012 Year Jan. Feb. March 2007 761 587 581 2008 422 315 508 2009 341 280 549 2010 313 229 281 2011 247 214 238 2012 264 298 223 Source: Snohomish County PUD, Oct. 15, 2012
April 629 348 252 314 217 223
May 720 406 282 269 255 290
June 621 423 305 270 213 222
THE HERALD BUSINESS JOURNAL 41
Year 2007 2008 2009 2010 2011 2012
MARKET FACTS 2013
Snohomish County PUD electricity sales and new connections
STATISTICAL SNAPSHOT
Seattle metro area unleaded fuel prices, 1998-2012 Year 1998 1999 2000 2001 2002 2003 2004 2005 2006 2007 2008 2009 2010 2011 2012
Jan. $1.245 $1.056 $1.387 $1.589 $1.200 $1.387 $1.612 $1.811 $2.235 $2.596 $3.077 $2.012 $2.866 $3.232 $3.437
Feb. $1.152 $1.017 $1.428 $1.545 $1.168 $1.642 $1.672 $1.923 $2.288 $2.467 $3.163 $2.163 $2.811 $3.337 $3.572
March $1.071 $1.055 $1.602 $1.549 $1.230 $1.861 $1.790 $2.154 $2.400 $2.762 $3.460 $2.148 $2.976 $3.700 $3.998
April $1.066 $1.382 $1.690 $1.543 $1.434 $1.785 $1.902 $2.444 $2.764 $3.076 $3.574 $2.302 $3.052 $3.915 $4.076
May $1.107 $1.395 $1.633 $1.577 $1.460 $1.625 $2.196 $2.427 $3.114 $3.358 $3.859 $2.510 $3.007 $3.993 $4.155
June $1.134 $1.337 $1.587 $1.617 $1.464 $1.547 $2.265 $2.304 $3.110 $3.140 $4.288 $2.835 $2.937 $3.859 $4.001
July $1.124 $1.385 $1.638 $1.591 $1.482 $1.599 $2.012 $2.436 $3.017 $2.959 $4.271 $2.704 $2.984 $3.780 $3.567
Aug. $1.114 $1.439 $1.640 $1.518 $1.488 $1.762 $1.932 $2.602 $2.999 $2.790 $3.977 $2.840 $3.068 $3.753 $3.806
Sept. $1.110 $1.434 $1.709 $1.664 $1.468 $1.879 $1.993 $2.876 $2.803 $2.875 $3.740 $2.907 $2.943 $3.858 $4.009
Oct. $1.109 $1.383 $1.720 $1.632 $1.412 $1.661 $2.058 $2.798 $2.530 $2.982 $3.118 $2.760 $3.011 $3.802 $3.964
Nov. $1.092 $1.357 $1.698 $1.486 $1.410 $1.594 $2.055 $2.497 $2.444 $3.196 $2.191 $2.821 $3.076 $3.674 NA
Dec. $1.076 $1.388 $1.660 $1.281 $1.382 $1.523 $1.922 $2.234 $2.573 $3.129 $1.812 $2.791 $3.146 $3.444 NA
Nov. $0.567 $0.564 $0.825 $0.964 $0.797 $0.929 $1.090 $1.281 $1.394 $1.264 $1.463 $1.206 $1.274 $1.253 NA
Dec. $0.567 $0.564 $0.825 $0.964 $0.702 $0.929 $1.090 $1.281 $1.396 $1.267 $1.463 $1.206 $1.274 $1.253 NA
Nov. $0.057 $0.058 $0.052 $0.071 $0.075 $0.069 $0.070 $0.072 $0.077 $0.080 $0.080 $0.082 $0.088 $0.089 NA
Dec. $0.057 $0.058 $0.059 $0.071 $0.075 $0.069 $0.070 $0.072 $0.077 $0.080 $0.080 $0.082 $0.088 $0.089 NA
Source: U.S. Bureau of Labor Statistics, November 2012
Seattle metro area piped natural gas, per therm, 1998-2012 Year 1998 1999 2000 2001 2002 2003 2004 2005 2006 2007 2008 2009 2010 2011 2012
Jan. $0.567 $0.564 $0.564 $0.825 $0.964 $0.699 $0.929 $1.090 $1.281 $1.437 $1.267 $1.463 $1.207 $1.275 $1.253
Feb. $0.567 $0.564 $0.646 $1.032 $0.964 $0.699 $0.929 $1.092 $1.281 $1.437 $1.267 $1.457 $1.207 $1.275 $1.253
March $0.567 $0.564 $0.646 $1.032 $0.964 $0.699 $0.929 $1.132 $1.281 $1.437 $1.267 $1.457 $1.207 $1.275 $1.253
April $0.567 $0.564 $0.646 $1.032 $0.964 $0.829 $0.931 $1.133 $1.281 $1.440 $1.268 $1.463 $1.224 $1.301 $1.246
May $0.567 $0.564 $0.646 $1.050 $0.965 $0.829 $0.931 $1.133 $1.281 $1.440 $1.268 $1.463 $1.224 $1.307 $1.264
June $0.567 $0.564 $0.649 $1.047 $0.790 $0.829 $0.931 $1.133 $1.281 $1.440 $1.268 $1.438 $1.249 $1.307 $1.264
July $0.567 $0.564 $0.649 $1.047 $0.790 $0.829 $0.931 $1.133 $1.281 $1.440 $1.268 $1.438 $1.249 $1.307 $1.264
Aug. $0.567 $0.564 $0.649 $1.045 $0.790 $0.829 $0.931 $1.133 $1.281 $1.440 $1.268 $1.438 $1.249 $1.307 $1.264
Sept. $0.567 $0.564 $0.825 $1.045 $0.790 $0.829 $0.931 $1.130 $1.281 $1.440 $1.268 $1.438 $1.249 $1.307 $1.264
Oct. $0.567 $0.564 $0.825 $0.964 $0.797 $0.929 $1.090 $1.281 $1.394 $1.264 $1.400 $1.206 $1.250 $1.306 $1.266
Source: U.S. Bureau of Labor Statistics, November 2012
42 THE HERALD BUSINESS JOURNAL
MARKET FACTS 2013
Seattle metro area electricity per kilowatt hour, 1998-2012 Year 1998 1999 2000 2001 2002 2003 2004 2005 2006 2007 2008 2009 2010 2011 2012
Jan. $0.056 $0.057 $0.059 $0.063 $0.070 $0.075 $0.069 $0.070 $0.072 $0.075 $0.080 $0.080 $0.085 $0.088 $0.089
Feb. $0.057 $0.057 $0.059 $0.066 $0.070 $0.075 $0.069 $0.070 $0.072 $0.075 $0.080 $0.080 $0.085 $0.088 $0.089
March $0.054 $0.054 $0.057 $0.068 $0.070 $0.069 $0.069 $0.071 $0.072 $0.075 $0.080 $0.080 $0.085 $0.088 $0.089
Source: U.S. Bureau of Labor Statistics, November 2012
April $0.051 $0.052 $0.054 $0.065 $0.071 $0.070 $0.070 $0.073 $0.073 $0.076 $0.073 $0.082 $0.088 $0.089 $0.092
May $0.051 $0.052 $0.054 $0.065 $0.071 $0.070 $0.070 $0.073 $0.073 $0.076 $0.082 $0.082 $0.089 $0.090 $0.093
June $0.051 $0.052 $0.054 $0.065 $0.071 $0.070 $0.070 $0.073 $0.073 $0.080 $0.082 $0.082 $0.089 $0.090 $0.093
July $0.051 $0.052 $0.054 $0.068 $0.076 $0.070 $0.070 $0.073 $0.075 $0.080 $0.082 $0.082 $0.090 $0.090 $0.093
Aug. $0.051 $0.052 $0.054 $0.068 $0.076 $0.070 $0.070 $0.073 $0.075 $0.080 $0.082 $0.082 $0.090 $0.090 $0.093
Sept. $0.054 $0.055 $0.056 $0.068 $0.076 $0.070 $0.070 $0.073 $0.075 $0.081 $0.082 $0.082 $0.090 $0.090 $0.093
Oct. $0.057 $0.058 $0.059 $0.072 $0.075 $0.069 $0.070 $0.072 $0.077 $0.080 $0.081 $0.082 $0.089 $0.089 $0.092
STATISTICAL SNAPSHOT
Quantity indexes for Real GDP, Seattle Metropolitan Area (2005=100) 2010 112.514 111.956 93.571 (NA) (NA) 143.855 116.34 79.813 118.524 (D) (NA) (NA) (NA) (NA) (NA) (NA) (NA) (D) (NA) (NA) (NA) (NA) (NA) 116.744 103.859 96.488 (NA) (NA) (NA) 131.488 (NA) 95.858 (NA) (NA) 121.029 (NA) (NA) 115.449 98.901 103.267 (NA) (NA) 97.592 122.574 (NA) 92.211 (NA) (NA) 94.336 (NA) (NA) 95.098 116.456 (NA) (NA) (NA)
105.416 105.482 99.868 115.88 107.603 117.136 90.248 (D) 106.853 110.67
101.259 110.103 99.959 114.098 110.385 120.138 93.743 (NA) 106.448 113.248
THE HERALD BUSINESS JOURNAL 43
2009 110.419 109.95 101.936 74.926 108.621 125.224 117.866 87.692 115.485 123.701 77.426 84.692 75.39 147.805 124.554 58.493 115.51 81.107 (D) 94.681 51.441 72.039 61.586 112.065 99.305 96.032 86.403 106.422 98.564 122.079 103.904 103.018 84.955 128.787 120.751 122.387 95.979 112.098 101.416 98.955 96.153 132.36 98.467 119.134 122.076 88.685 82.04 97.859 90.852 100.558 88.02 92.278 113.695 107.812 128.213 111.298
MARKET FACTS 2013
Industry 2001 2002 2003 2004 2005 2006 2007 2008 All industry total 92.726 92.763 93.82 95.675 100 105.324 112.188 113.911 Private industries 92.443 92.251 93.442 95.47 100 105.497 113.231 114.514 Agriculture, forestry, fishing, hunting 94.303 94.444 103.162 96.197 100 110.194 110.552 (D) Crop and animal production (farms) 92.501 89.385 111.894 85.529 100 95.874 76.027 55.547 Forestry, fishing, related activities 94.415 95.262 100.889 98.867 100 113.286 118.441 (D) Mining 132.416 105.106 114.45 97.191 100 120.508 120.536 (D) Utilities 118.407 110.987 111.867 106.639 100 113.796 103.162 122.074 Construction 105.422 97.644 97.412 98.774 100 105.174 110.264 106.706 Manufacturing 92.493 94.131 85.311 84.348 100 114.38 128.233 127.276 Durable goods 94.166 90.438 (D) 84.171 100 117.766 132.248 (D) Wood product manufacturing 98.836 80.357 92.669 94.216 100 89.28 100.583 95.037 Nonmetallic mineral product manufacturing 94.136 88.829 92.385 96.318 100 92.762 107.983 98.957 Fabricated metal product manufacturing 81.437 83.409 81.81 93.611 100 111.908 119.012 113.583 Machinery manufacturing 87.761 73.503 72.259 89.611 100 142.086 184.614 186.937 Computer and electronic product manufacturing 30.691 32.298 40.511 56.519 100 95.913 108.107 131.698 Furniture and related product manufacturing 97.796 88.999 90.749 92.592 100 112.481 112.817 92.887 Miscellaneous manufacturing 96.338 104.955 97.569 99.005 100 116.747 116.283 127.411 Nondurable goods 85.305 110.703 (D) 85.155 100 99.835 110.999 (D) Apparel, leather and allied product manufacturing (D) 87.152 83.234 94.207 100 (D) (D) (D) Printing and related support activities 107.721 110.593 100.659 108.579 100 107.809 107.258 108.724 Petroleum and coal products manufacturing 27.711 62.726 56.05 48.352 100 60.2 60.657 46.296 Chemical manufacturing 101.465 320.703 114.555 92.133 100 108.187 111.795 68.745 Plastics and rubber products manufacturing 82.18 81.187 85.901 88.217 100 101.768 111.366 75.85 Wholesale trade 89.939 88.549 93.278 100.756 100 103.076 108.218 108.987 Retail trade 93.079 94.305 94.658 95.941 100 104.968 108.641 103.641 Transportation and warehousing 75.72 75.753 81.908 92.475 100 105.494 106.491 105.404 Truck transportation 80.276 79.044 80.038 89.444 100 105.734 110.026 102.062 Transit and ground passenger transportation 113.013 111.787 100.28 105.646 100 104.692 116.36 114.355 Warehousing and storage 55.8 56.781 60.203 89.386 100 105.538 110.566 102.645 Information 82.886 89.331 91.337 95.441 100 97.95 116.429 122.23 Motion picture and sound recording industries 90.002 82.832 82.288 92.656 100 109.362 115.617 110.329 Finance and insurance 94.977 94.271 102.301 98.115 100 106.626 104.907 105.105 Securities, commodity contracts, investments (D) (D) (D) (D) 100 107.254 (D) 85.654 Insurance carriers and related activities 109.716 98.311 98.843 99.266 100 105.502 111.992 116.568 Real estate and rental and leasing 98.495 94.999 95.621 96.761 100 105.24 115.311 121.044 Real estate 98.11 95.247 95.982 97.152 100 105.648 115.407 122.183 Rental and leasing services and lessors of intangible assets 104.67 91.341 90.186 90.873 100 99.073 113.924 103.804 Professional, scientific and technical services 92.223 88.737 91.41 93.937 100 105.474 115.432 116.635 Management of companies and enterprises 111.381 111.449 117.202 114.674 100 109.403 104.915 104.412 Administrative and waste management services 83.949 81.729 89.791 91.735 100 106.098 115.553 114.051 Administrative and support services 83.05 81.147 89.9 91.836 100 106.767 113.63 111.751 Waste management and remediation services 95.143 88.91 88.488 90.527 100 98.098 138.758 141.705 Educational services 107.493 108.022 104.144 107.76 100 100.153 99.551 102.617 Health care and social assistance 88.799 91.561 94.294 97.284 100 104.035 107.907 115.004 Ambulatory health care services 85.823 88.794 93.354 97.047 100 105.813 110.276 117.865 Arts, entertainment and recreation 85.959 85.819 87.977 98.468 100 105.894 104.404 101.471 Performing arts, spectator sports, museums and related services 83.574 84.823 89.324 99.955 100 104.326 99.533 93.539 Amusement, gambling and recreation 88.808 86.974 86.232 96.54 100 107.982 111.032 112.434 Accommodation and food services 94.058 91.636 95.134 98.524 100 106.289 106.105 101.184 Accommodation 90.563 89.345 94.564 98.717 100 104.971 110.256 105.477 Food services and drinking places 95.119 92.326 95.304 98.466 100 106.685 104.845 99.882 Other services, exc. government 100.031 100.456 98.036 99.318 100 101.718 104.194 99.332 Government 94.976 97.051 96.941 97.35 100 103.947 104.018 109.088 Federal civilian 108.234 112.549 111.544 107.781 100 105.565 101.835 101.495 Federal military 81.724 85.743 88.534 91.066 100 102.219 105.107 116.477 State and local 95.12 96.303 95.73 96.555 100 104.02 104.211 108.844 Addenda: Natural resources and mining 97.708 95.474 104.255 96.308 100 111.585 111.896 102.144 Trade 91.559 91.471 93.988 98.285 100 104.041 108.435 106.262 Transportation and utilities 82.134 81.078 86.488 94.706 100 106.911 105.819 108.298 Financial activities 97.527 94.806 97.495 97.141 100 105.625 112.454 116.665 Professional and business services 92.732 89.951 94.318 96.087 100 106.144 113.975 114.328 Education and health services 90.423 93.004 95.179 98.224 100 103.676 107.123 113.83 Leisure and hospitality 91.729 89.955 93.07 98.508 100 106.175 105.619 101.259 Information, communication and technology 77.564 84.55 89.395 88.141 100 98.564 (D) (D) Private goods-producing industries 96.145 95.386 89.226 88.629 100 111.65 122.428 120.36 Private services-providing industries 91.671 91.603 94.399 97.005 100 104.093 111.13 113.174 Note: NAICS Industry detail is based on the 2002 North American Industry Classification System (NAICS). (D): Not shown in order to avoid the disclosure of confidential information; estimates are included in higher level totals. (NA): Not available. Note: On Sept. 29, 2011, statistics of per capita real GDP were updated to incorporate Census Bureau midyear population estimates released on Sept. 28, 2011. Source: U.S. Bureau of Economic Analysis. Last updated Sept. 29, 2011
STATISTICAL SNAPSHOT
44 THE HERALD BUSINESS JOURNAL
MARKET FACTS 2013
Gross Domestic Product, Seattle metro area (millions of current dollars) Industry 2001 All industry total $157,765 Private industries $141,640 Agriculture, forestry, fishing, hunting $792 Crop and animal production (farms) $142 Forestry, fishing and related activities $650 Mining $100 Mining (exc. oil and gas) (D) Utilities $1,278 Construction $6,921 Manufacturing $18,656 Durable goods $15,489 Wood product manufacturing $414 Nonmetallic mineral product manufacturing $447 Primary metal manufacturing $127 Fabricated metal product manufacturing $716 Machinery manufacturing $527 Computer and electronic product manufacturing $1,053 Electrical equipment, appliance and component manufacturing $284 Furniture and related product manufacturing $300 Miscellaneous manufacturing $557 Nondurable goods $3,168 Food and beverage and tobacco product manufacturing (D) Apparel and leather and allied product manufacturing (D) Printing and related support activities $417 Petroleum and coal products manufacturing $164 Chemical manufacturing $370 Plastics and rubber products manufacturing $343 Wholesale trade $10,405 Retail trade $10,605 Transportation and warehousing $4,718 Air transportation $1,060 Rail transportation $199 Truck transportation $994 Transit and ground passenger transportation $228 Warehousing and storage $216 Information $17,799 Publishing industries, exc. Internet (D) Motion picture and sound recording industries $182 Finance and insurance $9,410 Securities, commodity contracts, investments (D) Insurance carriers and related activities $3,524 Real estate and rental and leasing $25,324 Real estate $23,666 Rental and leasing services and lessors of intangible assets $1,657 Professional, scientific and technical services $11,513 Management of companies and enterprises $2,470 Administrative and waste management services $4,013 Administrative and support services $3,683 Waste management and remediation services $330 Educational services $829 Health care and social assistance $7,751 Ambulatory health care services $4,178 Hospitals and nursing and residential care facilities (D) Social assistance (D) Arts, entertainment and recreation $1,486 Performing arts, spectator sports, museums and related services $792 Amusement, gambling and recreation $694 Accommodation and food services $4,085 Accommodation $942 Food services and drinking places $3,142 Other services, exc. government $3,482 Government $16,125 Federal civilian $2,685 Federal military $2,066 State and local $11,374
2002 $161,175 $143,962 $755 $125 $630 $83 (D) $1,177 $6,693 $19,063 $14,947 $332 $432 $88 $732 $443 $987 $278 $278 $618 $4,116 (D) $81 $403 $294 $1,193 $342 $10,174 $10,805 $4,783 $1,084 $192 $999 $233 $222 $19,265 (D) $174 $9,668 (D) $3,295 $25,317 $23,869 $1,449 $11,202 $2,511 $4,006 $3,684 $322 $886 $8,266 $4,392 (D) (D) $1,524 $831 $693 $4,127 $936 $3,191 $3,657 $17,214 $2,972 $2,352 $11,890
2003 $166,425 $148,293 $859 $177 $682 $95 $92 $1,214 $6,953 $17,475 (D) $397 $436 (D) $703 $430 $1,083 $289 $281 $575 (D) (D) $77 $365 $325 $434 $354 $10,488 $11,153 $5,234 (D) (D) $1,024 $219 $238 $19,573 (D) $171 $10,850 (D) $3,508 $26,068 $24,583 $1,485 $11,776 $2,840 $4,379 $4,048 $331 $912 $8,797 $4,735 (D) (D) $1,620 $913 $707 $4,322 $991 $3,331 $3,688 $18,132 $3,107 $2,635 $12,390
2004 $173,493 $154,418 $838 $162 $677 $94 (D) $1,207 $7,570 $17,491 $14,276 $470 $460 (D) $812 $512 $1,353 (D) $273 $574 $3,215 (D) $85 $388 $300 $349 $354 $11,533 $11,679 $5,762 (D) (D) $1,152 $235 $371 $19,853 (D) $199 $10,698 (D) $3,683 $26,952 $25,379 $1,573 $12,428 $2,999 $4,587 $4,241 $347 $1,006 $9,372 $5,052 (D) (D) $1,865 $1,060 $805 $4,604 $1,060 $3,544 $3,878 $19,075 $3,217 $2,896 $12,962
2005 $186,561 $165,970 $851 $157 $695 $123 (D) $1,174 $8,569 $21,174 $17,232 $485 $512 (D) $918 $586 $2,172 (D) $307 $580 $3,942 (D) $88 $367 $840 $392 $413 $12,004 $12,543 $6,078 (D) (D) $1,288 $229 $416 $20,461 (D) $222 $11,108 $1,355 $3,843 $28,551 $26,769 $1,783 $13,674 $2,847 $5,027 $4,638 $389 $994 $9,912 $5,316 (D) (D) $1,952 $1,111 $841 $4,838 $1,121 $3,717 $4,090 $20,592 $3,104 $3,464 $14,023
2006 $202,414 $179,993 $946 $141 $805 $173 $168 $1,524 $9,881 $24,519 $20,456 $399 $537 (D) $1,023 $835 $1,862 (D) $350 $680 $4,063 (D) (D) $411 $586 $437 $464 $12,739 $13,488 $6,474 (D) (D) $1,362 $248 $447 $20,123 (D) $247 $11,918 $1,498 $4,122 $31,040 $29,235 $1,805 $14,979 $3,319 $5,483 $5,093 $390 $1,058 $10,565 $5,699 (D) (D) $2,129 $1,202 $927 $5,302 $1,212 $4,091 $4,332 $22,421 $3,411 $3,780 $15,230
2007 $220,701 $197,162 $1,026 $151 $875 $196 $190 $1,407 $11,043 $27,325 $22,814 $390 $623 (D) $1,128 $1,107 $1,869 (D) $362 $687 $4,511 (D) (D) $404 $662 $451 $494 $13,389 $13,952 $6,610 (D) (D) $1,408 $282 $485 $23,694 $15,622 $270 $11,982 (D) $4,397 $34,740 $32,643 $2,096 $17,177 $3,545 $6,189 $5,621 $568 $1,115 $11,417 $6,205 $4,049 $1,164 $2,170 $1,211 $959 $5,587 $1,356 $4,230 $4,597 $23,539 $3,423 $4,132 $15,983
2008 $227,758 $202,276 (D) $111 (D) (D) (D) $1,659 $10,752 $27,186 (D) $346 $544 (D) $1,122 $1,122 $2,054 (D) $301 $751 (D) $1,508 (D) $396 $511 $318 $346 $13,659 $13,563 $6,669 (D) (D) $1,317 $280 $465 $24,783 $15,849 $259 $12,332 $1,437 $4,526 $37,419 $35,419 $2,000 $17,684 $3,483 $6,076 $5,477 $600 $1,210 $12,414 $6,734 $4,417 $1,263 $2,155 $1,167 $988 $5,505 $1,320 $4,185 $4,552 $25,482 $3,464 $4,720 $17,297
2009 $225,434 $198,213 $933 $112 $821 $212 (D) $1,797 $9,026 $26,475 $22,709 $283 $515 (D) $897 $1,024 $1,901 (D) $218 $719 $3,766 (D) (D) $358 $405 $373 $320 $12,959 $12,927 $6,482 (D) (D) $1,199 $280 $455 $25,106 $16,204 $246 $12,172 $1,352 $5,203 $37,906 $36,050 $1,857 $17,162 $3,275 $5,518 $4,939 $579 $1,241 $13,370 $7,220 $4,825 $1,326 $1,924 $1,049 $875 $5,262 $1,240 $4,022 $4,464 $27,221 $3,750 $5,193 $18,278
2010 $231,221 $202,853 $929 (NA) (NA) $263 (NA) $1,800 $8,024 $28,052 (D) (NA) (NA) (NA) (NA) (NA) (NA) (NA) (NA) (NA) (D) (NA) (NA) (NA) (NA) (NA) (NA) $13,406 $13,529 $6,666 (NA) (NA) (NA) (NA) (NA) $26,751 (NA) (NA) $11,567 (NA) (NA) $37,497 (NA) (NA) $17,834 $3,277 $5,823 (NA) (NA) $1,288 $14,052 (NA) (NA) (NA) $1,958 (NA) (NA) $5,491 (NA) (NA) $4,646 $28,368 $(NA) (NA) (NA)
Notes: NAICS Industry detail is based on the 2002 North American Industry Classification System (NAICS). On Sept. 29, 2011, statistics of per capita real GDP were updated to incorporate Census Bureau midyear population estimates released on Sept. 28, 2011. Last updated Sept. 29, 2011. (D): Not shown in order to avoid the disclosure of confidential information; estimates are included in higher level totals. (L): Less than $500,000 in nominal or real GDP by metropolitan area. (NA): Not available. (NM): Not meaningful. Source: U.S. Bureau of Economic Analysis, November 2011
STATISTICAL SNAPSHOT
Snohomish County civilian labor force and employment, 1996-2012 Benchmark March 2011*. Not seasonally adjusted Sept. 294,490 280,060 14,430 4.9% 309,750 297,320 12,430 4.0% 319,260 305,650 13,610 4.3% 326,060 310,160 15,900 4.9% 317,100 303,410 13,690 4.3% 326,610 309,370 17,240 5.3% 332,360 308,710 23,650 7.1% 335,380 310,260 25,120 7.5% 336,470 318,510 17,960 5.3% 347,640 329,560 18,080 5.2% 359,270 342,840 16,430 4.6% 364,560 350,560 14,000 3.8% 375,050 355,050 20,000 5.3% 384,030 343,420 40,610 10.6% 385,190 345,230 39,960 10.4% 386,840 352,730 34,110 8.8% 389,770 360,290 29,480 7.6%
Oct. 296,340 282,530 13,810 4.7% 311,760 300,090 11,670 3.7% 321,390 308,090 13,300 4.1% 326,670 311,700 14,970 4.6% 319,290 306,040 13,250 4.1% 327,210 309,120 18,090 5.5% 331,540 308,400 23,140 7.0% 335,410 311,930 23,480 7.0% 337,910 319,620 18,290 5.4% 350,130 332,730 17,400 5.0% 360,600 344,730 15,870 4.4% 364,970 350,980 13,990 3.8% 375,850 353,020 22,830 6.1% 383,010 341,890 41,120 10.7% 385,540 345,370 40,170 10.4% 385,590 352,420 33,170 8.6%
Nov. 298,520 283,920 14,600 4.9% 315,680 303,550 12,130 3.8% 322,760 309,260 13,500 4.2% 327,680 312,610 15,070 4.6% 321,900 307,570 14,330 4.5% 328,170 307,910 20,260 6.2% 331,980 307,380 24,600 7.4% 337,710 314,150 23,560 7.0% 340,100 321,670 18,430 5.4% 351,890 333,950 17,940 5.1% 361,770 344,550 17,220 4.8% 367,880 353,250 14,630 4.0% 376,940 352,360 24,580 6.5% 381,900 341,150 40,750 10.7% 385,310 344,060 41,250 10.7% 385,400 352,830 32,570 8.5%
Dec. 299,950 285,810 14,140 4.7% 317,110 304,920 12,190 3.8% 325,860 312,190 13,670 4.2% 330,040 314,830 15,210 4.6% 325,360 311,260 14,100 4.3% 330,900 310,190 20,710 6.3% 332,470 308,940 23,530 7.1% 338,040 316,040 22,000 6.5% 342,280 323,880 18,400 5.4% 353,500 336,700 16,800 4.8% 363,940 347,410 16,530 4.5% 368,760 353,760 15,000 4.1% 380,300 352,090 28,210 7.4% 381,940 339,940 42,000 11.0% 384,290 345,730 38,560 10.0% 384,760 354,110 30,650 8.0%
THE HERALD BUSINESS JOURNAL 45
Aug. 294,920 281,380 13,540 4.6% 310,320 298,740 11,580 3.7% 317,810 305,660 12,150 3.8% 326,520 312,280 14,240 4.4% 318,930 305,460 13,470 4.2% 327,420 311,620 15,800 4.8% 331,560 309,720 21,840 6.6% 334,880 312,500 22,380 6.7% 337,040 320,110 16,930 5.0% 347,410 331,320 16,090 4.6% 360,500 344,470 16,030 4.4% 362,140 349,100 13,040 3.6% 374,710 355,230 19,480 5.2% 382,350 344,100 38,250 10.0% 383,970 345,130 38,840 10.1% 383,560 350,400 33,160 8.6% 385,240 353,390 31,850 8.3%
MARKET FACTS 2013
Annual avg. Jan. Feb. March April May June July 1996 labor force 296,010 294,490 293,620 296,810 293,030 296,520 294,970 298,510 Total employment 280,230 274,700 275,110 279,180 276,970 279,770 279,540 283,790 Total unemployment 15,780 19,790 18,510 17,630 16,060 16,750 15,430 14,720 Unemployment rate 5.3% 6.7% 6.3% 5.9% 5.5% 5.6% 5.2% 4.9% 1997 labor force 311,250 307,240 307,480 311,840 308,270 311,370 310,970 313,280 Total employment 298,280 291,480 291,800 297,080 295,550 299,050 298,150 301,660 Total unemployment 12,970 15,760 15,680 14,760 12,720 12,320 12,820 11,620 Unemployment rate 4.2% 5.1% 5.1% 4.7% 4.1% 4.0% 4.1% 3.7% 1998 labor force 321,730 323,410 322,900 324,540 319,240 321,870 320,400 321,390 Total employment 308,440 308,380 308,270 310,310 307,740 309,620 307,150 309,010 Total unemployment 13,290 15,030 14,630 14,230 11,500 12,250 13,250 12,380 Unemployment rate 4.1% 4.6% 4.5% 4.4% 3.6% 3.8% 4.1% 3.9% 1999 labor force 328,350 330,220 330,090 331,400 326,210 328,580 327,080 329,750 Total employment 313,030 314,450 313,250 315,920 311,900 313,360 310,890 315,070 Total unemployment 15,320 15,770 16,840 15,480 14,310 15,220 16,190 14,680 Unemployment rate 4.7% 4.8% 5.1% 4.7% 4.4% 4.6% 4.9% 4.5% 2000 labor force 322,900 326,620 325,780 328,780 323,270 324,210 322,750 320,820 Total employment 308,350 310,000 308,500 312,440 309,650 309,780 308,710 307,370 Total unemployment 14,550 16,620 17,280 16,340 13,620 14,430 14,040 13,450 Unemployment rate 4.5% 5.1% 5.3% 5.0% 4.2% 4.5% 4.4% 4.2% 2001 labor force 329,730 328,350 329,610 333,750 330,610 331,260 330,860 332,010 Total employment 312,300 311,960 312,010 315,990 314,680 314,830 313,850 316,030 Total unemployment 17,430 16,390 17,600 17,760 15,930 16,430 17,010 15,980 Unemployment rate 5.3% 5.0% 5.3% 5.3% 4.8% 5.0% 5.1% 4.8% 2002 labor force 333,170 332,660 334,150 335,640 333,310 334,830 333,620 333,920 Total employment 309,730 309,930 310,450 310,930 310,130 311,010 309,810 311,330 Total unemployment 23,440 22,730 23,700 24,710 23,180 23,820 23,810 22,590 Unemployment rate 7.0% 6.8% 7.1% 7.4% 7.0% 7.1% 7.1% 6.8% 2003 labor force 335,910 333,900 335,120 337,550 334,250 336,600 335,960 336,150 Total employment 312,000 309,890 309,400 311,750 311,480 312,420 311,110 313,120 Total unemployment 23,910 24,010 25,720 25,800 22,770 24,180 24,850 23,030 Unemployment rate 7.1% 7.2% 7.7% 7.6% 6.8% 7.2% 7.4% 6.9% 2004 labor force 339,050 338,490 339,420 342,160 338,290 338,970 338,290 339,200 Total employment 319,440 315,510 316,460 319,430 319,340 318,900 318,720 321,100 Total unemployment 19,610 22,980 22,960 22,730 18,950 20,070 19,570 18,100 Unemployment rate 5.8% 6.8% 6.8% 6.6% 5.6% 5.9% 5.8% 5.3% 2005 labor force 346,770 341,990 341,980 343,060 343,360 345,970 345,570 348,650 Total employment 328,930 322,660 321,350 324,060 327,100 328,280 327,730 331,680 Total unemployment 17,840 19,330 20,630 19,000 16,260 17,690 17,840 16,970 Unemployment rate 5.1% 5.7% 6.0% 5.5% 4.7% 5.1% 5.2% 4.9% 2006 labor force 360,390 355,280 358,220 360,740 358,950 361,050 362,900 361,490 Total employment 343,720 338,050 339,920 343,490 343,930 344,680 345,750 344,880 Total unemployment 16,670 17,230 18,300 17,250 15,020 16,370 17,150 16,610 Unemployment rate 4.6% 4.8% 5.1% 4.8% 4.2% 4.5% 4.7% 4.6% 2007 labor force 364,040 359,650 361,530 363,310 361,030 362,790 365,060 366,780 Total employment 349,390 342,310 344,620 347,980 348,290 349,300 350,370 352,180 Total unemployment 14,650 17,340 16,910 15,330 12,740 13,490 14,690 14,600 Unemployment rate 4.0% 4.8% 4.7% 4.2% 3.5% 3.7% 4.0% 4.0% 2008 labor force 373,780 369,610 370,300 370,960 370,160 371,640 373,630 376,230 Total employment 354,330 353,660 353,500 354,780 355,790 354,550 354,950 356,990 Total unemployment 19,450 15,950 16,800 16,180 14,370 17,090 18,680 19,240 Unemployment rate 5.2% 4.3% 4.5% 4.4% 3.9% 4.6% 5.0% 5.1% 383,150 379,370 383,250 383,300 382,240 383,860 386,010 386,610 2009 labor force Total employment 344,460 346,340 346,200 345,920 347,410 346,040 344,870 346,300 Total unemployment 38,690 33,030 37,050 37,380 34,830 37,820 41,140 40,310 Unemployment rate 10.1% 8.7% 9.7% 9.8% 9.1% 9.9% 10.7% 10.4% 2010 labor force 387,140 387,920 388,600 389,800 389,680 388,470 388,650 388,250 Total employment 346,210 344,110 344,340 347,340 350,270 348,830 346,790 347,320 Total unemployment 40,930 43,810 44,260 42,460 39,410 39,640 41,860 40,930 Unemployment rate 10.6% 11.3% 11.4% 10.9% 10.1% 10.2% 10.8% 10.5% 2011 labor force 385,370 384,470 386,560 386,360 383,260 384,720 386,220 386,740 Total employment 349,640 344,120 345,840 347,820 348,300 349,230 348,090 349,790 Total unemployment 35,730 40,350 40,720 38,540 34,960 35,490 38,130 36,950 Unemployment rate 9.3% 10.5% 10.5% 10.0% 9.1% 9.2% 9.9% 9.6% 2012 labor force 388,090 384,570 386,210 387,180 386,390 389,180 392,410 391,810 Total employment 356,110 350,990 351,710 354,400 358,810 358,320 359,850 357,210 Total unemployment 31,980 33,580 34,500 32,780 27,580 30,860 32,560 34,600 Unemployment rate 8.2% 8.7% 8.9% 8.5% 7.1% 7.9% 8.3% 8.8% *: Official U.S. Department of Labor, Bureau of Labor Statistics data. Note: Detail may not add or divide due to rounding. Source: Washington State Employment Security Department, Labor Market and Economic Analysis Branch. Oct. 23, 2012
STATISTICAL SNAPSHOT
Taxable retail sales of select industries in Snohomish County, 2004-12 Business sector (retail trade, NAICS no.) 2004 sales 2005 sales 2006 sales 2007 sales 2008 sales 2009 sales 2010 sales 2011 sales 2012 Q1 2012 Q2 Motor vehicles, parts; 441 $1,321,553,997 $1,431,450,926 $1,517,822,206 $1,555,036,478 $1,237,851,839 $1,067,858,083 $1,103,377,360 $1,175,880,476 $309,910,407 $343,932,266 New, used auto dealers; 4411 $1,035,774,969 $1,119,422,669 $1,177,743,620 $1,209,172,935 $952,647,793 $822,040,616 $848,623,034 $921,129,802 $244,962,073 $266,486,792 RV, boat, motorcycle dealers; 4412 $139,438,763 $153,518,964 $166,200,191 $167,409,347 $120,143,341 $91,516,060 $80,781,485 $78,702,149 $17,533,443 $30,010,279 Automotive parts, tires; 4413 $146,340,265 $158,509,293 $173,878,395 $178,454,196 $165,060,705 $154,301,407 $173,972,840 $176,048,525 $47,414,891 $47,435,195 Furniture, home furnishing; 442 $160,576,327 $198,667,394 $218,146,172 $221,823,205 $182,889,674 $154,546,462 $157,711,033 $162,896,598 $38,807,917 $40,967,556 Electronics, appliances; 443 $245,347,258 $277,322,498 $306,031,212 $320,973,609 $319,022,784 $266,142,350 $270,768,709 $272,407,376 $62,158,001 $62,368,801 Appliances, TV, other electronics; 44311 $145,308,970 $169,906,045 $198,787,217 $216,090,252 $196,517,688 $163,755,520 $157,037,503 $152,519,632 * * Computers, software; 44312 $93,762,895 $101,503,183 $101,366,023 $99,272,378 $118,639,670 $99,373,807 $111,663,410 $117,809,998 * * Camera, photo supplies; 44313 $6,275,393 $5,913,270 $5,877,972 $5,610,979 $3,865,426 $3,013,023 $2,067,796 $2,077,746 * * Building matls., garden equip., supplies; 444 $466,053,710 $512,784,750 $558,853,937 $563,293,044 $489,113,515 $409,097,174 $410,223,440 $407,547,001 $87,451,837 $127,021,431 Building materials; 4441 $420,307,207 $467,954,945 $509,323,233 $501,361,294 $437,748,753 $365,336,005 $368,904,411 $362,748,520 $79,136,741 $110,684,740 Lawn-garden supplies, equipment; 4442 $45,746,503 $44,829,805 $49,530,704 $61,931,750 $51,364,762 $43,761,169 $41,319,029 $44,798,481 $8,315,096 $16,336,691 Food-beverage stores; 445 $314,095,641 $296,593,179 $311,883,911 $333,691,097 $344,101,209 $344,473,407 $352,505,333 $341,354,817 $82,140,251 $90,547,707 Grocery, convenience stores; 4451 $307,479,956 $287,623,203 $301,772,593 $322,289,783 $332,210,271 $331,883,721 $336,586,811 $325,700,622 $78,203,444 $85,881,963 Other food, beverage stores; 4452, 4453 $6,615,685 $8,969,976 $10,111,318 $11,401,314 $11,890,938 $12,589,686 $15,918,522 $15,654,195 $3,936,807 $4,665,744 Drug-health stores; 446 $111,232,901 $126,685,276 $142,099,604 $151,914,419 $151,896,147 $157,525,566 $165,685,957 $177,643,160 $41,326,262 $43,975,611 Gas stations, conv. stores w/pumps; 447 $96,078,102 $98,334,904 $105,275,705 $111,454,295 $112,943,484 $115,668,615 $127,495,016 $131,357,631 $30,788,025 $33,214,405 Apparel, accessories; 448 $297,020,681 $404,602,014 $490,424,328 $570,994,484 $551,207,263 $507,790,484 $539,154,293 $578,740,529 $115,349,134 $138,234,308 Clothing, shoe stores; 4481, 4482 $254,428,181 $345,947,276 $419,062,492 $489,499,647 $474,334,918 $430,757,201 $454,640,108 $490,165,224 $97,449,984 $117,700,892 Jewelry, luggage stores; 4483 $42,592,500 $58,654,738 $71,361,836 $81,494,837 $76,872,345 $77,033,283 $84,514,185 $88,575,305 $17,899,150 $20,533,416 Sporting goods, toys, book, music stores; 451 $164,190,757 $171,456,922 $182,358,471 $194,583,490 $188,203,282 $197,994,318 $211,221,405 $219,050,158 $46,150,122 $63,649,494 Sporting goods, toys, hobby-craft; 4511 $121,980,583 $134,740,848 $145,337,426 $157,296,676 $155,303,778 $167,400,957 $180,321,482 $187,842,872 $42,750,864 $60,164,249 Book-periodical-music store; 4512 $42,210,174 $36,716,074 $37,021,045 $37,286,814 $32,899,504 $30,593,361 $30,899,923 $31,207,286 $3,399,258 $3,485,245 General merchandise stores; 452 $837,505,275 $922,750,579 $1,059,511,428 $1,135,397,697 $1,090,606,084 $1,087,309,618 $1,124,458,960 $1,138,788,976 $245,871,656 $263,748,684 Department stores; 4521 $337,870,238 $342,802,406 $364,381,382 $369,315,095 $333,915,261 $327,200,889 $329,281,398 $329,955,211 $68,351,954 $74,733,488 General merchandise stores; 4529 $499,635,037 $579,948,173 $695,130,046 $766,082,602 $756,690,823 $760,108,729 $795,177,562 $808,833,765 $177,519,702 $189,015,196 E-commerce, mail order; 4541 $25,967,825 $35,451,449 $41,826,214 $48,404,093 $58,334,645 $64,884,708 $84,307,583 $105,981,534 $26,909,950 $28,062,588 Miscellaneous retailers; 453, 4542, 4543 $341,695,277 $409,842,863 $512,066,079 $552,201,297 $554,249,551 $495,961,493 $495,451,564 $510,060,675 $122,938,652 $119,752,467 Sector total: $4,381,317,751 $4,885,942,754 $5,446,299,267 $5,759,767,208 $5,280,419,477 $4,869,252,278 $5,042,360,652 $5,221,708,931 $1,209,802,214 $1,355,475,318 Agriculture, forestry, fishing; 11 Mining; 21 Utilities; 22
46 THE HERALD BUSINESS JOURNAL
MARKET FACTS 2013
Construction; 23 Construction of buildings; 236 Heavy construction, highways; 237 Special trade contractors; 238 Sector total:
$6,094,026 $17,997,168 $5,615,913
$5,729,120 $23,731,500 $6,268,128
$6,820,219 $25,642,241 $4,213,070
$6,557,508 $26,895,592 $5,181,756
$3,332,826 $13,033,067 $5,785,122
$2,954,329 $4,613,880 $4,722,338
$3,087,354 $5,065,382 $4,556,724
$3,371,152 $6,974,020 $5,814,715
$548,356 $831,051 $1,587,218
$744,522 $1,026,164 $1,880,932
$665,487,207 $789,534,728 $1,044,962,901 $1,177,250,456 $1,072,290,776 $862,126,774 $822,219,264 $595,677,233 $127,683,558 $147,401,563 $197,309,344 $193,629,728 $238,795,002 $304,814,581 $244,140,088 $111,692,020 $578,398,782 $701,067,534 $816,493,102 $858,748,786 $671,523,035 $464,036,296 $450,442,784 $469,749,867 $1,371,569,547 $1,638,003,825 $2,058,765,347 $2,229,628,970 $1,982,608,813 $1,630,977,651 $1,516,802,136 $1,177,119,120
$132,805,745 $31,571,314 $101,050,190 $265,427,249
$151,002,247 $29,568,141 $127,005,360 $307,575,748
Manufacturing; 31-33
$221,956,473
$241,877,836
$258,729,768
$287,158,562
$252,455,875
$170,958,577
$167,404,360
$190,151,006
$38,102,476
$39,654,479
Wholesale trade; 42 Durable goods; 423 Nondurable goods; 424 Electronic markets, agents, brokers; 425 Sector total:
$414,882,204 $101,901,923 $687,377 $517,471,504
$506,812,006 $108,454,988 $954,926 $616,221,920
$521,459,658 $124,958,618 $2,168,365 $648,586,641
$575,990,343 $145,331,968 $1,542,183 $722,864,494
$504,839,920 $134,931,996 $3,349,668 $643,121,584
$429,398,828 $127,762,921 $2,437,894 $559,599,643
$456,451,905 $132,687,878 $1,944,788 $591,084,570
$509,821,842 $148,114,978 $1,683,804 $659,620,624
$112,673,932 $33,496,845 $435,952 $146,606,729
$124,038,871 $37,850,640 $442,539 $162,332,050
Transportation, warehousing; 48-49 Information; 51 Finance, insurance; 52 Real estate, rental-leasing; 53 Professional, scientific, technical svcs.; 54 Management, education, health svcs.; 55-62 Arts, entertainment, recreation; 71
$22,221,257 $431,499,188 $124,686,414 $207,716,295 $92,503,220 $170,079,220 $73,501,637
$25,893,492 $460,025,028 $126,043,666 $224,758,670 $120,292,453 $191,264,341 $74,248,669
$28,998,324 $431,162,159 $122,134,644 $241,671,136 $158,071,530 $216,332,798 $79,208,412
$32,772,318 $522,756,686 $112,259,187 $246,795,236 $141,897,906 $241,610,930 $82,332,543
$32,535,510 $505,300,971 $85,041,082 $225,314,032 $144,162,406 $245,499,351 $83,599,054
$27,492,907 $440,232,701 $74,909,855 $194,187,911 $108,997,600 $218,594,836 $80,092,745
$27,912,360 $466,156,312 $57,582,129 $176,309,339 $135,177,341 $218,269,515 $80,748,590
$28,133,407 $471,483,606 $54,475,887 $162,138,905 $141,461,389 $230,818,073 $81,128,968
$7,145,626 $113,709,956 $14,334,309 $39,328,779 $30,601,198 $54,567,752 $19,743,627
$7,399,367 $110,533,021 $15,743,628 $44,145,097 $30,790,811 $58,576,630 $23,081,506
Accommodations, food services; 72 Accommodations; 721 $58,435,968 Restaurants, food service, drinking places; 722 $655,201,538 Sector total: $713,637,506
$70,084,225 $725,172,290 $795,256,515
$87,510,334 $785,932,145 $873,442,479
$101,150,679 $851,242,433 $952,393,112
$99,720,931 $857,807,317 $957,528,248
$77,786,561 $839,458,390 $917,244,951
$83,094,413 $92,654,224 $863,219,606 $915,678,629 $946,314,019 $1,008,332,853
$19,851,954 $231,740,302 $251,592,256
$25,159,116 $246,583,196 $271,742,312
Other services; 81 Repair, maintenance; 811 Personal service; 812 Religious, civic, other organization; 813, 814 Sector total:
$198,368,393 $49,938,846 $5,539,746 $253,846,985
$213,887,617 $58,218,559 $6,255,018 $278,361,194
$239,997,336 $64,102,888 $7,417,393 $311,517,617
$261,563,038 $67,632,025 $8,336,450 $337,531,513
$247,978,375 $66,114,702 $7,548,143 $321,641,220
$239,596,316 $62,213,493 $5,005,594 $306,815,403
$232,648,785 $56,086,125 $5,359,497 $294,094,406
$234,783,122 $56,569,206 $5,344,798 $296,697,126
$58,207,160 $14,422,469 $1,283,081 $73,912,710
$60,636,839 $15,106,563 $1,293,530 $77,036,932
$2,517,489
$2,602,557
$3,612,877
$3,061,816
$2,681,291
$3,152,351
$3,055,623
$3,233,929
$567,823
$811,924
Public administration, other; 92,00
*: Beginning with Quarter 1 2012 data, various NAICS codes were changed to ensure the relevance, accuracy and timeliness of the classifications. Note: Taxable retail sales are based upon local 0.5 to 1.0 percent county-city sales tax collections Source: Washington State Department of Revenue, December 2012.
STATISTICAL SNAPSHOT
Selected Snohomish County occupational projections, 2010-2020 Estimated employment, 2010
295,014 2,155 542 1,446 4,076 1,005 41 248 1,300 8,964 42 736 368 117 555 17,448 1,158 3,966 11,977 25 1,553 304 303 143 1,377 421 810 435 3,223 198 11,645 430 997 397 16,546 12,118 297 644 13 81 3,537 123 6,384 273 263 51 3,335 757 596 256 320 643 192 172 4,805 430 7,748 1,123 983 17,530 14,765 4,970 990 4,022 123 424 372
313,566 2,347 579 1,550 3,868 1,008 41 259 1,294 9,477 46 728 351 122 600 17,728 1,231 4,168 12,697 25 1,545 298 309 164 1,486 473 897 502 3,430 210 13,157 452 1,058 418 17,318 12,578 308 698 15 87 3,740 131 6,627 303 284 57 3,602 830 595 252 360 662 202 183 5,225 445 8,259 1,211 1,033 18,804 15,794 5,334 1,057 4,460 136 455 393
1.9% 2.1% 1.4% 1.8% 2.2% 0.4% 0.0% 1.1% 2.6% 4.5% 3.1% -1.4% -2.3% 0.5% 2.2% 2.7% 1.2% 1.2% 4.1% 0.8% 0.6% 3.0% 1.0% 3.1% 1.9% 1.6% 2.4% 3.2% 1.8% 2.6% 2.4% 1.4% 1.3% 0.4% 2.2% 2.3% 0.9% 2.3% 1.6% 2.1% 2.0% 0.2% 1.0% 3.9% 2.0% 2.5% 1.8% 1.9% 0.1% 0.3% 2.4% 0.8% 1.2% 1.3% 1.5% 1.8% 2.5% 2.0% 2.4% 2.0% 2.0% 1.8% -0.1% 1.7% 2.4% -0.1% 3.5%
1.2% 1.7% 1.3% 1.4% -1.0% 0.1% 0.0% 0.9% -0.1% 1.1% 1.8% -0.2% -0.9% 0.8% 1.6% 0.3% 1.2% 1.0% 1.2% 0.0% -0.1% -0.4% 0.4% 2.8% 1.5% 2.4% 2.1% 2.9% 1.3% 1.2% 2.5% 1.0% 1.2% 1.0% 0.9% 0.7% 0.7% 1.6% 2.9% 1.4% 1.1% 1.3% 0.7% 2.1% 1.5% 2.2% 1.6% 1.9% 0.0% -0.3% 2.4% 0.6% 1.0% 1.2% 1.7% 0.7% 1.3% 1.5% 1.0% 1.4% 1.4% 1.4% 1.3% 2.1% 2.0% 1.4% 1.1%
5,303 43 7 24 84 4 0 2 31 357 1 -10 -9 1 10 439 13 46 436 0 9 8 3 4 24 6 18 13 54 5 262 6 13 2 334 258 3 14 0 2 67 0 62 9 5 1 56 14 1 1 7 5 2 2 67 7 177 21 22 333 281 83 -1 66 3 -1 12
3,675 38 7 21 -42 0 0 2 -1 102 1 -1 -3 1 8 51 14 39 143 0 -2 -1 1 4 22 10 17 13 41 2 303 4 12 4 154 92 2 11 0 1 41 1 48 6 4 1 53 15 0 -1 8 4 2 2 82 3 103 18 10 255 206 72 13 86 3 6 4
12,072 83 15 63 160 35 2 12 65 508 2 7 0 3 21 773 46 146 639 1 48 15 11 6 69 14 30 26 87 9 438 14 29 8 632 470 11 28 1 3 134 3 423 13 9 3 158 27 16 4 17 22 9 5 159 17 282 47 37 679 562 210 15 146 6 11 20
10,801 90 16 65 55 28 2 12 40 279 2 11 1 4 22 470 49 143 376 1 39 7 10 7 73 19 34 29 78 7 536 15 34 13 532 366 11 28 1 3 121 4 258 11 9 3 159 32 15 4 18 19 10 6 194 13 246 50 30 672 550 190 33 182 6 18 15
Data continues on Page 48
THE HERALD BUSINESS JOURNAL 47
268,426 1,942 506 1,325 3,657 987 41 235 1,145 7,177 36 788 414 114 499 15,260 1,093 3,730 9,791 24 1,506 262 289 123 1,255 389 718 371 2,954 174 10,334 401 934 389 14,876 10,826 284 575 12 73 3,202 122 6,076 226 238 45 3,057 689 592 252 284 617 181 161 4,471 394 6,864 1,017 875 15,857 13,364 4,553 994 3,694 109 427 313
MARKET FACTS 2013
Total, all occupations Accountants and auditors Adult literacy, remedial education, GED teachers, instructors Advertising, marketing, promotions, public relations, sales managers Aerospace engineers Agricultural workers Air traffic controllers Air transportation workers Aircraft mechanics and service technicians Aircraft structure, surfaces, rigging, systems assemblers Anesthesiologists Animal care and service workers Animal trainers Appraisers and assessors of real estate Architects, surveyors, cartographers Architecture and engineering occupations Art and design workers Arts, design, entertainment, sports and media occupations Assemblers and fabricators Athletes and sports competitors Automotive service technicians and mechanics Avionics technicians Bakers Barbers Bartenders Bill and account collectors Billing and posting clerks and machine operators Biological technicians Bookkeeping, accounting and auditing clerks Brickmasons and blockmasons Building and grounds cleaning and maintenance occupations Bus and truck mechanics and diesel engine specialists Bus drivers, school Bus drivers, transit and intercity Business and financial operations occupations Business operations specialists Butchers and meat cutters Cabinetmakers and bench carpenters Captains, mates and pilots of water vessels Cardiovascular technologists and technicians Carpenters Carpet installers Cashiers Cement masons and concrete finishers Chefs and head cooks Chemists Child care workers Civil engineers Claims adjusters, examiners and investigators Clergy Clinical, counseling and school psychologists Coaches and scouts Commercial pilots Communications equipment operators Community and social services occupations Computer programmers Computer specialists Computer support specialists Computer systems analysts Construction and extraction occupations Construction trades workers Cooks and food preparation workers Correctional officers and jailers Counselors, social workers and other community-social service specialists Couriers and messengers Court, municipal and license clerks Crane and tower operators
Estimated emp., 2015
Average Average Avg. ann. Avg. ann. annual annual openings openings Avg. ann. Avg. ann. Estimated growth growth due to due to total total emp., rate, rate, growth, growth, openings, openings, 2020 2010-2015 2015-2020 2010-2015 2015-2020 2010-2015 2015-2020
STATISTICAL SNAPSHOT
48 THE HERALD BUSINESS JOURNAL
MARKET FACTS 2013
Estimated employment, 2010 Credit analysts Customer service representatives Data entry keyers Dental assistants Dental hygienists Dentists, general Detectives and criminal investigators Dietitians and nutritionists Door-to-door sales workers, news-street vendors and related workers Drafters, engineering and mapping technicians Drywall and ceiling tile installers Editors Education administrators, elementary and secondary school Education, training and library occupations Electrical and electronic equipment mechanics, installers and repairers Electrical engineers Electricians Elementary school teachers, exc. special education Emergency medical technicians and paramedics Engineers Entertainers and performers, sports and related workers Entertainment attendants and related workers Environmental engineers Executive secretaries and administrative assistants Family and general practitioners Farming, fishing and forestry occupations Financial clerks Financial specialists Fine artists, including painters, sculptors and illustrators Fire fighters Fire fighting and prevention workers Fishers and related fishing workers Fitness trainers and aerobics instructors Food and beverage serving workers Food preparation and serving related occupations Forensic science technicians Forest, conservation and logging workers Funeral service workers Gaming dealers General and operations managers Glaziers Graphic designers Grinding and polishing workers, hand Grounds maintenance workers Hairdressers, hairstylists and cosmetologists Health diagnosing and treating practitioners Health technologists and technicians Health-care practitioners and technical occupations Health-care support occupations Heating, air conditioning and refrigeration mechanics and installers Helpers-construction trades Helpers-installation, maintenance and repair workers Helpers-pipelayers, plumbers, pipefitters and steamfitters Helpers-production workers Highway maintenance workers Home health aides Hosts and hostesses-restaurant, lounge and coffee shop Human resources managers Industrial engineers Industrial truck and tractor operators Information and record clerks Inspectors, testers, sorters, samplers and weighers Installation, maintenance and repair occupations Insulation workers, floor, ceiling and wall Insurance claims and policy processing clerks Insurance sales agents Interior designers Internists, general Interpreters and translators Janitors and cleaners, exc. maids and housekeeping cleaners Judges, magistrate judges and magistrates Kindergarten teachers, exc. special education
115 2,983 253 798 555 203 78 60 816 4,087 474 204 359 13,434 1,377 1,313 1,217 2,502 462 10,674 1,021 1,347 137 1,147 158 1,340 5,483 4,050 31 1,097 1,112 159 683 12,535 21,076 10 172 23 698 2,172 283 294 93 2,812 1,793 6,526 4,250 10,981 6,166 302 297 168 106 445 258 726 453 203 1,713 575 7,712 2,297 11,018 193 643 557 70 48 143 3,788 104 238
Estimated emp., 2015 126 3,246 268 863 596 220 78 66 811 4,661 492 207 382 14,271 1,587 1,519 1,368 2,654 502 12,232 1,062 1,469 146 1,238 191 1,393 6,025 4,428 35 1,091 1,105 188 732 13,795 23,140 10 176 23 775 2,329 321 299 104 3,236 1,937 7,347 4,737 12,310 6,915 349 331 181 118 478 257 837 498 219 2,052 583 8,328 2,644 11,999 206 654 562 73 54 163 4,285 105 253
Average Average Avg. ann. Avg. ann. annual annual openings openings Avg. ann. Avg. ann. Estimated growth growth due to due to total total emp., rate, rate, growth, growth, openings, openings, 2020 2010-2015 2015-2020 2010-2015 2015-2020 2010-2015 2015-2020 134 3,476 277 951 657 245 82 73 838 4,690 536 209 404 15,073 1,650 1,566 1,422 2,798 559 12,438 1,091 1,562 158 1,311 223 1,373 6,428 4,740 35 1,169 1,185 184 753 14,896 24,962 11 158 23 833 2,469 347 318 104 3,749 2,060 8,145 5,235 13,622 7,641 377 355 190 124 504 276 941 538 235 2,133 610 8,927 2,636 12,443 229 659 573 78 59 186 4,832 113 267
1.8% 1.7% 1.2% 1.6% 1.4% 1.6% 0.0% 1.9% -0.1% 2.7% 0.7% 0.3% 1.2% 1.2% 2.9% 3.0% 2.4% 1.2% 1.7% 2.8% 0.8% 1.7% 1.3% 1.5% 3.9% 0.8% 1.9% 1.8% 2.5% -0.1% -0.1% 3.4% 1.4% 1.9% 1.9% 0.0% 0.5% 0.0% 2.1% 1.4% 2.6% 0.3% 2.3% 2.8% 1.6% 2.4% 2.2% 2.3% 2.3% 2.9% 2.2% 1.5% 2.2% 1.4% -0.1% 2.9% 1.9% 1.5% 3.7% 0.3% 1.5% 2.9% 1.7% 1.3% 0.3% 0.2% 0.8% 2.4% 2.7% 2.5% 0.2% 1.2%
1.2% 1.4% 0.7% 2.0% 2.0% 2.2% 1.0% 2.0% 0.7% 0.1% 1.7% 0.2% 1.1% 1.1% 0.8% 0.6% 0.8% 1.1% 2.2% 0.3% 0.5% 1.2% 1.6% 1.2% 3.1% -0.3% 1.3% 1.4% 0.0% 1.4% 1.4% -0.4% 0.6% 1.5% 1.5% 1.9% -2.1% 0.0% 1.5% 1.2% 1.6% 1.2% 0.0% 3.0% 1.2% 2.1% 2.0% 2.0% 2.0% 1.6% 1.4% 1.0% 1.0% 1.1% 1.4% 2.4% 1.6% 1.4% 0.8% 0.9% 1.4% -0.1% 0.7% 2.1% 0.2% 0.4% 1.3% 1.8% 2.7% 2.4% 1.5% 1.1%
2 53 3 13 8 3 0 1 -1 115 4 1 5 162 42 41 30 30 8 314 7 24 2 18 7 12 106 76 1 -1 -1 6 10 251 412 0 2 0 15 32 8 1 2 85 29 161 96 261 148 9 5 3 2 7 0 22 9 3 68 2 123 70 197 2 2 1 0 1 4 99 0 3
1 46 2 18 12 5 1 1 5 3 9 0 4 156 12 9 11 29 11 40 5 18 2 15 6 -5 79 62 0 15 15 -1 4 220 363 0 -4 0 12 28 5 4 0 103 25 157 98 258 146 5 5 2 1 5 4 21 8 3 16 5 117 -2 86 5 1 2 1 1 5 109 2 3
5 137 8 28 18 10 1 3 16 196 16 7 15 451 71 72 63 83 16 556 36 111 5 34 10 52 215 162 2 27 27 11 21 918 1,415 0 5 0 54 67 18 10 5 135 62 281 175 467 236 14 16 12 6 16 6 31 57 8 106 17 350 122 444 10 21 14 3 2 8 168 2 9
4 144 6 39 26 12 3 4 25 99 24 6 16 493 48 49 50 92 23 349 32 73 6 32 11 33 197 166 1 49 50 4 16 684 1,062 1 1 0 38 79 18 13 3 165 64 326 209 547 267 13 13 9 4 12 12 33 27 9 64 23 362 56 389 14 22 15 3 2 9 201 4 10
STATISTICAL SNAPSHOT 4,054 3,008 149 1,988 877 1,441 547 703 2,621 583 88 2,228 985 3,162 1,898 13,587 422 891 548 7,401 434 683 129 1,277 1,031 1,202 194 364 1,562 161 264 206 4,432 808 115 215 195 846 368 22 2,896 78 34,526 669 3,310 135 28 26 1,453 2,087 270 68 2,655 2,679 13,232 39 515 344 495 532 342 119 123 1,254 11 897 209 90 514 237 773 66 536 6,560 177
4,293 3,481 158 2,124 938 1,546 584 757 2,967 620 94 2,194 1,110 3,473 1,986 14,465 453 1,022 601 7,781 485 684 132 1,263 1,046 1,252 220 402 1,763 188 284 218 4,710 851 116 232 194 927 377 24 3,193 85 36,784 738 3,518 162 31 29 1,491 2,264 296 74 3,043 2,865 14,275 47 547 378 550 614 397 147 133 1,300 13 962 225 91 519 239 817 61 558 6,908 189
2.9% 2.8% 1.4% -0.1% 1.1% 1.1% 0.4% 1.9% 2.2% 1.1% 3.0% 2.9% 5.0% 1.9% 1.2% 1.7% 1.6% 3.2% 2.1% 2.1% 5.6% 2.8% 0.6% 3.0% 2.8% 1.4% 2.4% 2.5% 2.8% 2.5% 1.8% 1.7% 3.7% 1.2% 1.8% 2.3% 0.0% 2.3% -0.3% 3.0% 2.3% 3.1% 1.6% 2.0% 2.0% 4.2% 1.5% 1.6% 0.9% 1.0% 2.0% 3.6% 2.8% 1.6% 1.6% 2.8% 1.6% 2.2% 1.9% 3.4% 4.8% 3.3% 1.9% 2.0% 1.9% -0.2% -0.1% -0.9% -0.9% -0.9% 1.3% -9.4% 1.2% 1.2% -0.1%
1.2% 3.0% 1.2% 1.3% 1.4% 1.4% 1.3% 1.5% 2.5% 1.2% 1.3% -0.3% 2.4% 1.9% 0.9% 1.3% 1.4% 2.8% 1.9% 1.0% 2.2% 0.0% 0.5% -0.2% 0.3% 0.8% 2.5% 2.0% 2.5% 3.1% 1.5% 1.1% 1.2% 1.0% 0.2% 1.5% -0.1% 1.8% 0.5% 1.8% 2.0% 1.7% 1.3% 2.0% 1.2% 3.7% 2.1% 2.2% 0.5% 1.6% 1.9% 1.7% 2.8% 1.4% 1.5% 3.8% 1.2% 1.9% 2.1% 2.9% 3.0% 4.3% 1.6% 0.7% 3.4% 1.4% 1.5% 0.2% 0.2% 0.2% 1.1% -1.6% 0.8% 1.0% 1.3%
108 78 2 -2 9 15 2 13 52 6 2 59 43 56 22 221 7 26 11 144 21 17 1 35 27 16 4 8 40 4 4 3 146 9 2 5 0 18 -1 0 62 2 528 13 61 5 0 0 13 20 5 2 68 42 204 1 8 7 8 16 14 4 2 24 0 -1 0 -1 -5 -2 5 -8 6 75 0
48 95 2 27 12 20 7 11 66 7 1 -7 25 62 18 175 6 26 11 76 10 0 1 -3 3 10 5 8 40 5 4 2 54 9 0 3 0 16 2 0 60 2 449 14 42 5 1 1 8 35 5 1 78 37 209 2 6 7 11 16 11 6 2 9 0 13 3 0 1 0 5 -1 4 71 2
229 125 4 39 24 39 20 30 114 20 5 95 58 101 52 470 13 47 18 355 30 34 4 57 56 47 8 14 60 6 10 9 216 25 4 9 5 30 7 1 94 4 1,247 26 119 9 1 1 53 62 8 3 84 86 511 3 19 10 22 21 19 7 5 57 1 23 3 1 12 0 19 0 19 224 3
178 153 5 77 30 49 26 31 138 24 4 40 44 123 57 505 15 52 21 300 23 32 4 23 37 43 10 16 62 8 10 9 138 28 3 9 5 33 10 1 102 3 1,235 31 123 11 1 1 50 85 10 3 104 91 511 4 21 11 27 24 19 10 6 47 0 41 8 2 19 2 21 0 19 242 6
Data continues on Page 50
THE HERALD BUSINESS JOURNAL 49
3,514 2,617 139 1,999 831 1,361 535 640 2,346 552 76 1,930 770 2,881 1,789 12,479 389 762 493 6,681 331 595 125 1,099 896 1,123 172 322 1,359 142 242 189 3,702 762 105 192 195 756 374 19 2,583 67 31,864 606 3,004 110 26 24 1,388 1,988 245 57 2,313 2,469 12,218 34 476 309 451 450 271 101 112 1,134 10 904 210 94 538 248 726 108 504 6,180 178
MARKET FACTS 2013
Laborers and freight, stock and material movers, hand Landscaping and groundskeeping workers Laundry and dry-cleaning workers Law enforcement workers Lawyers Legal occupations Librarians, curators and archivists Licensed practical and licensed vocational nurses Life, physical and social science occupations Loan officers Locomotive engineers Logisticians Machinists Maids and housekeeping cleaners Maintenance and repair workers, general Management occupations Manicurists and pedicurists Market research analysts and marketing specialists Massage therapists Material moving workers Materials engineers Mathematical scientists Meat, poultry and fish cutters and trimmers Mechanical drafters Mechanical engineers Media and communication workers Medical and clinical laboratory technicians Medical records and health information technicians Medical secretaries Medical transcriptionists Mental health counselors Merchandise displayers and window trimmers Metal workers and plastic workers Middle school teachers, exc. special and vocational education Millwrights Multi-media artists and animators Musicians and singers Network and computer systems architects and administrators Nonfarm animal caretakers Nuclear medicine technologists Nursing, psychiatric and home health aides Obstetricians and gynecologists Office and administrative support occupations Operating engineers and other construction equipment operators Operations specialties managers Optometrists Oral and maxillofacial surgeons Orthodontists Packers and packagers, hand Painters, construction and maintenance Paralegals and legal assistants Pediatricians, general Personal and home care aides Personal appearance workers Personal care and service occupations Pest control workers Pharmacists Photographers Physical scientists Physical therapists Physician assistants Physicists Pipelayers Plumbers, pipefitters and steamfitters Podiatrists Police and sheriff’s patrol officers Police, fire and ambulance dispatchers Postal service clerks Postal service mail carriers Postal service mail sorters, processors and processing machine operators Postsecondary teachers Prepress technicians and workers Preschool teachers, exc. special education Primary, secondary and special education school teachers Probation officers and correctional treatment specialists
50 THE HERALD BUSINESS JOURNAL
MARKET FACTS 2013
STATISTICAL SNAPSHOT Estimated employment, 2010
Estimated emp., 2015
Production occupations 23,846 Psychiatrists 23 Public address system and other announcers 47 Public relations specialists 328 Purchasing agents, exc. wholesale, retail and farm products 1,680 Radiologic technologists and technicians 257 Rail transportation workers 216 Real estate sales agents 570 Receptionists and information clerks 1,708 Refuse and recyclable material collectors 171 Registered nurses 3,058 Rehabilitation counselors 995 Reporters and correspondents 66 Retail sales workers 18,334 Riggers 112 Roofers 799 Sailors and marine oilers 15 Sales and related occupations 29,427 Sawing machine setters, operators and tenders-wood 117 Secondary school teachers, exc. special and vocational education 1,380 Secretaries and administrative assistants 5,201 Securities, commodities and financial services sales agents 263 Security guards 997 Septic tank servicers and sewer pipe cleaners 45 Service station attendants 161 Sheet metal workers 218 Ship engineers 11 Shipping, receiving and traffic clerks 1,071 Skin care specialists 158 Slaughterers and meat packers 58 Social scientists and related workers 829 Software developers, applications 1,435 Software developers, systems software 1,048 Special education teachers-middle school 86 Special education teachers-preschool, kindergarten and elementary school 301 Special education teachers-secondary school 169 Speech-language pathologists 207 2,630 Stock clerks and order fillers Stonemasons 76 Surgeons 98 Surveyors 42 Tailors, dressmakers and custom sewers 43 Tax preparers 124 Taxi drivers and chauffeurs 267 Teacher assistants 2,674 Telecommunications line installers and repairers 605 Telemarketers 264 Tellers 944 Textile, apparel and furnishings workers 519 Tile and marble setters 94 Tire repairers and changers 341 Tool and die makers 450 Top executives 2,529 Tour and travel guides 52 Transportation and material moving occupations 13,474 Travel agents 57 Tree trimmers and pruners 162 Truck drivers, heavy and tractor-trailer 1,853 Truck drivers, light or delivery services 1,355 Umpires, referees and other sports officials 14 Upholsterers 69 Vehicle and mobile equipment mechanics, installers 4,333 Veterinarians 130 Vocational education teachers, secondary school 238 Waiters and waitresses 3,755 Water and liquid waste treatment plant and system operators 146 Welders, cutters, solderers and brazers 585 Woodworkers 995 Writers and authors 165 Zoologists and wildlife biologists 99
27,368 25 50 352 1,921 290 246 635 1,905 181 3,364 1,063 63 19,572 136 942 17 31,456 131 1,464 5,708 291 1,222 51 169 256 13 1,160 170 57 888 1,632 1,213 92 321 179 227 2,847 82 114 47 47 143 284 2,842 709 296 1,061 547 112 357 519 2,713 52 14,685 55 187 2,024 1,469 15 73 4,637 144 253 4,137 151 702 1,096 178 107
Average Average Avg. ann. Avg. ann. annual annual openings openings Avg. ann. Avg. ann. Estimated growth growth due to due to total total emp., rate, rate, growth, growth, openings, openings, 2020 2010-2015 2015-2020 2010-2015 2015-2020 2010-2015 2015-2020 28,648 26 53 365 1,941 321 258 654 2,067 206 3,677 1,187 60 20,318 147 1,023 18 32,835 139 1,543 6,161 303 1,345 55 174 273 14 1,208 180 57 985 1,779 1,256 96 340 189 250 3,010 90 126 51 50 163 305 3,001 749 345 1,082 568 129 360 511 2,881 54 15,437 53 221 2,125 1,534 15 72 4,678 160 266 4,478 163 760 1,161 180 121
2.8% 1.7% 1.2% 1.4% 2.7% 2.4% 2.6% 2.2% 2.2% 1.1% 1.9% 1.3% -0.9% 1.3% 4.0% 3.3% 2.5% 1.3% 2.3% 1.2% 1.9% 2.0% 4.2% 2.5% 1.0% 3.3% 3.4% 1.6% 1.5% -0.3% 1.4% 2.6% 3.0% 1.4% 1.3% 1.2% 1.9% 1.6% 1.5% 3.1% 2.3% 1.8% 2.9% 1.2% 1.2% 3.2% 2.3% 2.4% 1.1% 3.6% 0.9% 2.9% 1.4% 0.0% 1.7% -0.7% 2.9% 1.8% 1.6% 1.4% 1.1% 1.4% 2.1% 1.2% 2.0% 0.7% 3.7% 2.0% 1.5% 1.6%
Source: Washington State Employment Security Department, Labor Market and Economic Analysis Branch. May 2012
0.9% 0.8% 1.2% 0.7% 0.2% 2.1% 1.0% 0.6% 1.6% 2.6% 1.8% 2.2% -1.0% 0.8% 1.6% 1.7% 1.1% 0.9% 1.2% 1.1% 1.5% 0.8% 1.9% 1.5% 0.6% 1.3% 1.5% 0.8% 1.1% 0.0% 2.1% 1.7% 0.7% 0.9% 1.2% 1.1% 1.9% 1.1% 1.9% 2.0% 1.6% 1.2% 2.7% 1.4% 1.1% 1.1% 3.1% 0.4% 0.8% 2.9% 0.2% -0.3% 1.2% 0.8% 1.0% -0.7% 3.4% 1.0% 0.9% 0.0% -0.3% 0.2% 2.1% 1.0% 1.6% 1.5% 1.6% 1.2% 0.2% 2.5%
706 0 0 5 48 7 6 13 39 2 61 14 -1 248 5 29 0 408 3 17 100 6 45 1 2 8 0 18 2 0 11 39 33 1 4 2 4 43 1 3 1 1 4 3 34 21 7 23 6 4 3 14 37 0 243 0 5 34 23 0 1 61 3 3 76 1 23 20 3 2
253 0 1 3 4 6 2 4 32 5 63 25 -1 148 2 16 0 274 1 16 91 2 25 1 1 3 0 10 2 0 19 29 9 1 4 2 4 33 2 2 1 1 4 4 32 8 10 4 4 3 1 -1 34 0 147 0 7 20 13 0 0 8 3 3 68 2 11 13 0 3
1,256 1 2 14 93 10 13 26 96 7 109 34 2 1,002 7 45 1 1,427 5 55 173 13 61 2 8 11 1 46 5 1 35 52 42 4 13 7 8 113 3 5 2 1 7 6 91 31 13 68 12 6 12 16 81 2 594 0 8 70 49 1 3 173 5 9 284 5 40 41 7 4
809 1 2 13 59 12 9 19 89 11 136 50 2 724 5 37 1 1,159 5 57 170 11 46 2 6 8 1 40 5 2 44 51 24 4 14 8 10 103 3 5 2 1 7 8 101 23 16 44 11 6 10 1 95 2 542 0 10 64 45 0 2 138 6 10 268 7 31 39 5 5
What An SBA Preferred Lender Can Do For You. As an SBA Preferred Lender, we can initiate, process and approve your loan internally. And about 95% of the time, that’s exactly what we do. That means less red tape and a lot less waiting for answers. In fact, most of our SBA loans take only a couple of weeks from application to being approved. But quick approval isn’t the only thing appealing about our SBA loans. They also offer very competitive interest rates, longer terms that
can lower your monthly payments, and no prepayment penalties. If anything does arise during the loan process, the experienced staff in our SBA Loan Department can easily handle it for you. Why not see if an SBA loan is a good fit for your business? Call or stop by and talk with any of our commercial lenders. It just might be the most straightforward meeting you’ve had in quite a long time.
For more information, just call us at (360) 757-0170, or visit www.wibank.com