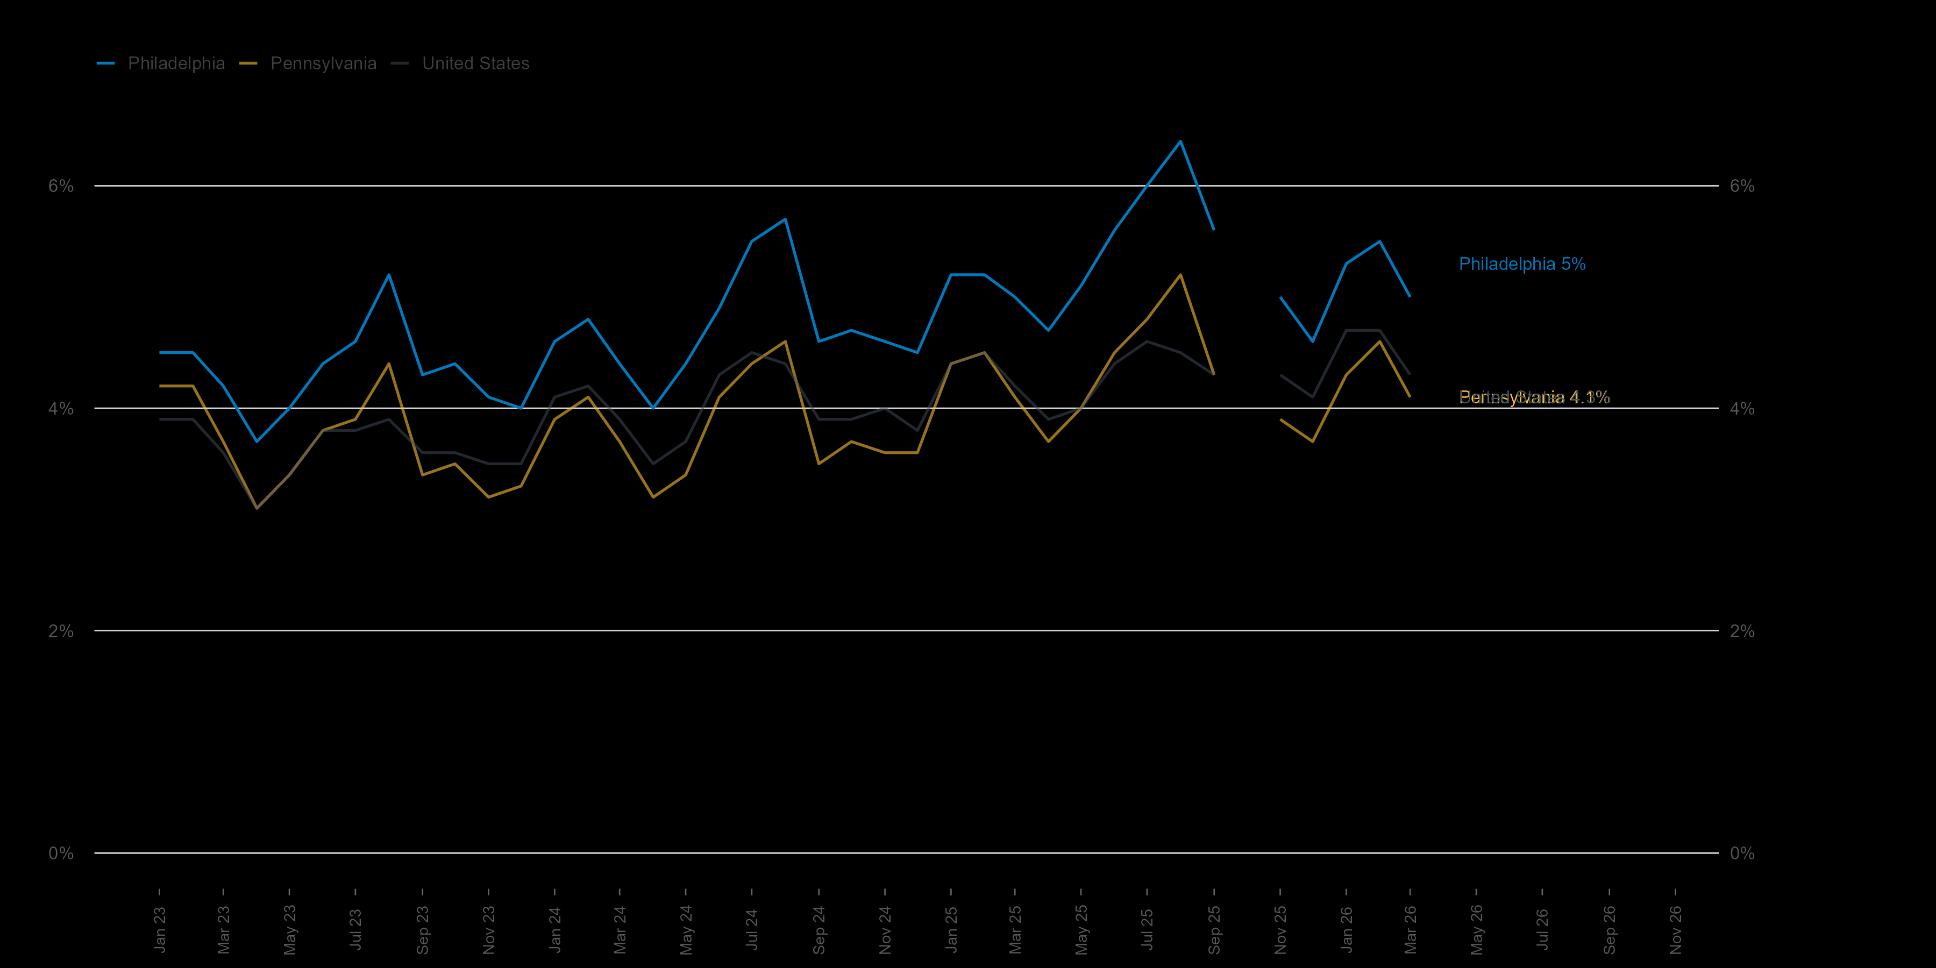
Philadelphia's unemployment trend is structural, not cyclical. At 5.0% in March 2026, the city's rate sits 0.7 percentage points above the national rate and 0.9 points above Pennsylvania's.
Philadelphia's unemployment has never once dipped below Pennsylvania's or the national average in recent records. The gap is narrowest when the national labor market weakens, which pulls the US rate up toward Philadelphia's, and widest when it strengthens. With national unemployment holding near 4.3% in a lowhire, low-fire market, the city’s unemployment rate reflects long-standing gaps in education, skills, and neighborhood opportunity rather than the business
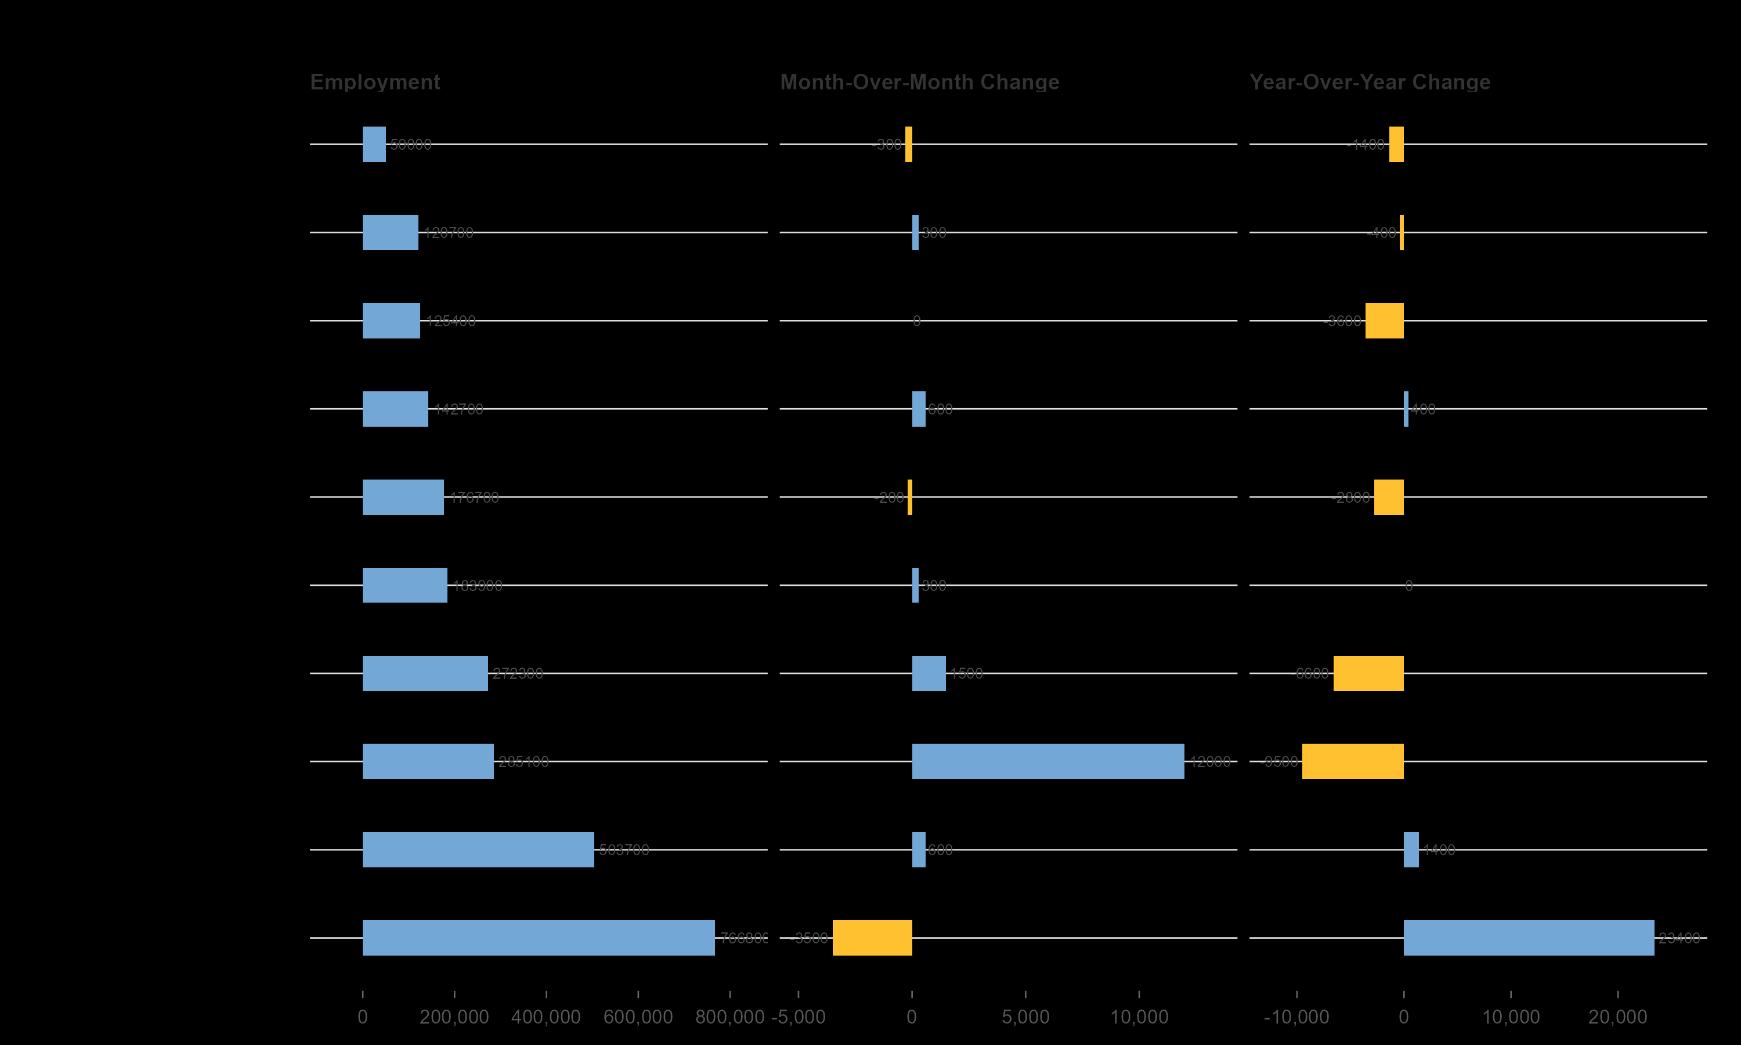
The monthly gain came almost entirely from one sector. Leisure and Hospitality added 12,000 jobs over the month, accounting for nearly the entire 12,100 net increase, while Education and Health Services lost 3,500, Retail added 1,500, and every other major sector moved by 600 or fewer.
Year over year, Education and Health Services stands alone as the engine, adding 23,400 jobs. The only other gains were small, in Professional and Business Services (+1,400) and Transportation and Utilities (+400), while the goods and discretionary sectors fell: Leisure and Hospitality lost 9,500, Retail 6,600, Mining, Logging, and Construction 3,600, and Manufacturing 2,800.
The Philadelphia MSA, officially the Philadelphia-CamdenWilmington, PA-NJ-DE-MD Metropolitan Statistical Area, is a large metropolitan region in the Northeastern US centered on Philadelphia. It encompasses counties in Pennsylvania (Bucks, Chester, Delaware, Montgomery, and Philadelphia), New Jersey (Burlington, Camden, Gloucester, and Salem), Delaware (New Castle), and Maryland (Cecil).
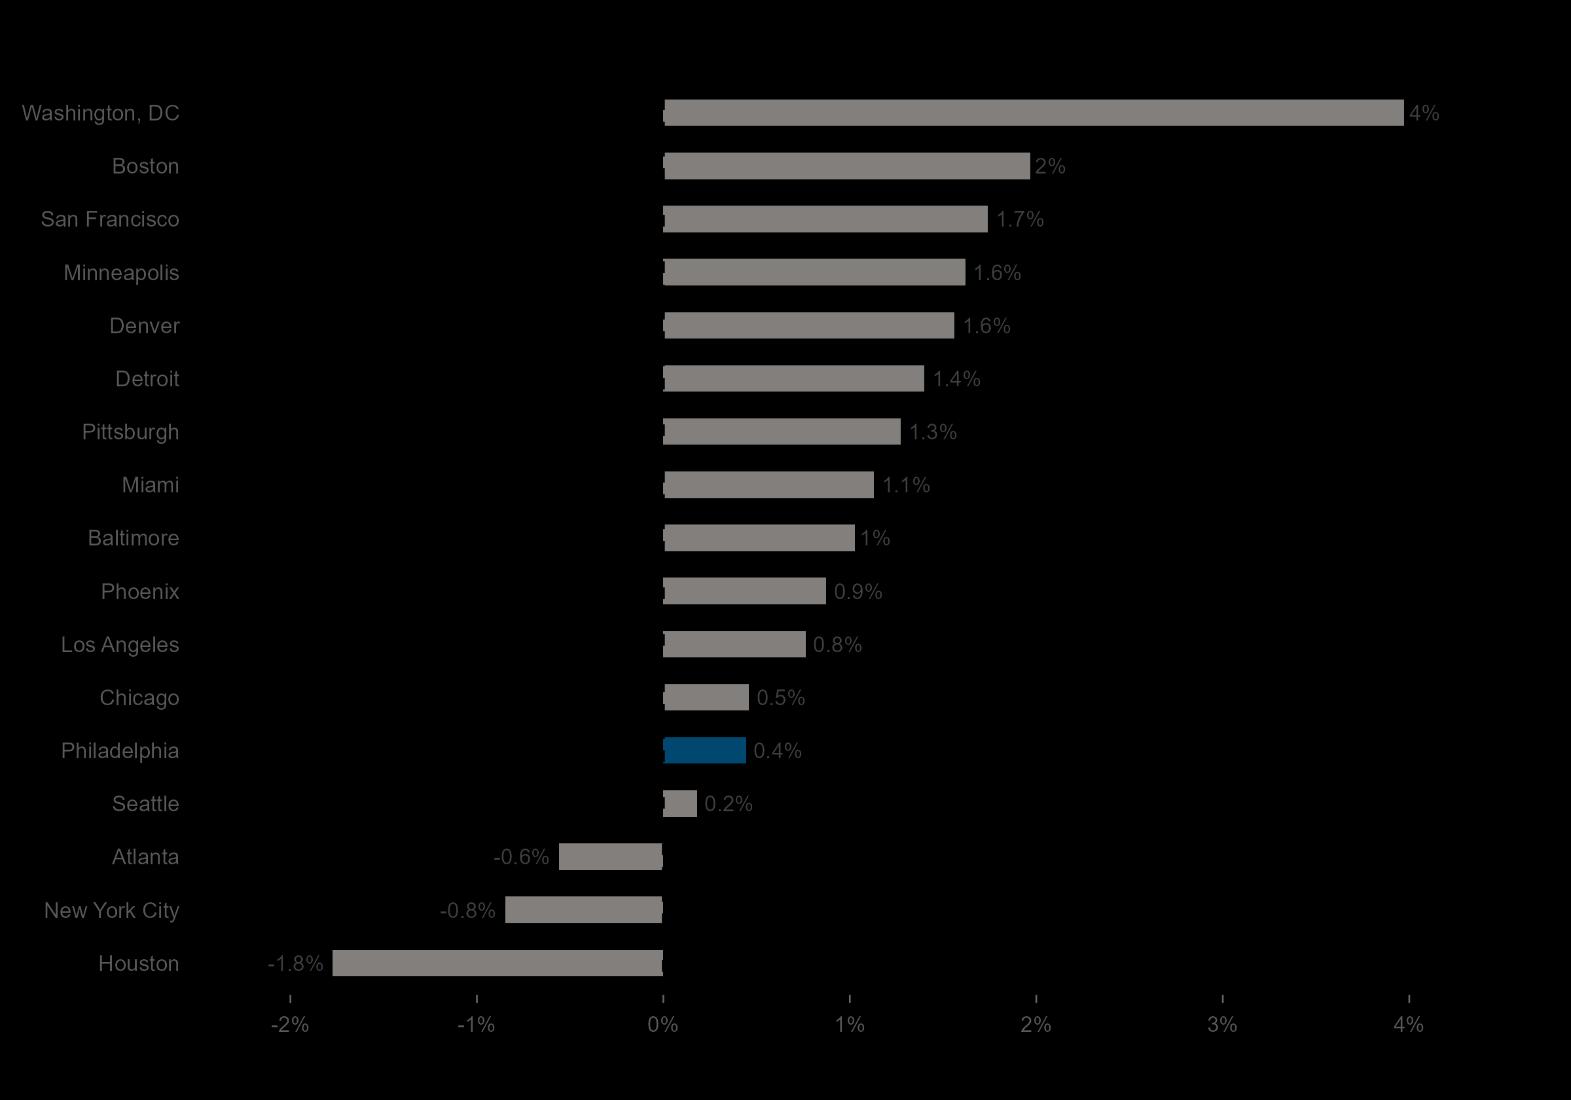
In 2026 Q1, fourteen of seventeen peer metros posted positive employment growth, a far broader recovery than the same comparison showed a year ago. Washington, DC led the field at +3.97%, followed by Boston (+1.97%) and San Francisco (+1.74%). Philadelphia grew just 0.44%, ranking 13th of 17, ahead of only Seattle, Atlanta, New York, and Houston.
The city is still adding jobs, but as peer regions accelerated out of the 2025 slowdown, Philadelphia's slow-and-steady pace slipped from the middle of the pack toward the back. Modest growth was a relative strength when most metros were flat.
Total Unemployment Claims in 2026 Q1:
13,778
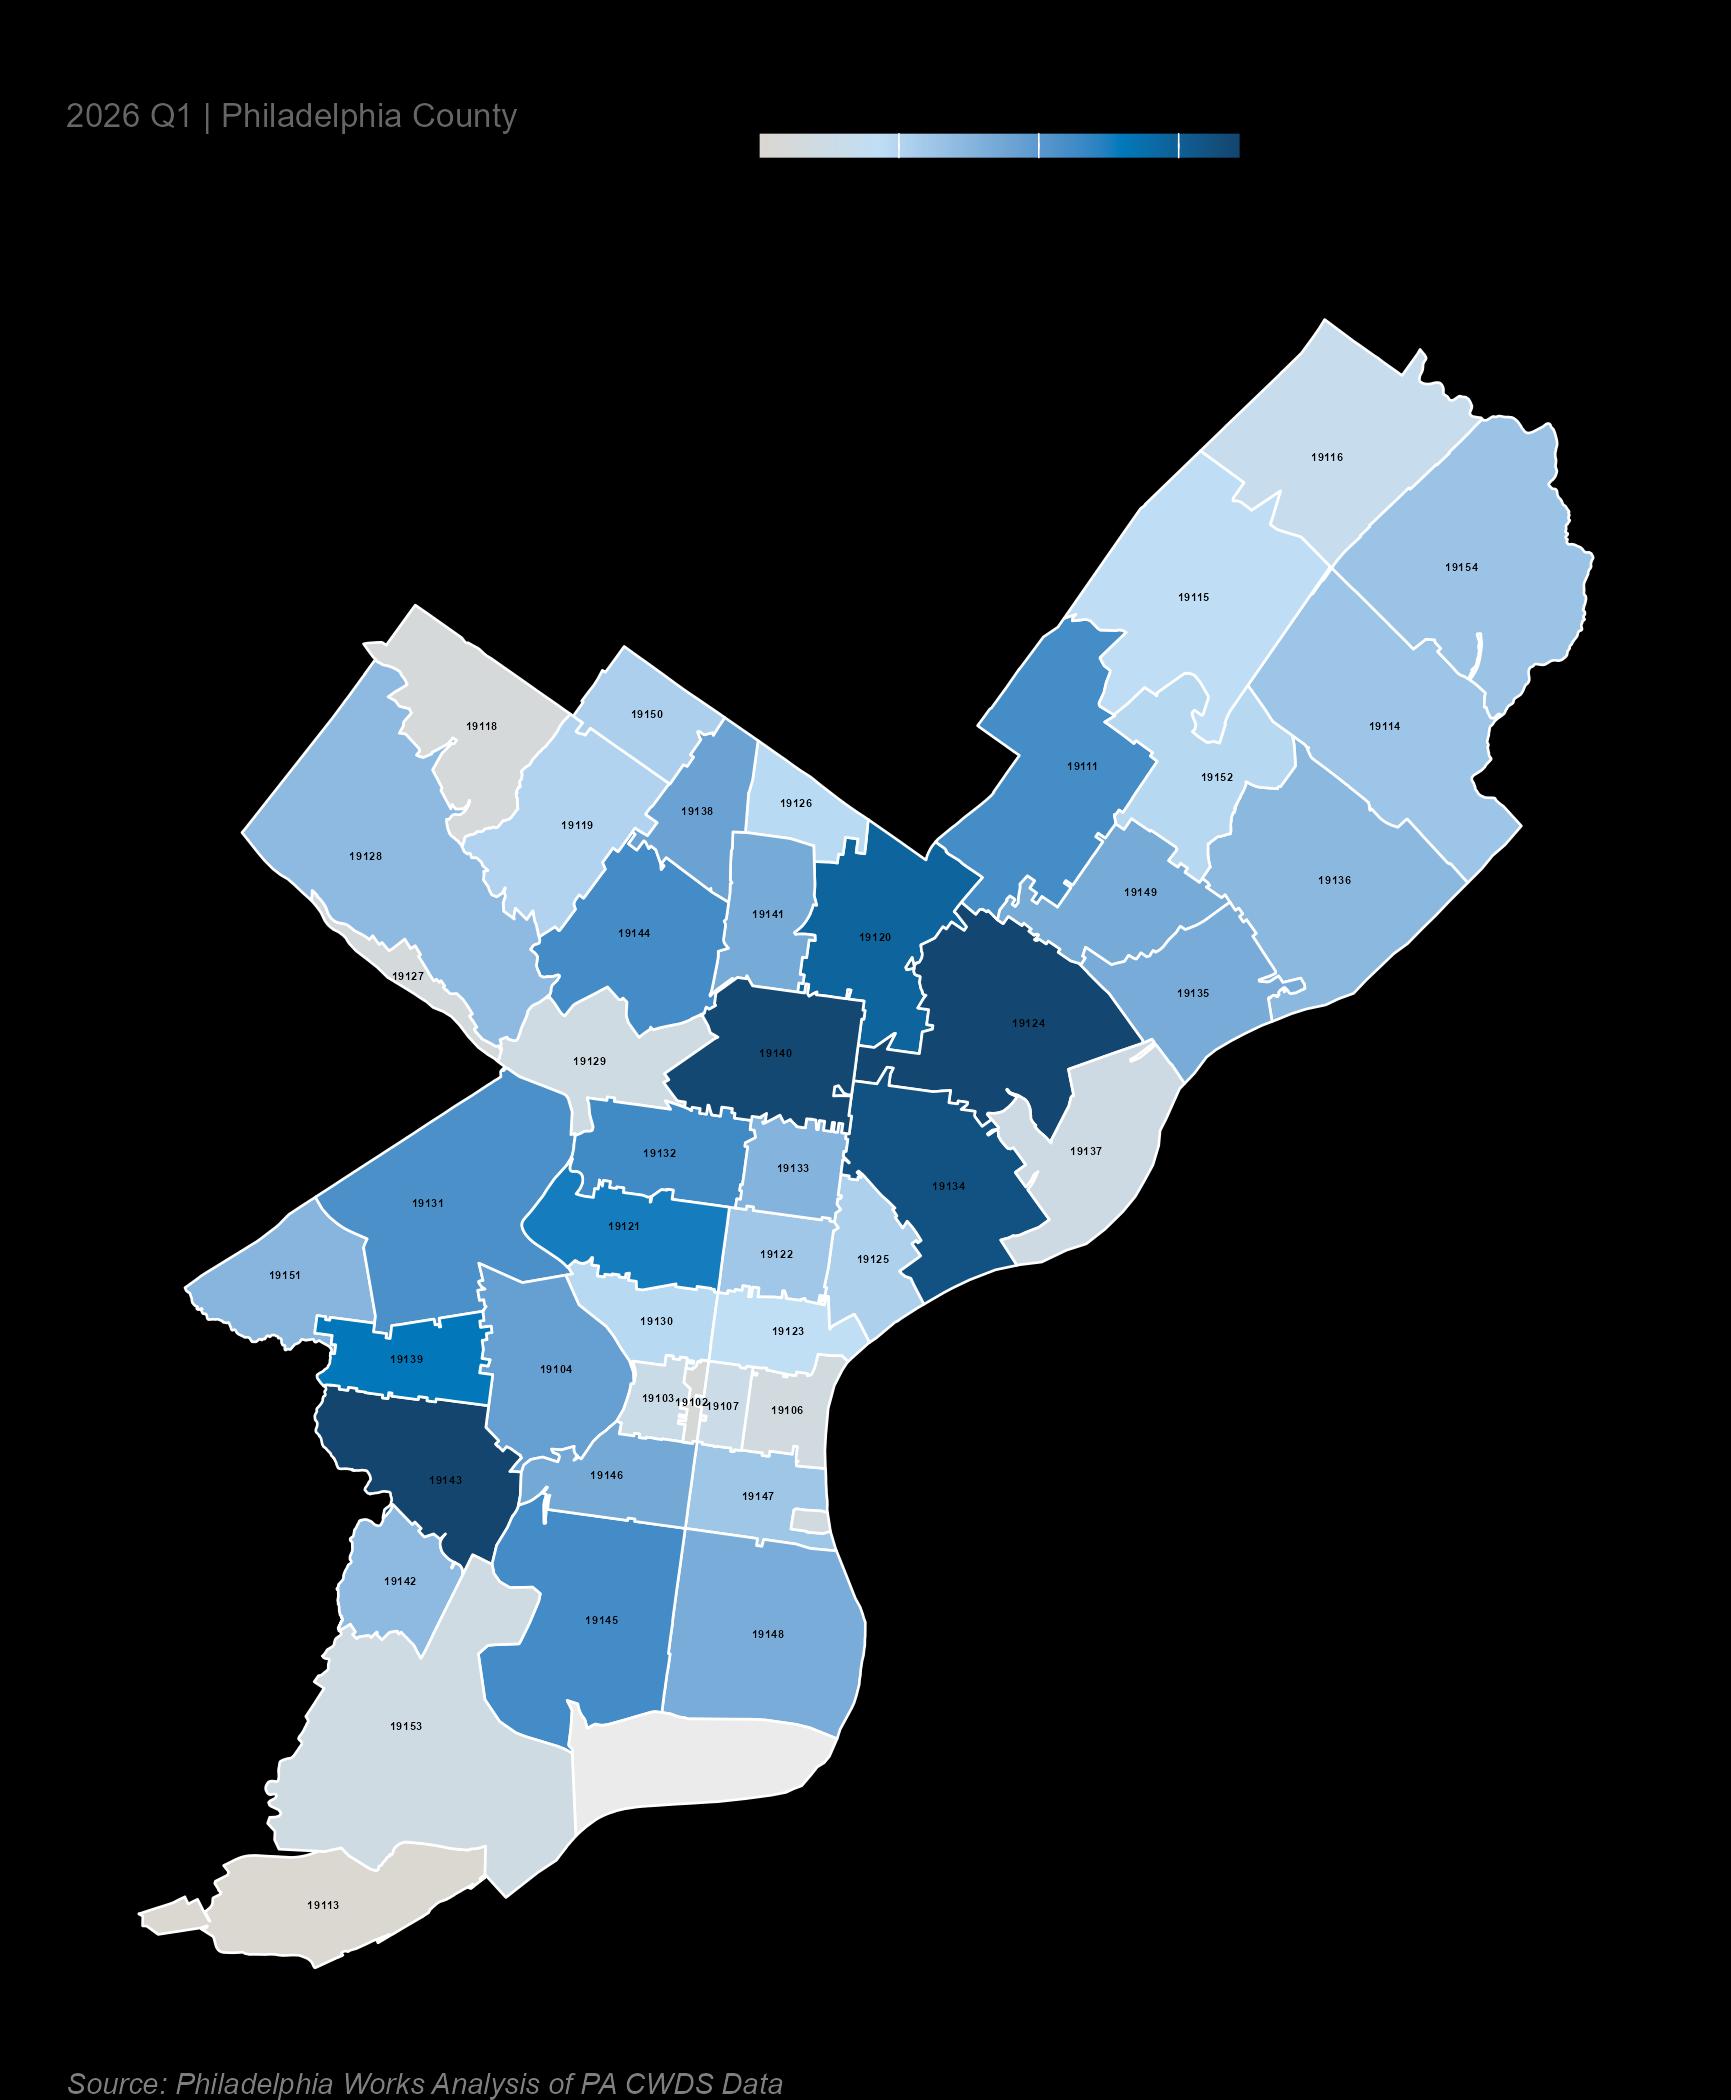
Philadelphia's unemployment claims are a neighborhood phenomenon, not a citywide one. They mostly concentrate in Southwest Philadelphia (19143, the quarter's hottest spot at 686 claims), the Lower Northeast and Frankford corridor (19124, 682 claims), and North Philadelphia (19140, 676 claims), extending across West and North Philadelphia. These are the same neighborhoods that post the highest unemployment rates on the census-tract map, where unemployment is concentrated rather than dispersed.
Unemployment Claims
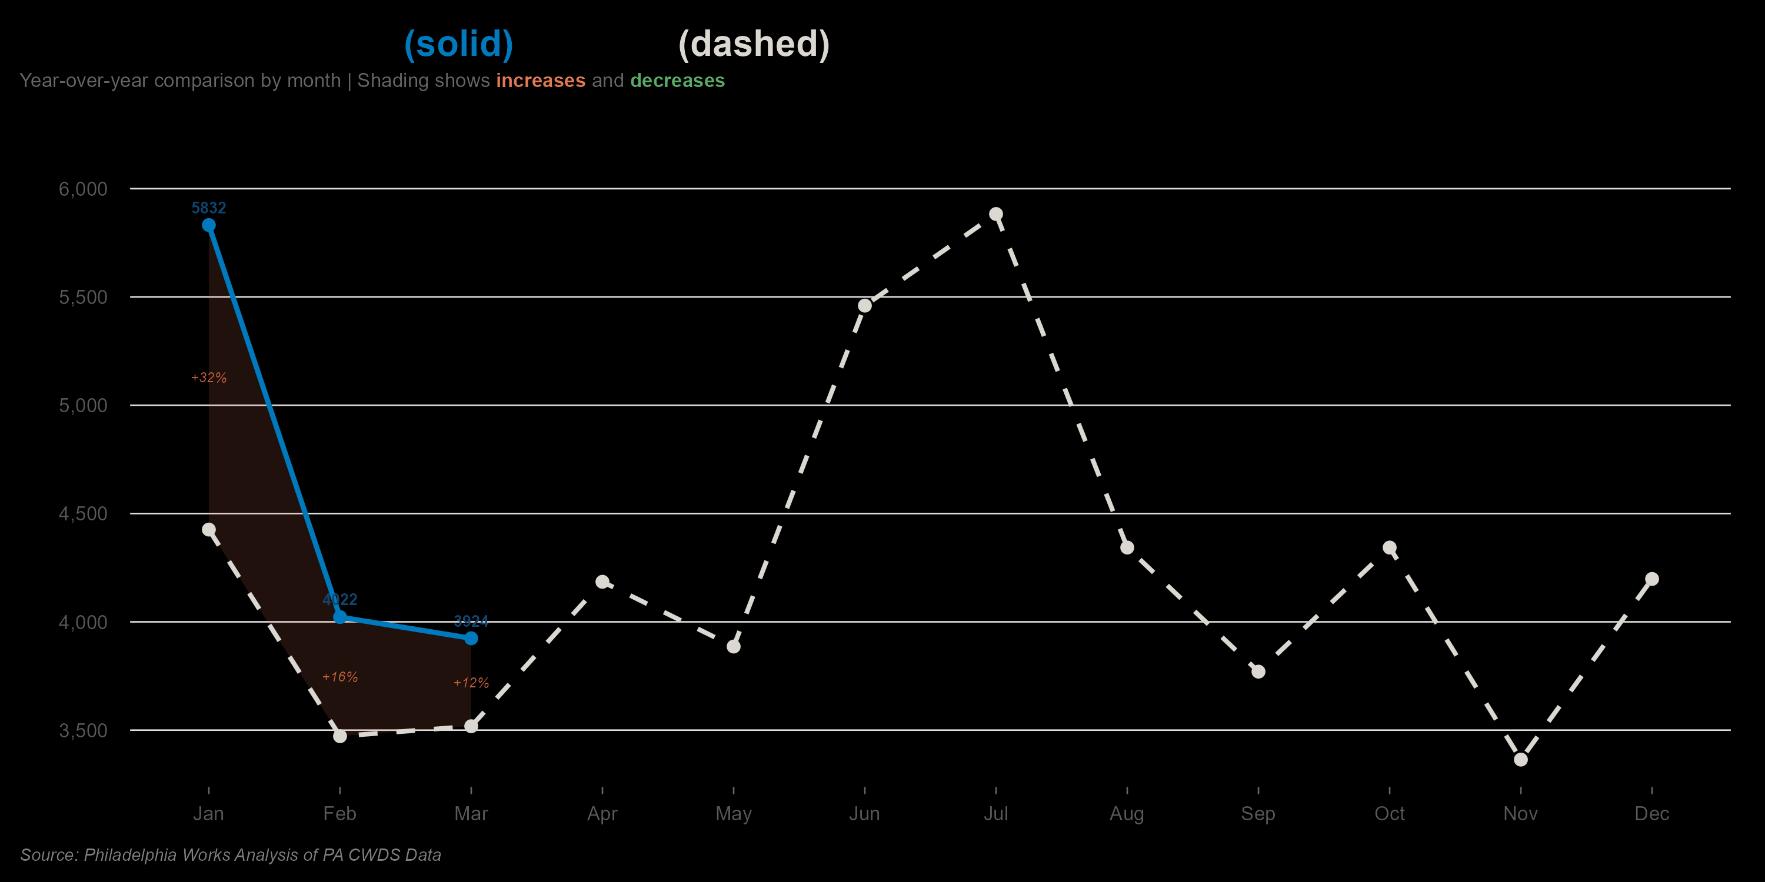
Philadelphia's unemployment rate rose only modestly over the past year, but the flow of new claimants rose sharply. The Pennsylvania Commonwealth Workforce Development System recorded 13,778 unique new claimants in the first quarter of 2026, a 19.7% increase over the same months of 2025, a steeper rise than the unemployment rate alone would suggest.
LAUS data is a snapshot of labor-force status in a reference week, while UC claims measure the flow of newly separated workers into the benefits system. When the flow accelerates faster than the stock changes, churn is building beneath a headline rate that looks stable. The gap between a steady rate and a rising claim count, is the quarter's most important signal.
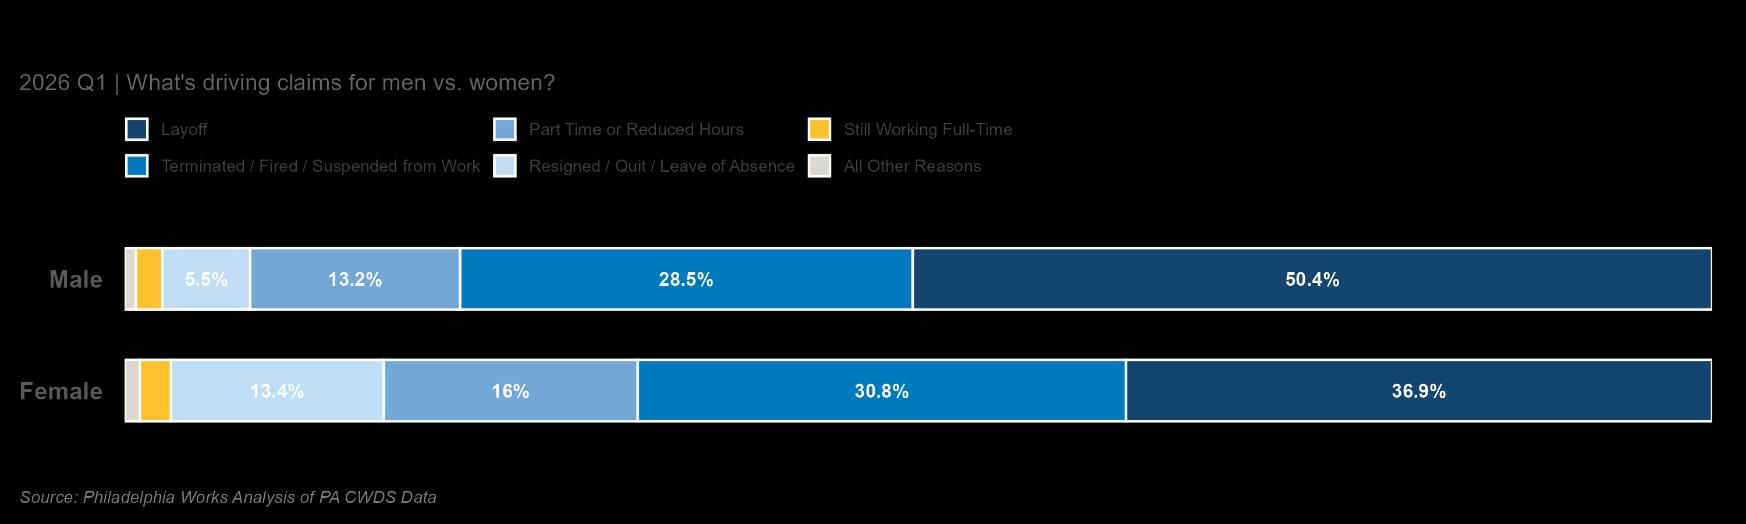
The breakdown of leaving reasons is unambiguous. Layoffs accounted for 44.0% of first-quarter claims, and terminations, firings, or suspensions added another 29.6%. Together, employer-initiated separations make up roughly three-quarters of all new claims. Part-time or reduced hours accounted for 14.5%, while voluntary resignations were a small minority. This is not a story of workers quitting for something better. It is a story of workers being let go.
When separation reasons are broken out by gender, a clear pattern emerges. Men are disproportionately represented in layoffs and in construction-related reduced-hours separations, basically from sectors that employ more men and that tend to shed workers first in a downturn.
Women are more heavily represented in terminations and in reduced-hours separations from retail, hospitality, and administrative support.
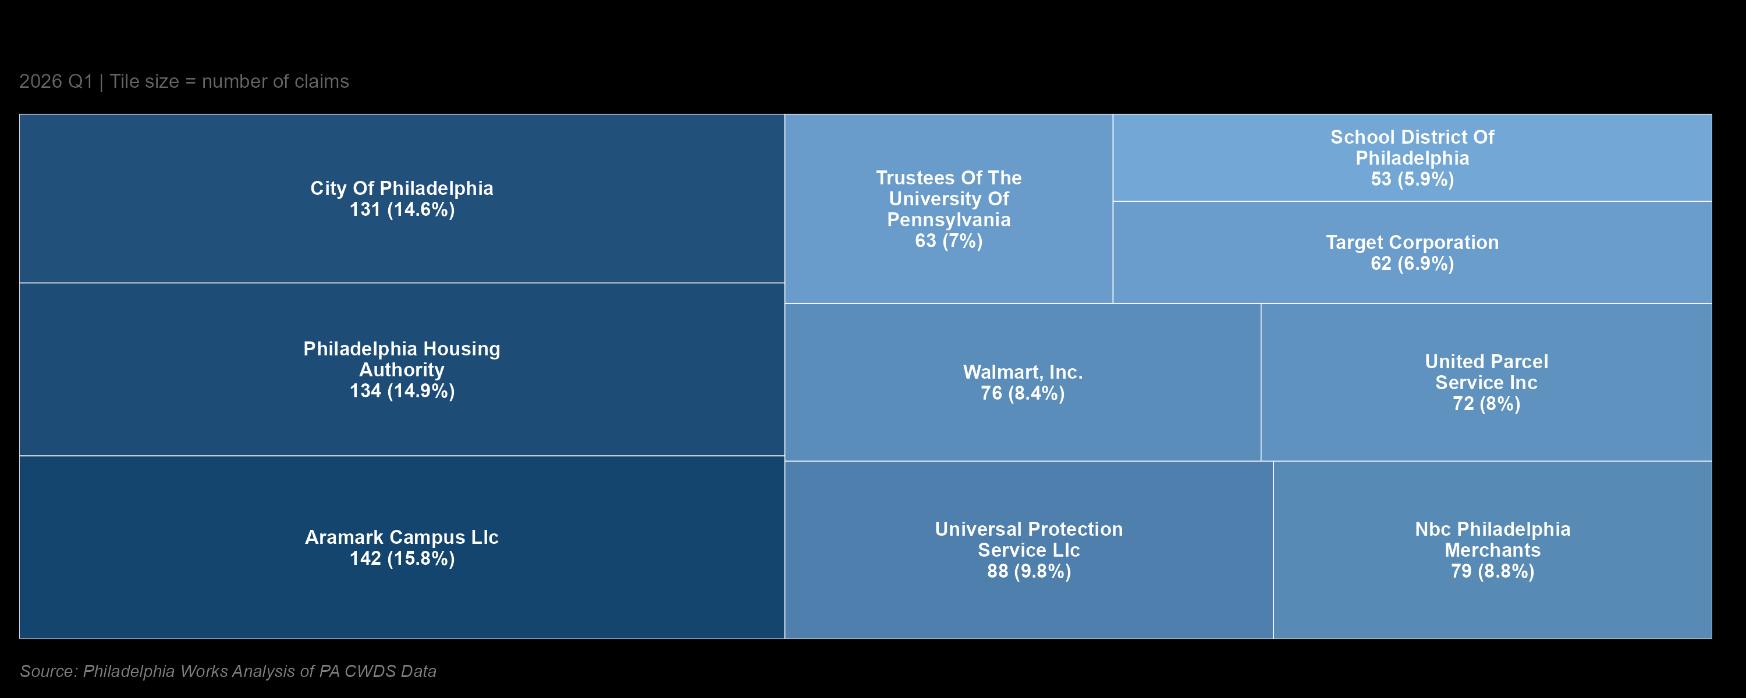
The employers having the most unemployment claims in Philadelphia are large institutional employers that rely heavily on contract, contingent, or seasonal workforces.
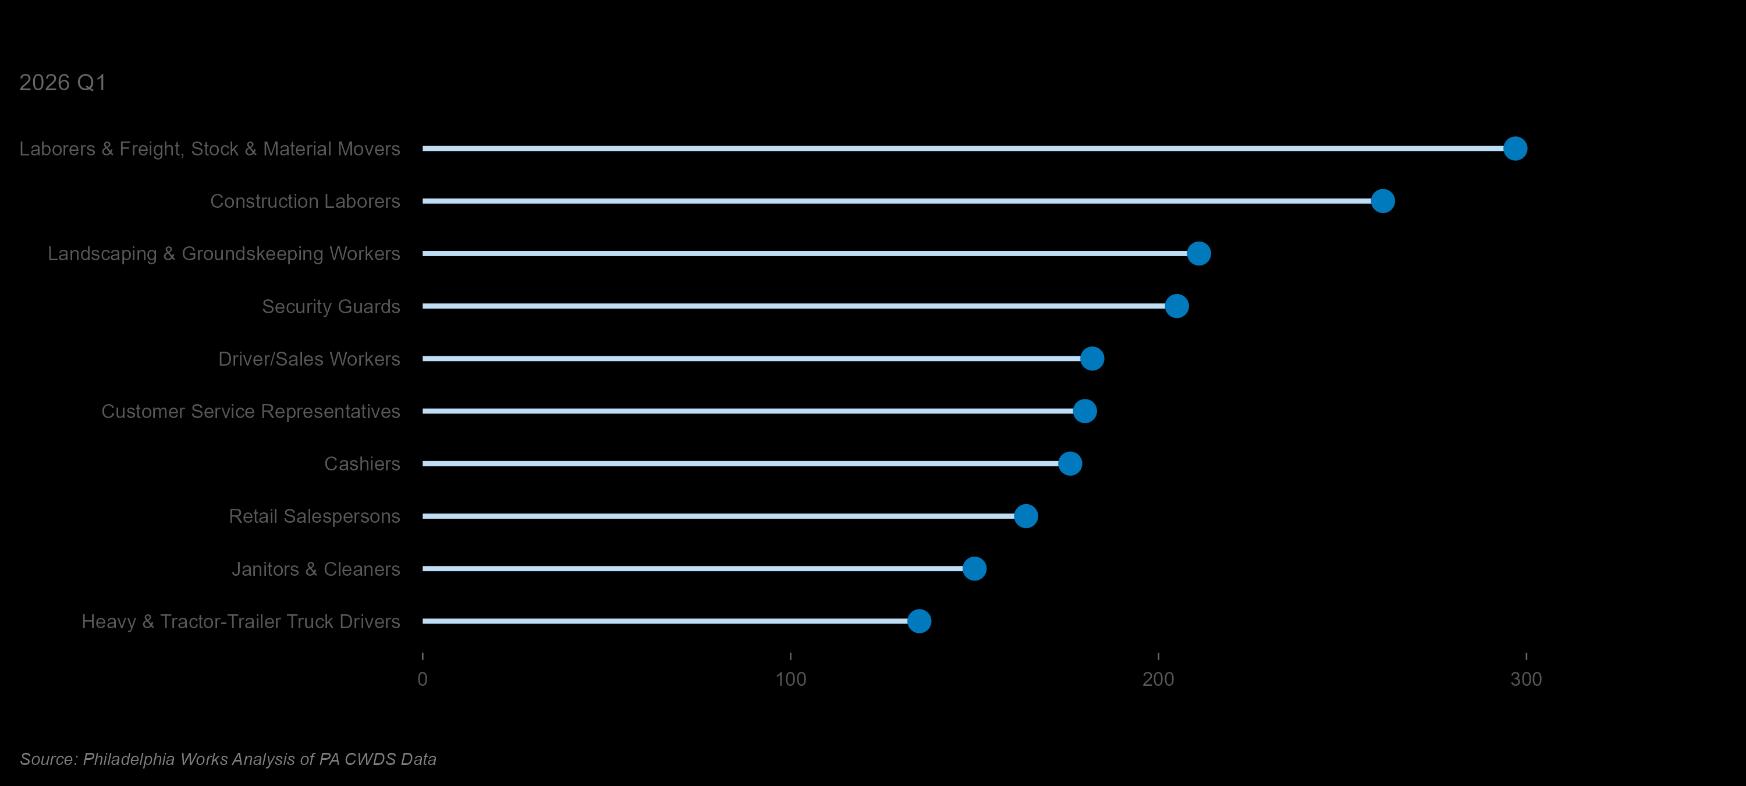
The occupations behind the most claims are concentrated in low-wage, high-turnover manual work: warehouse and freight laborers, construction laborers, landscaping and groundskeeping workers, security guards, and delivery drivers. Several of these are seasonal, which helps explain why claims spike in the winter quarter, as construction and landscaping slow sharply in January and February before rehiring in spring. These workers need fast, practical support such as benefits enrollment assistance, same-day job matching, and short-cycle credentials such as CDL, security, and CNA training.
Demand & Wages
Trends in Job Postings
Job Postings Trend
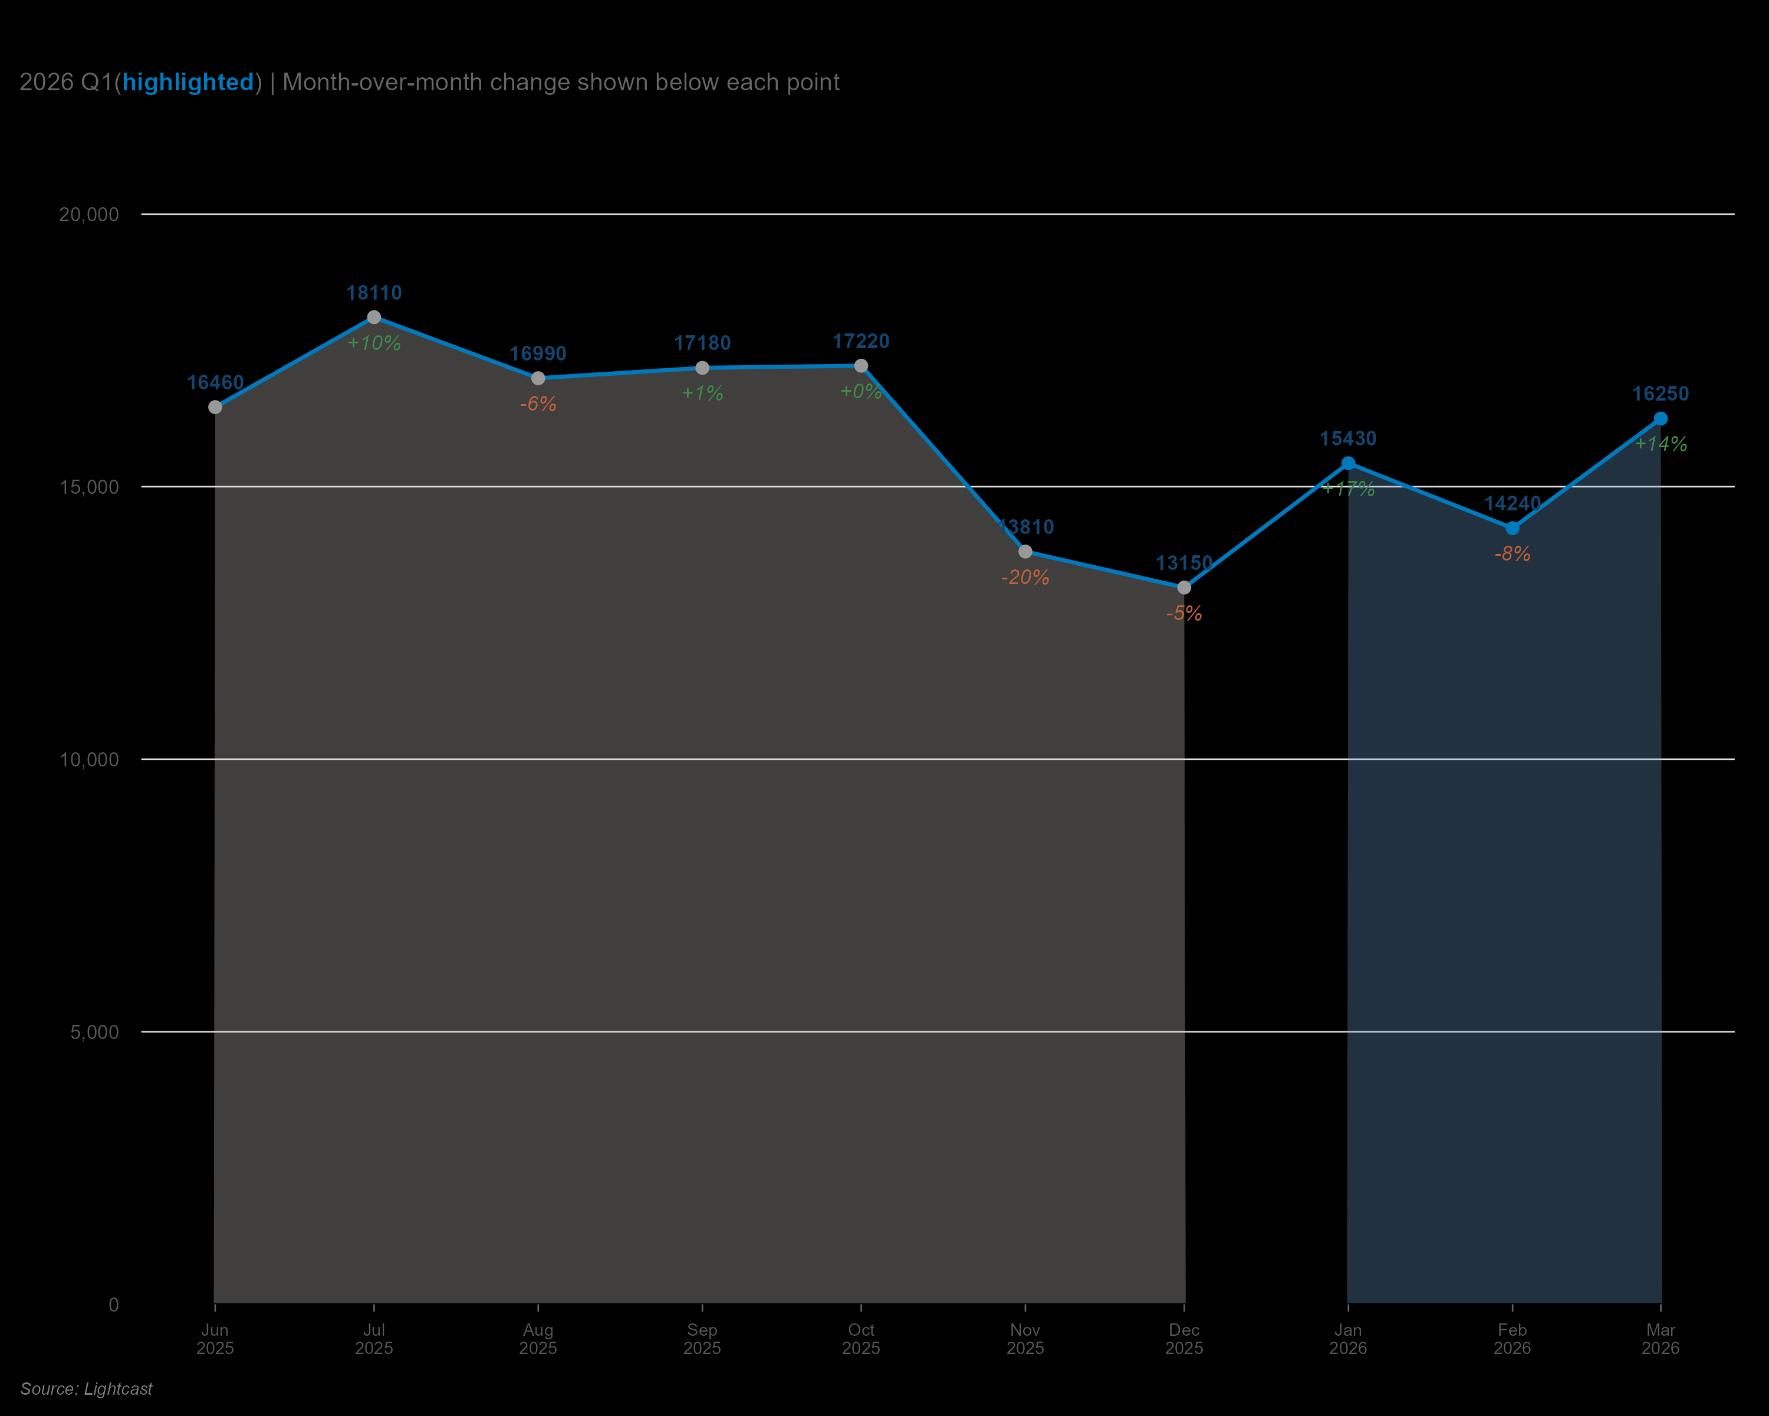
According to Lightcast, employers posted 45,920 unique jobs in Philadelphia during 2026 Q1, up modestly from the fourth quarter.
The more important signal is the monthly trajectory. After postings slumped through the end of 2025, reaching their lowest point of the year in December, they turned back up in early 2026. March rose 14.1% over February to 16,250 postings, clawing back much of the late-2025 decline. Demand for workers is rebuilding after a soft winter, though it stays concentrated in a narrow set of employers and industries.
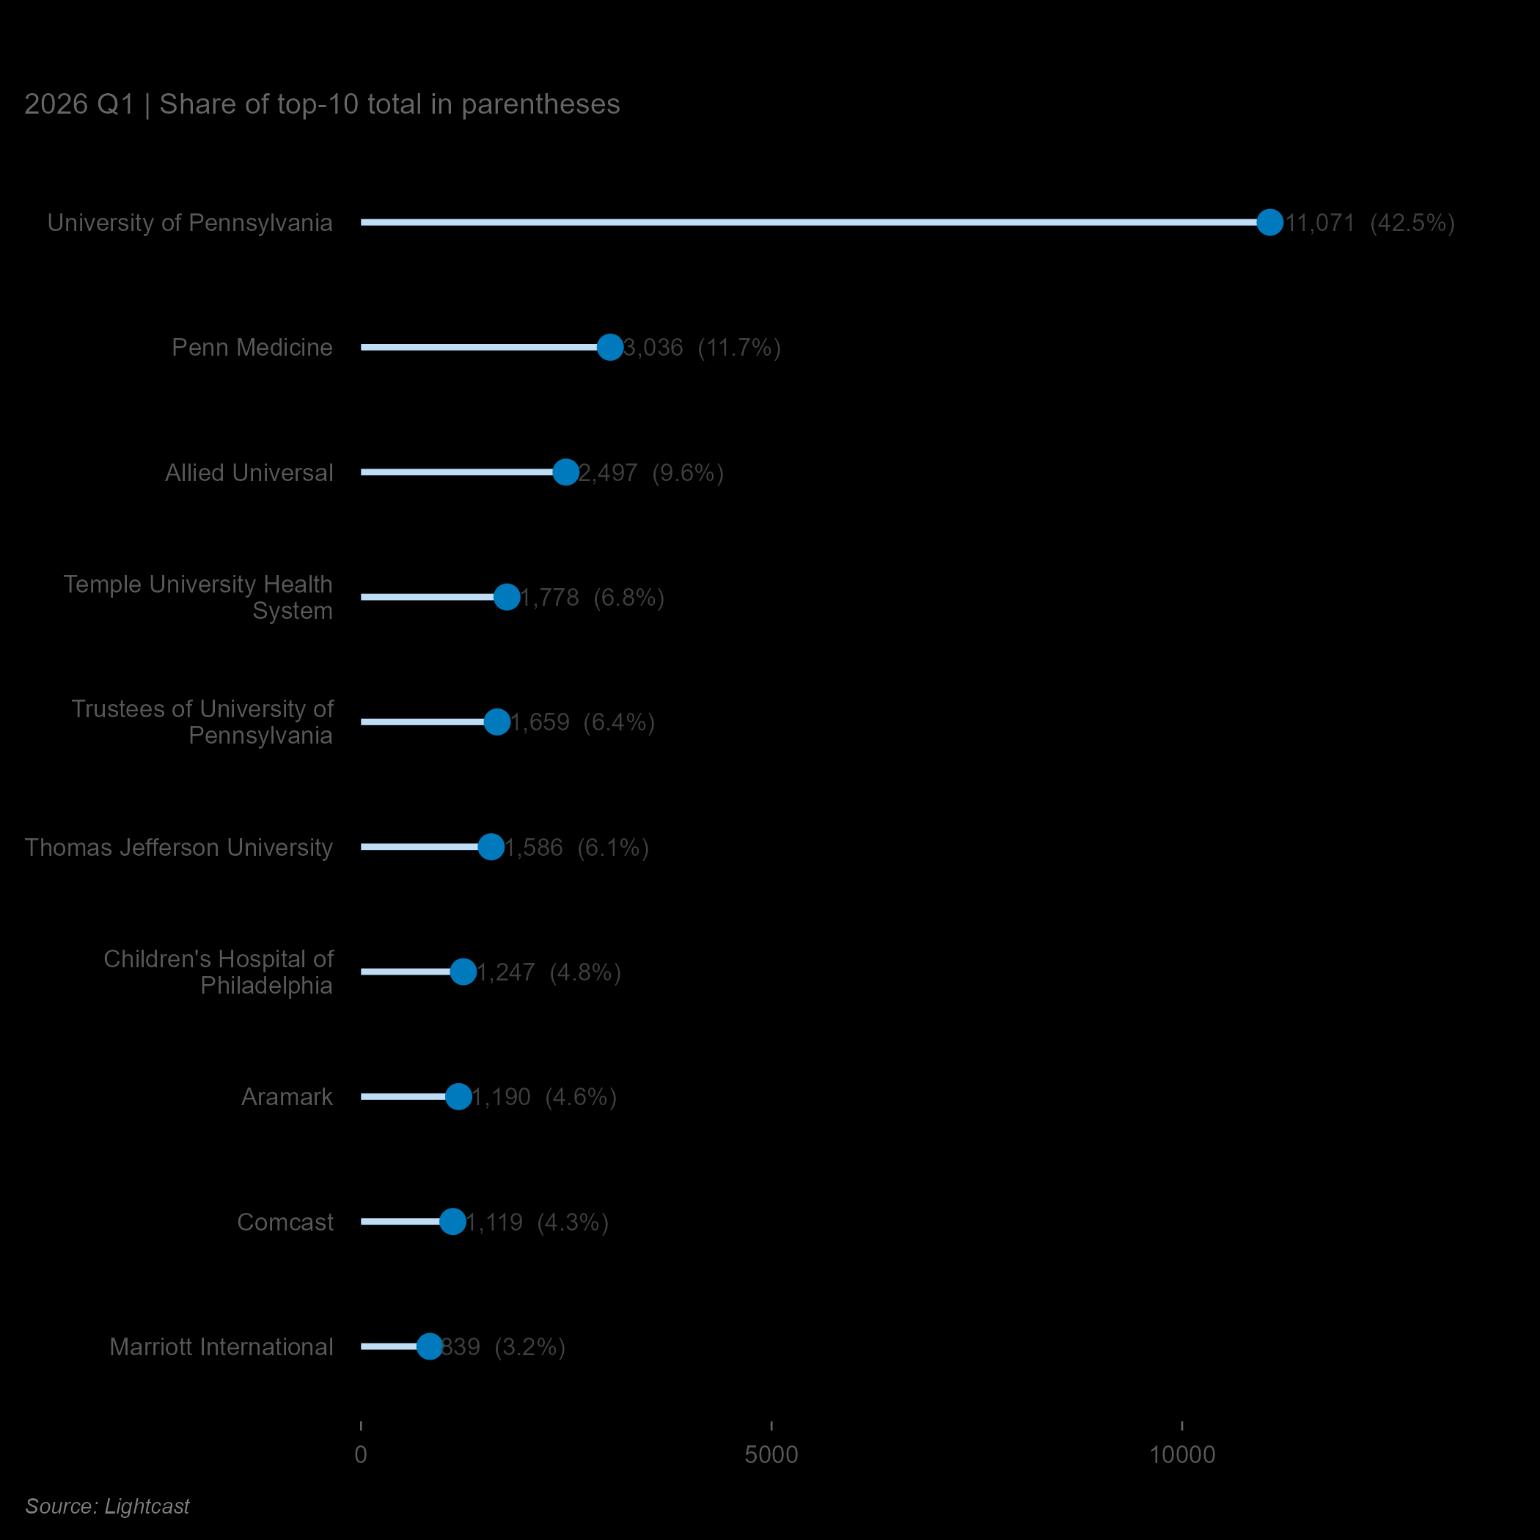
Philadelphia's top-posting employers cluster in education and health care. The University of Pennsylvania alone posted 11,071 jobs over the quarter, far more than any other employer, with Penn Medicine adding another 3,036. The third-largest employer - the security firm Allied Universal (2,497), points to the other side of the local labor market: high-volume demand for low-wage, high-turnover roles. The list captures Philadelphia's two-speed economy in a single chart, with anchor eds-and-meds institutions on one end and contingent-labor providers on the other.
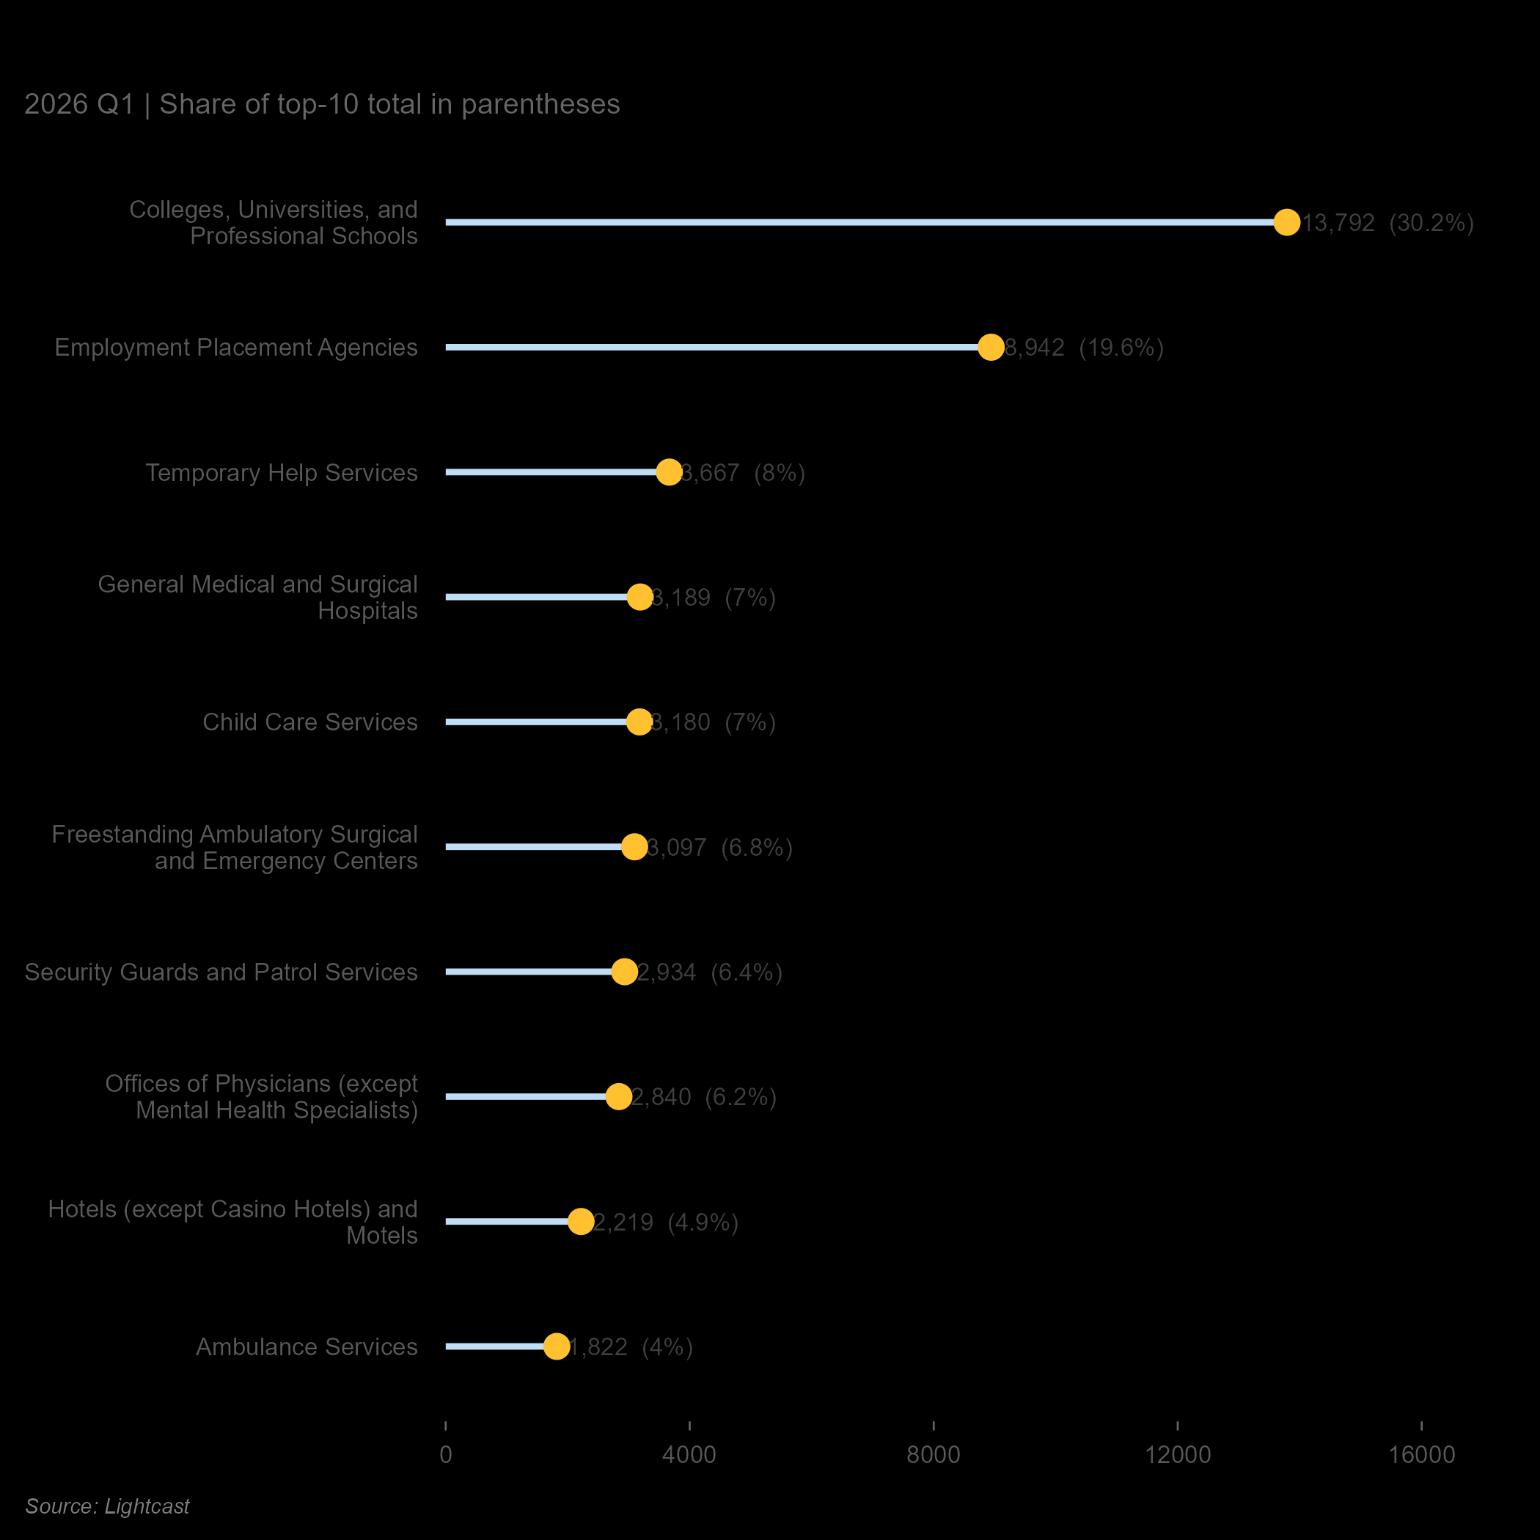
At the industry level, the same divide is sharper and more structural. Colleges, Universities, and Professional Schools led all industries with 13,792 postings. But the more revealing entries are the staffing intermediaries: Employment Placement Agencies posted 8,942 jobs and Temporary Help Services another 3,667.
Together, staffing firms posted 12,609 jobs, nearly matching the universities. That means a large share of Philadelphia's highest-volume listings are posted not by the firms doing the hiring, but by agencies placing workers at other firms, a sign of how much the local job market now runs through contingent and temp-to-hire channels.
The Philadelphia’s labor market employs more people than before, but pays them less, in real terms, than it did two years ago.
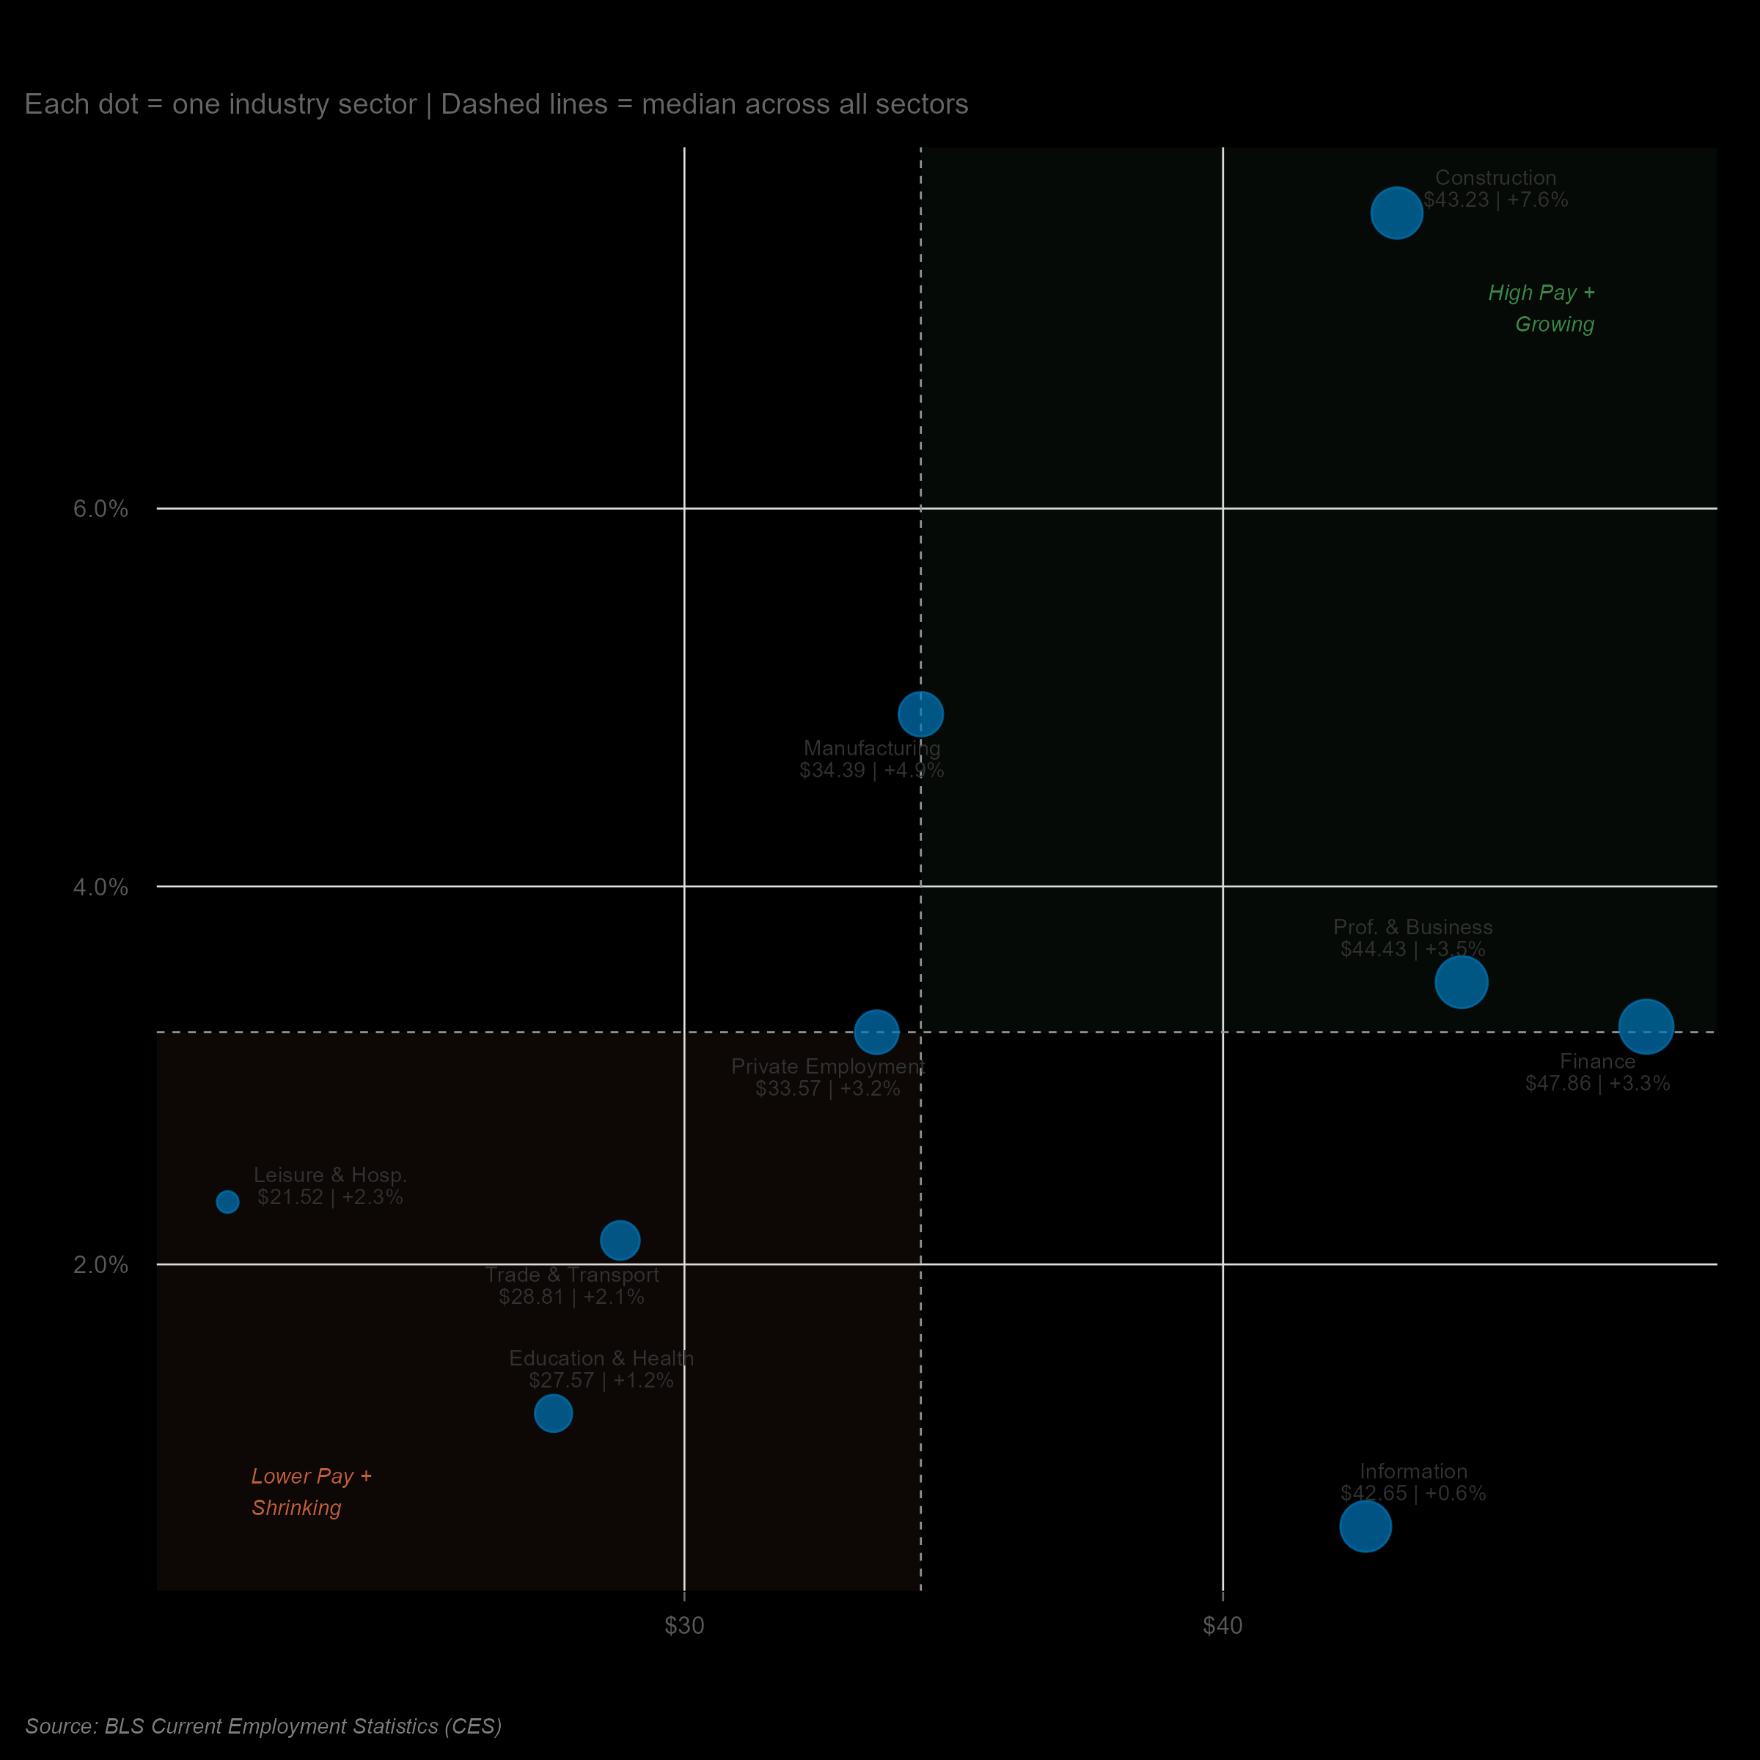
Construction leads Pennsylvania's private sectors on both pay and growth in March, at roughly $43 an hour and +7.6% year over year, the only sector growing fast enough to clearly outrun inflation. Finance ($48, +3.3%), Manufacturing ($34, +4.9%), and Professional and Business Services ($44, +3.5%) fill out the high-pay, growing quadrant.
Information sits apart, a high-wage sector with stalled growth ($43, +0.6%), up from falling wages a year ago. The median sector pays about $34 an hour and grew 3.2%.
At the low-pay, low-growth end sit Education and Health ($28, +1.2%), Trade and Transport ($29, +2.1%), and Leisure and Hospitality ($22, +2.3%), the very sectors adding the most jobs.
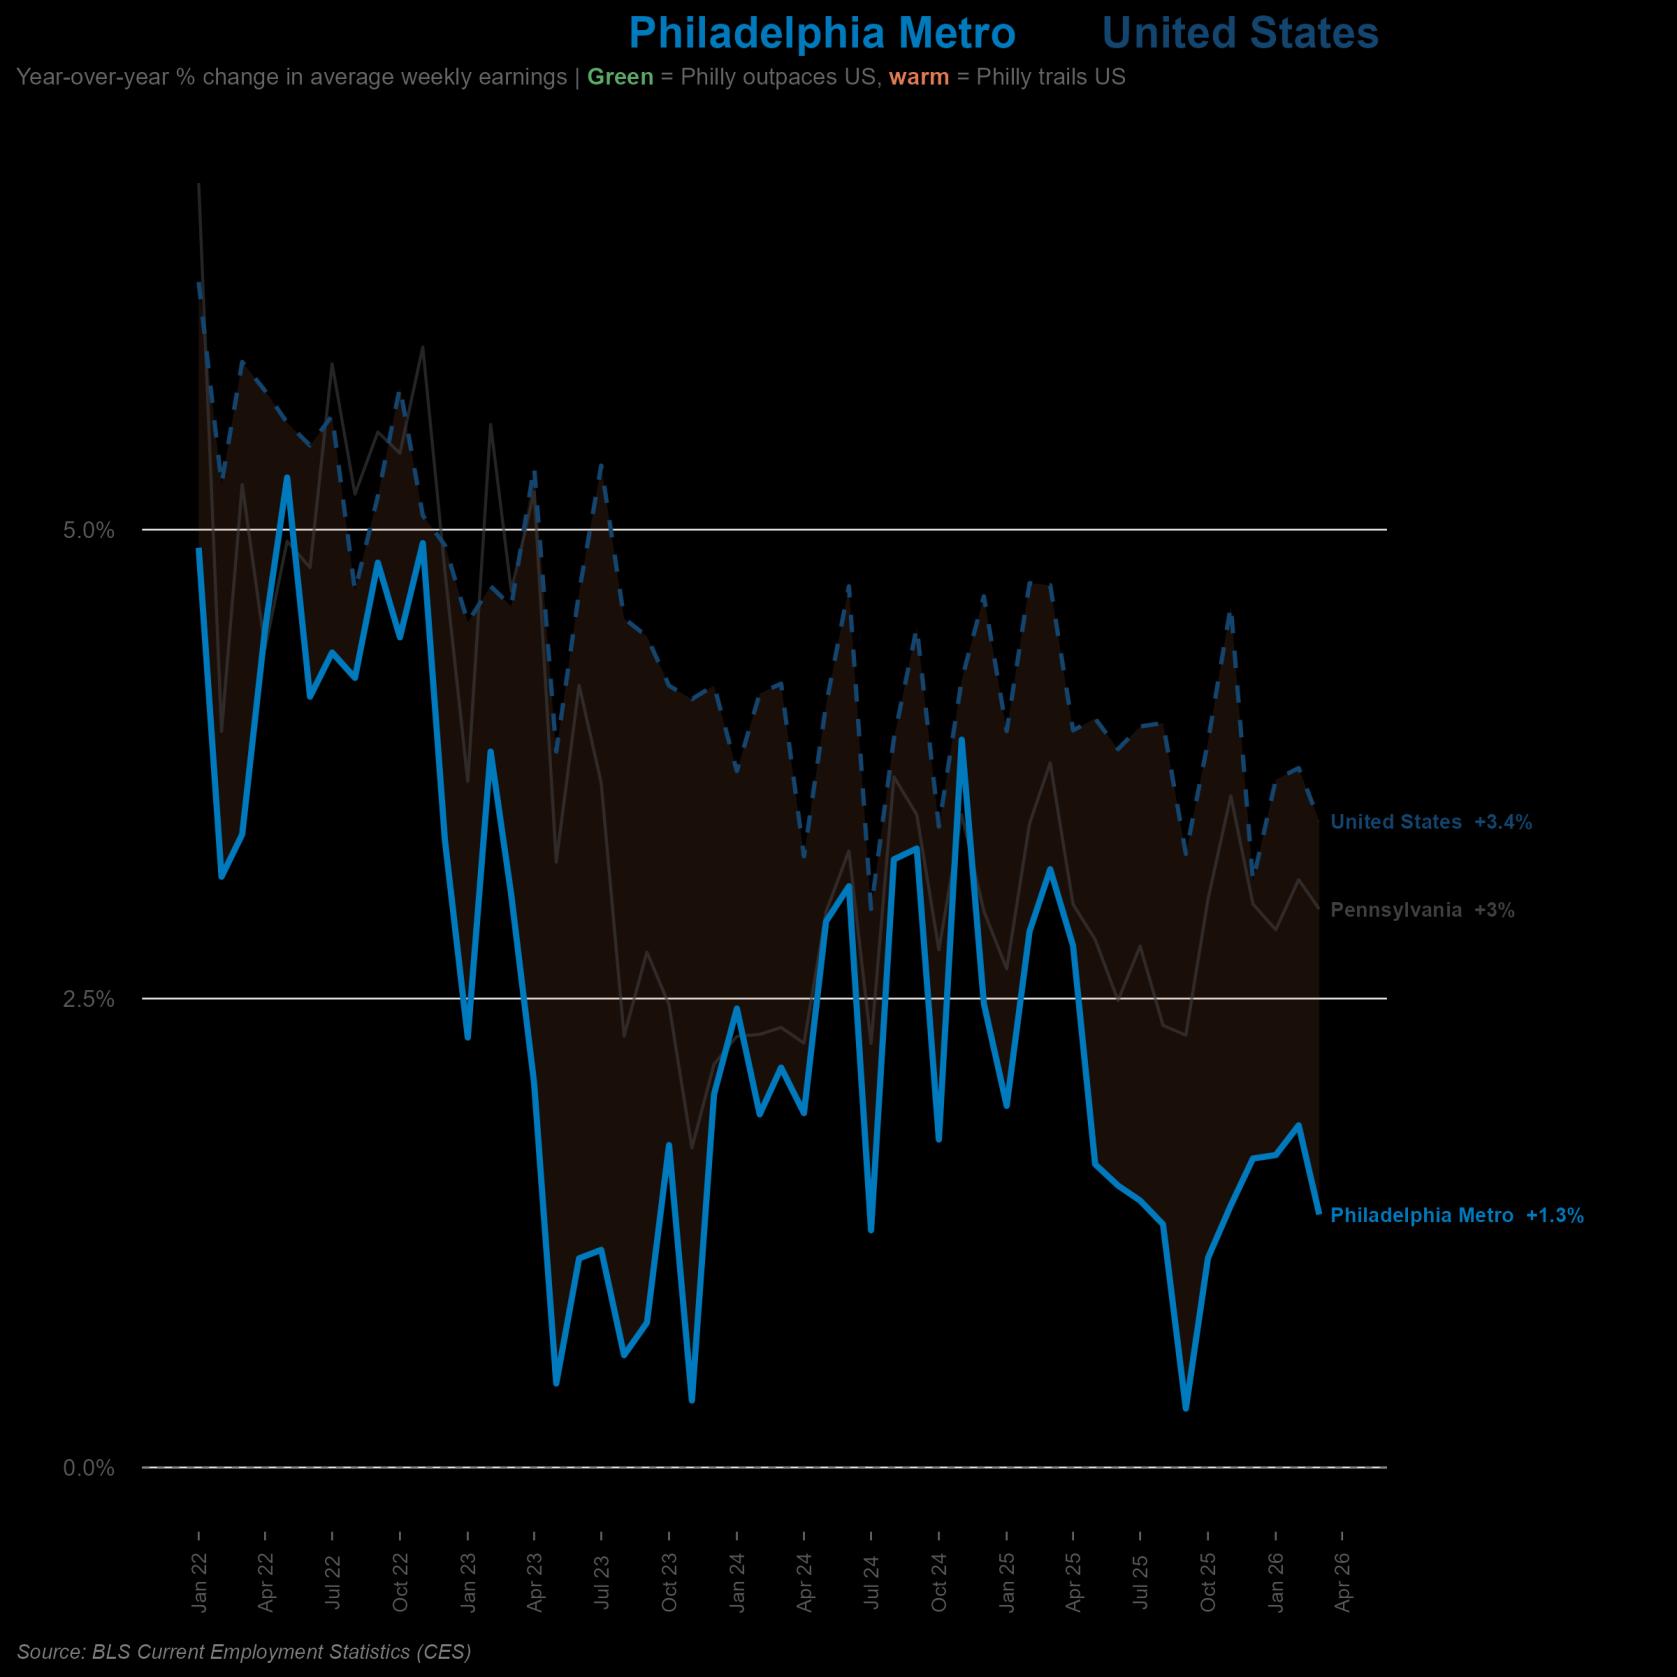
From January 2022 through March 2026, private-sector wage growth in the Philadelphia metro has trailed the national average in every single month, 0 of 51. As of March, Philadelphia wages were up just 1.3% over the year against 3.4% nationally, a 2.1-point gap. The Philadelphia line sits below the US line for the entire span of the chart. Philadelphia workers are simply not seeing the raises their counterparts elsewhere are.
After a volatile stretch in 2023 and early 2024, when growth briefly dipped below 1% in several months, the Philadelphia line settled into a steadier but still structurally fluctuated pattern through 2025 and into 2026.
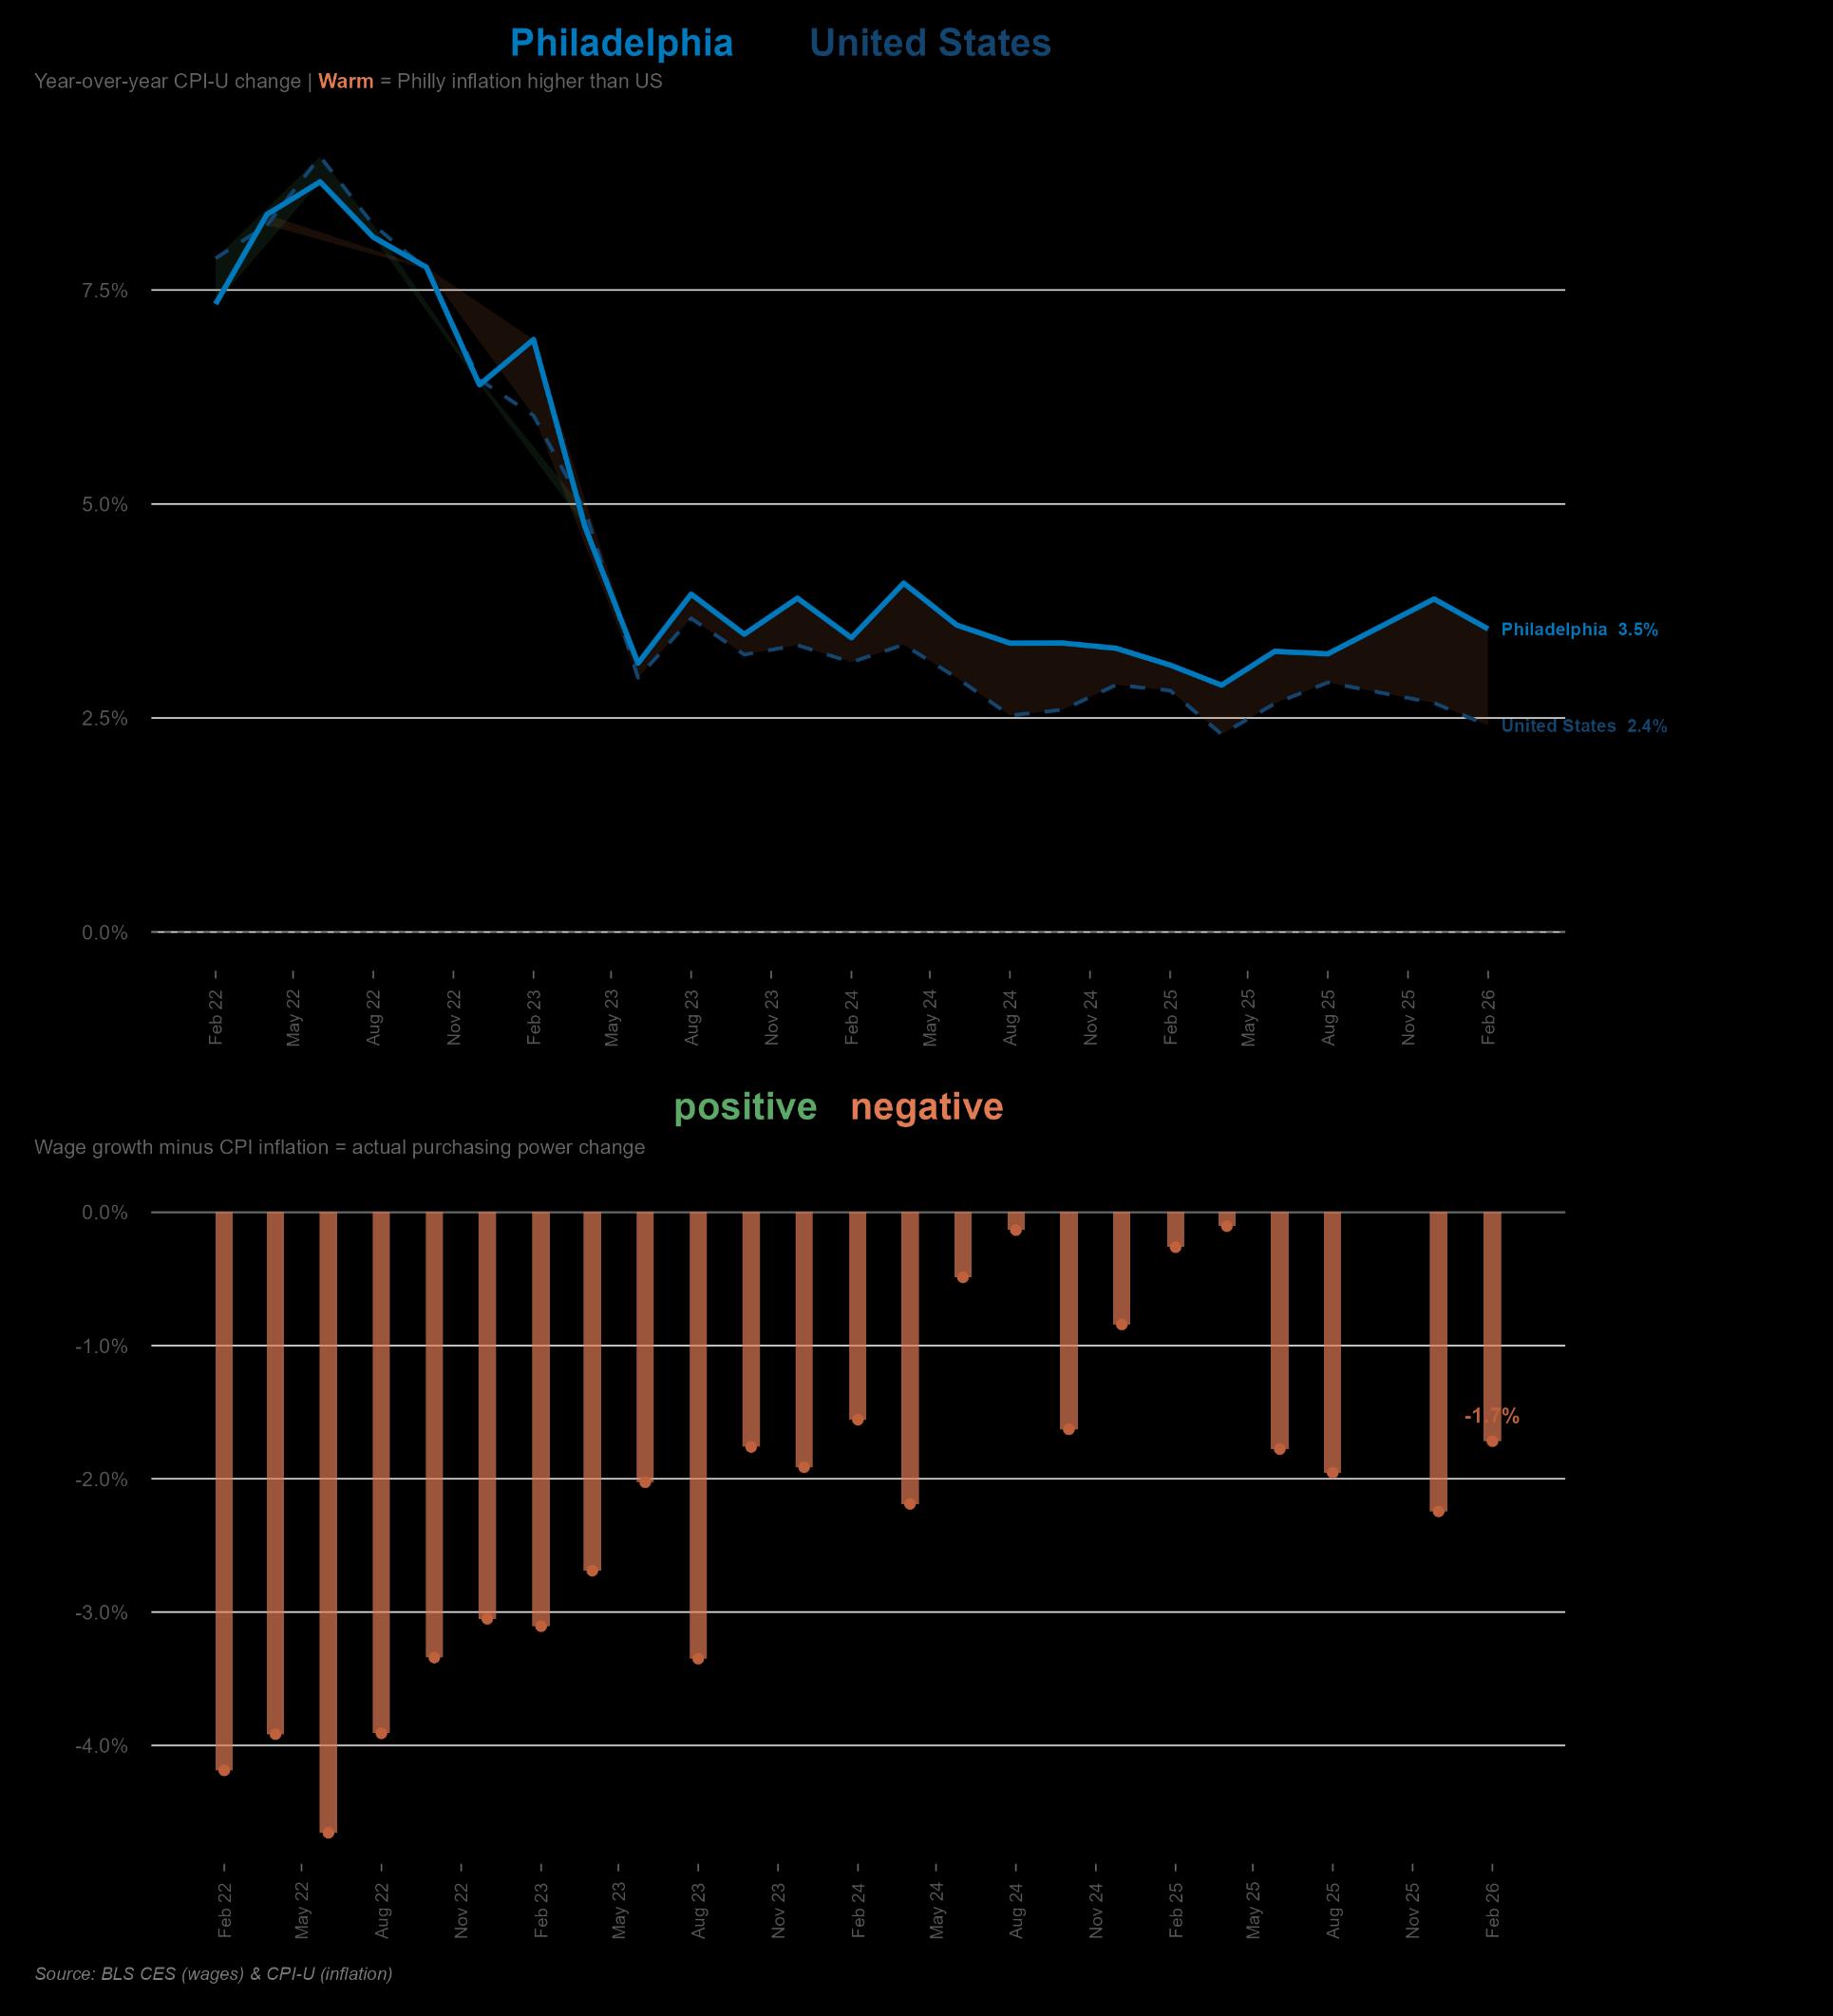
As of February 2026, Philadelphia private wages were up 1.8% over the year while local inflation ran at 3.5%. The difference is lost purchasing power: real wages fell about 1.7%, meaning a typical paycheck buys less than it did a year earlier. What makes Philadelphia's squeeze especially acute is that local inflation, at 3.5%, has run consistently above the national rate of 2.4%. The same paycheck stretches even less here than it does across the country.
Real wage growth in Philadelphia has been negative in all 24 months tracked since 2022. Workers were hit hardest during the 2022 inflation surge, recovered some ground as national inflation cooled through 2023 and 2024, then slipped back into the red as prices reaccelerated in late 2025 and early 2026.
Socioeconomic Analysis
Demographics and Geospatial Disparity
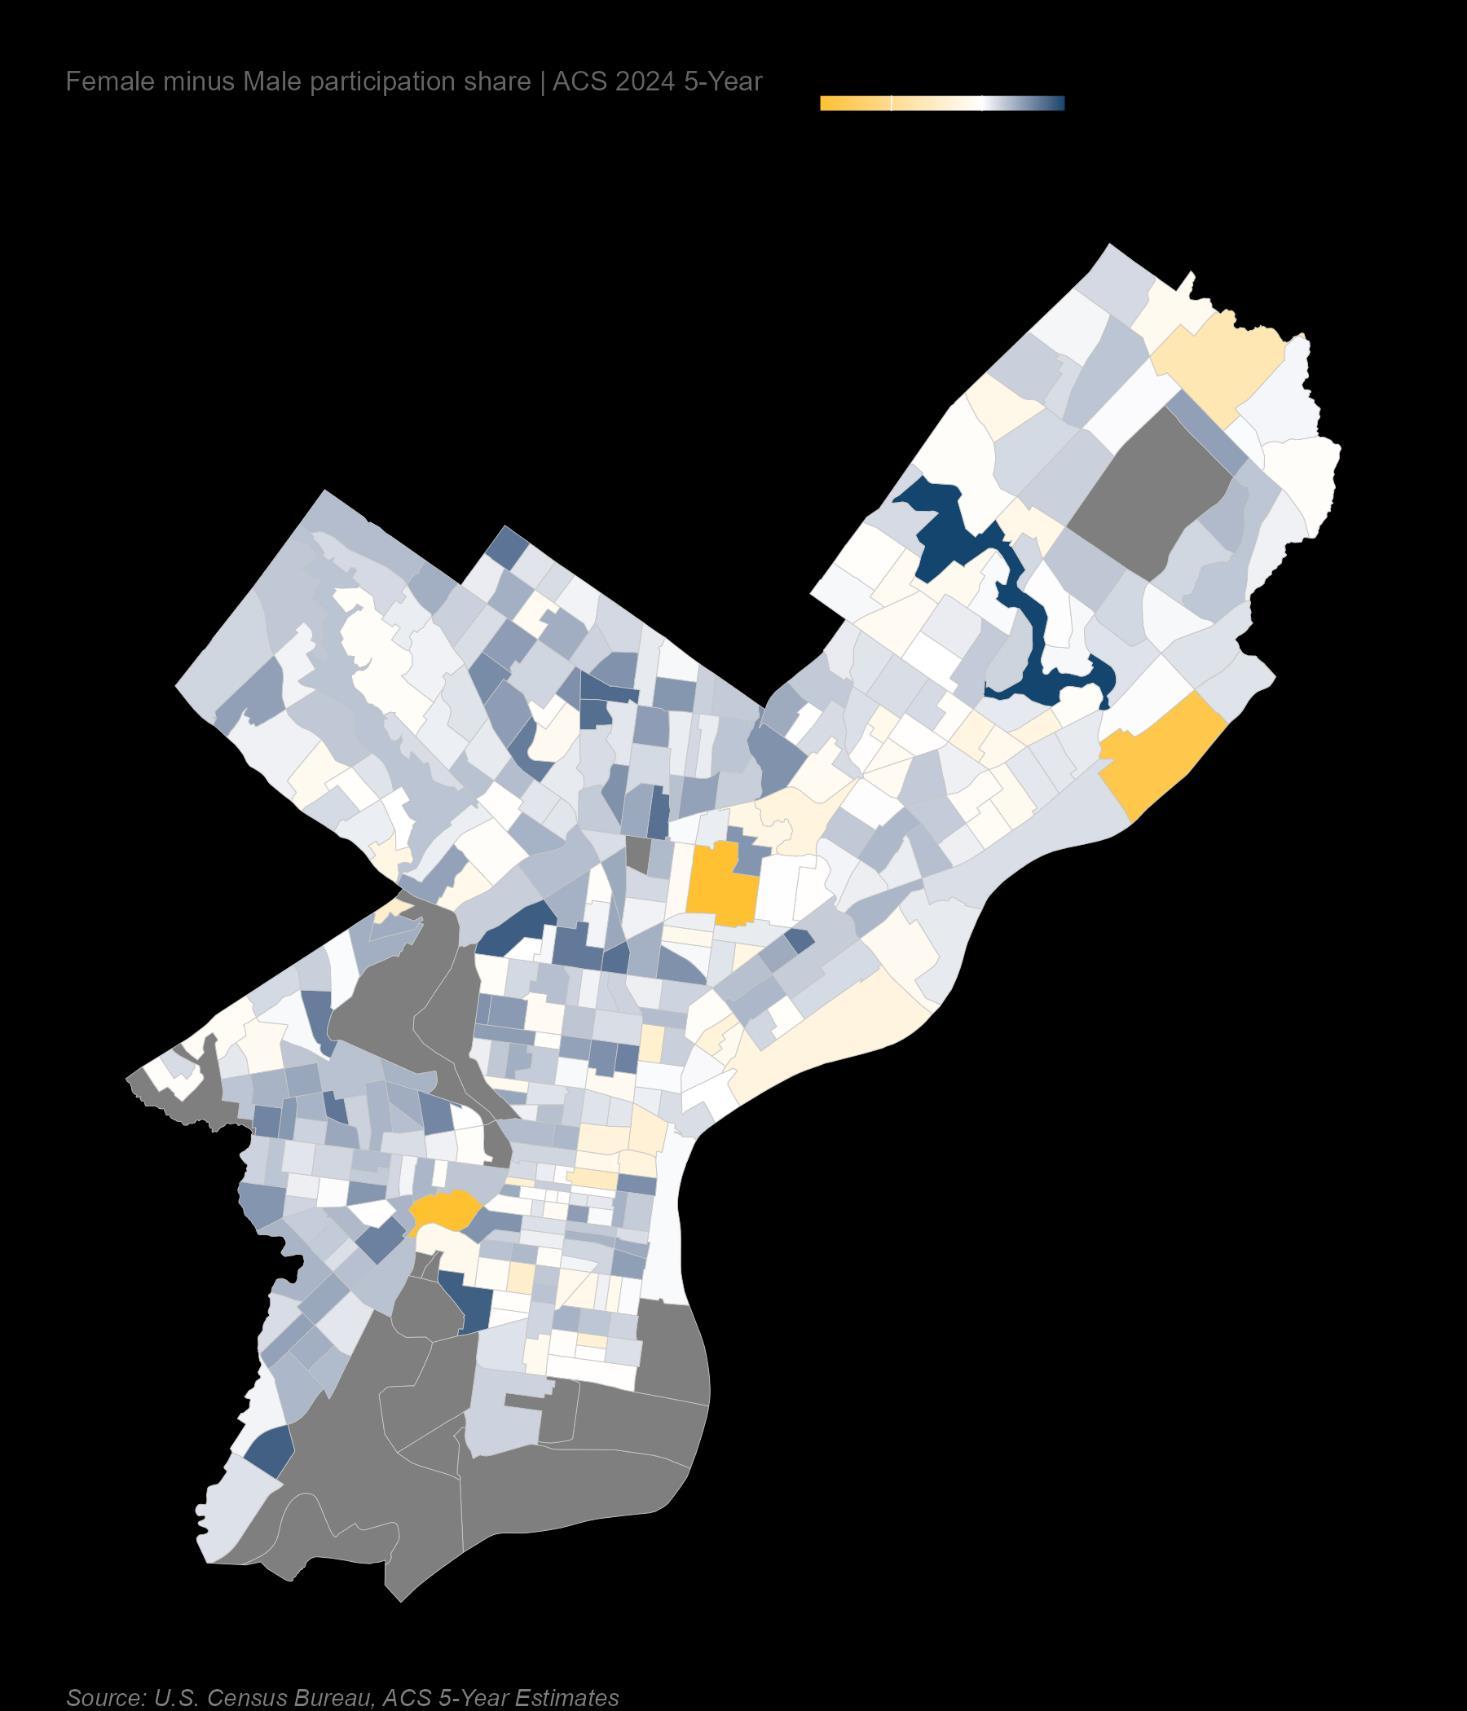
The Labor Force Participation Rate (LFPR) Gender Gap measures the difference between the share of working-age women and working-age men who are either employed or actively seeking work. A positive value means women participate at a higher rate than men in that tract.
Women's participation in Philadelphia already exceeds men's in three out of every four neighborhoods. On the other side, persistently lower male participation reflects the long shadow of deindustrialization and the disconnection of working-age men.
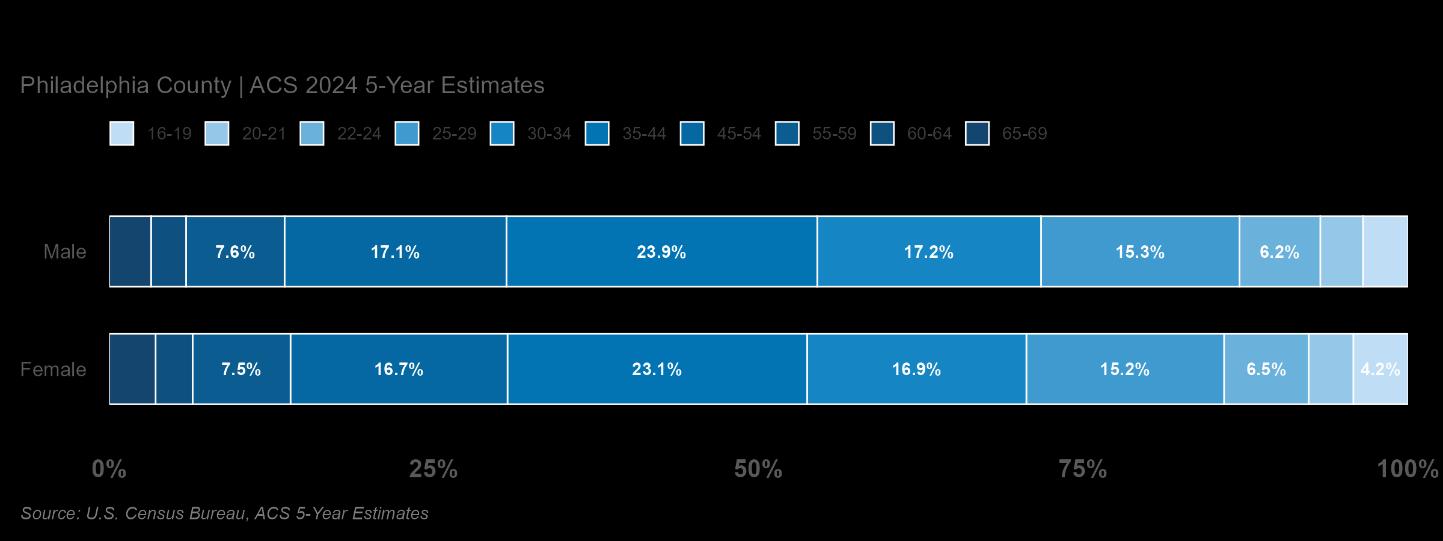
The 35–44 cohort is the single largest group for both men (23.9%) and women (23.1%). Philadelphia's participation gap is driven not by women working at different ages than men, but by simply more women working at every age.
Residents of color are more likely to be out of the labor force and unemployed.
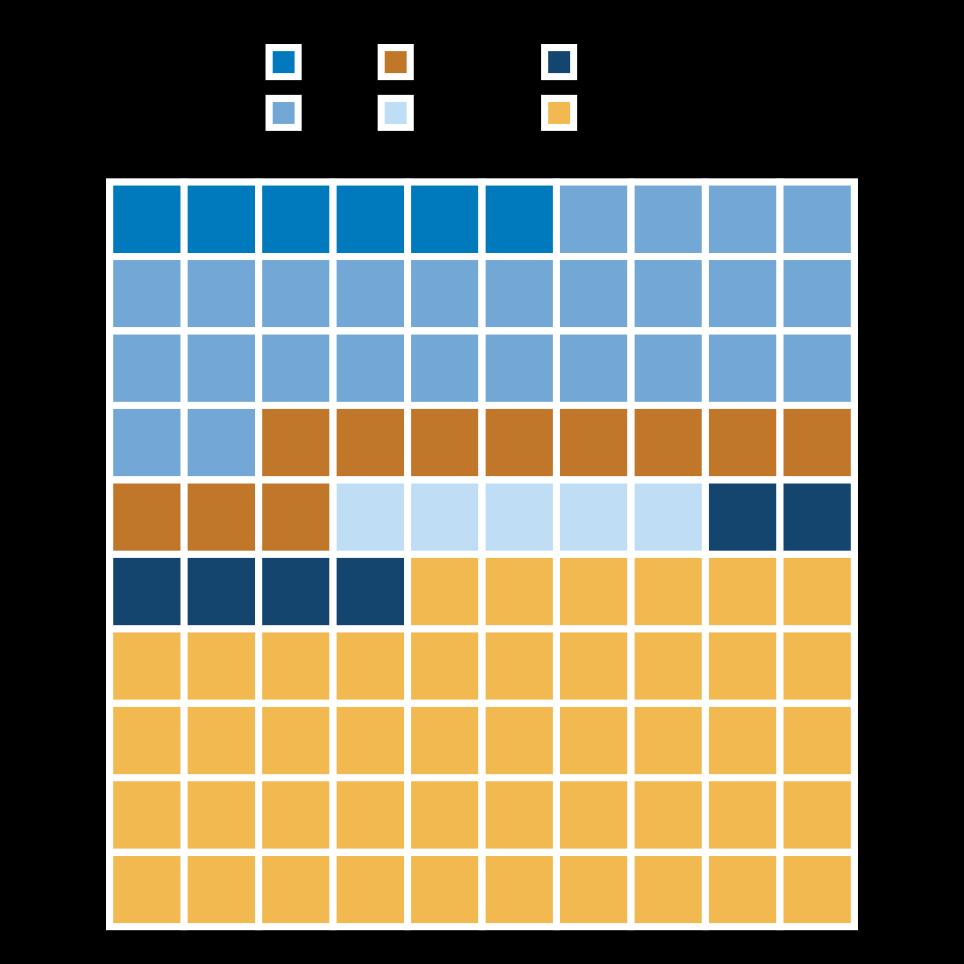
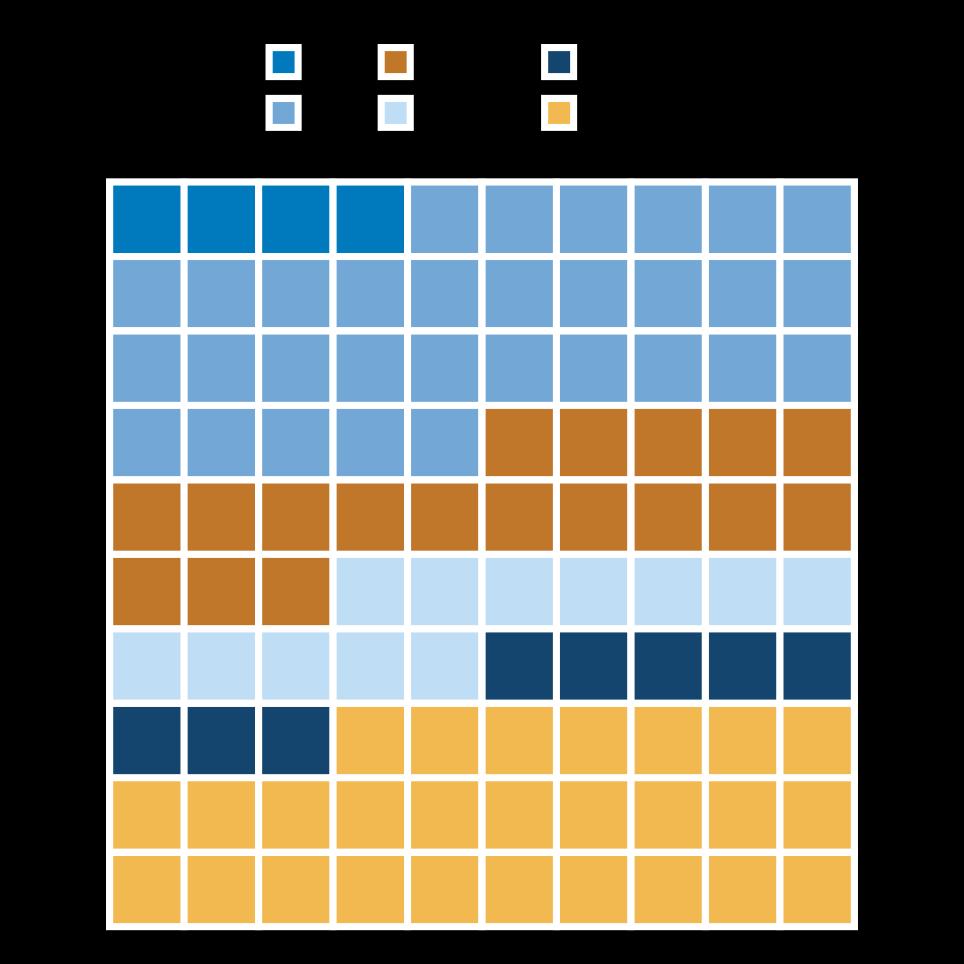
White workers make up 46% of Philadelphia's labor force but only about 27% of the unemployed they're significantly underrepresented among the jobless.
Black workers show the opposite: 26% of the workforce but 31% of the unemployed. Hispanic workers face the steepest gap, showing 11% of the labor force, 18% of the unemployed.
The waffle charts visualize the disparities. If unemployment hit all groups equally, the two charts would look the same. Instead, the yellow shrinks dramatically between charts while light blue, orange, and other categories expand. Black and Hispanic Philadelphians bear a disproportionate share of joblessness at the same time white workers are largely insulated.
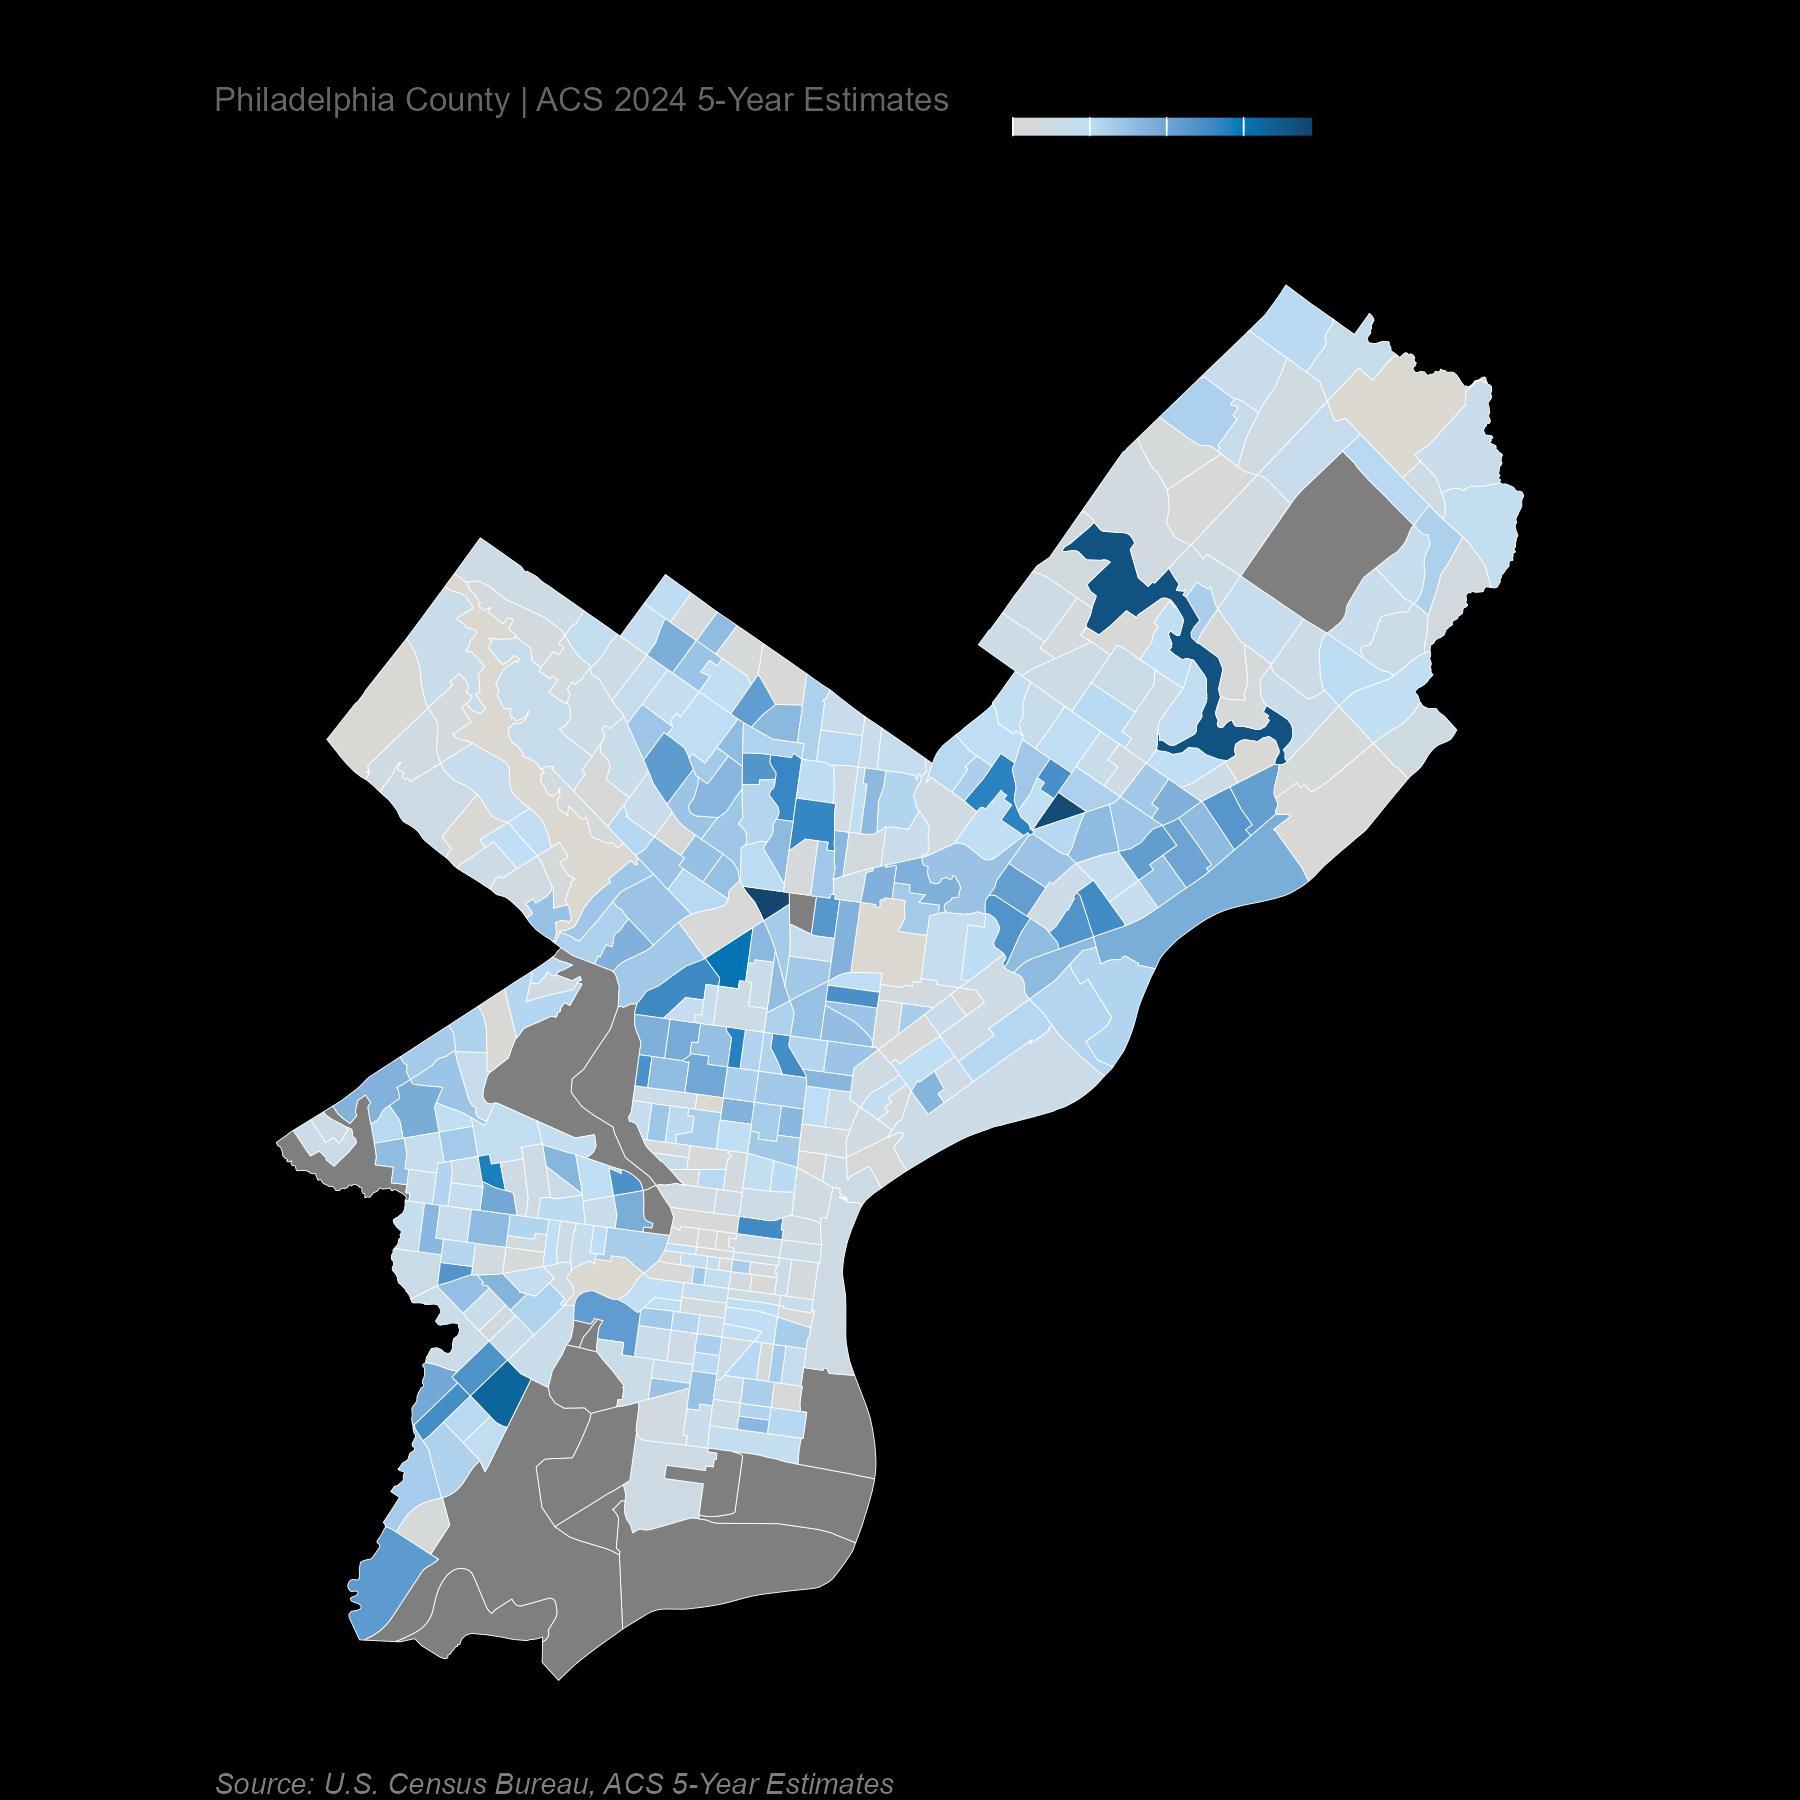
The map shows unemployment rate by census tract ranging from 0% to 19.4%, and the darker clusters sit exactly where unemployment claims concentrated: North Philadelphia, West Philadelphia, and the Kensington–Frankford corridor.
Center City, University City, the Far Northeast, and the Northwest remain largely pale. Half the city lives comfortably below the metro unemployment rate.
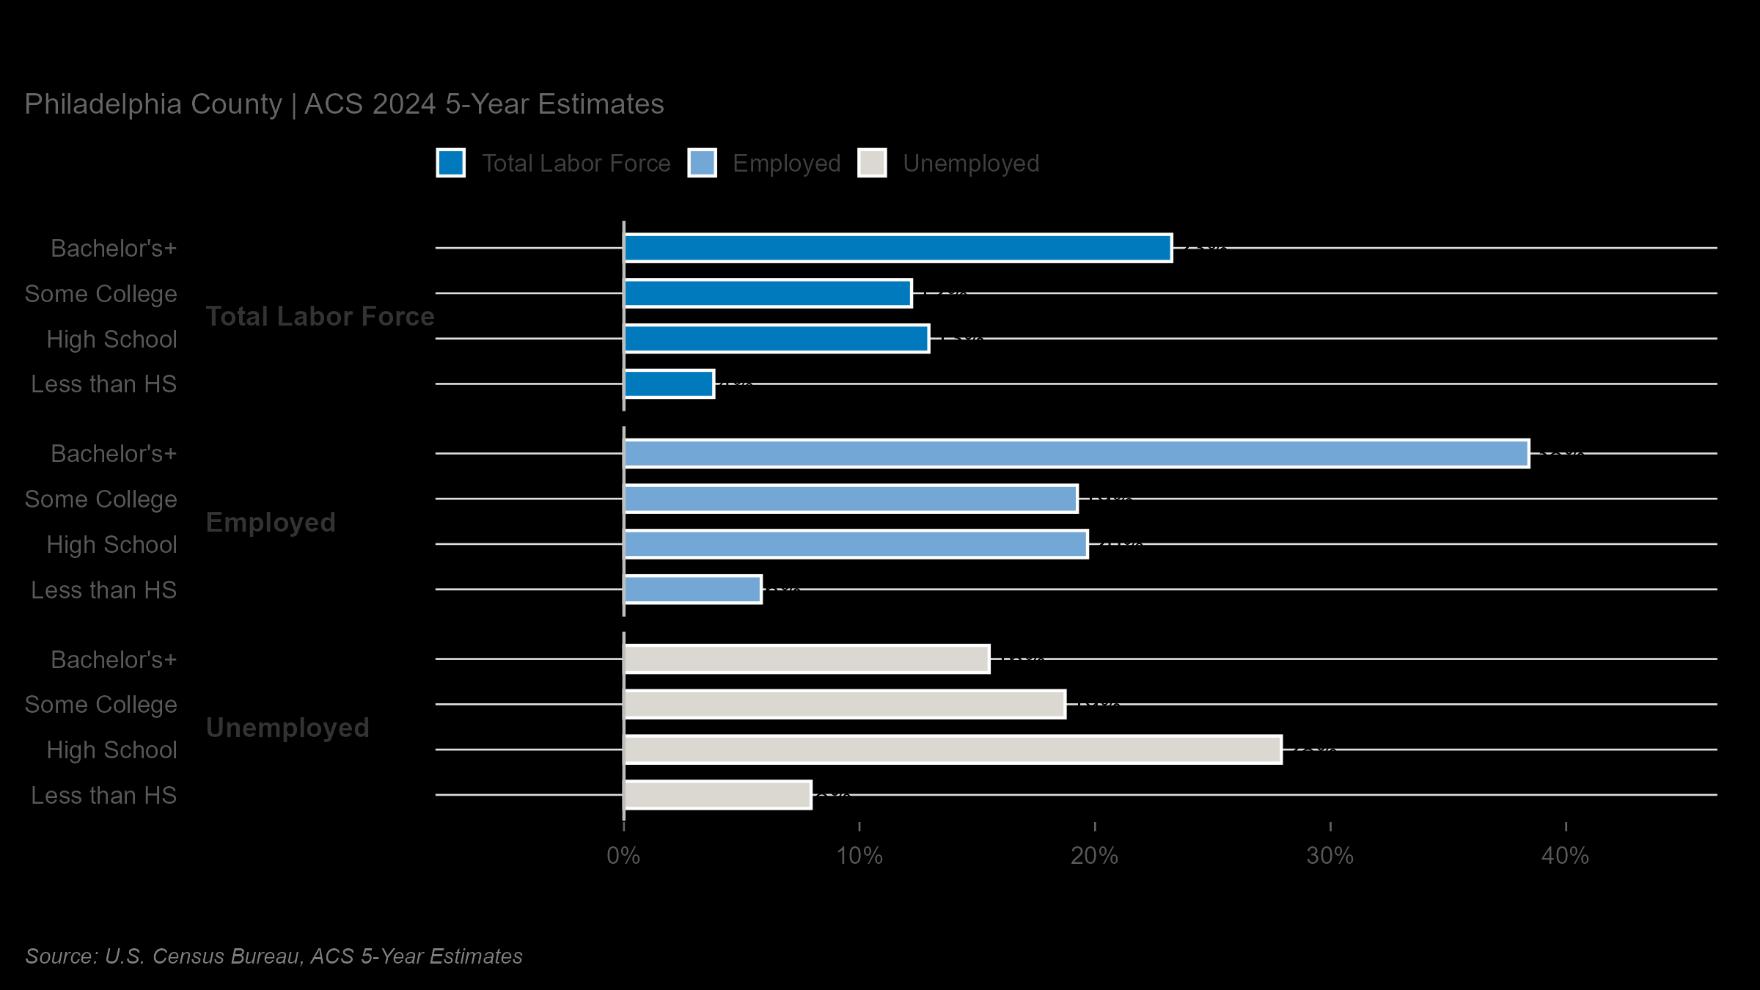
A Bachelor's degree is the single strongest predictor of labor-market standing in Philadelphia. BA-holders make up 23% of the labor force but 38% of the employed, and just 16% of the unemployed. High-school-only workers make up 13% of the labor force, only 20% of the employed, but 28% of the unemployed.
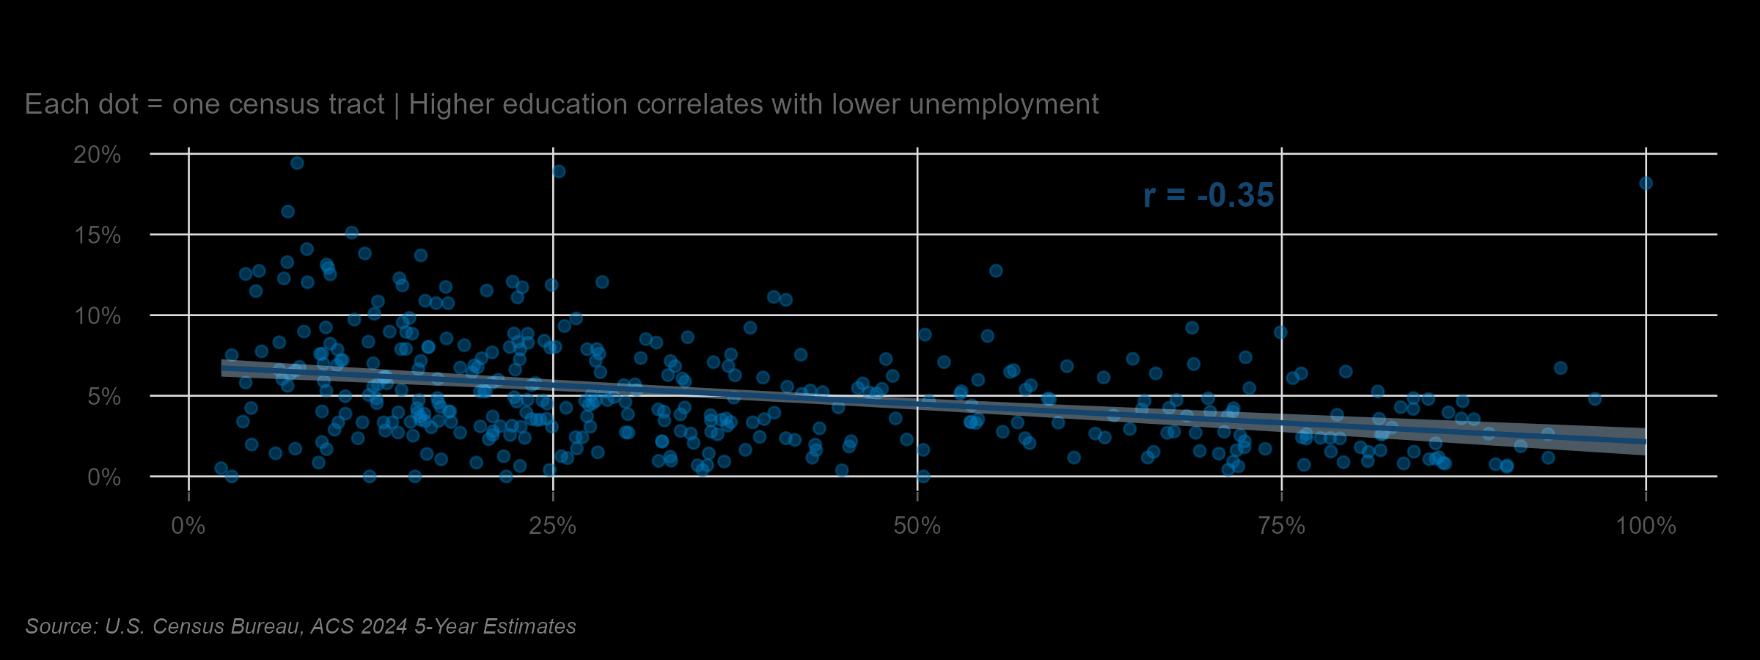
The tract-level scatter chart indicates the pattern spatially, with a correlation of r = –0.35 between the share of BA-plus residents and the unemployment rate. Education does not merely improve outcome. It increasingly changes them.
Appendix
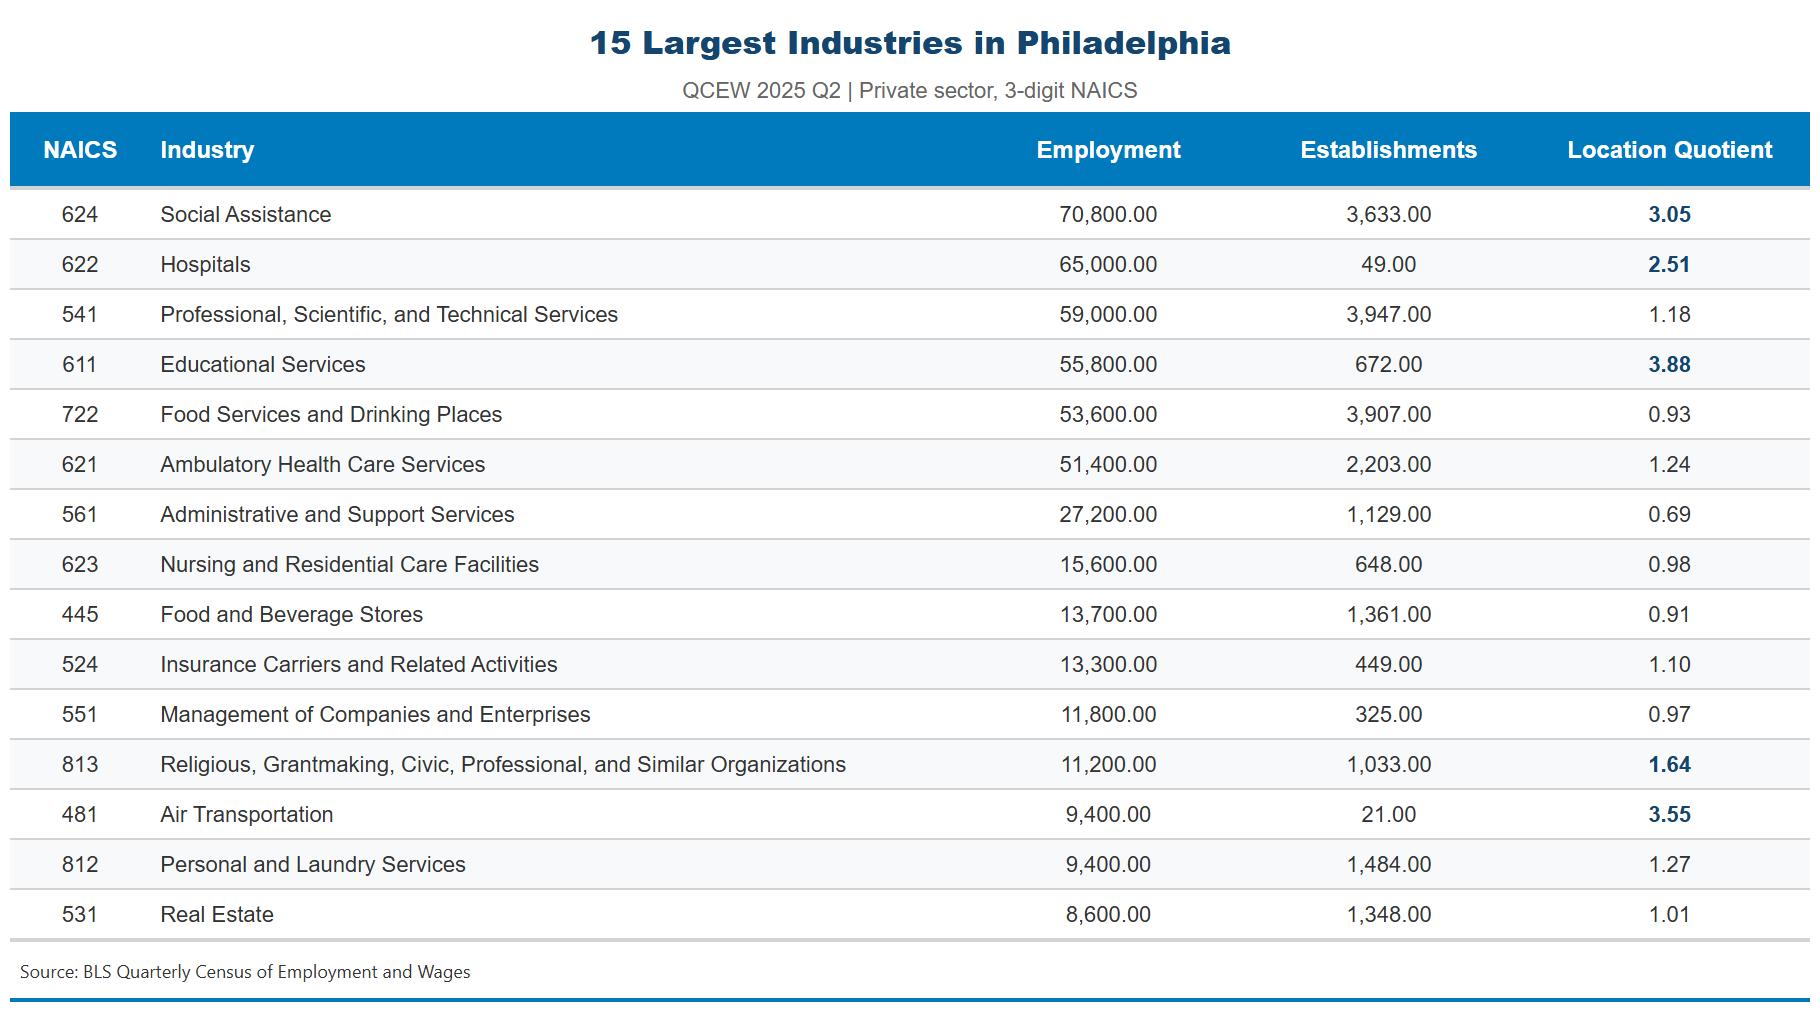
Appendix Table 1: Largest Detailed Industry Sectors in Philadelphia, Q2 2025
From the Quarterly Census of Employment and Wages, this table shows the 15 largest industry sectors by total employment. These data are released on a roughly six-month delay.
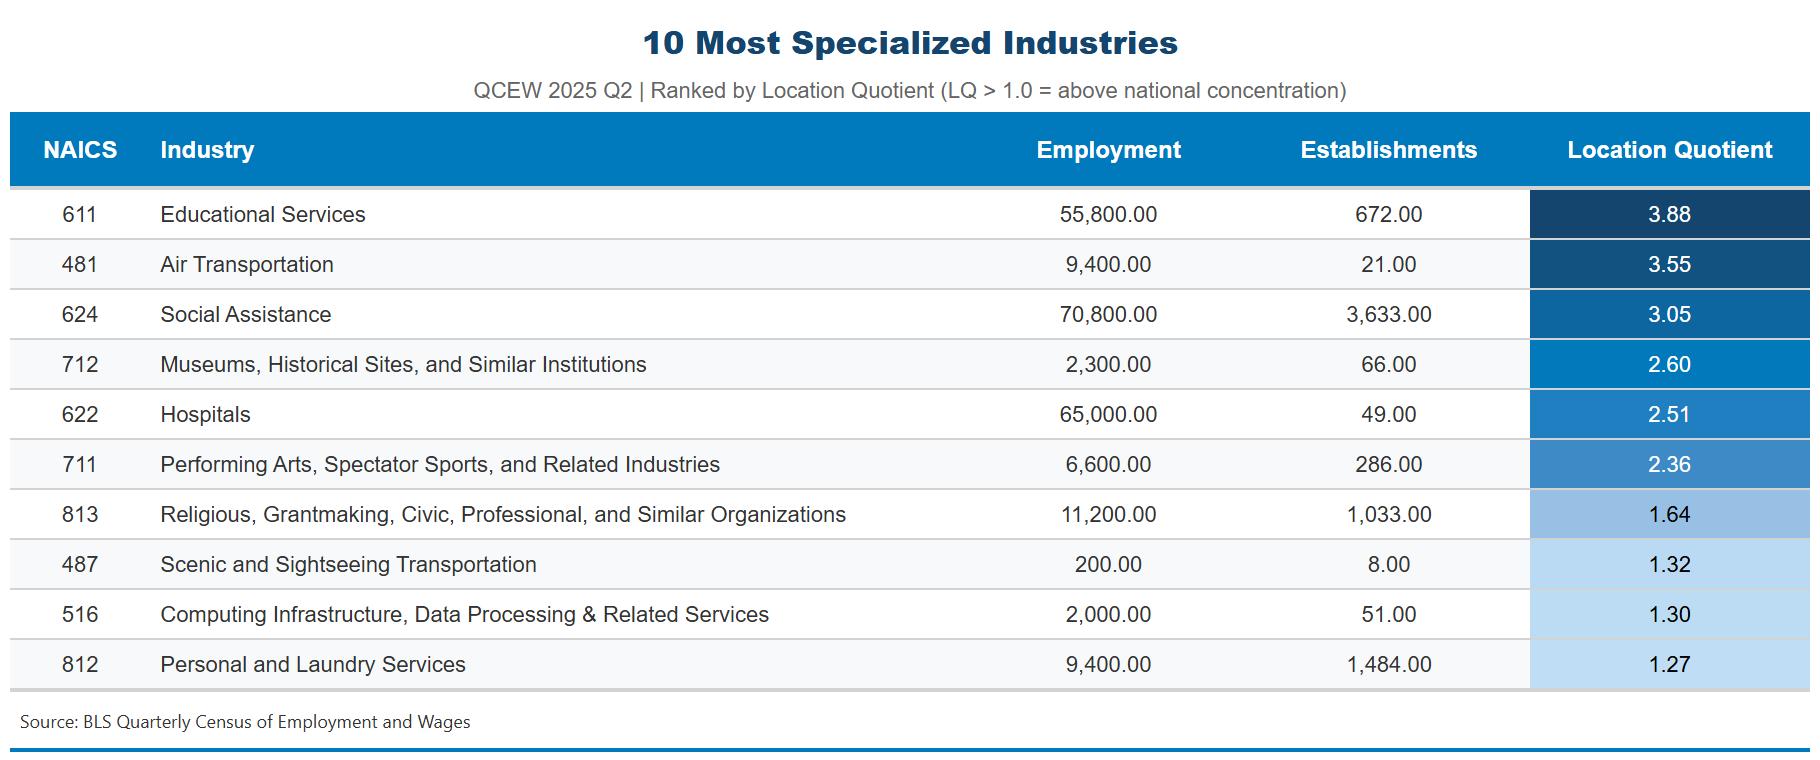
Table 2: Most Specialized Detailed Industry Sectors in Philadelphia, Q2 2025
From the Quarterly Census of Employment and Wages, this table shows the 10 most specialized industry sectors by total employment. These industries are disproportionately important to Philadelphia’s economy. These data are released on a roughly six-month delay.
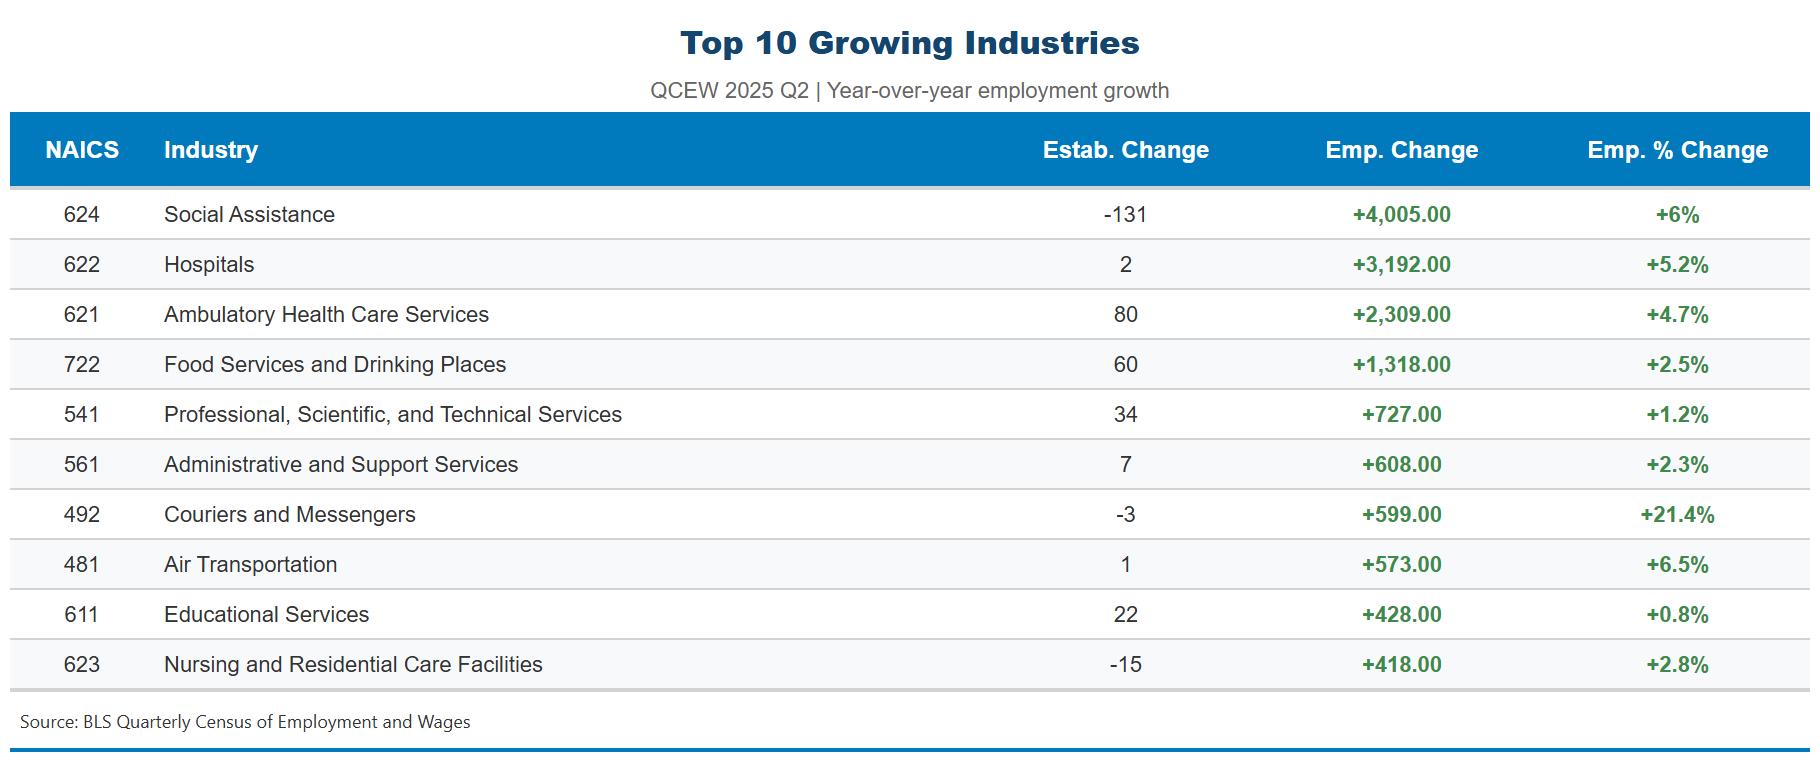
Appendix
From the Quarterly Census of Employment and Wages, this table shows the 10 industry sectors with the largest annual employment growth. These data are released on a roughly six-month delay.
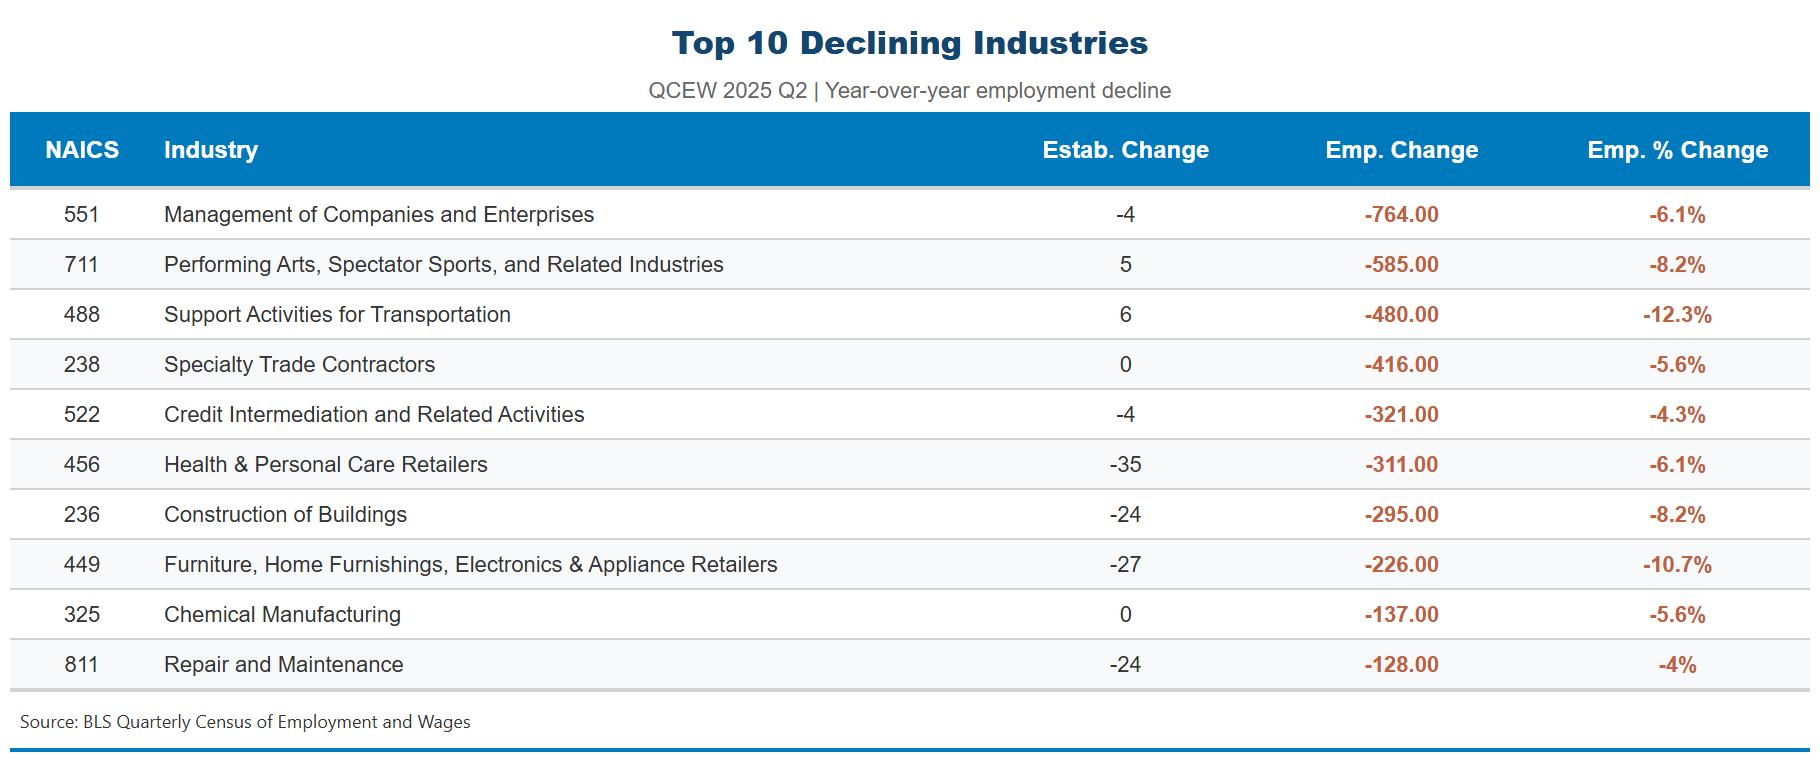
Appendix Table 4: Detailed Industry Sectors in Philadelphia with Largest Year-Over-Year Declines, Q2 2025
From the Quarterly Census of Employment and Wages, this table shows the 10 industry sectors with the largest annual employment declines. These data are released on a roughly six-month delay.
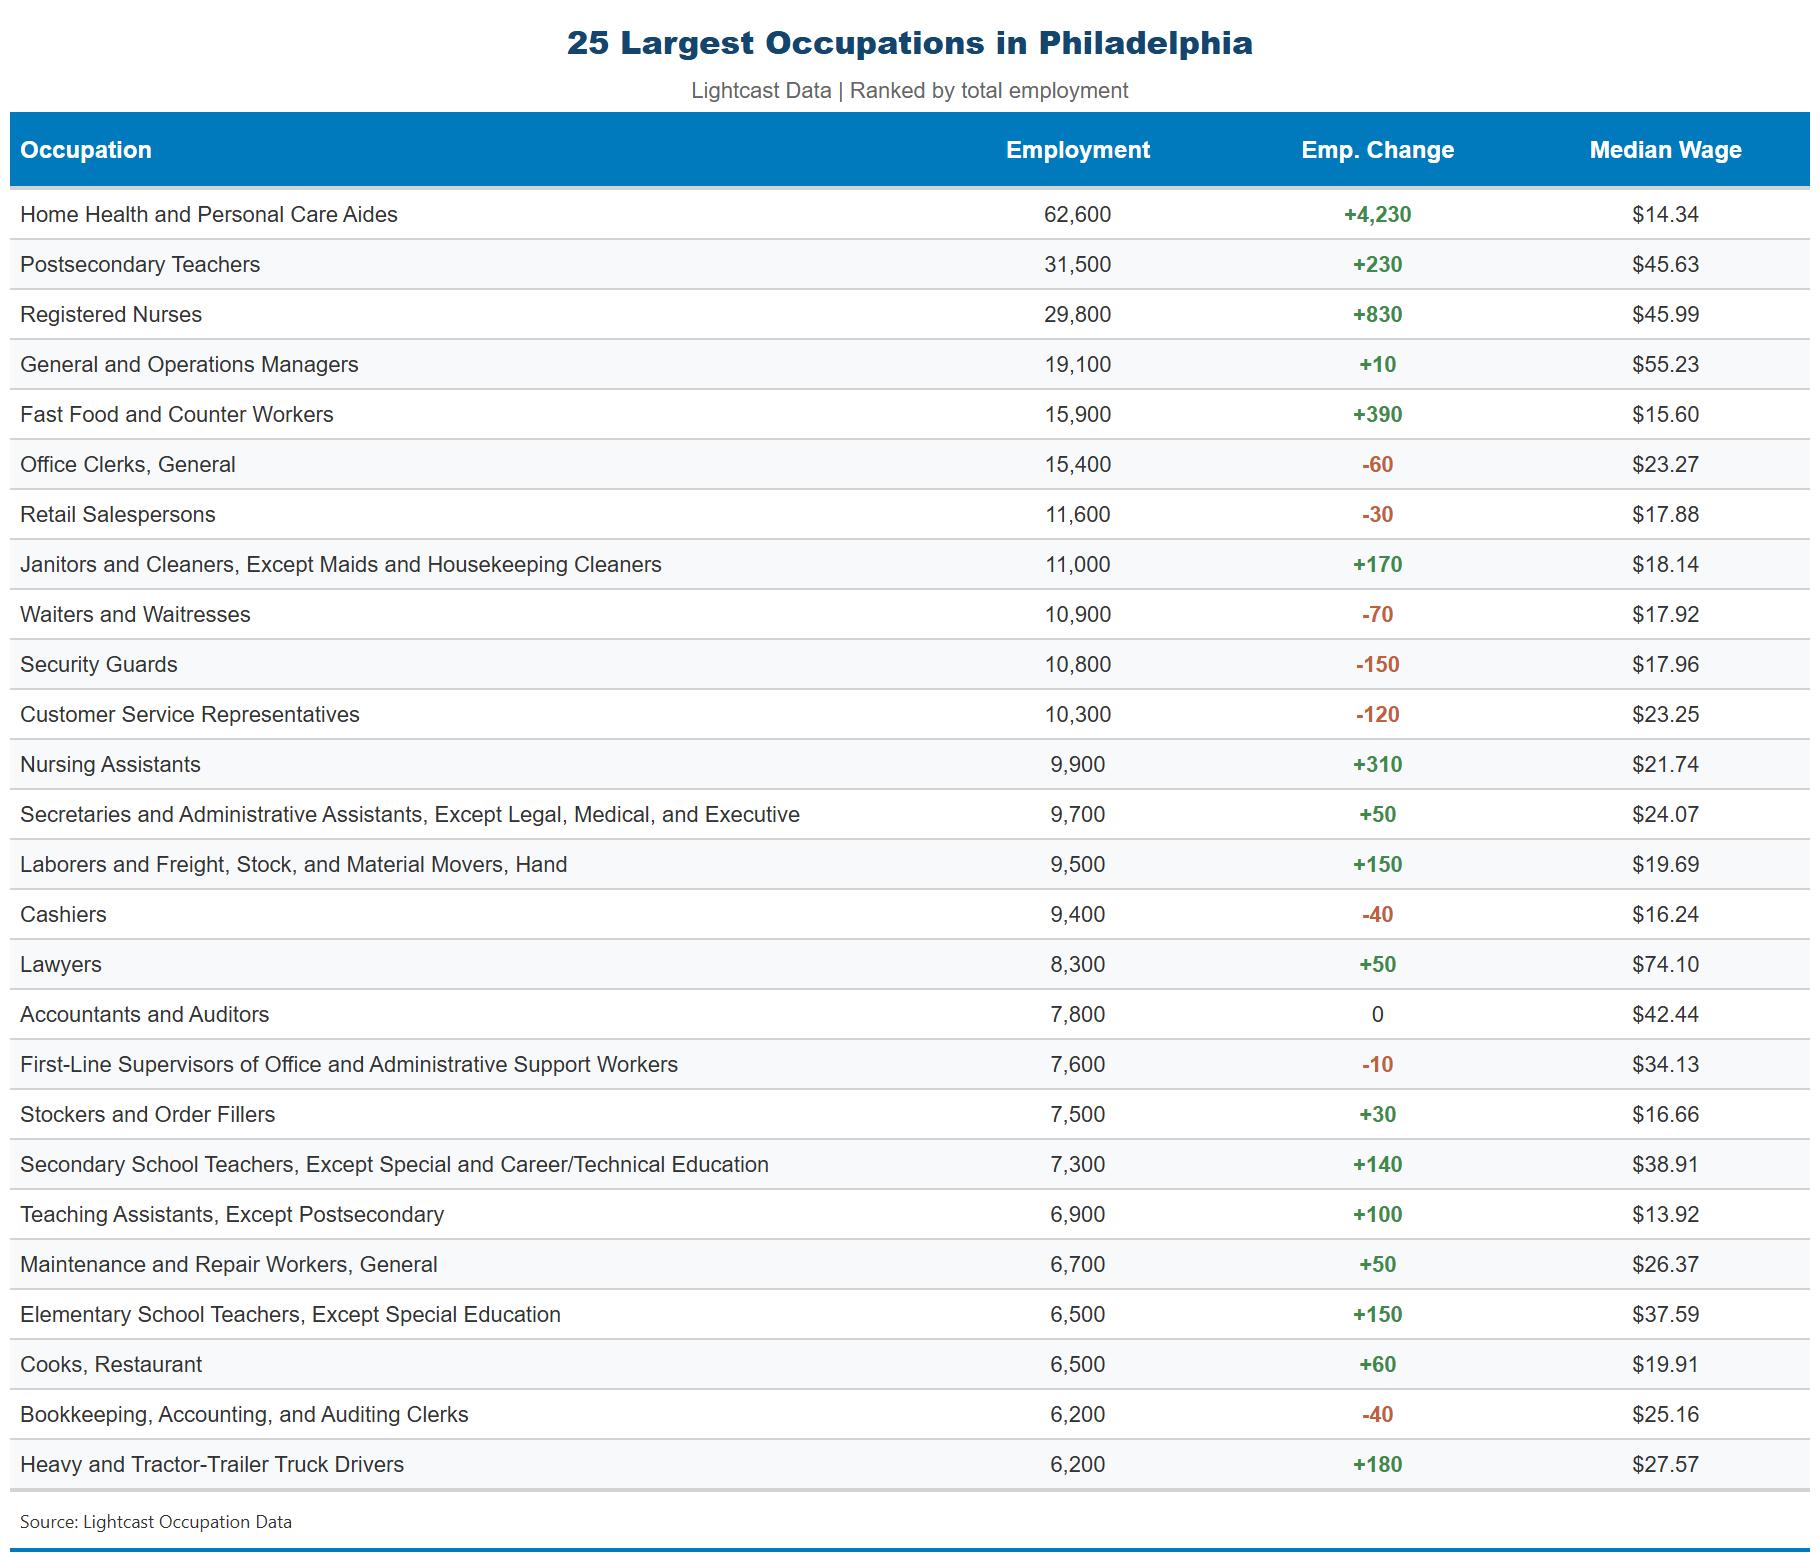
Appendix Table 5: Largest Occupations in Philadelphia with Employment Change from 2025 to 2026
Based on estimates derived from the Quarterly Census of Employment and Wages, this table shows the 25 largest occupation by total employment. These data are released on a roughly nine-month delay.