Philadelphia Works Inc: Quarterly Labor Market Report - April 2026
01 Summary
The latest ongoing research about Philadelphia’s workforce
03
Current Research
The latest ongoing research about Philadelphia’s workforce
07 Labor Force Trend
The most recent data available on Philadelphia’s employment and unemployment
17
Demand
& Wages
The latest job postings, wages growth and inflation
Demographics and geospatial disparity
The document Fueling Philadelphia’s Talent Engine calls on Philadelphia Works, Inc. to serve as the city’s hub of labor market and economic reporting and analysis.
Continued economic growth is critical to the future of our city and region, and is dependent upon a strong, skilled workforce.
Fueling Philadelphia’s Talent Engine
Summary
Using the latest available data, this quarterly update offers insight into Philadelphia’s labor market, industry mix, and economic development.
For more insight into Philadelphia’s labor force, economic characteristics, and the employment dynamics, please visit the Philadelphia Works website.
Philadelphia's labor market enters 2026 with a lack of stability.
Unemployment in the city ended the fourth quarter of 2025 at 4.5%, up fourtenths of a percentage point from a year earlier. The labor force continues to expand, adding 11,259 workers over the year, reaching 787,181 in total. And according to Lightcast, total quarter job postings reach over 44 thousand. However, the wage growth has stalled. Philadelphia Metro private-sector pay rose just 1.6% in the twelve months to December, less than half the 3.1% pace recorded nationally.
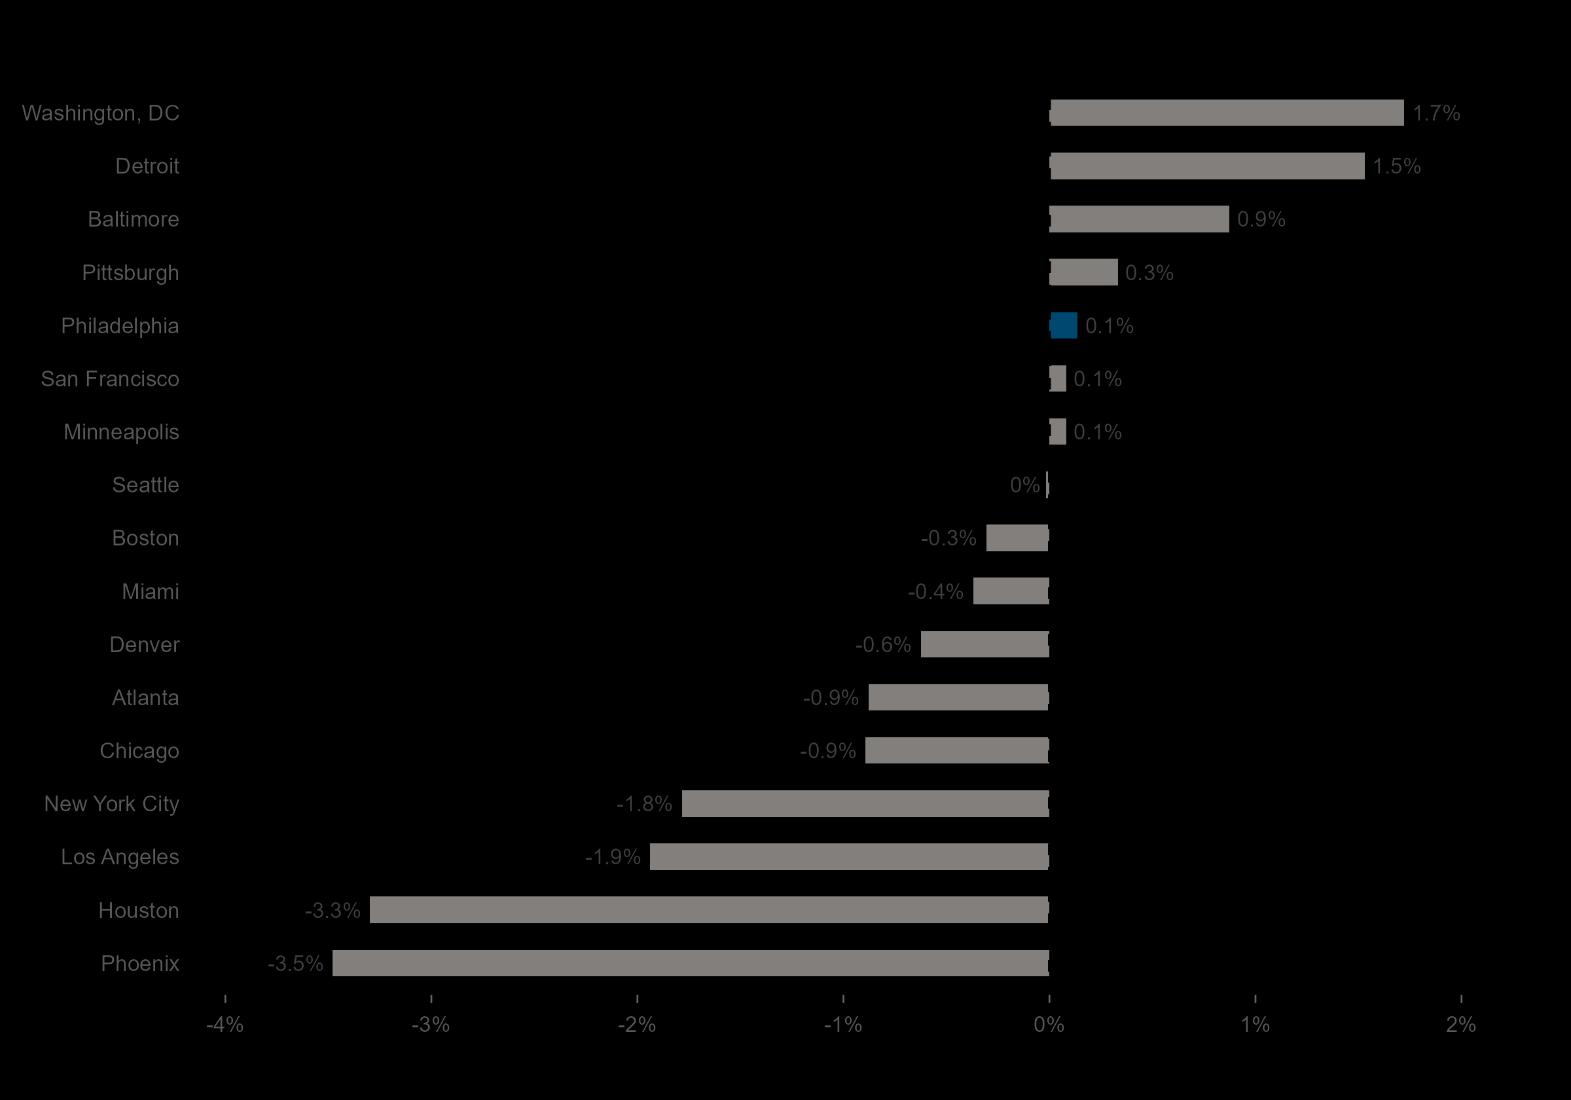
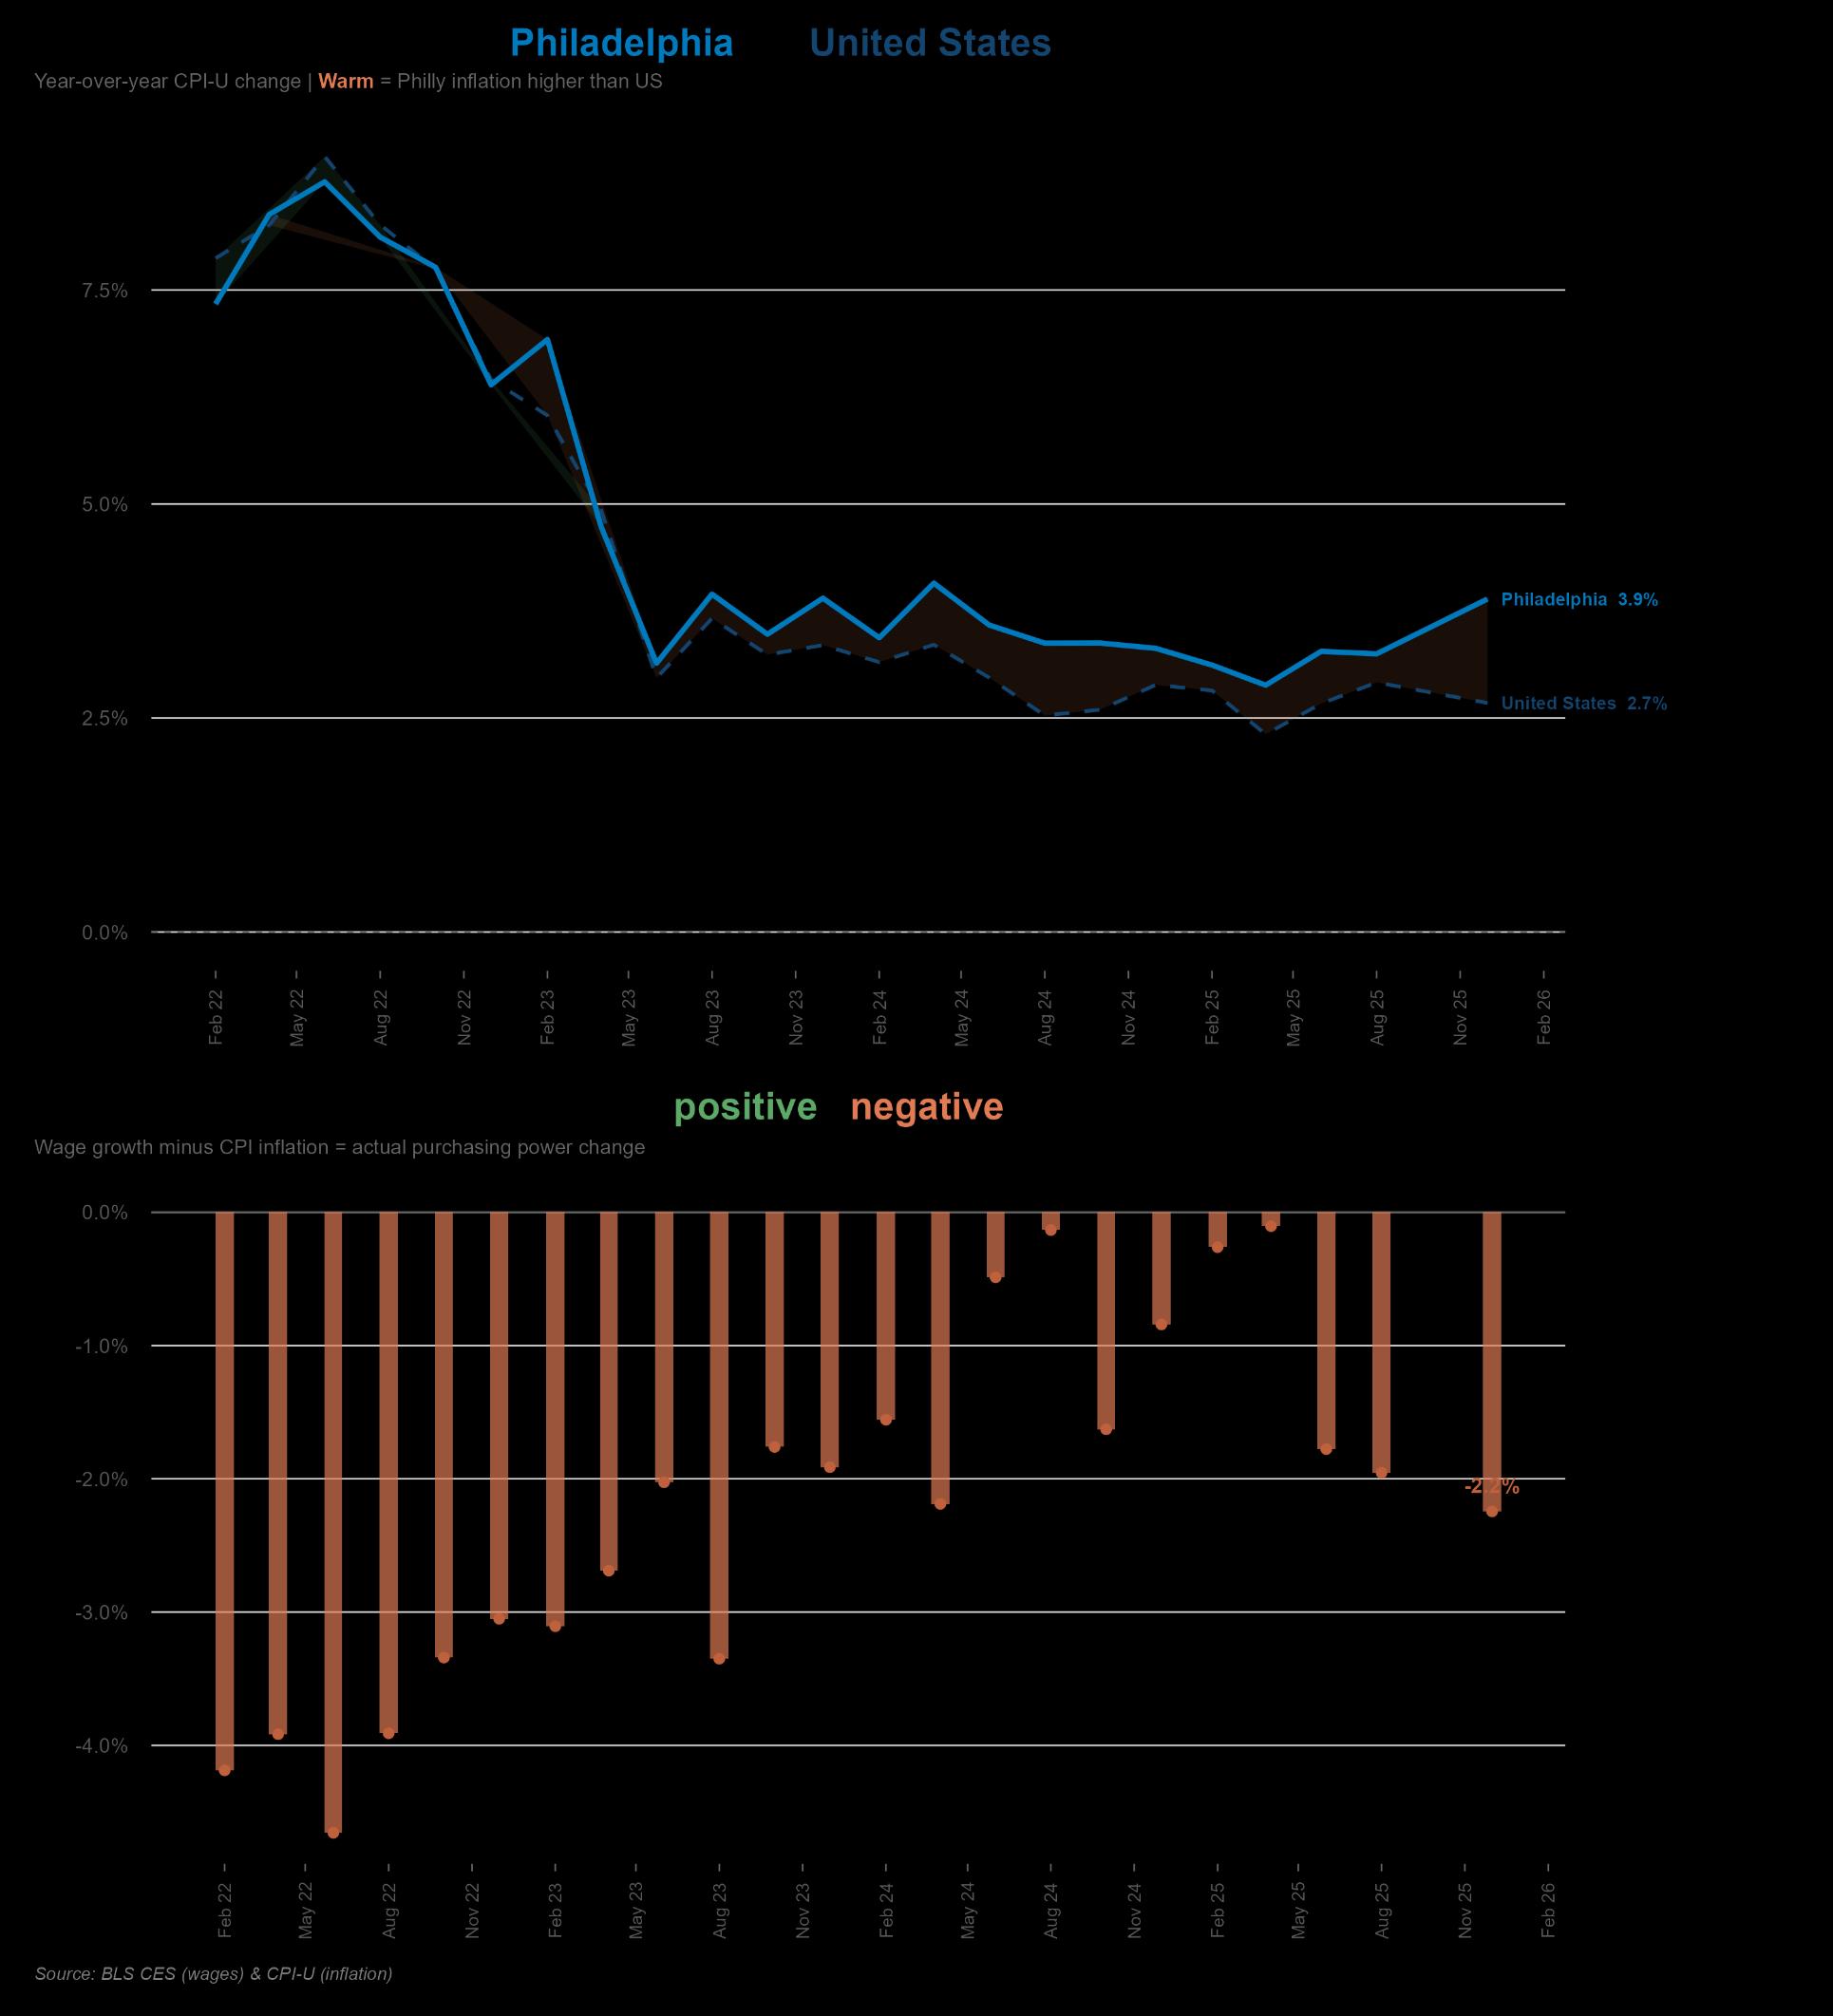
Philadelphia's CPI, at 3.9%, is running more than a full point above the national rate. Also, Philadelphia ranked fifth of seventeen peer metros in two-year employment growth a respectable showing, ahead of New York, Chicago and Los Angeles, but well behind Washington, DC (+1.7%) and Detroit (+1.5%).
Unemployment insurance claims tell a sharper story: 12,251 Philadelphians filed new claims in the fourth quarter 2025, a 15.3% jump from the same months of 2024. Layoffs and terminations account for more than threequarters of those claims.
Current Research
AI Impact Potential on Workforce
Which workers and industries need to prepare for how will their work change due to the new technology?
AI Impact Potential on Workforce in Philadelphia
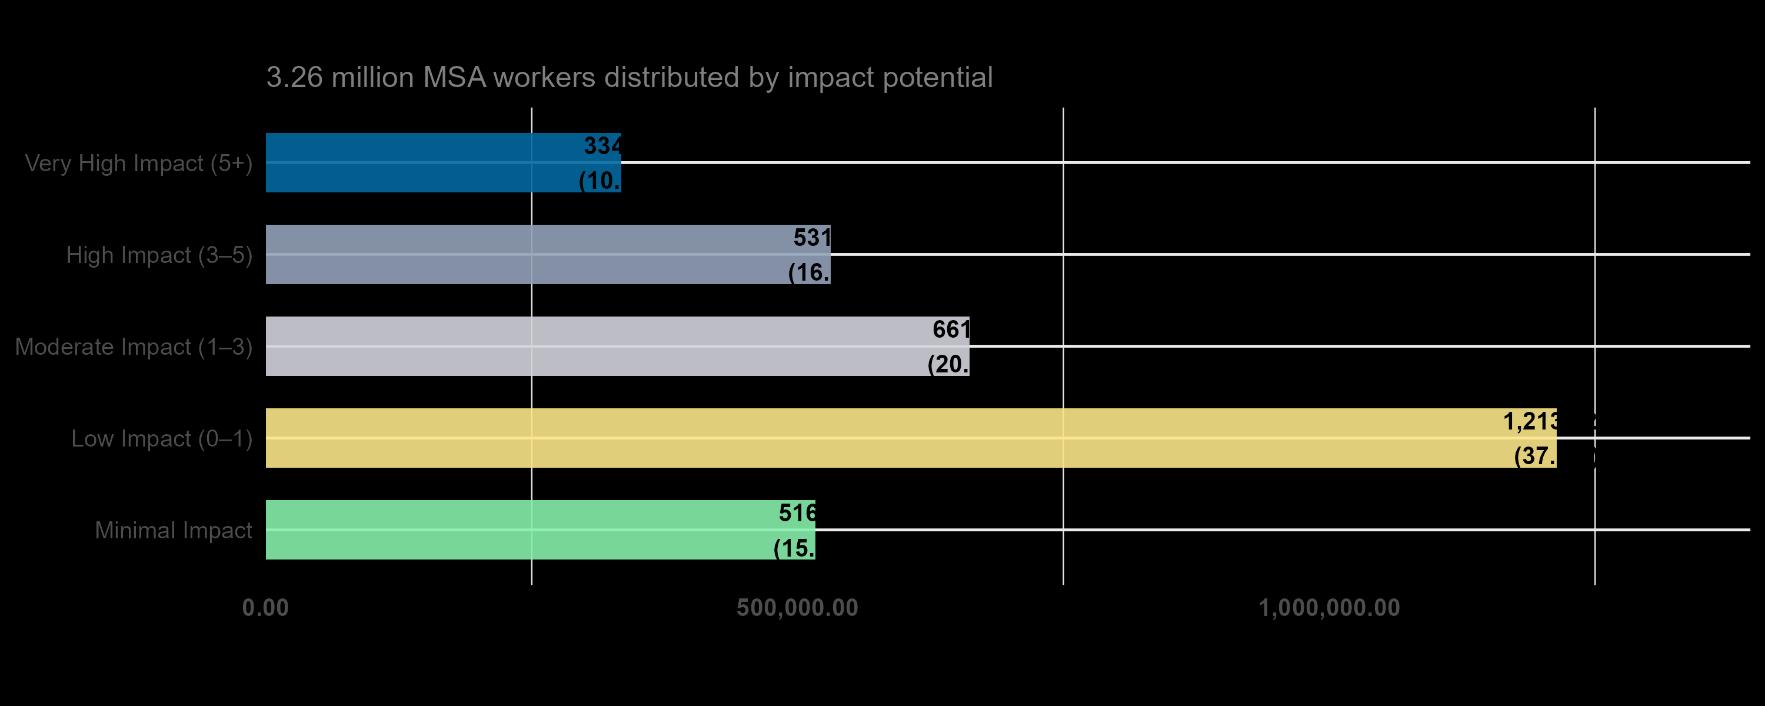
The national conversation about Generative AI and work has largely played out in abstractions: which tasks are “exposed,” how many jobs could be “affected.” This study brings that conversation to Philadelphia. We combine individual-level microdata from the 2024 American Community Survey (25,516 records representing 3.26 million workers) with two recent studies on AI capability and adoption rate to construct an AI Impact Potential Index for Philadelphia MSA labor force. The index does not predict job loss. It identifies where the conditions for Generative AI integration are strongest.
Of the 3.26 million workers in the MSA, roughly 865,000 (26.6%) are in occupations with high or very high AI impact potential. The concentration is not where most people expect. Software developers and data scientists have already integrated AI into daily work.
The largest impact potential sits in administrative, clerical, and salessupport roles, where Generative AI is capable, but the workforce hasn’t adopted it yet. Meanwhile, women face 55% higher impact potential than men, driven almost entirely by concentration in office and administrative positions.
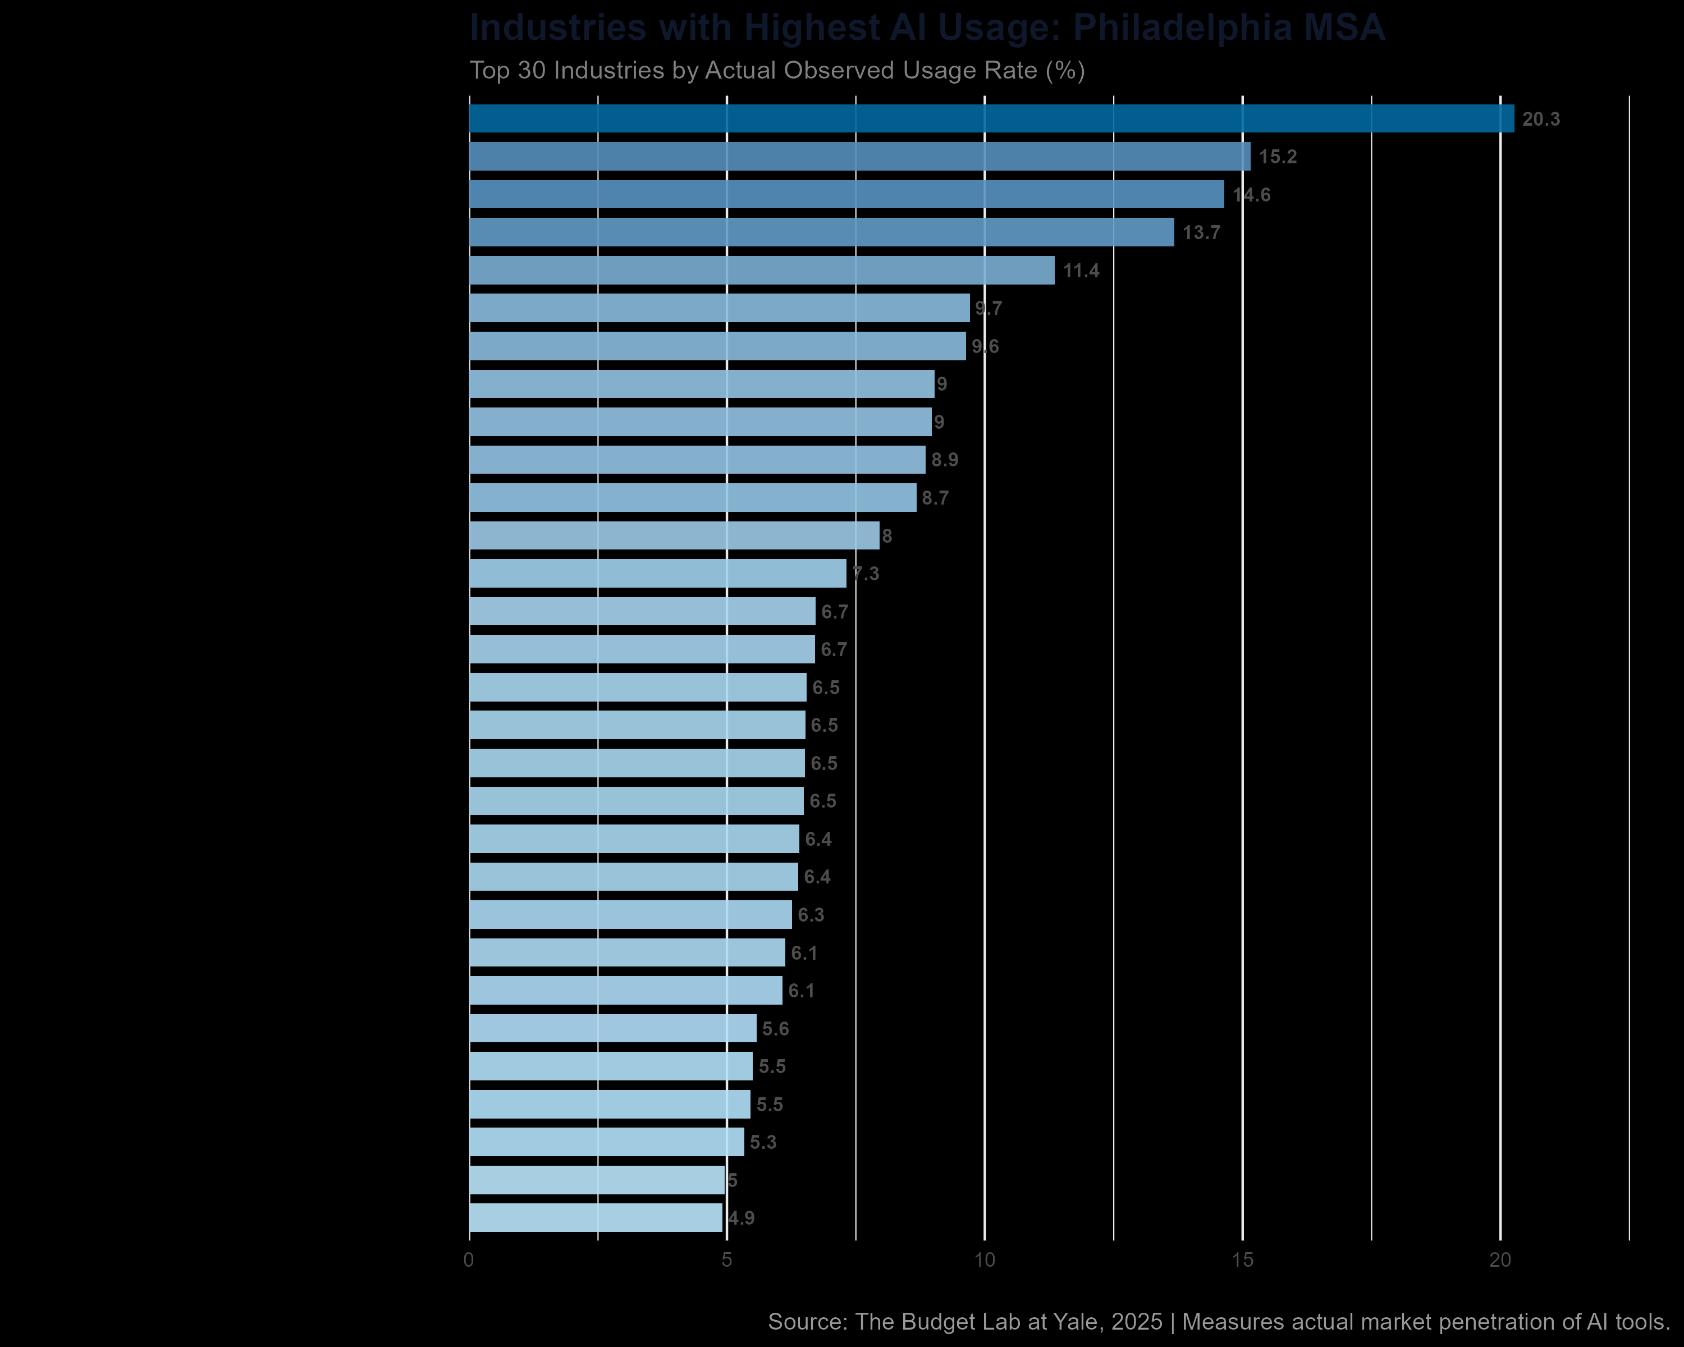
At the industry level within the Philadelphia MSA, the industries with highest current AI usage, cluster in finance, professional services, and information, with a large share of computer and mathematical occupations. Management of Companies leads at 20.3%, followed by Broadcasting (15.2%) and Credit Intermediation (14.6%). Finance and professional services cluster near the top.
Moreover, the industries in Philadelphia MSA that employ the most people in Educational Services and Hospitals all show AI usage rates well below 10%. In short, high employment and high AI adoption rarely overlap.
Labor Force Trend
Quarterly Comparison
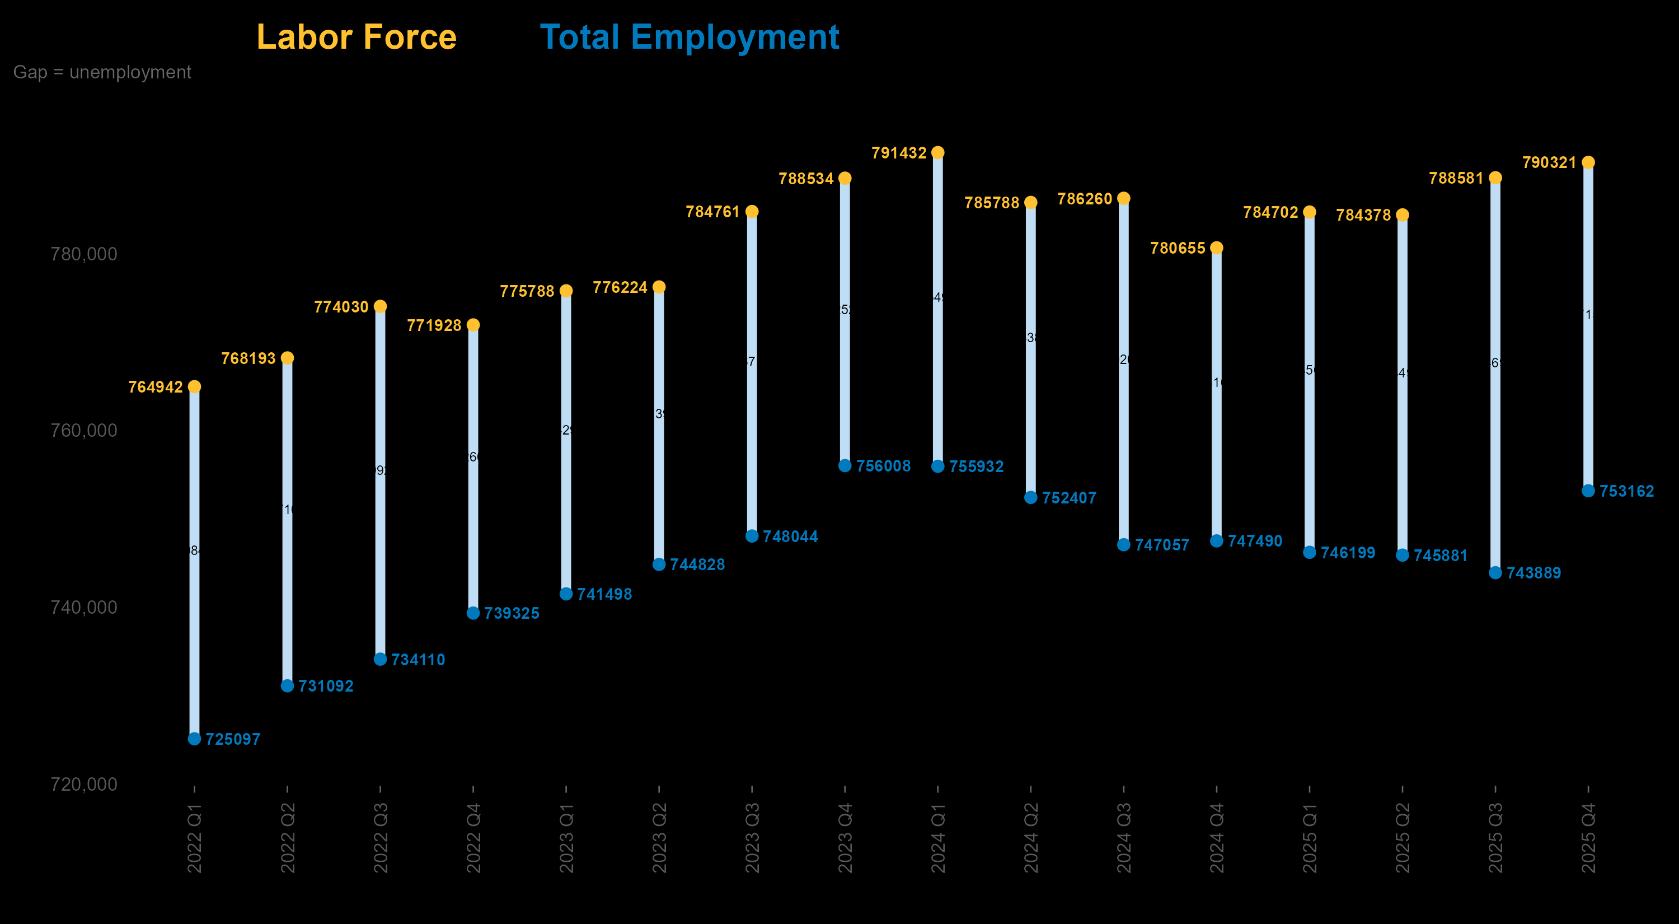
In the fourth quarter of 2025, Philadelphia's labor force averaged 790,321 residents, with 753,162 employed and 37,159 unemployed. Compared with the prior quarter, the labor force expanded by 1,740 workers while employment rose by 9,273, narrowing the ranks of the unemployed for the first time in several quarters.
The gap between the two lines on the dumbbell chart is the city's unemployment pool. That gap has been widening through most of 2024 and early 2025 before closing modestly in Q4. The Q4’s most encouraging data point is that employment growth outpaced labor-force growth for the first time in several quarters. Whether this marks a true turning point or a pause depends on what the unemployment claims and job-postings data show.
Total Labor Force
787,181
Total Employment
751,510 Unemployment Rate
4.5%
Employment & Unemployment
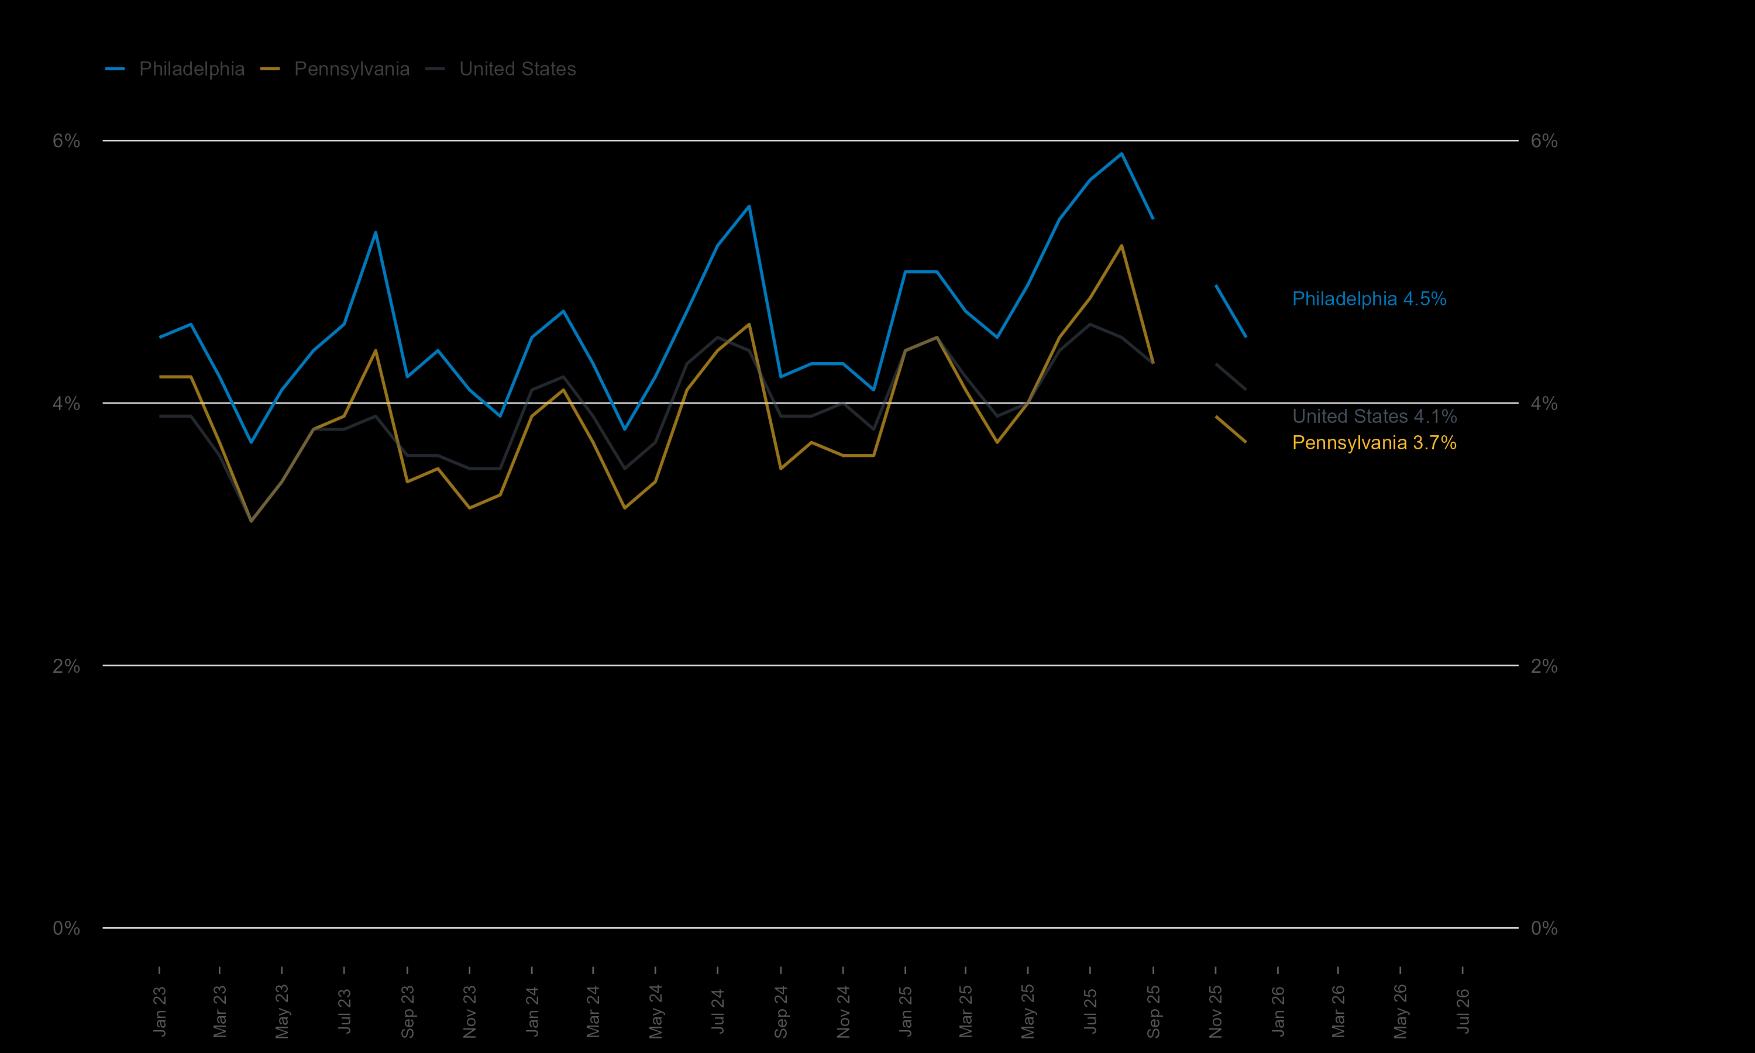
Philadelphia's unemployment premium is structural, not cyclical. At 4.5% in December, Philadelphia's unemployment rate sits 0.4 percentage points above the national rate and 0.8 points above Pennsylvania’s.
Philadelphia's unemployment has never once dipped below Pennsylvania's or the national average in recent memory. The gap is narrowest when the national labor market weakens (bringing the US rate up toward Philadelphia's) and widest when it strengthens.
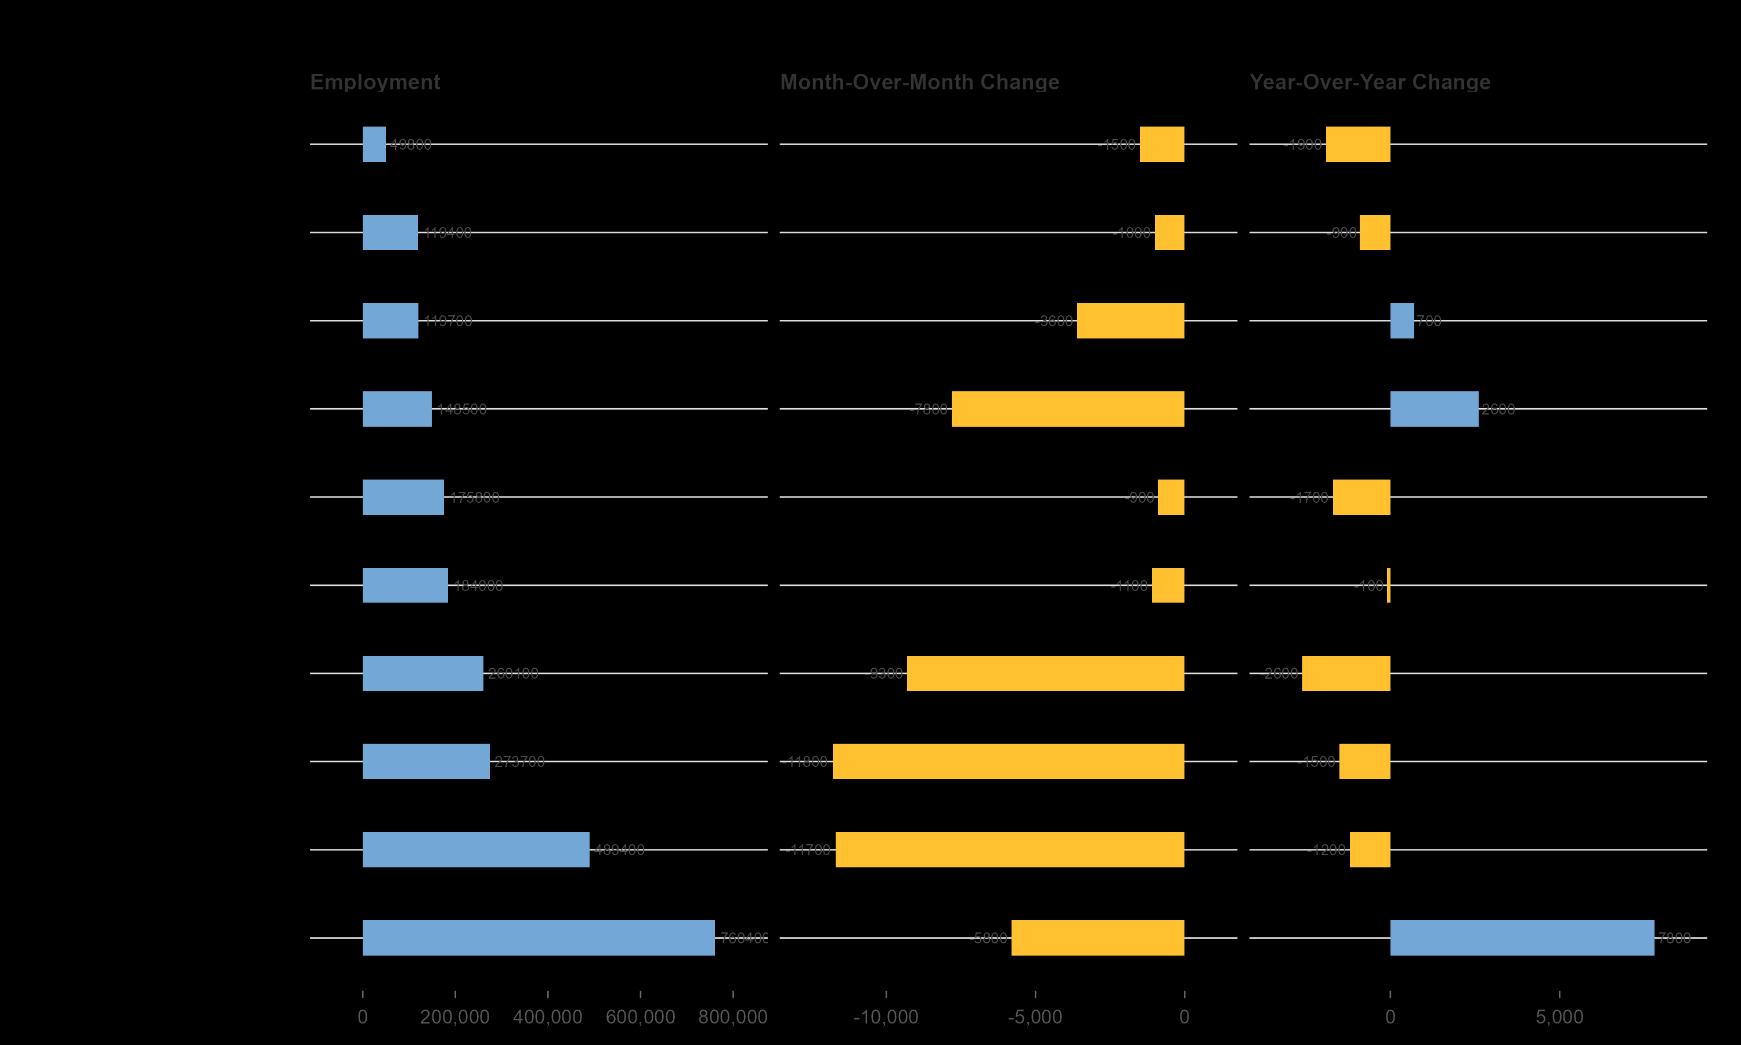
Total nonfarm employment in the Philadelphia MSA stood at 3,096,700 at the end of Q4 2025, down 62,300 month-over-month and 2,100 year-over-year.
The middle panel is almost entirely orange which means every major sector saw monthly employment shrink in December 2025, from Leisure and Hospitality (−11,700) and Education and Health Services (−11,000) to Professional and Business Services (−9,300) and Retail Trade (−7,000).
The year-over-year picture is more mixed but tells the same underlying story. Education and Health Services stands alone as the sector that is genuinely growing (+7,800 jobs over the year), joined only by a small gain in Transportation and Utilities (+2,600). Every other major industry was flat or contracting at the end of 2025.
The Philadelphia MSA, officially the Philadelphia-CamdenWilmington, PA-NJ-DE-MD Metropolitan Statistical Area, is a large metropolitan region in the Northeastern US centered on Philadelphia. It encompasses counties in Pennsylvania (Bucks, Chester, Delaware, Montgomery, and Philadelphia), New Jersey (Burlington, Camden, Gloucester, and Salem), Delaware (New Castle), and Maryland (Cecil).
Across seventeen major US metros, only five posted positive employment growth over the two years from December 2023 to December 2025. Washington, DC led the field at +1.72%, followed by Detroit (+1.53%), Baltimore (+0.87%), Pittsburgh (+0.33%), and Philadelphia (+0.14%). Philadelphia is not growing quickly, but it is holding its ground while most of its peers are not. Modest, steady growth is suddenly a competitive advantage.
Total Unemployment Claims in 2025 Q4:
12,251
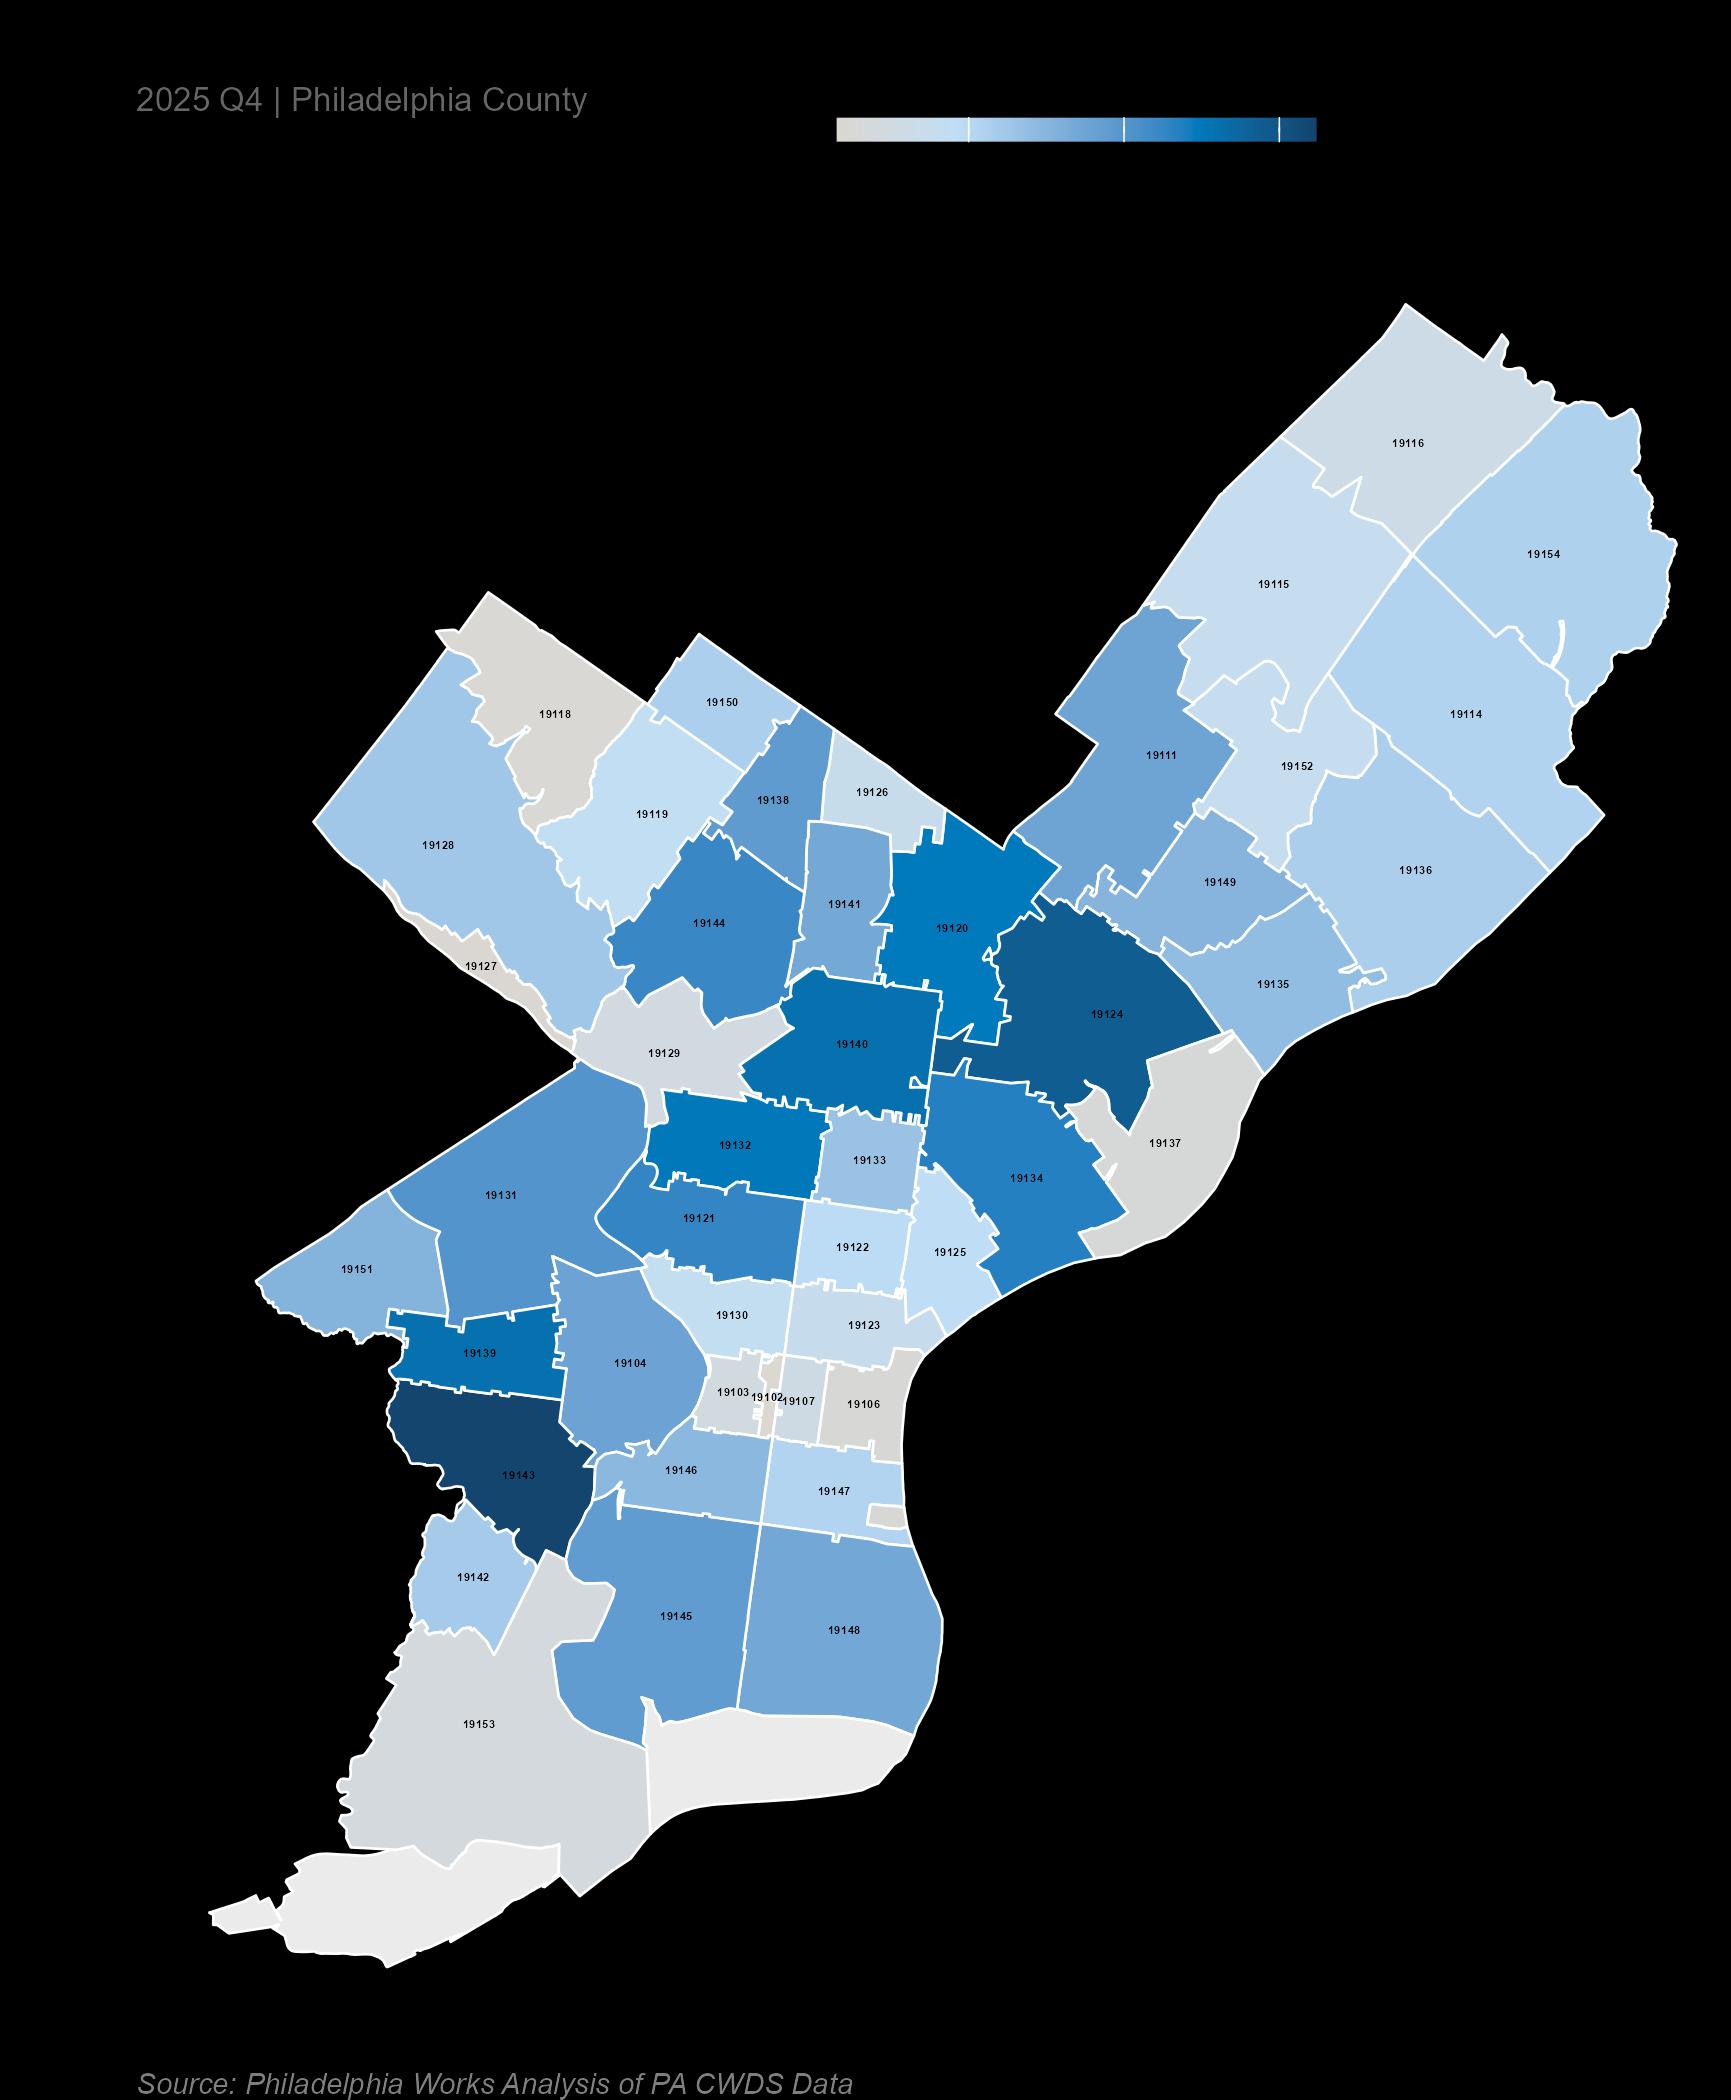
Philadelphia's unemployment claims are not a citywide phenomenon but a neighborhood phenomenon. Unemployment claims concentrate in Southwest Philadelphia (ZIP 19143, the quarter's hottest spot at 647 claims), through West Philadelphia (19139, 521 claims), across North Philadelphia (19132, 19133, 19140), and up into the Lower Northeast and Frankford corridor (19124, 574 claims; 19134; 19120).
Unemployment Claims
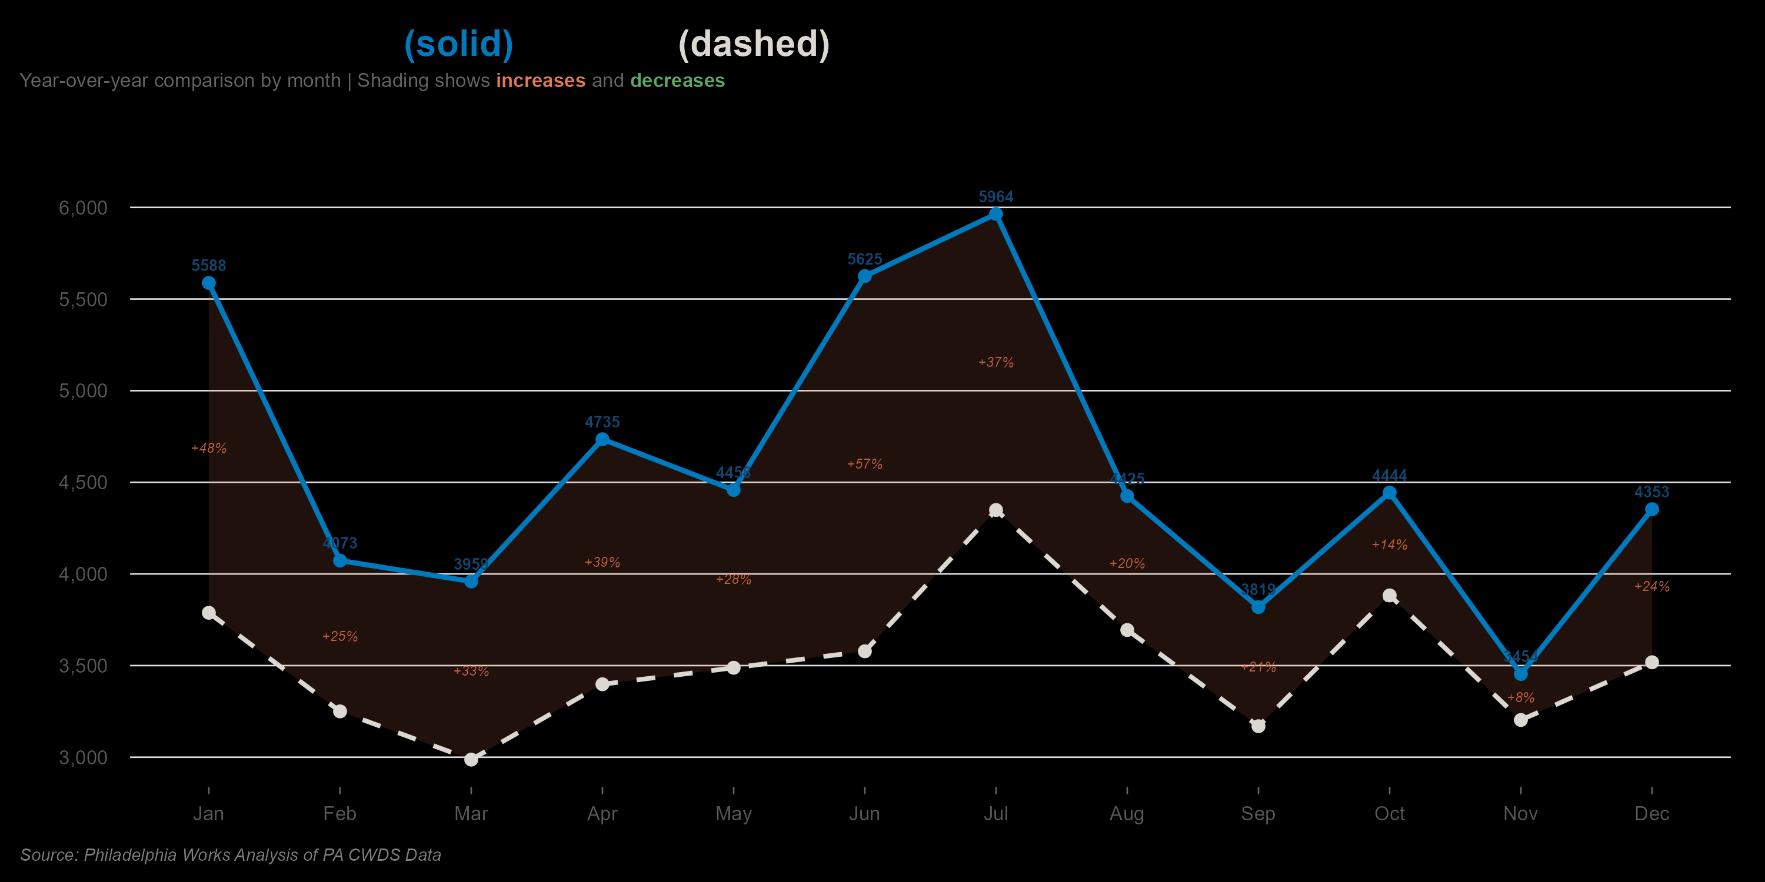
Philadelphia's unemployment rate rose only modestly in 2025, but the flow of new claimants rose sharply. The Pennsylvania Commonwealth Workforce Development System recorded 12,251 unique new claimants during Q4 2025, a 15.3% increase over the same months of 2024, and a far steeper rise than LAUS unemployment rates alone would suggest. BLS LAUS data measures labor-force status in a reference month. UC Claims measure the flow of newly separated workers into the benefits system. When the flow accelerates faster than the stock, the underlying churn is rising even if the headline rate looks stable.
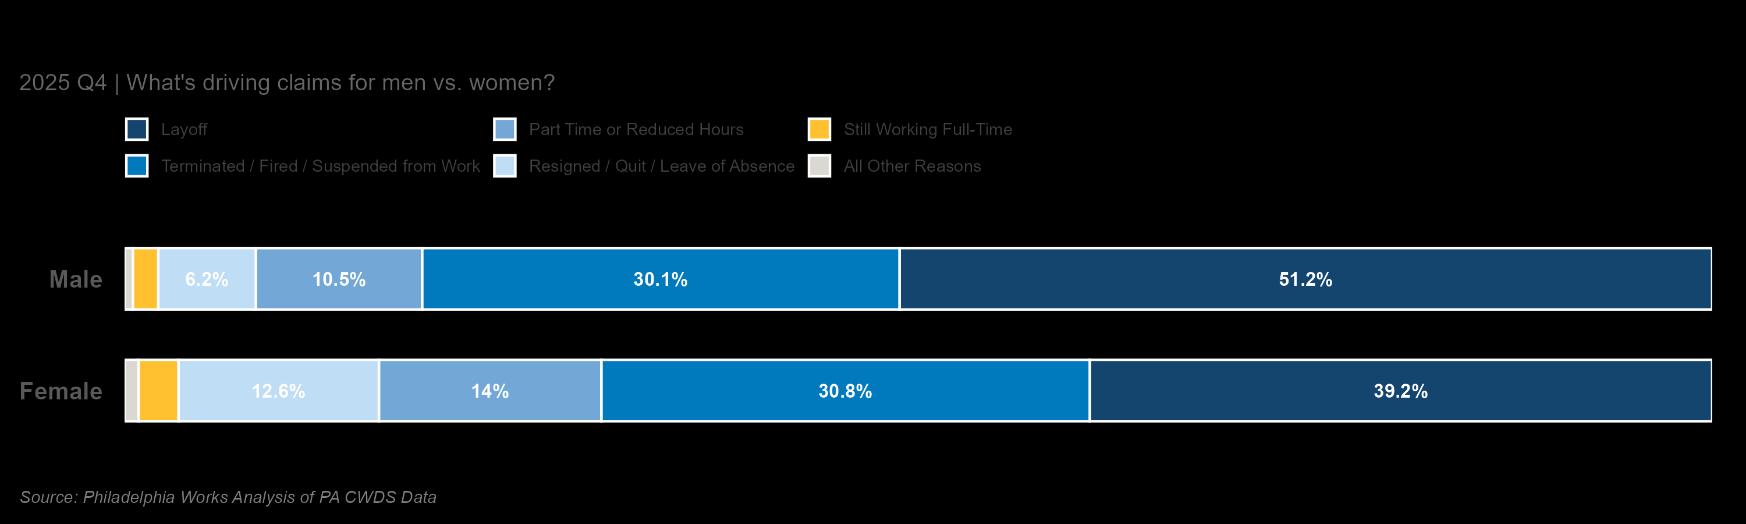
The breakdown of leaving reasons is unambiguous. Layoffs accounted for 45.2% of all 2025 Q4 claims, and terminations, firings, or suspensions added another 30.4%. Together, employer-initiated separations make up threequarters of new claims. Part-time or reduced hours accounted for 12.3%. Only about 10% of claims came from voluntary resignations.
When separation reasons are broken out by gender, a clear pattern emerges. Men are disproportionately represented in layoffs and in construction-related reduced-hours separations, basically from sectors that employ more men and that tend to shed workers first in a downturn.
Women are more heavily represented in terminations and in reduced-hours separations from retail, hospitality, and administrative support.
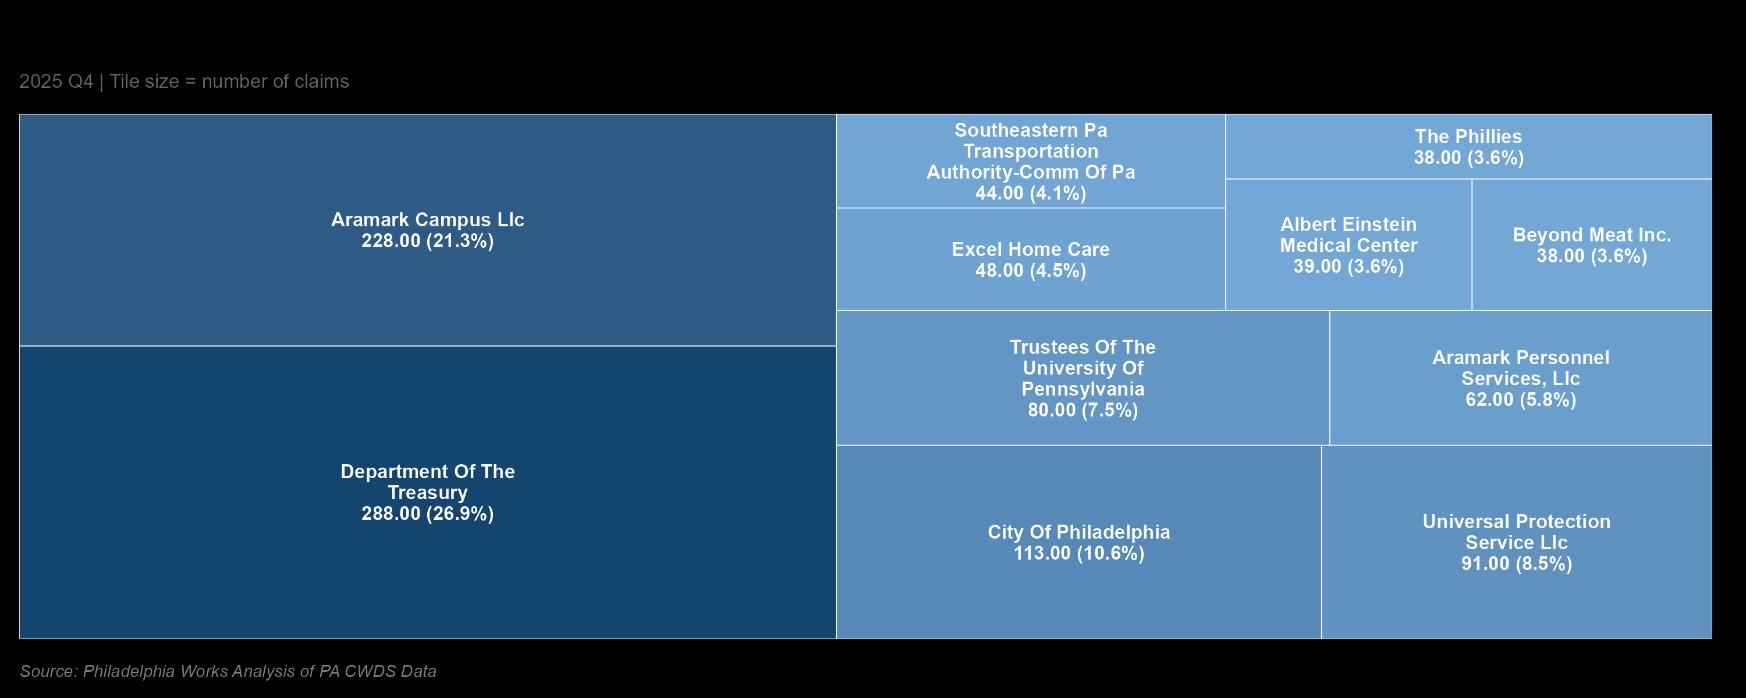
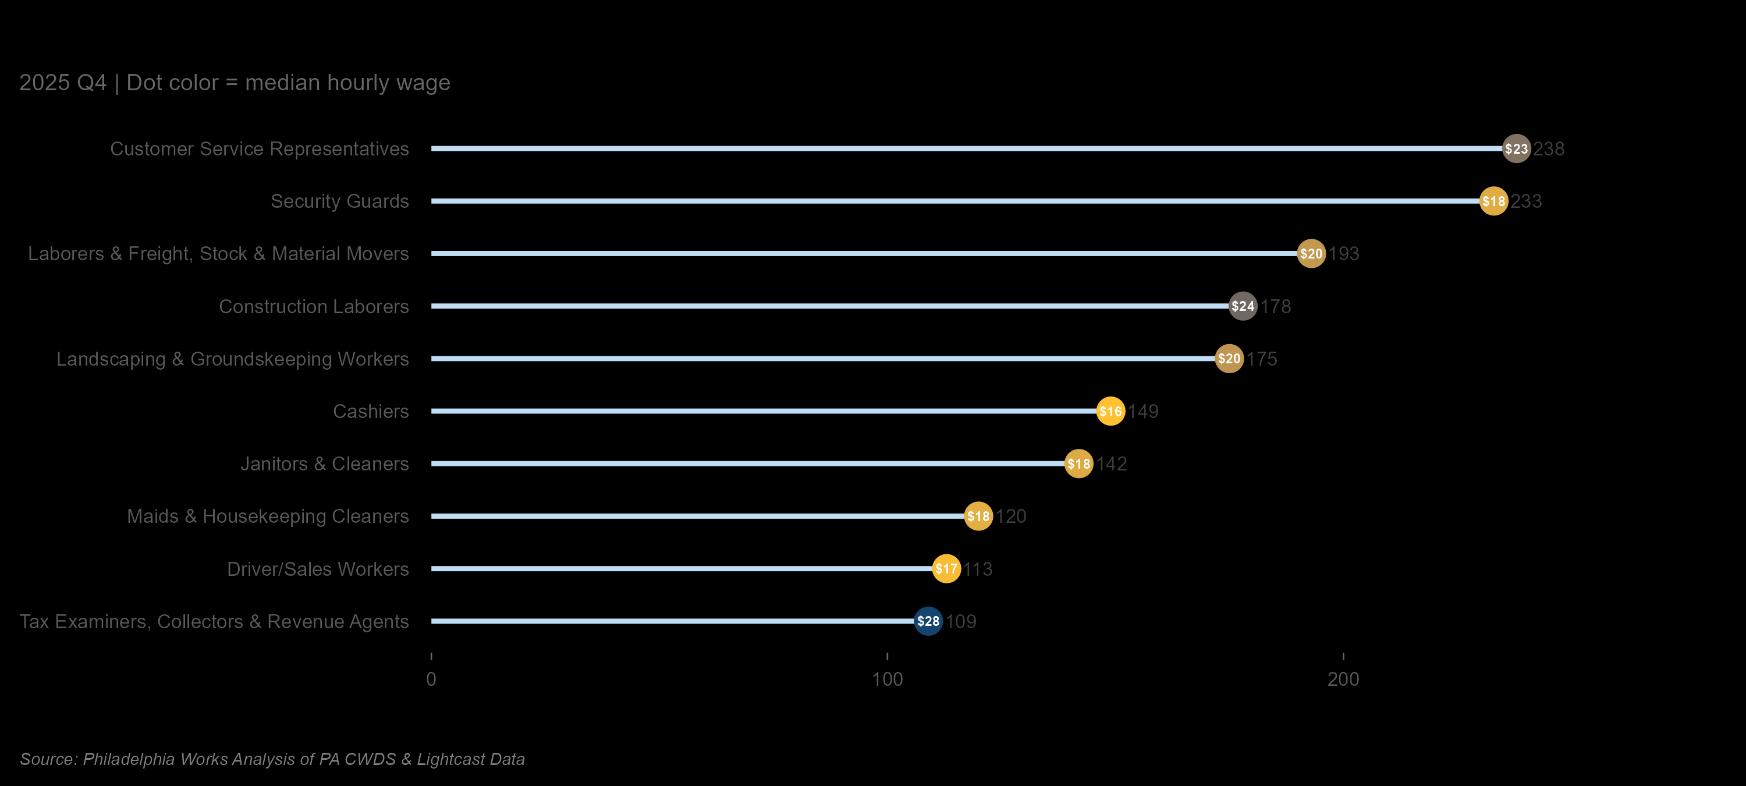
The employers having the most unemployment claims in Philadelphia are large institutional employers that rely heavily on contract, contingent, or seasonal workforces. The occupations generating the most claims are low-wage, lowcredential, and high-turnover. Not one of the top five pays above $25 per hour at the median. These workers need fast, practical services including benefits enrollment assistance, same-day job matching, short-cycle skills programs (security guard certification, CDL training, healthcare CNA).
Demand & Wages
Job Postings Trend
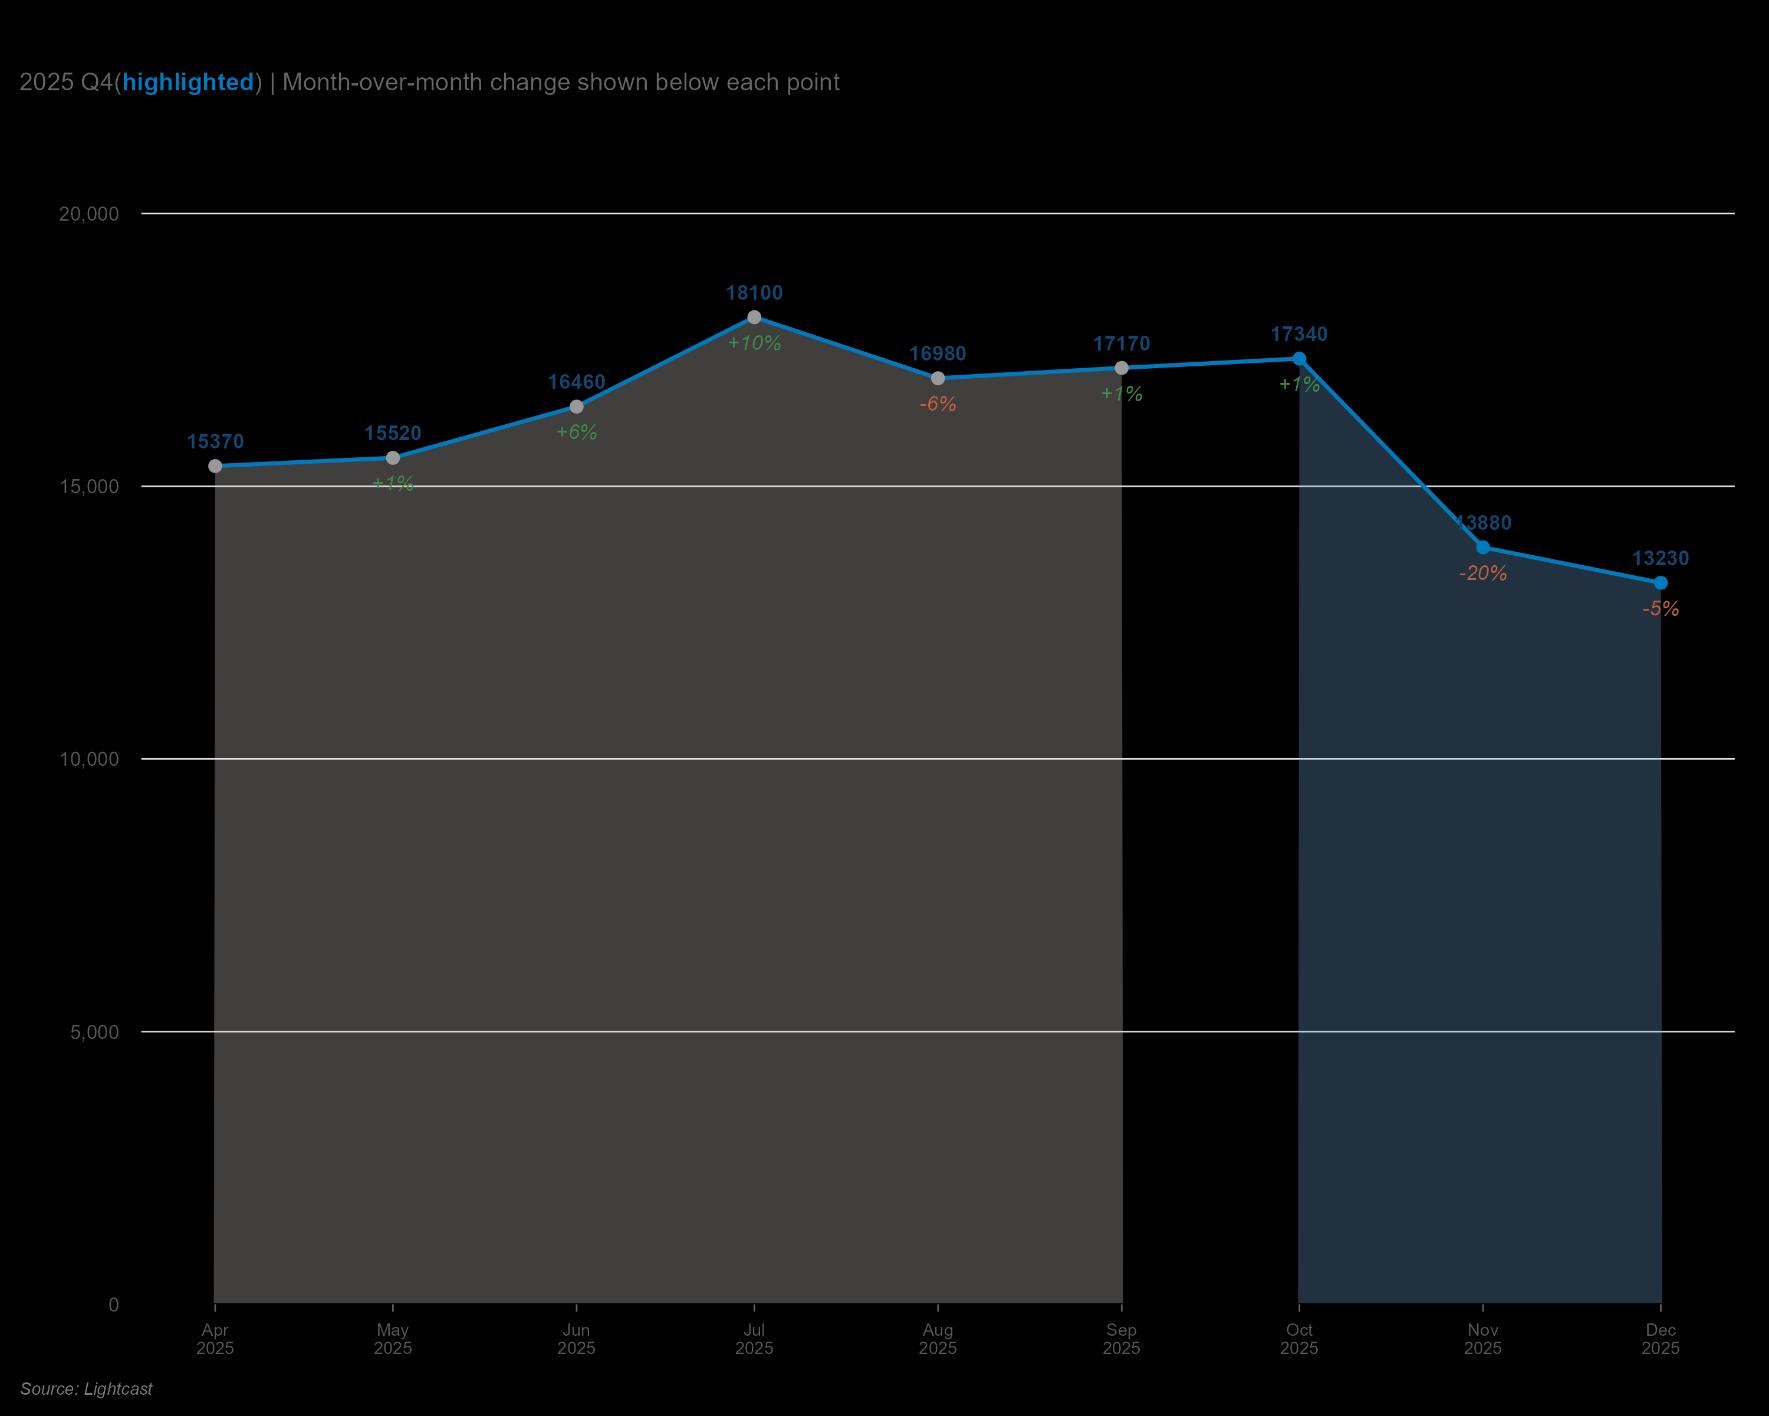
According to Lightcast, Q4 2025 quarter (October through December) totaled 44,450 unique postings.
Unique job postings climbed steadily from 15,370 in April to a peak of 18,100 in July 2025. After a brief August pullback, postings steadied in the 16,980–17,340 range through September and October. November job postings collapsed by 20% to 13,880, and December slipped another 5% to 13,230, which is the lowest monthly total of the nine-month window.
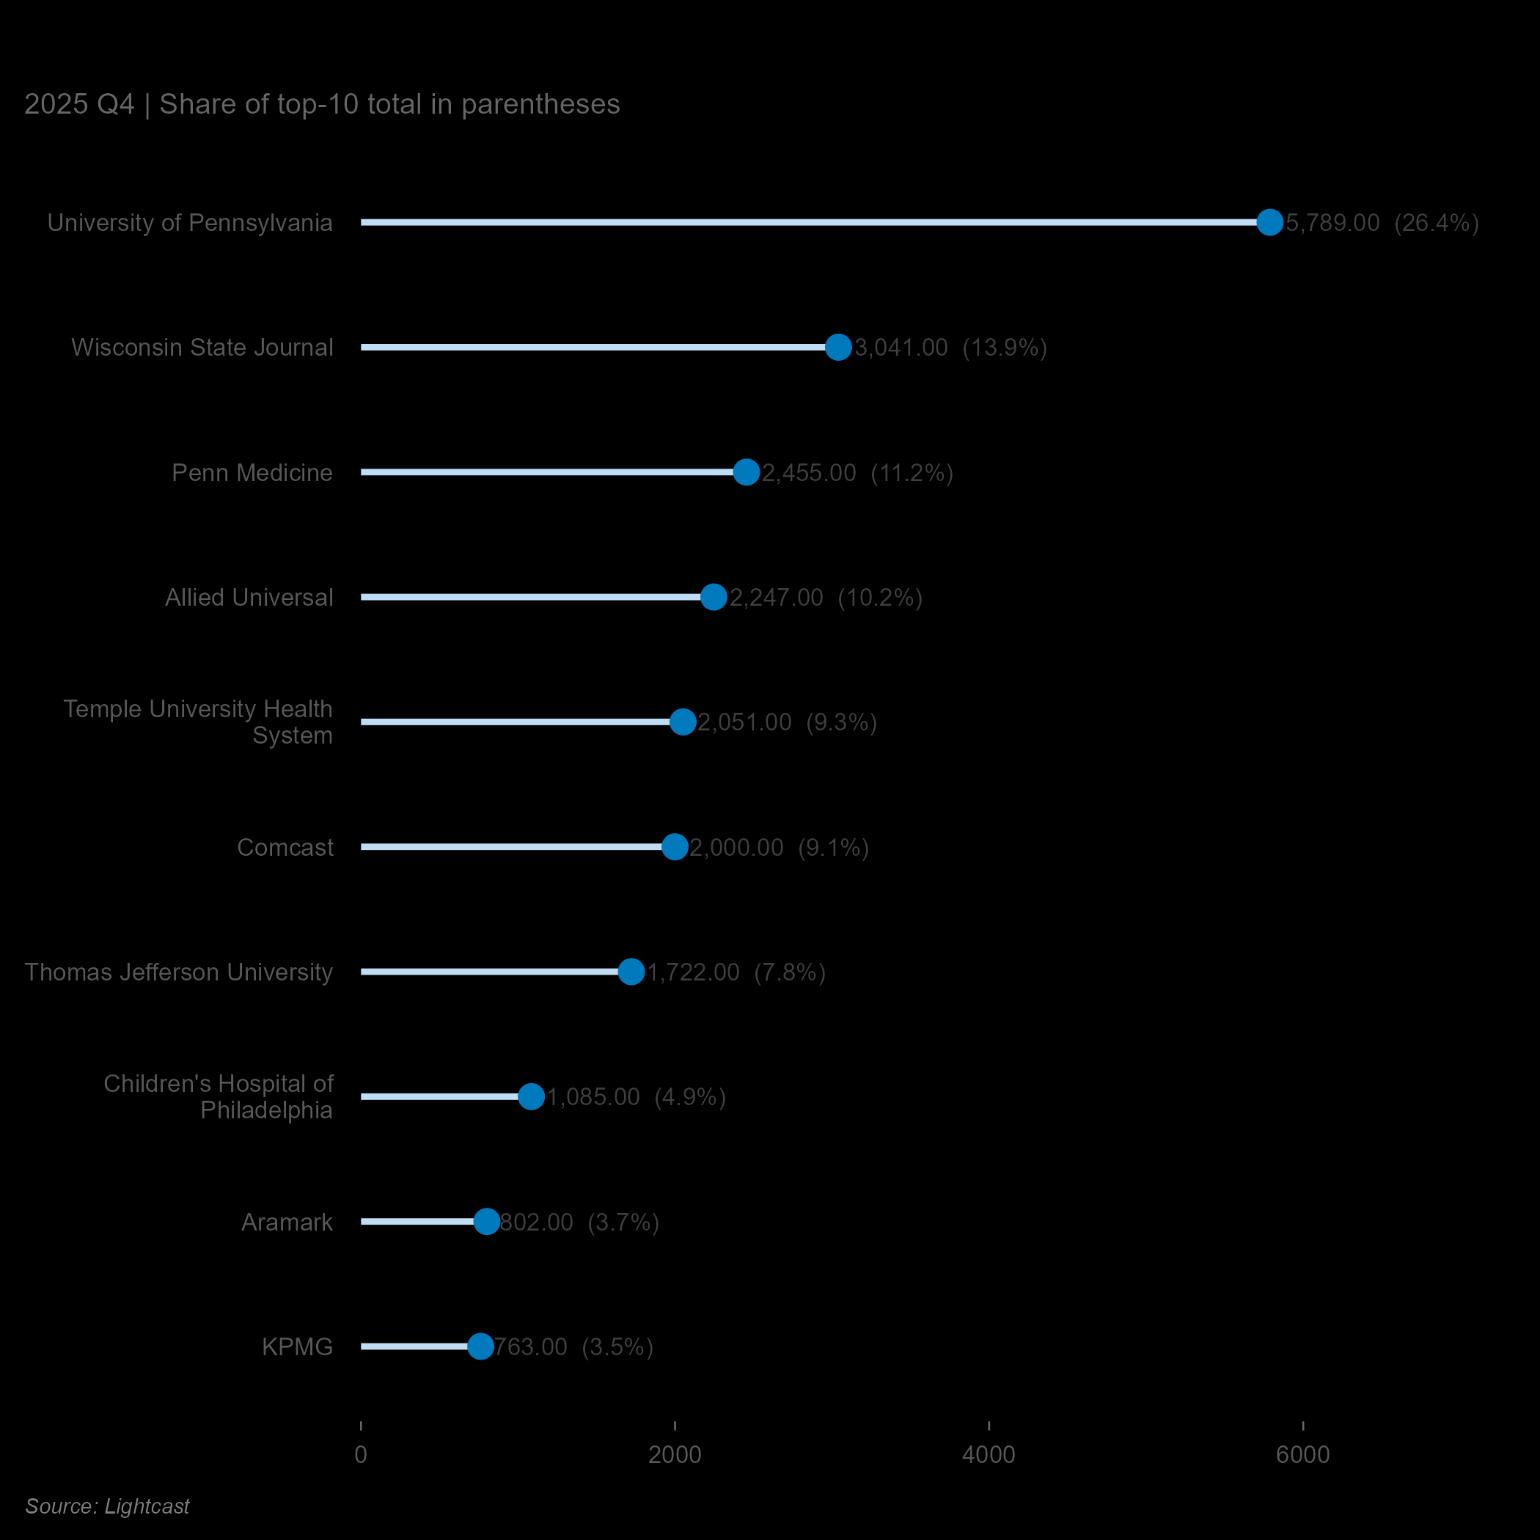
Philadelphia's top-posting employers are clustering in Educations and Healthcare. The University of Pennsylvania alone accounts for more than one in four postings on the list, and the Penn-affiliated entities (UPenn, Penn Medicine, CHOP) together represent 42.5% of the top-10 total.
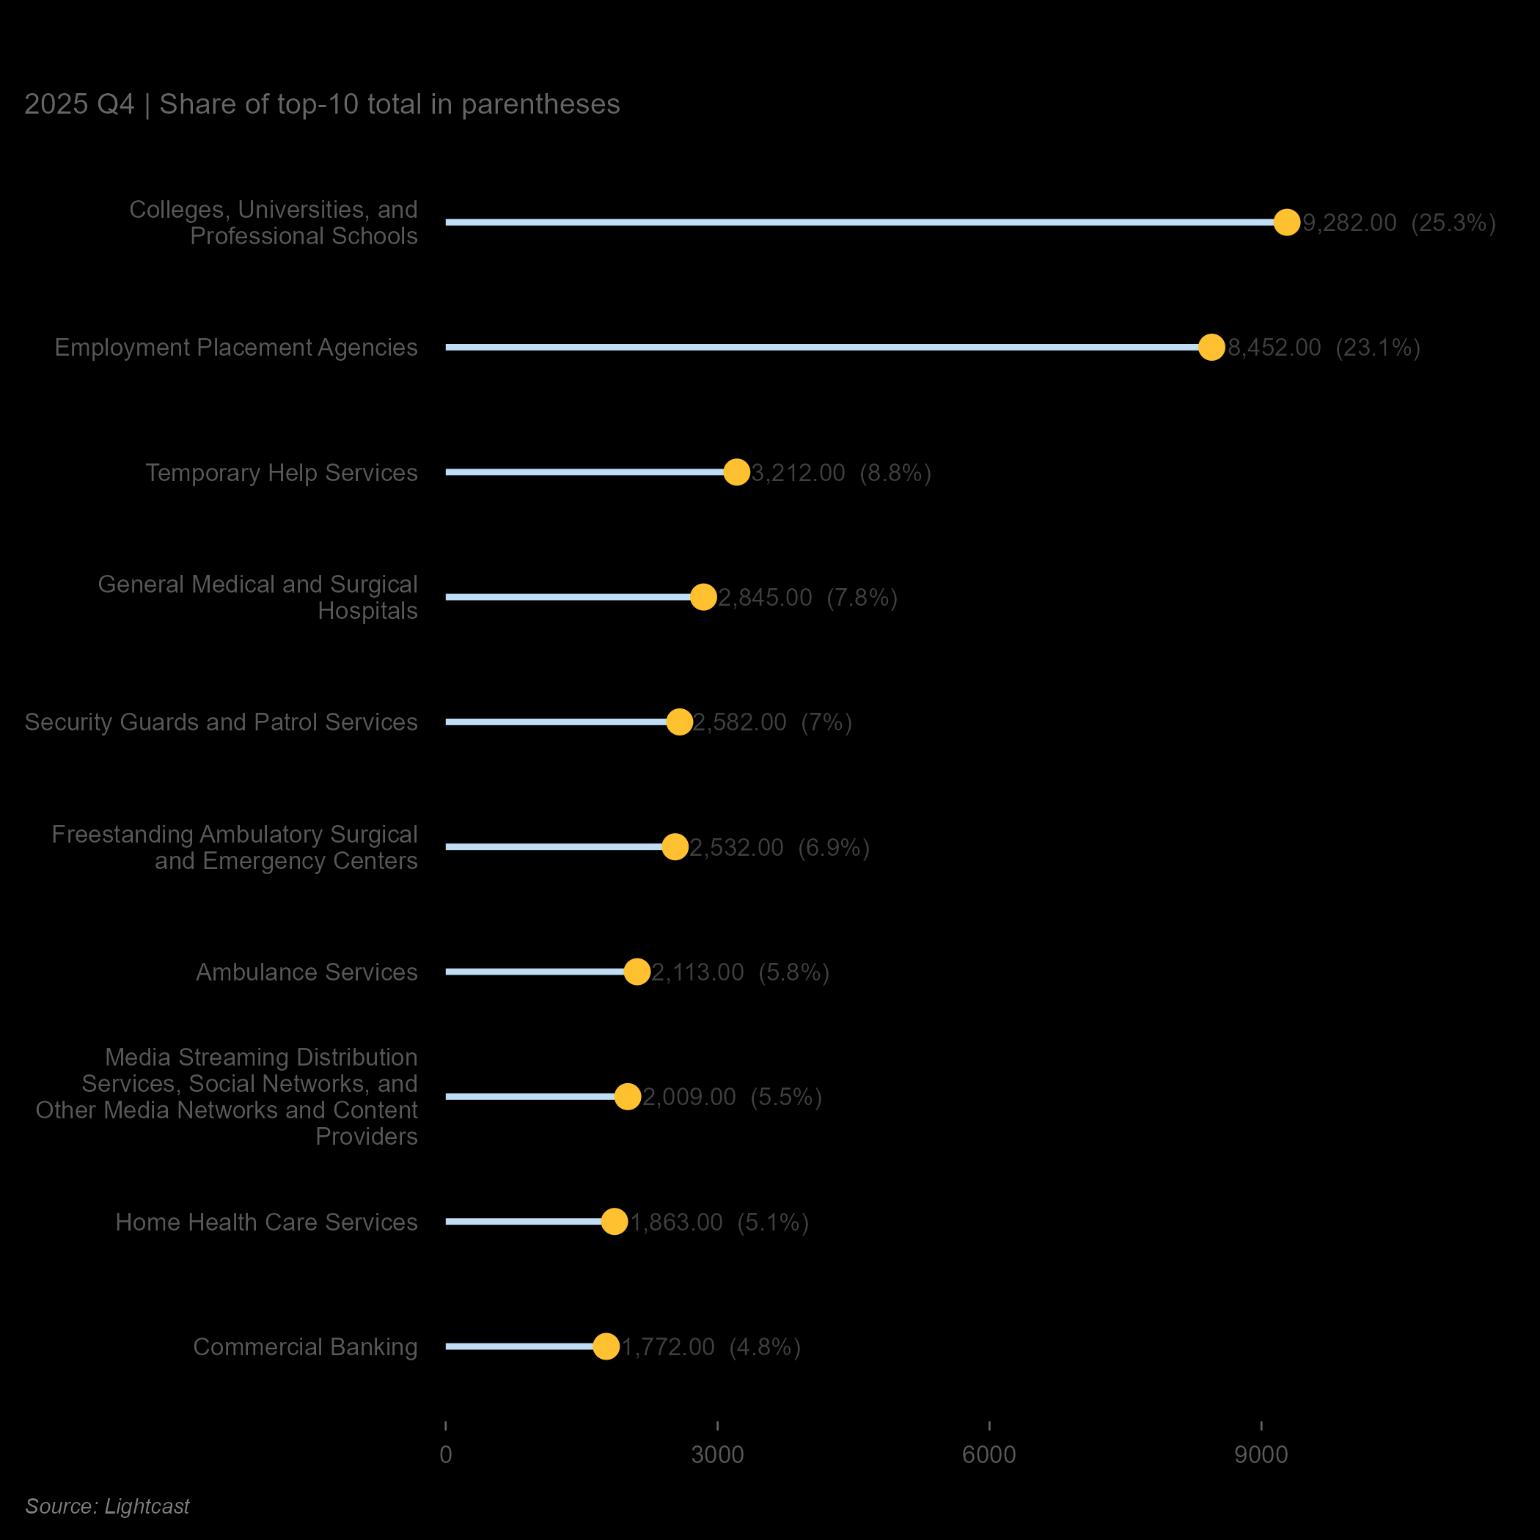
At the industry level, the same story is visible but more structural. Colleges, Universities, and Professional Schools led all industries with 9,282 postings (25.3%) of the top-10 total. But the second-largest industry is arguably more revealing: Employment Placement Agencies posted 8,452 jobs (23.1%), and Temporary Help Services added another 3,212 (8.8%). Taken together, staffing intermediaries account for 31.9% of Philadelphia's top-10 job postings. Roughly one in three of the city's highest-volume job listings is being posted not by the firm doing the hiring but by an agency placing workers at other firms.
The Philadelphia’s labor market employs more people than before, but pays them less, in real terms, than it did two years ago.
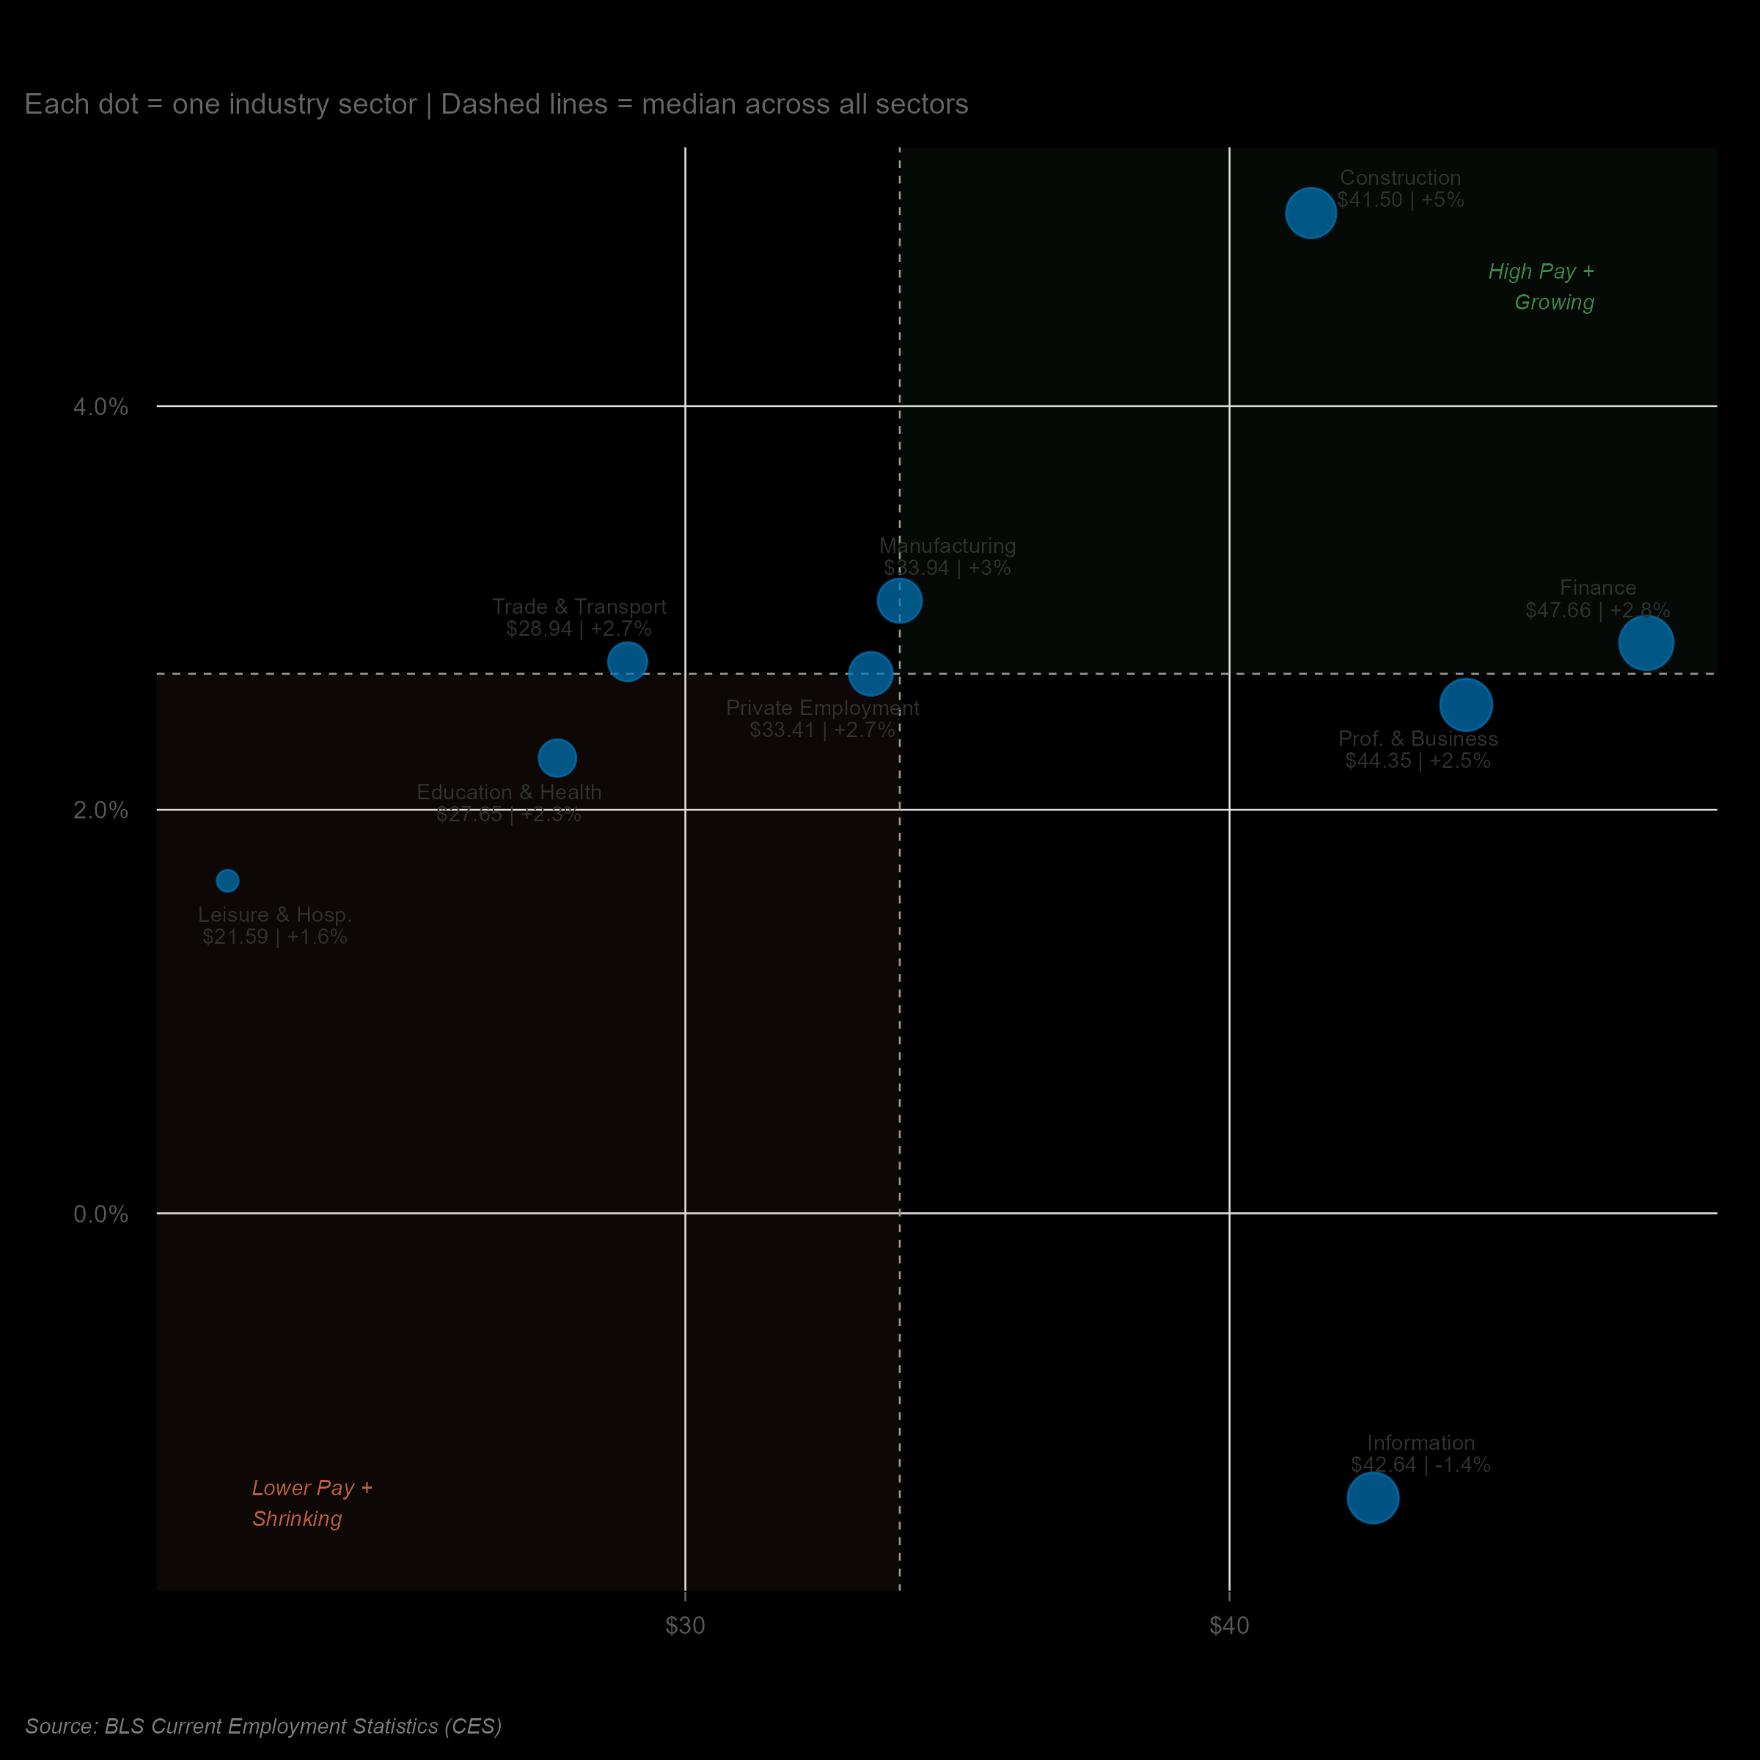
Construction leads Pennsylvania on both measures at $41.50/hr and +5.0% YoY, also the only sector clearing the state's 3.9% inflation rate. Finance ($47.66, +2.8%) and Manufacturing ($33.94, +3.0%) round out. At the opposite corner, Information stands alone as the report's only sector with falling nominal wages ($42.64, –1.4%).
The remaining sectors split along the state's median wage and growth lines. Professional & Business Services ($44.35, +2.5%) anchors the high-pay, slow-growth quadrant alongside Information. Trade & Transport ($28.94, +2.7%) catches up from a lower wage base.
However, Education & Health ($27.63, +2.3%) and Leisure & Hospitality ($21.59, +1.6%) are the two sectors in the lowpay, low-growth group.
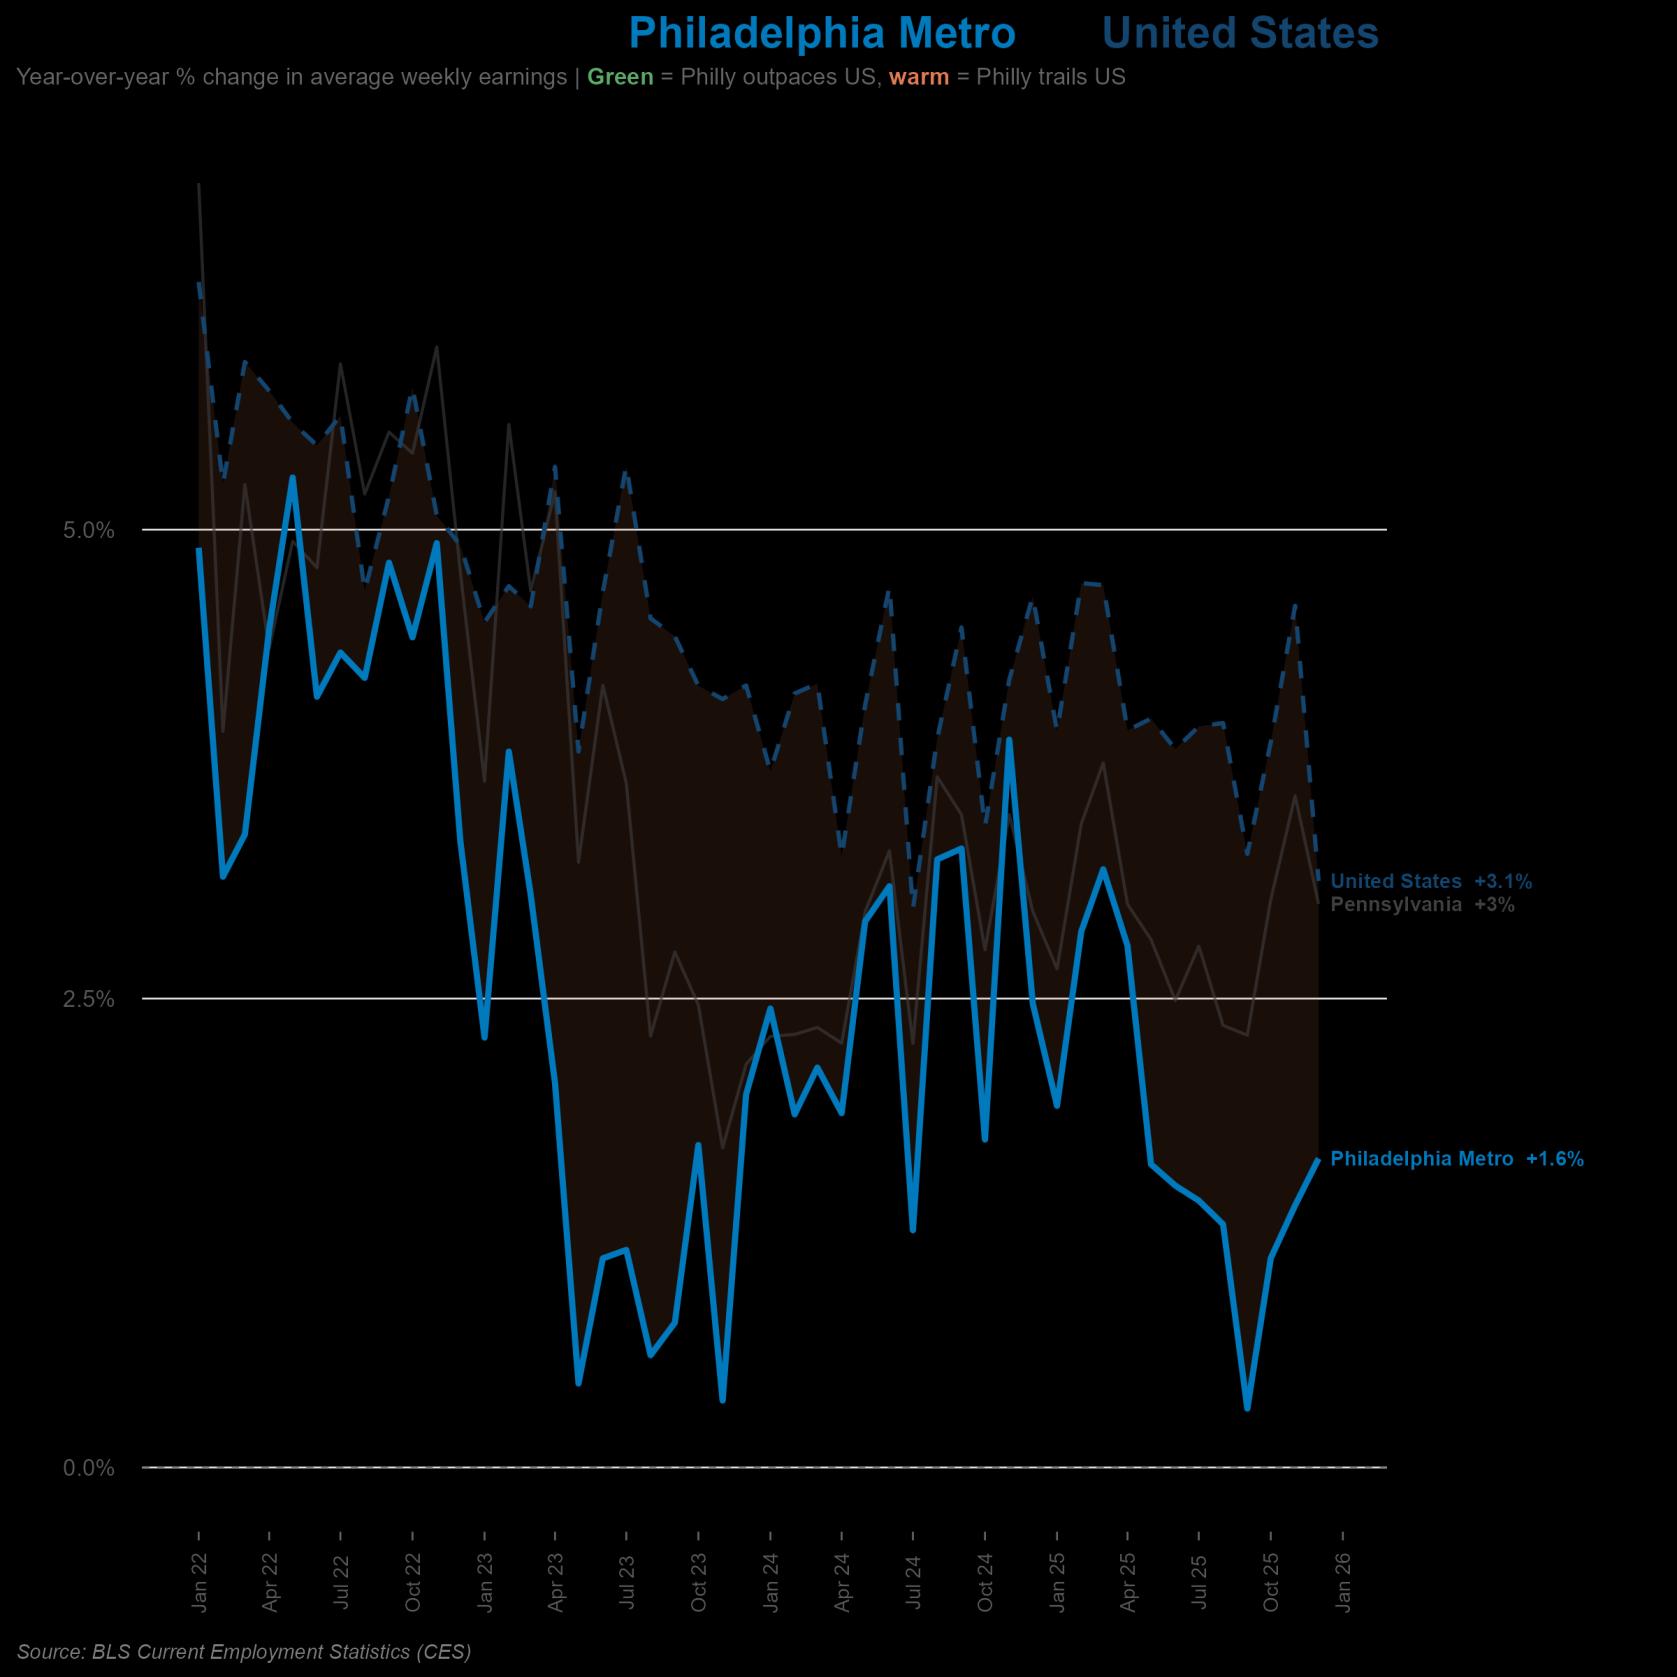
From January 2022 through December 2025, private-sector wage growth in the Philadelphia Metro has lagged the United States average. The line chart representing Philadelphia sits below the national line in every month on the chart.
The volatility of the Philadelphia line across 2023 and early 2024, when growth briefly dipped below 1% in multiple months, gave way to a steadier but still structurally subdued pattern through 2025.
Philadelphia's December 2025 private wage growth came in at +1.6% YoY. Philadelphia's December 2025 CPI inflation came in at +3.9% YoY. The difference between these two is the decline of purchasing power Philadelphians experienced over the year.
What makes the situation particularly acute is that Philadelphia inflation has run consistently higher than the national rate since mid-2023.
Real wages were at their worst during the 2022 inflation surge, when monthly real-wage losses ran as deep as –4% to –5%. The situation improved materially through 2023 and 2024 as national inflation cooled, but it has worsened again in the second half of 2025.
Socioeconomic Analysis
Demographics and Geospatial Disparity
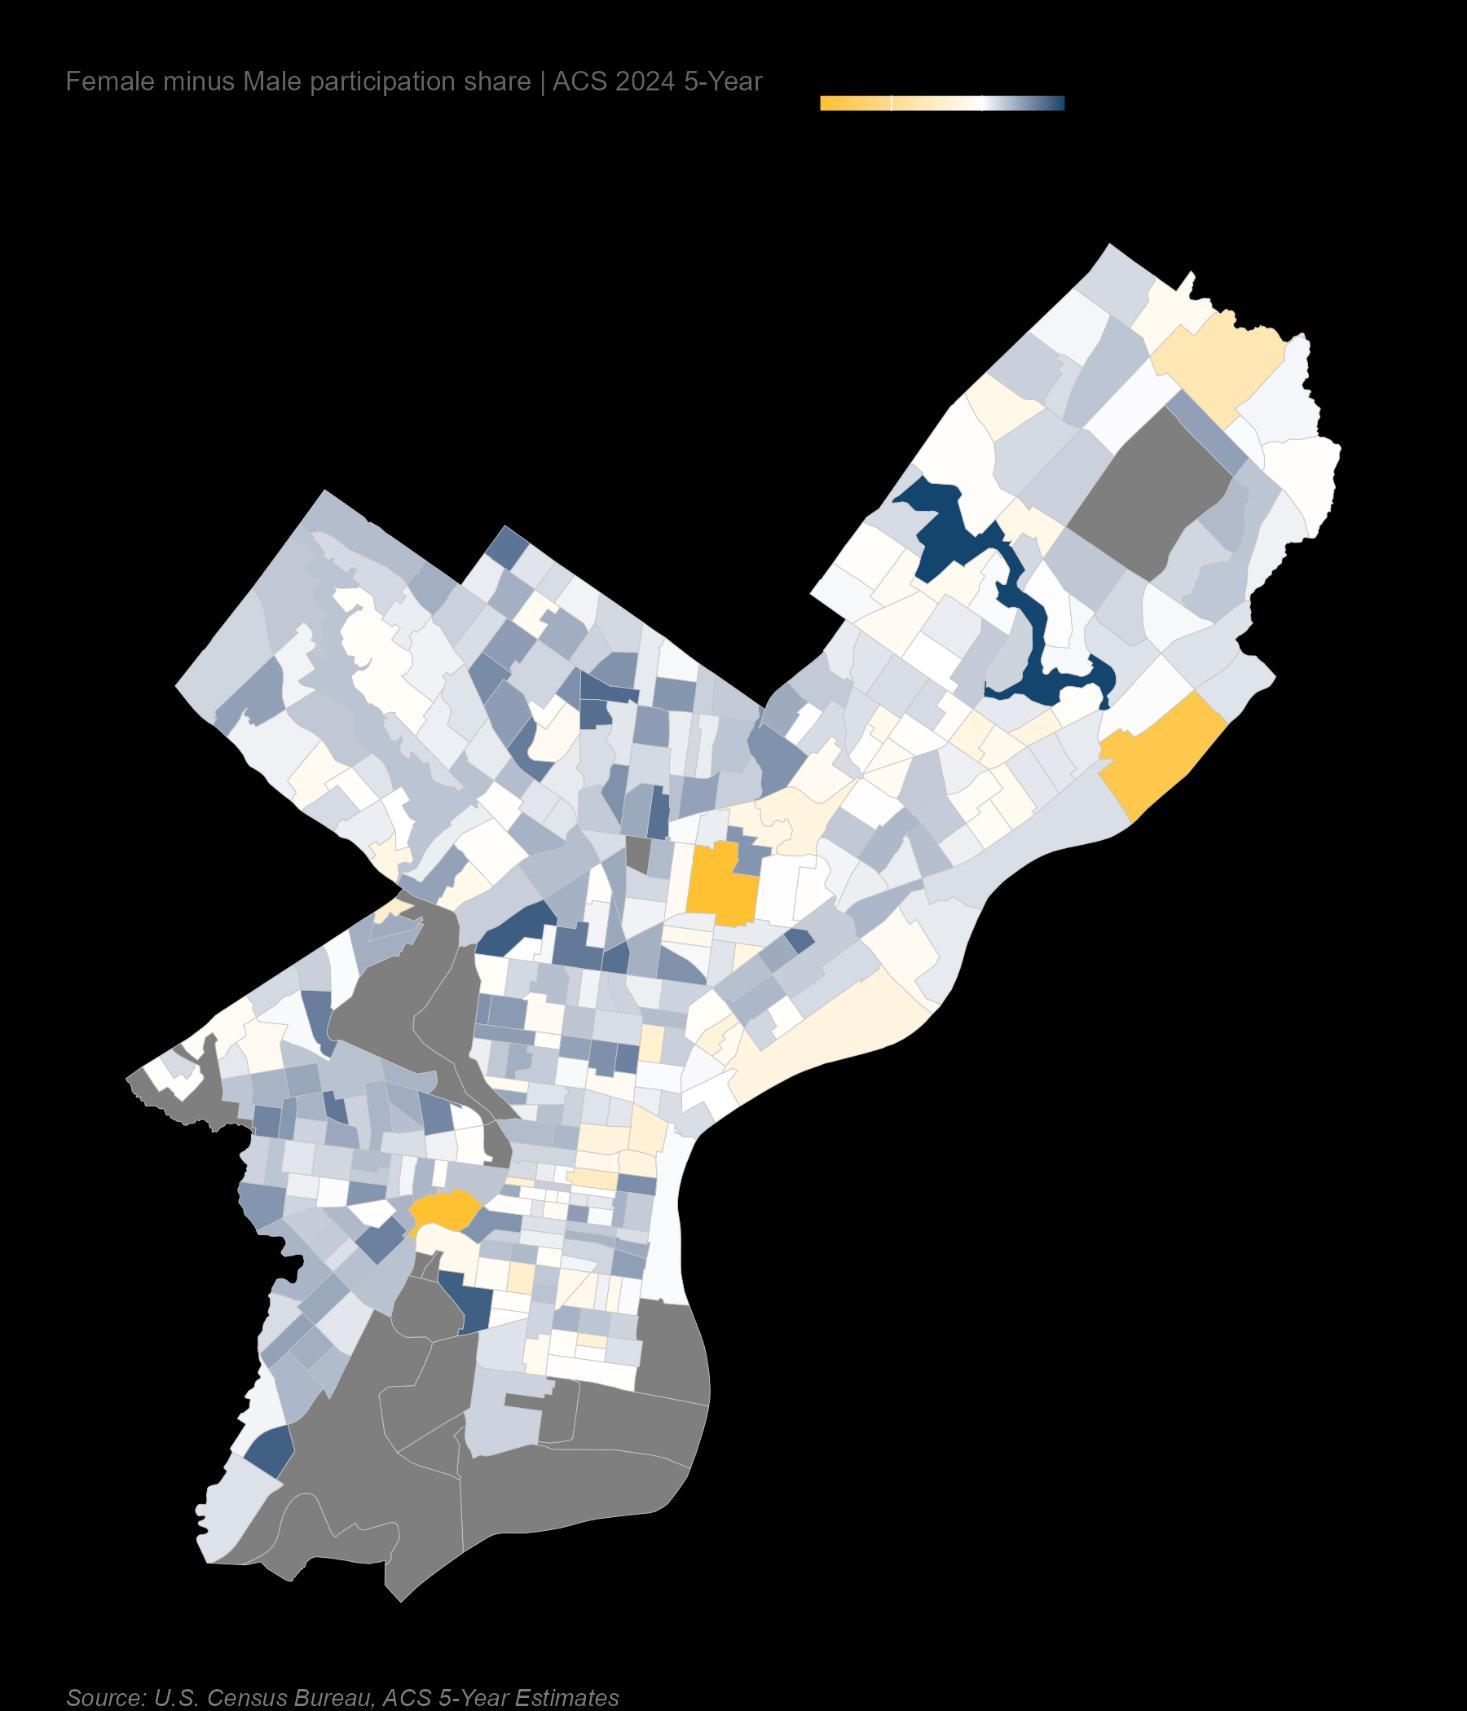
The Labor Force Participation Rate (LFPR) Gender Gap measures the difference between the share of working-age women and working-age men who are either employed or actively seeking work. A positive value means women participate at a higher rate than men in that tract.
Women's participation in Philadelphia already exceeds men's in three out of every four neighborhoods. On the other side, persistently lower male participation reflects the long shadow of deindustrialization and the disconnection of working-age men.
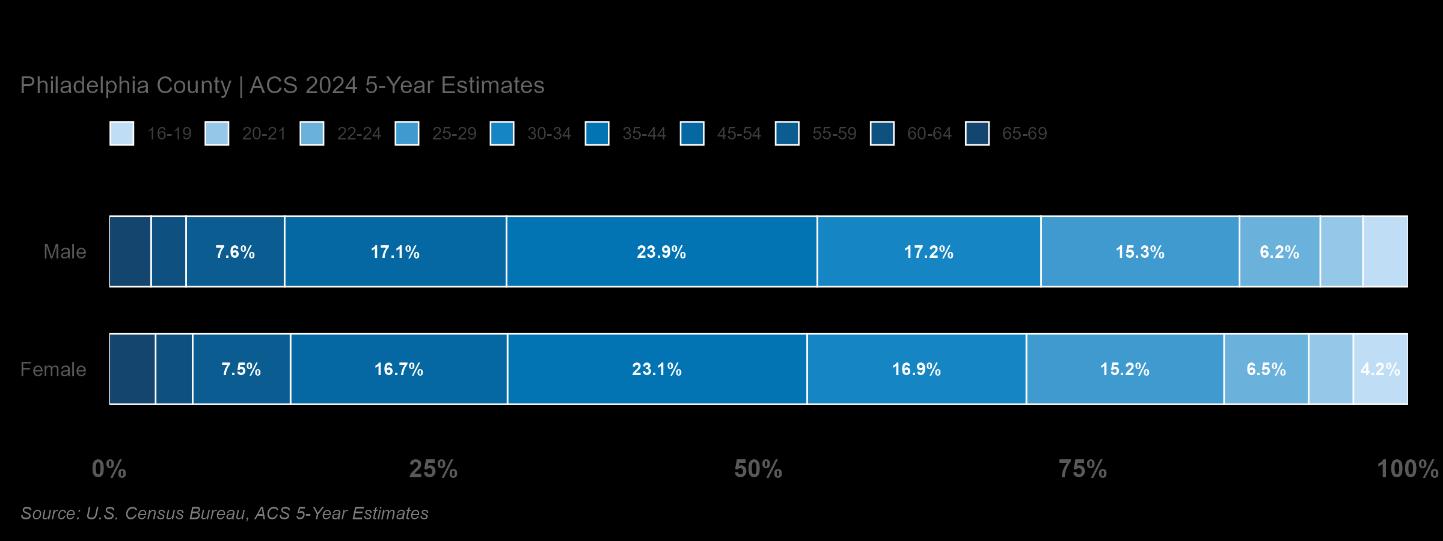
The 35–44 cohort is the single largest group for both men (23.9%) and women (23.1%). Philadelphia's participation gap is driven not by women working at different ages than men, but by simply more women working at every age.
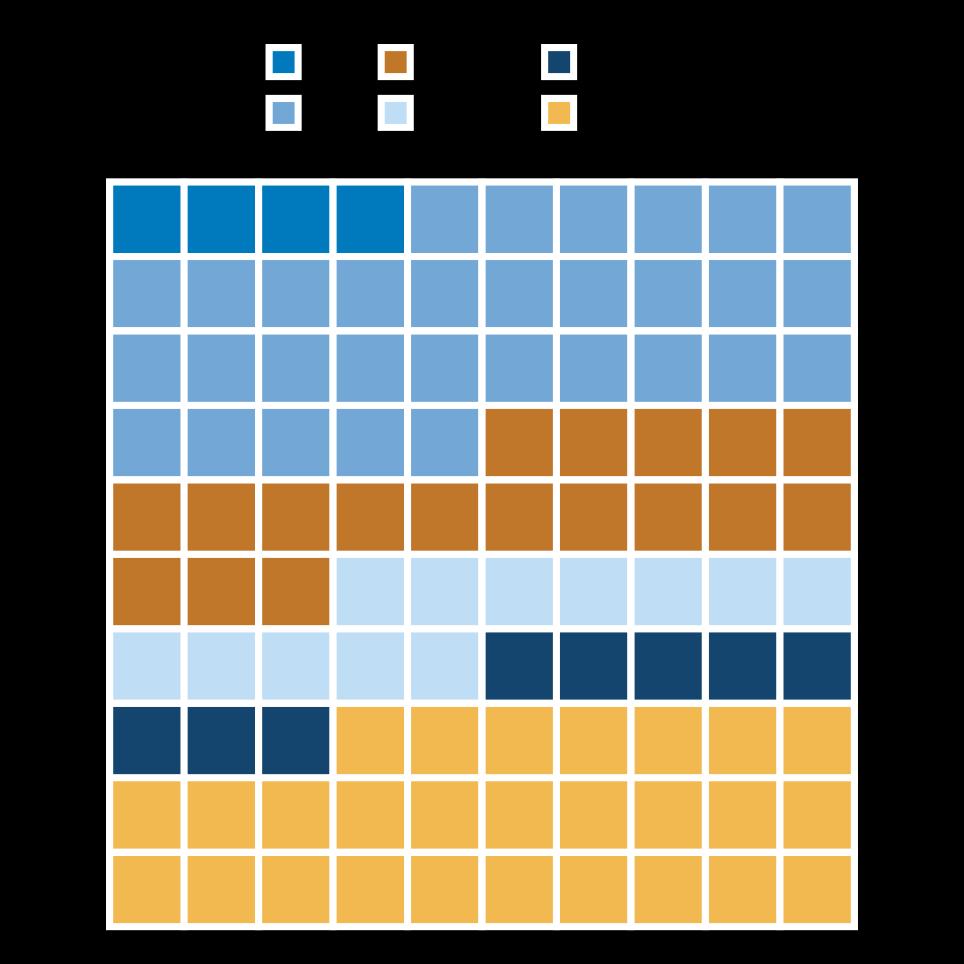
Residents of color are more likely to be out of the labor force and unemployed.
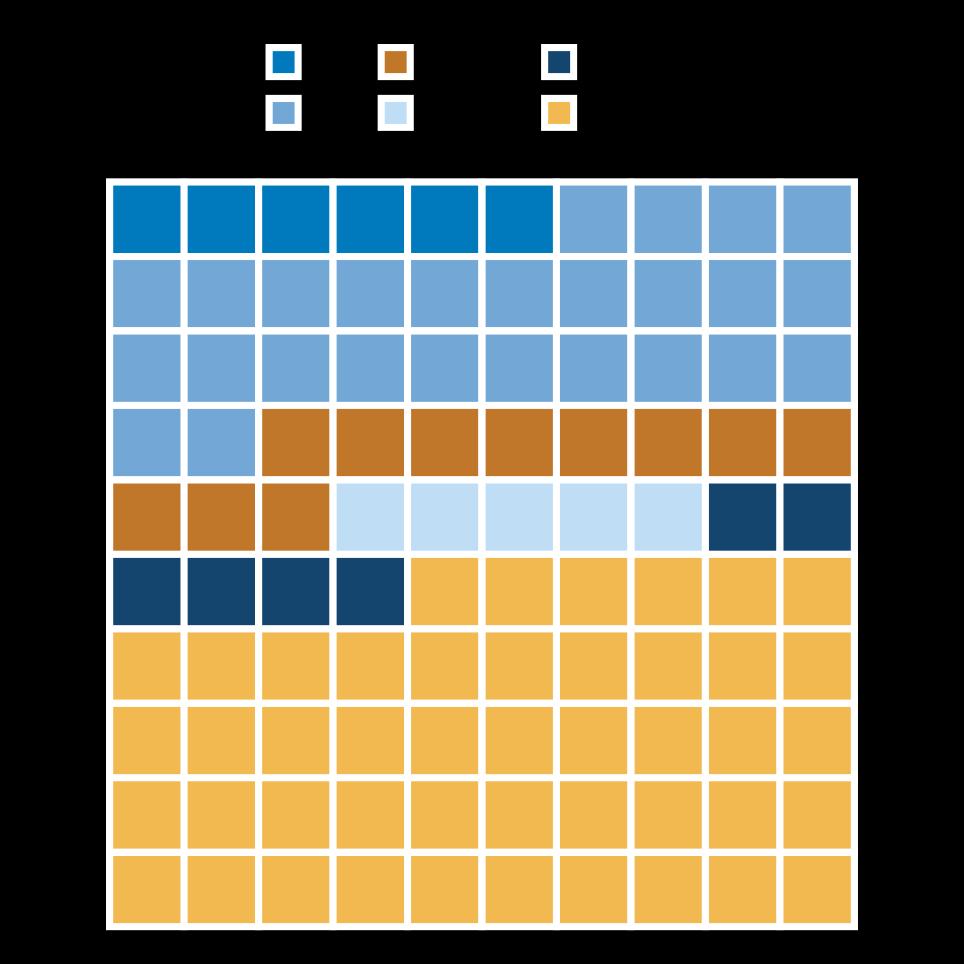
White workers make up 46% of Philadelphia's labor force but only about 27% of the unemployed they're significantly underrepresented among the jobless.
Black workers show the opposite: 26% of the workforce but 31% of the unemployed. Hispanic workers face the steepest gap, showing 11% of the labor force, 18% of the unemployed.
The waffle charts visualize the disparities. If unemployment hit all groups equally, the two charts would look the same. Instead, the yellow shrinks dramatically between charts while light blue, orange, and other categories expand. Black and Hispanic Philadelphians bear a disproportionate share of joblessness at the same time white workers are largely insulated.
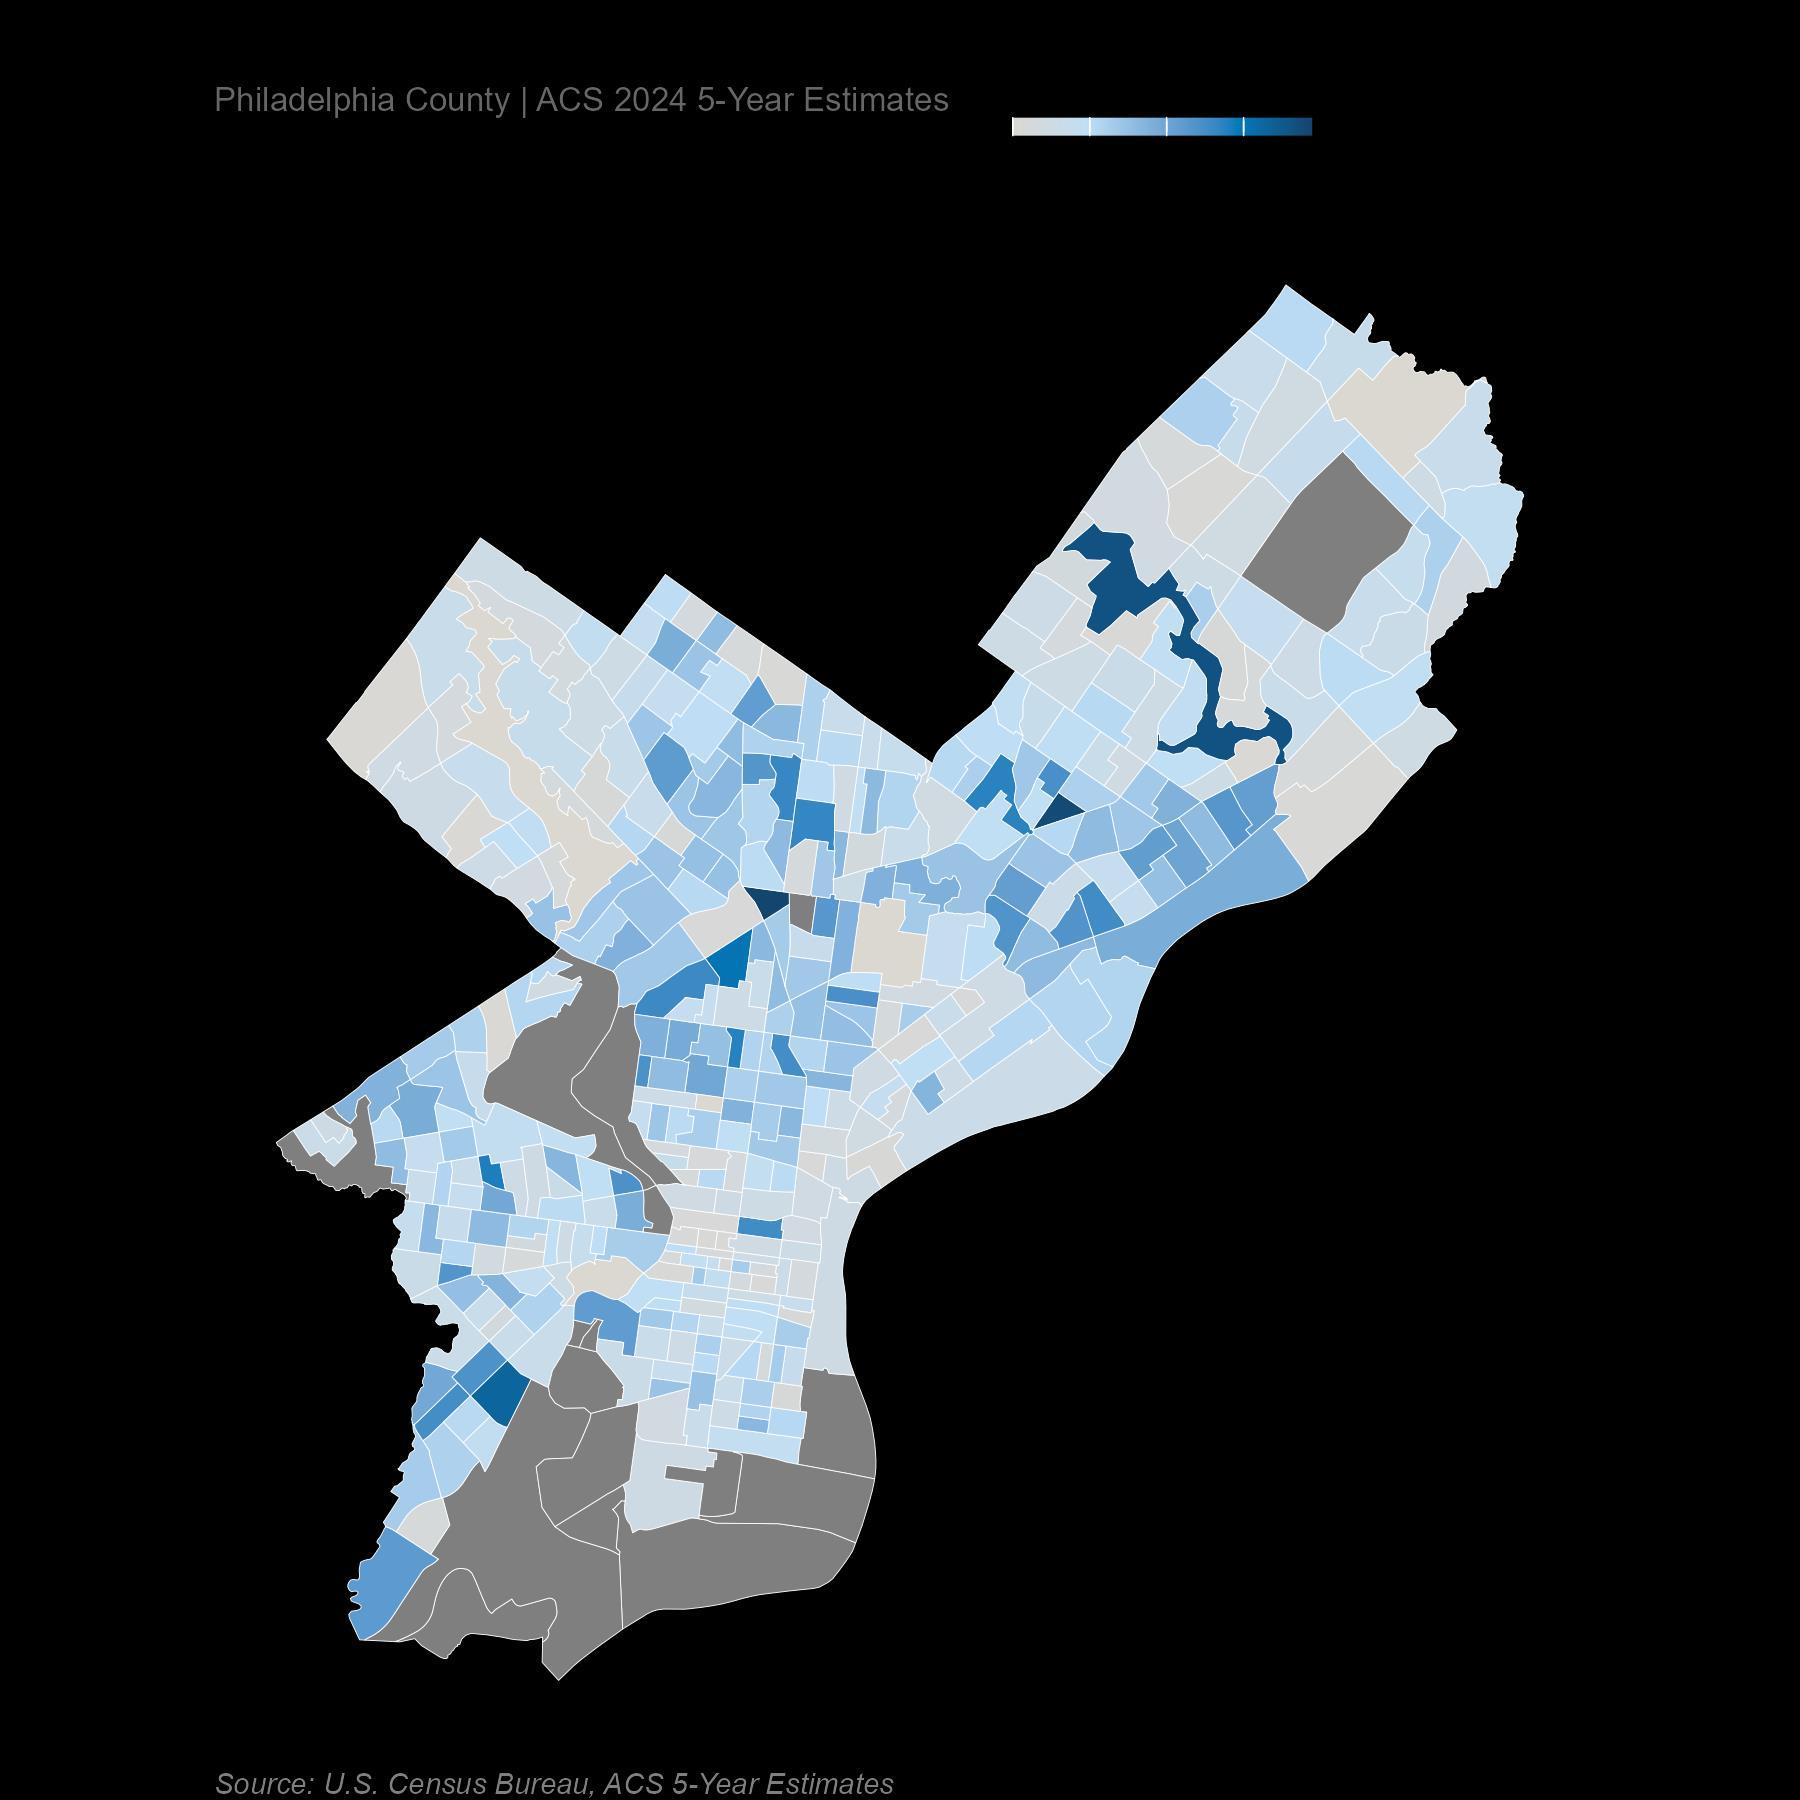
The map shows unemployment rate by census tract ranging from 0% to 19.4%, and the darker clusters sit exactly where unemployment claims concentrated: North Philadelphia, West Philadelphia, and the Kensington–Frankford corridor.
Center City, University City, the Far Northeast, and the Northwest remain largely pale. Half the city lives comfortably below the metro unemployment rate.
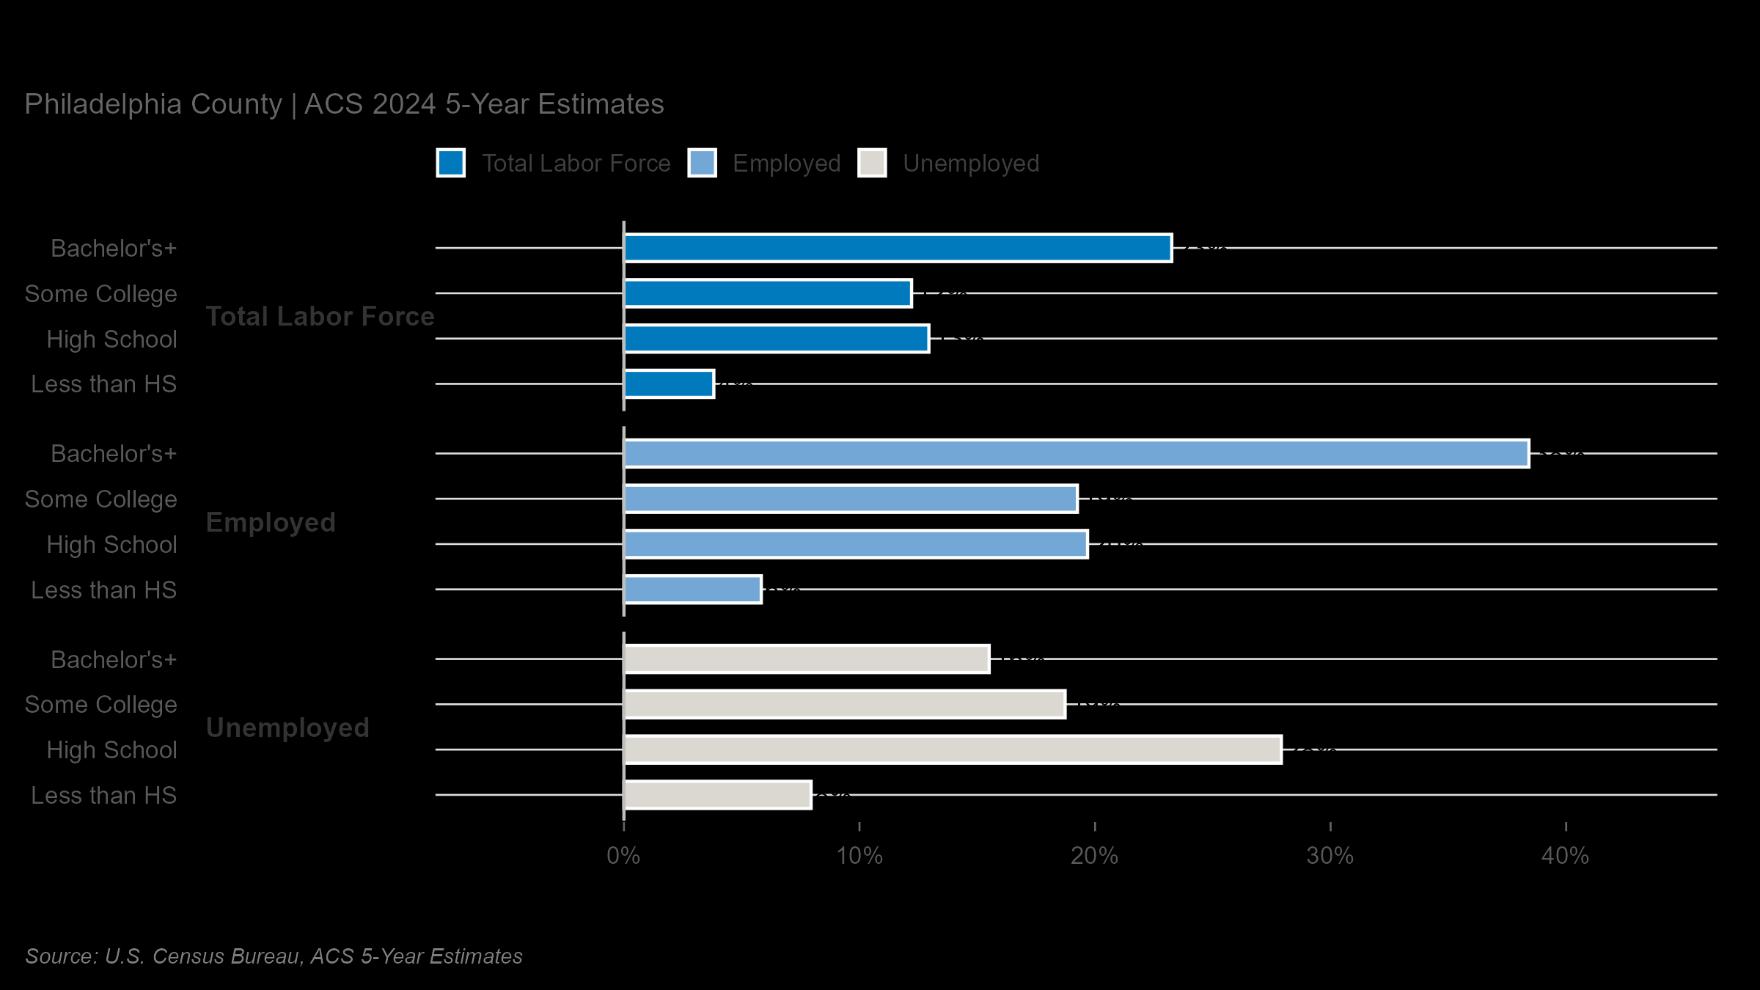
A Bachelor's degree is the single strongest predictor of labor-market standing in Philadelphia. BA-holders make up 23% of the labor force but 38% of the employed, and just 16% of the unemployed. High-school-only workers make up 13% of the labor force, only 20% of the employed, but 28% of the unemployed.
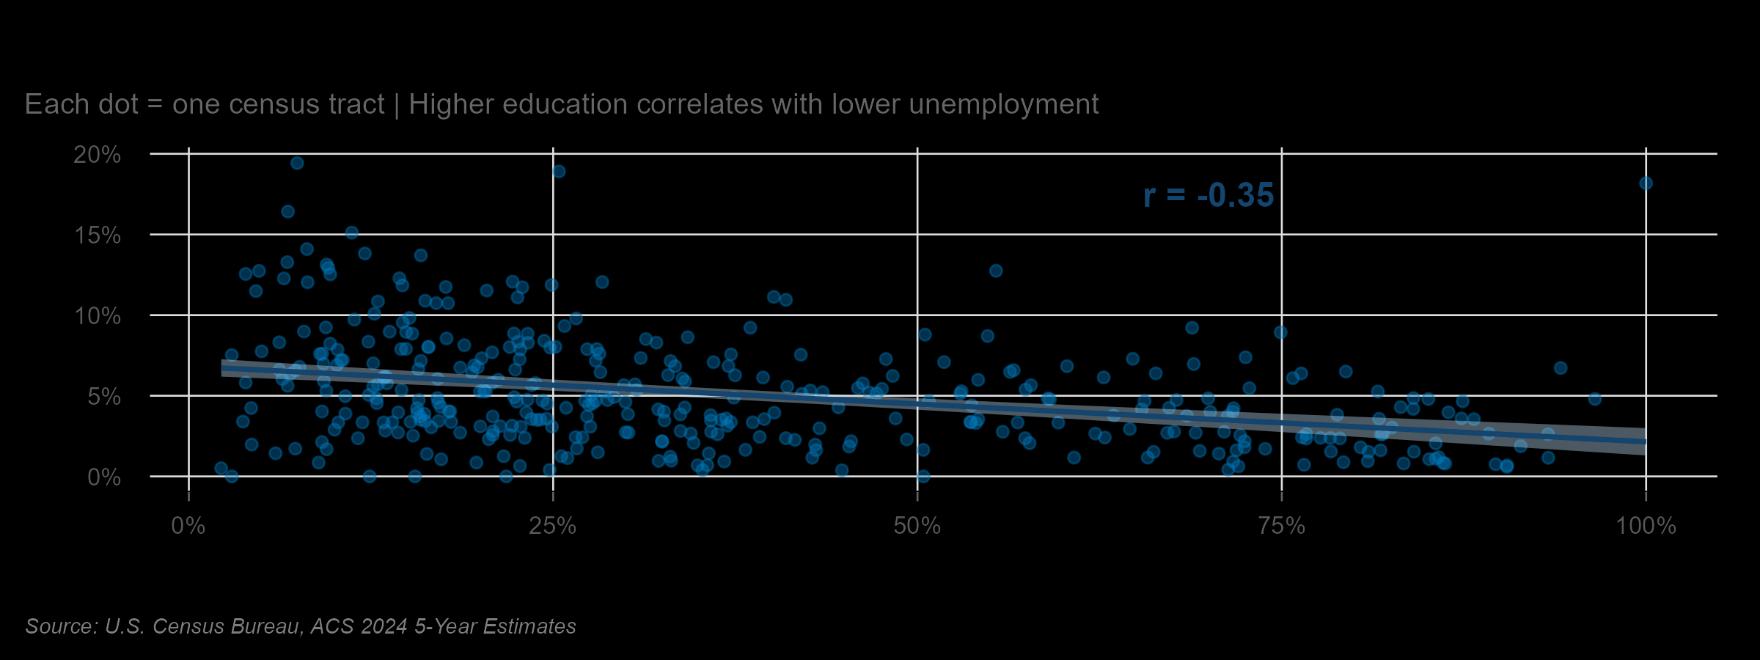
The tract-level scatter chart indicates the pattern spatially, with a correlation of r = –0.35 between the share of BA-plus residents and the unemployment rate. Education does not merely improve outcome. It increasingly changes them.
Appendix
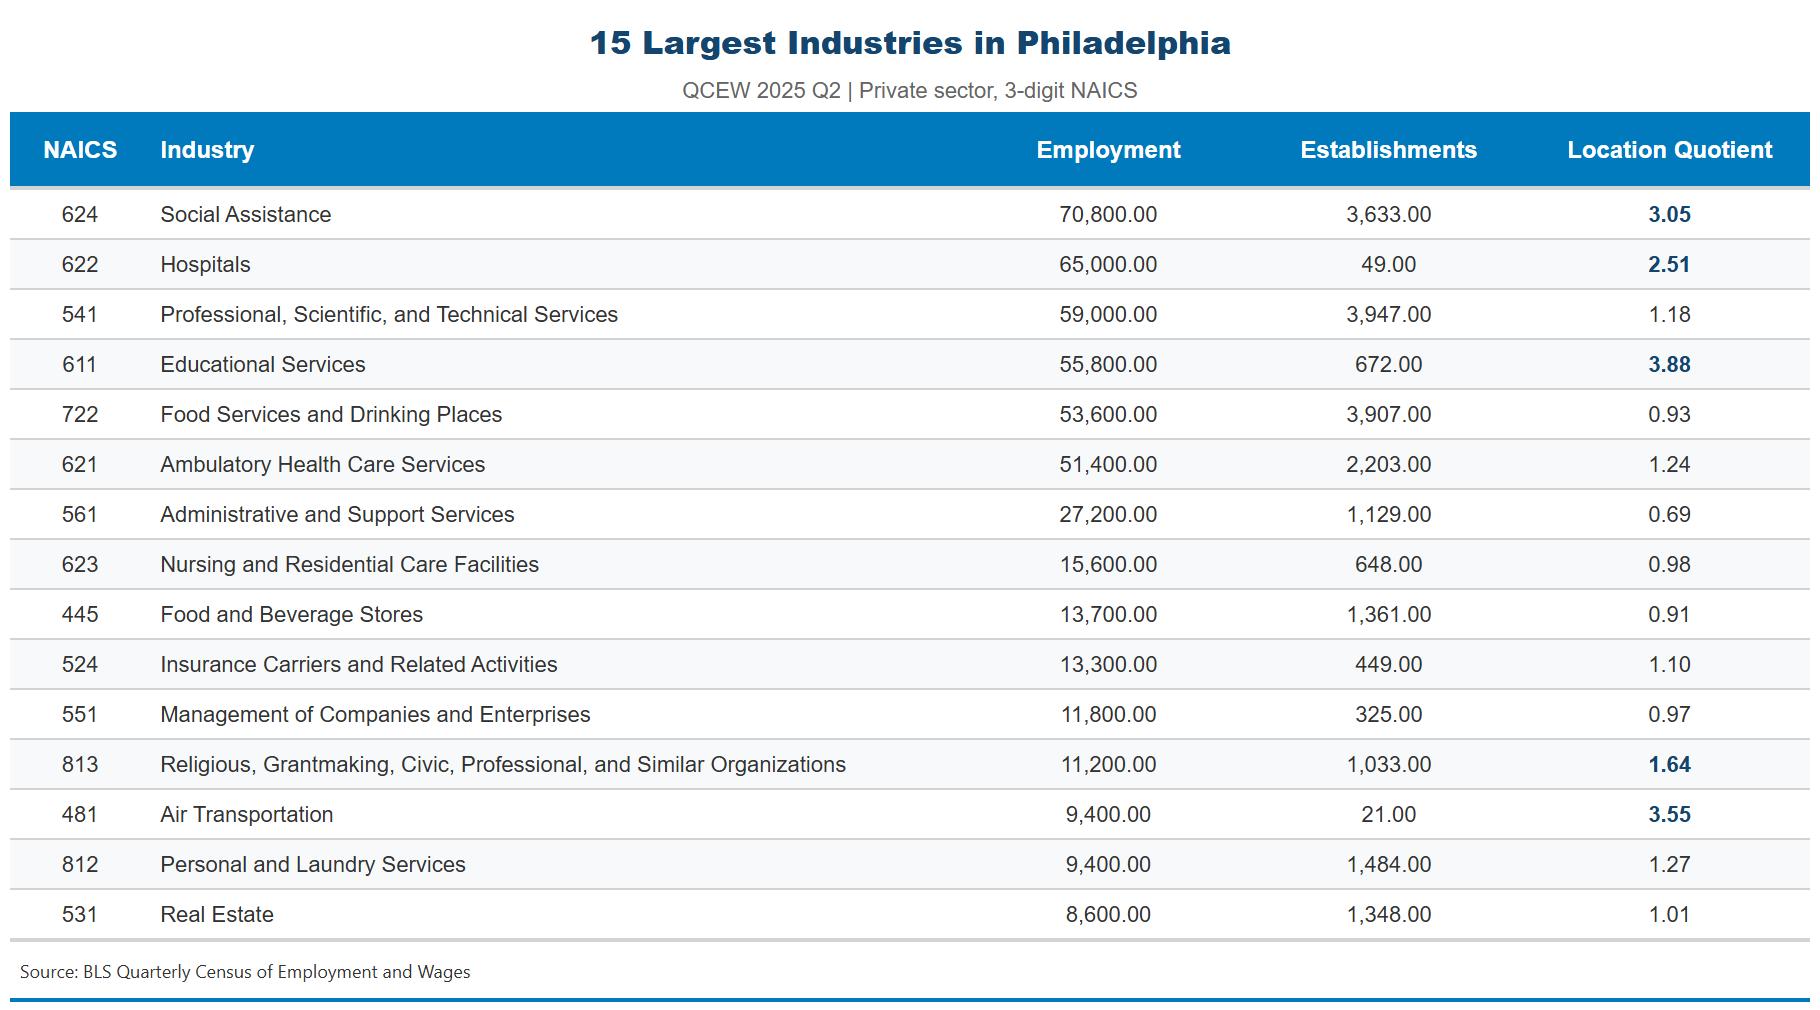
Appendix Table 1: Largest Detailed Industry Sectors in Philadelphia, Q2 2025
From the Quarterly Census of Employment and Wages, this table shows the 15 largest industry sectors by total employment. These data are released on a roughly six-month delay.
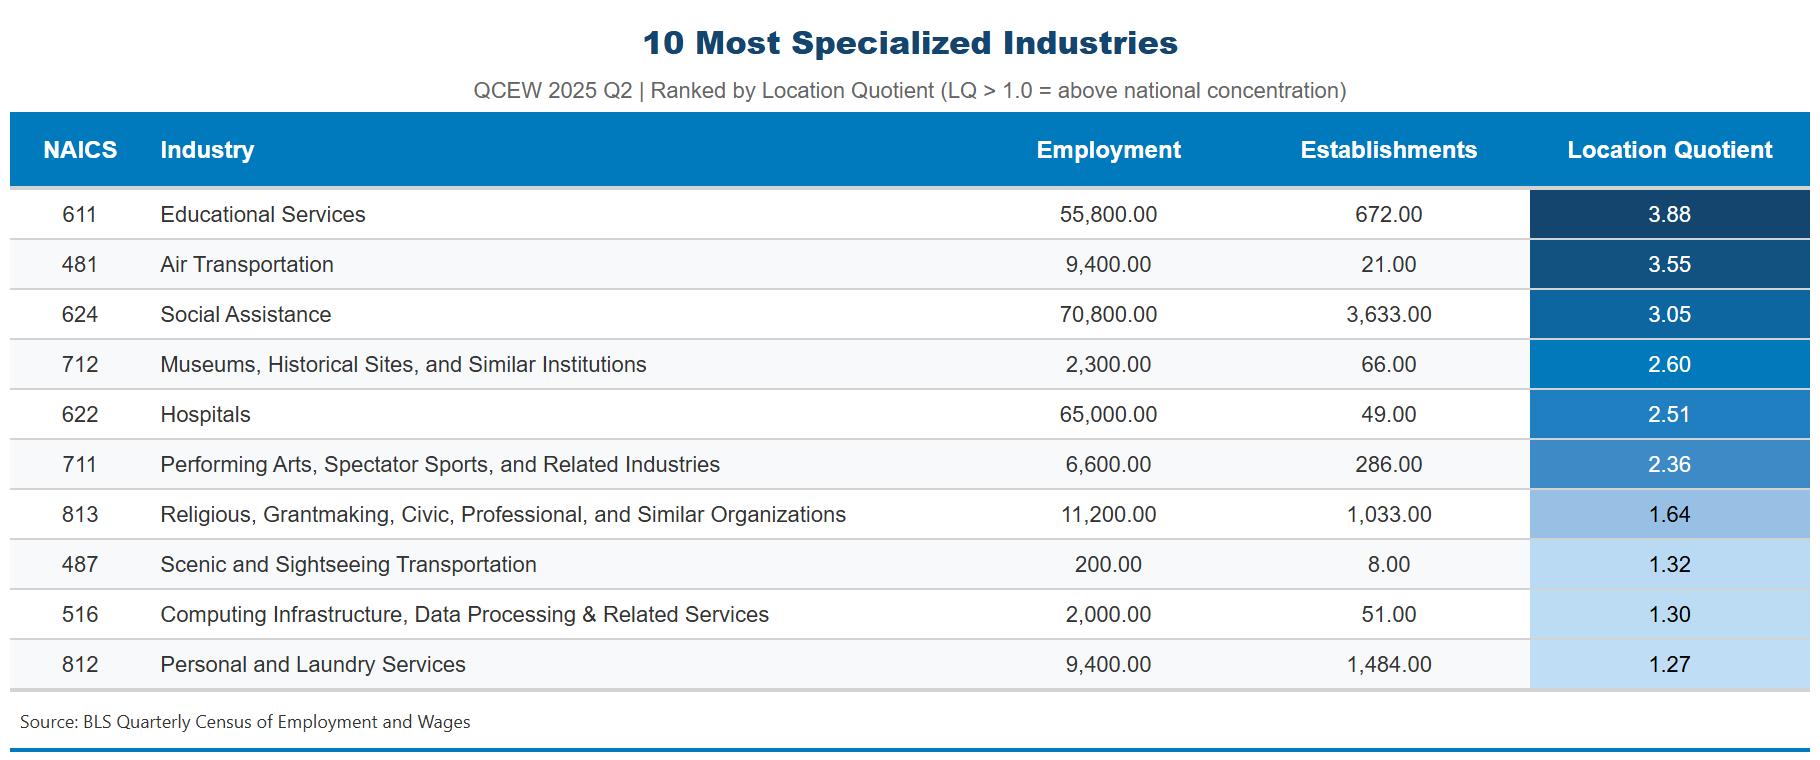
Table 2: Most Specialized Detailed Industry Sectors in Philadelphia, Q2 2025
From the Quarterly Census of Employment and Wages, this table shows the 10 most specialized industry sectors by total employment. These industries are disproportionately important to Philadelphia’s economy. These data are released on a roughly six-month delay.
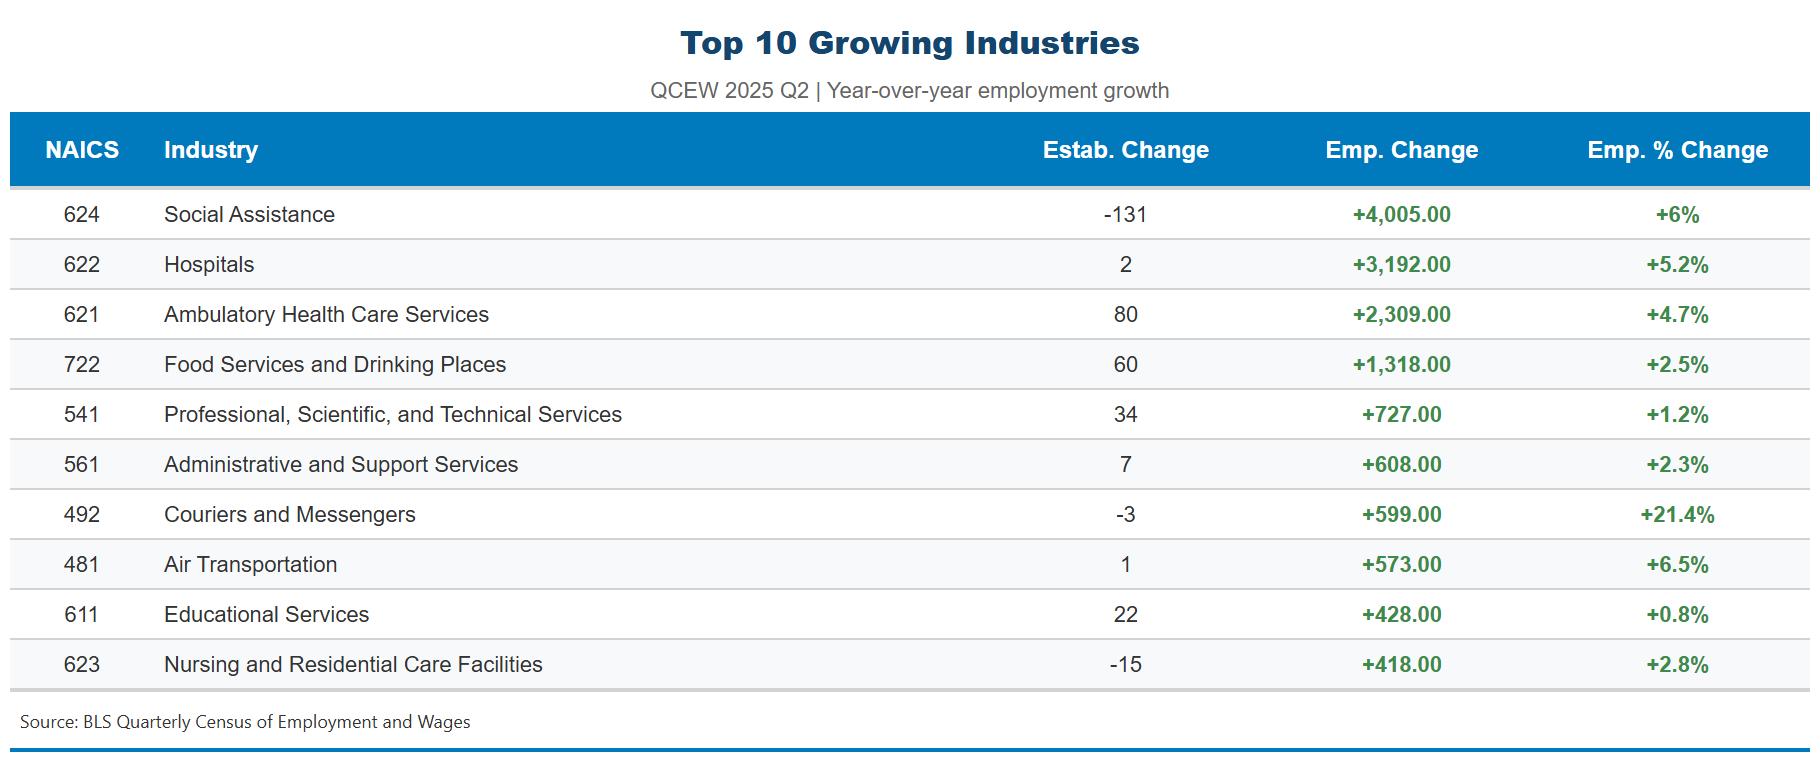
Appendix
From the Quarterly Census of Employment and Wages, this table shows the 10 industry sectors with the largest annual employment growth. These data are released on a roughly six-month delay.
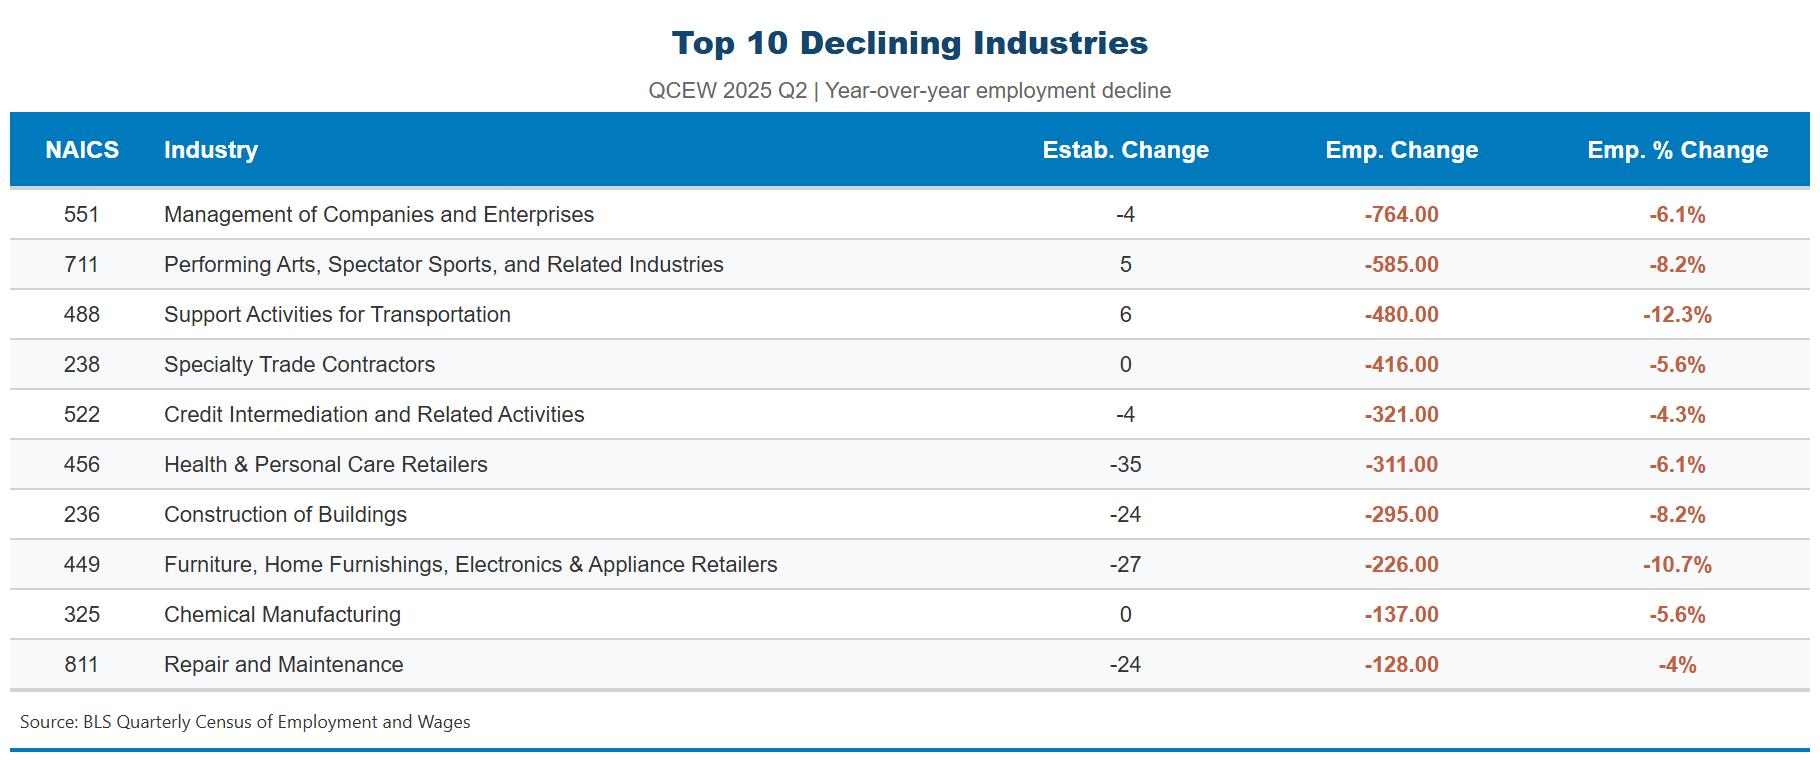
Appendix Table 4: Detailed Industry Sectors in Philadelphia with Largest Year-Over-Year Declines, Q2 2025
From the Quarterly Census of Employment and Wages, this table shows the 10 industry sectors with the largest annual employment declines. These data are released on a roughly six-month delay.
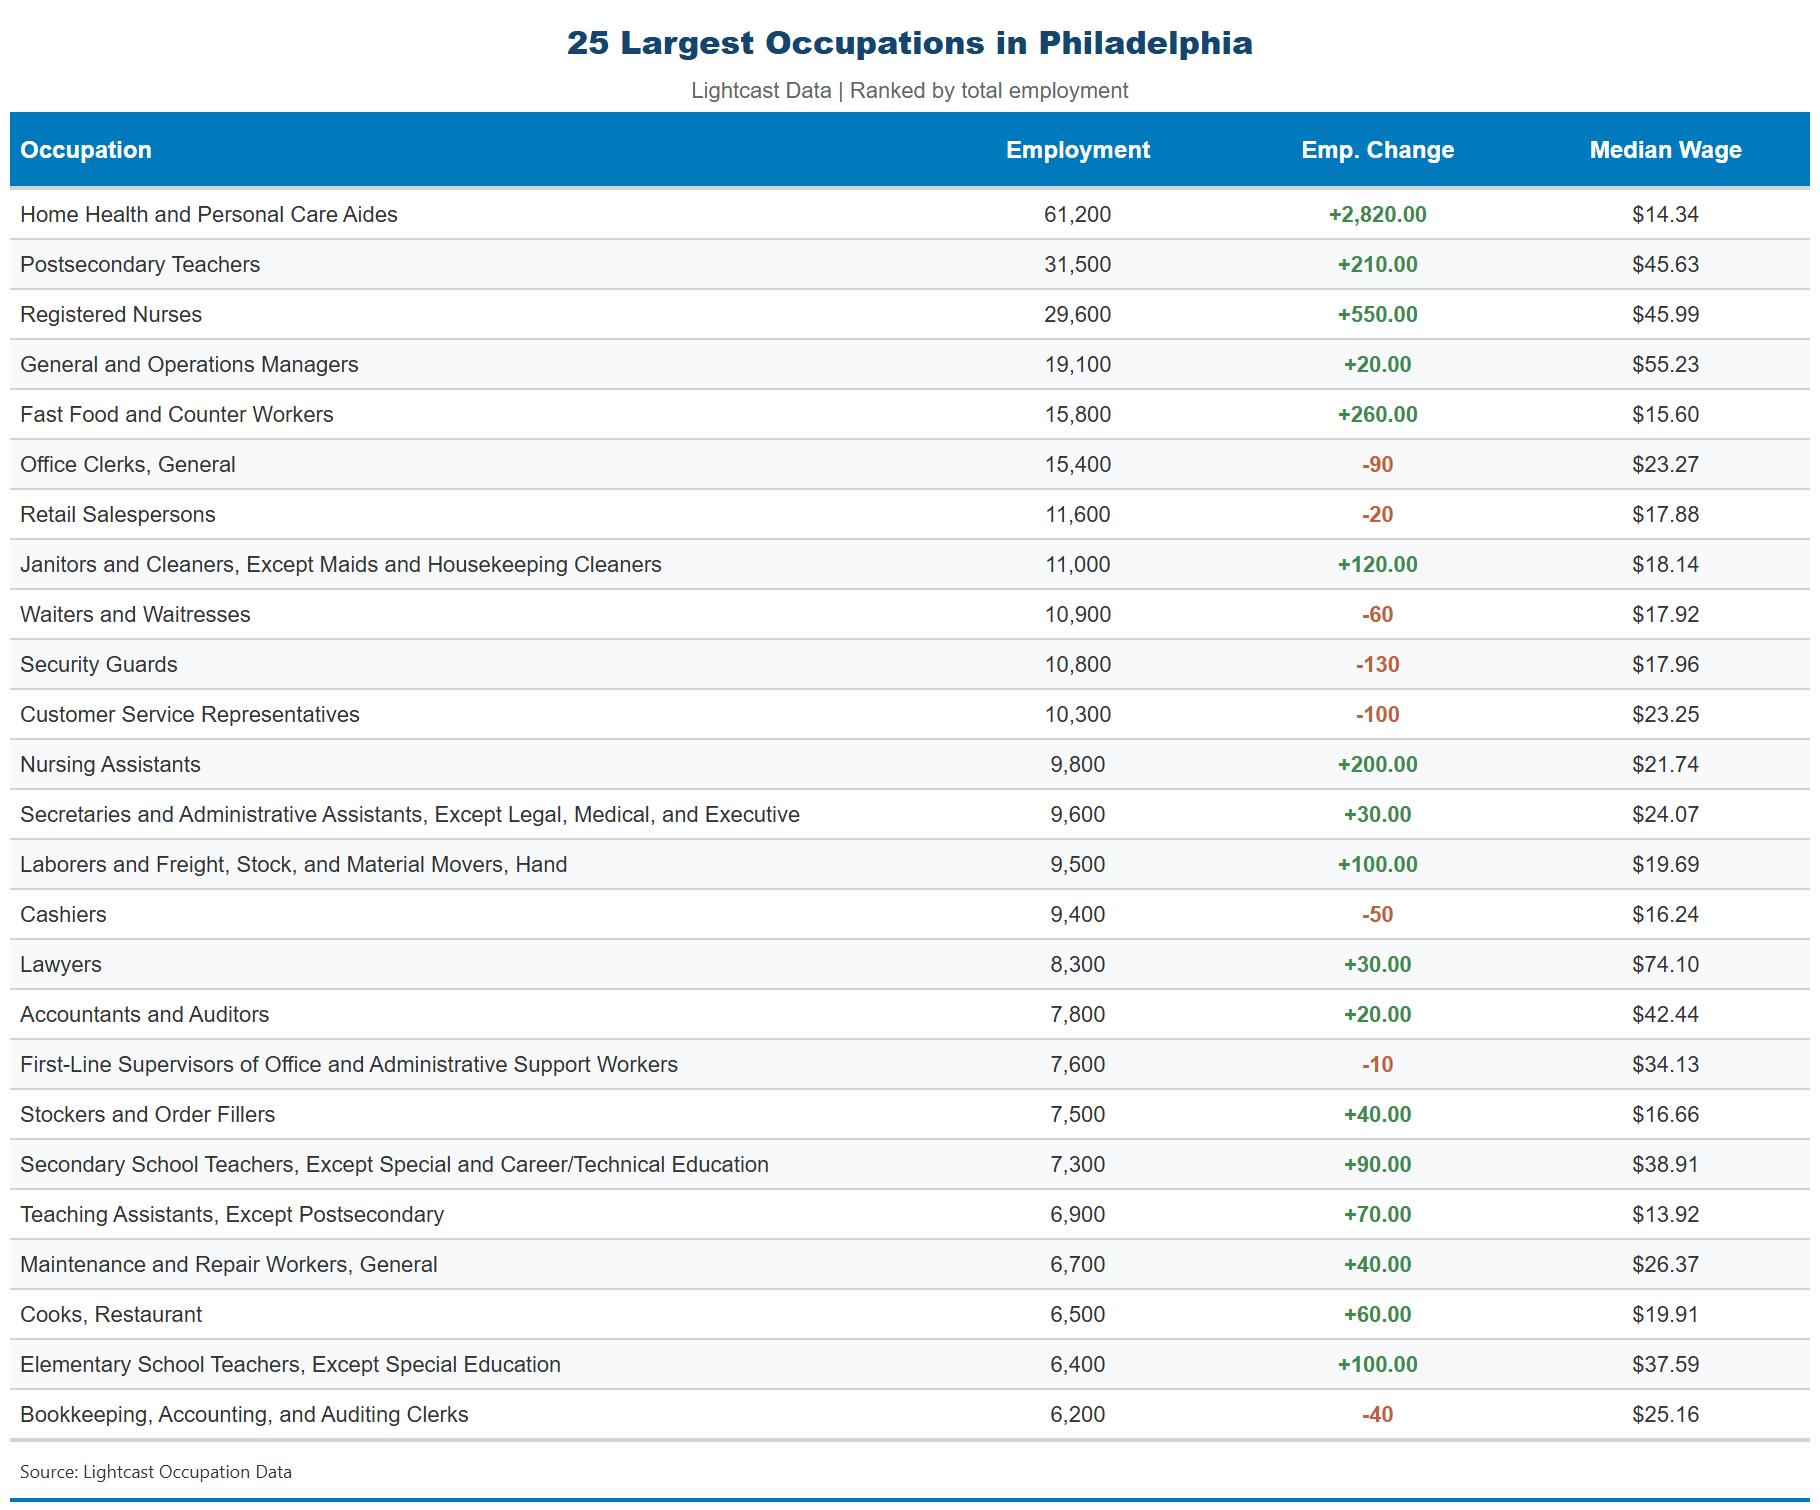
Appendix Table 5: Largest Occupations in Philadelphia with Employment Change from 2025 to 2026
Based on estimates derived from the Quarterly Census of Employment and Wages, this table shows the 25 largest occupation by total employment. These data are released on a roughly nine-month delay.