Philadelphia’s 2025 Q3 Quarterly Labor Market Report | January 2026
In 2018, Philadelphia’s institutional and community leaders collaborated to develop a comprehensive workforce development strategy. This document, Fueling Philadelphia’s Talent Engine, calls on Philadelphia Works, Inc. to serve as the city’s hub of labor market and economic reporting and analysis.
Continued economic growth is critical to the future of our city and region, and is dependent upon a strong, skilled workforce.
Fueling Philadelphia’s Talent Engine
Under this mandate, this quarterly report provides insight into key measures of economic activity, providing leaders across public and private institutions an easy-to-access update on how Philadelphia’s economy and labor force continue to evolve.
Page 03
Current Research
The latest ongoing research about Philadelphia’s workforce.
Page 05
Employment Trend
The most recent data available on Philadelphia’s economy.
Page 12
Employer Demand
Exploring recent trends in employer demand through job postings and other sources.
Page 17
Philadelphia’s Labor Force
Demographic, social, and economic characteristics of Philadelphia’s labor force.
Page 22
Appendix: Detailed Tables
Detailed employment information for important industries and occupations in Philadelphia.
Executive Summary
Using the latest available data, this quarterly update offers insight into Philadelphia’s labor market, industry mix, and economic development.
For more insight into Philadelphia’s labor force, economic characteristics, and the employment dynamics, visit the Philadelphia Works website.
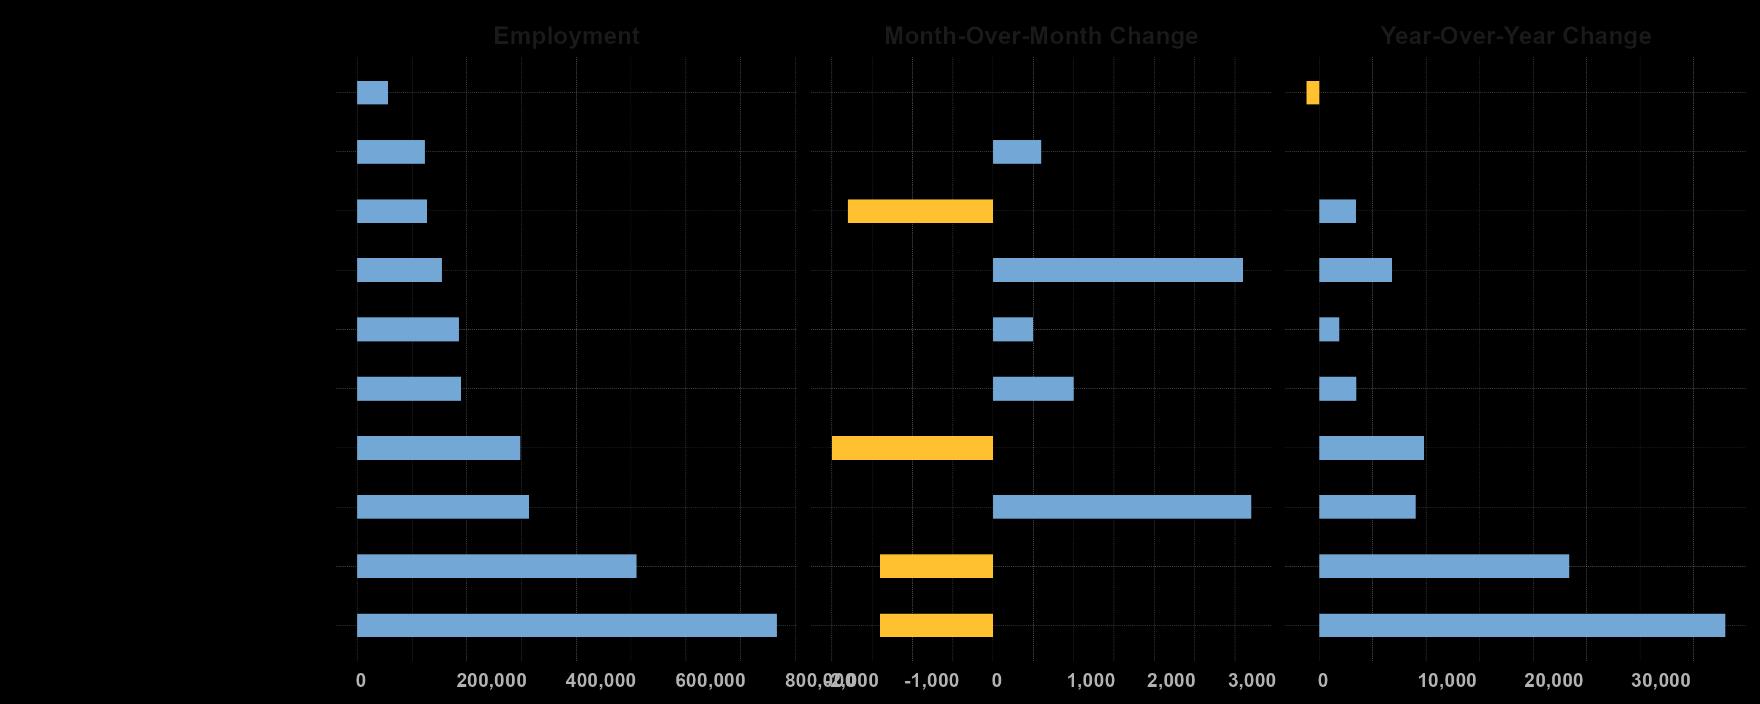
In the third quarter of 2025, Philadelphia's labor market continued to soften, with the unemployment rate rising to 5.7%, up from 4.9% in Q2 and notably higher than both Pennsylvania and the United States. The labor force expanded to 788,581, but total employment declined to 743,889, with 44,691 residents unemployed—an increase of over 6,000 from the previous quarter. Across industry sectors, the picture diverged. Based on an analysis of yearover-year employment changes, sectors such as Education & Health Services and Professional & Business Services have been the primary drivers of job creation in the Philadelphia Metropolitan Statistical Area (MSA). However, month-over-month data indicates some short-term volatility, with the largest employment sector experiencing a slight contraction.
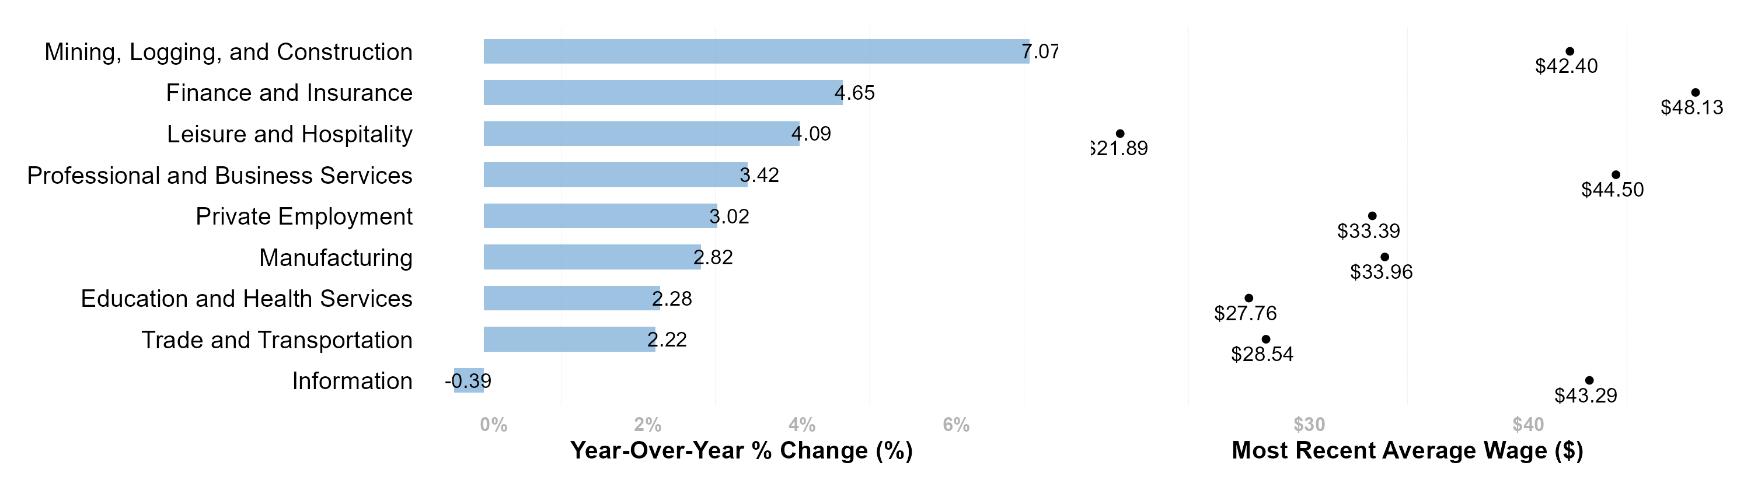
Wage growth in Pennsylvania tells another story. The Mining, Logging, and Construction sector led the state with a 7.07% year-over-year wage gain to an average of $42.40 an hour. Finance and Insurance also showed solid gains of 4.65%. In contrast, the Information sector experienced a 0.39% wage decline, while Manufacturing wage growth was moderate at 2.82%.
Current Research
Future Impact Occupations
Future Impact Occupation
----Connecting Talent to Opportunity
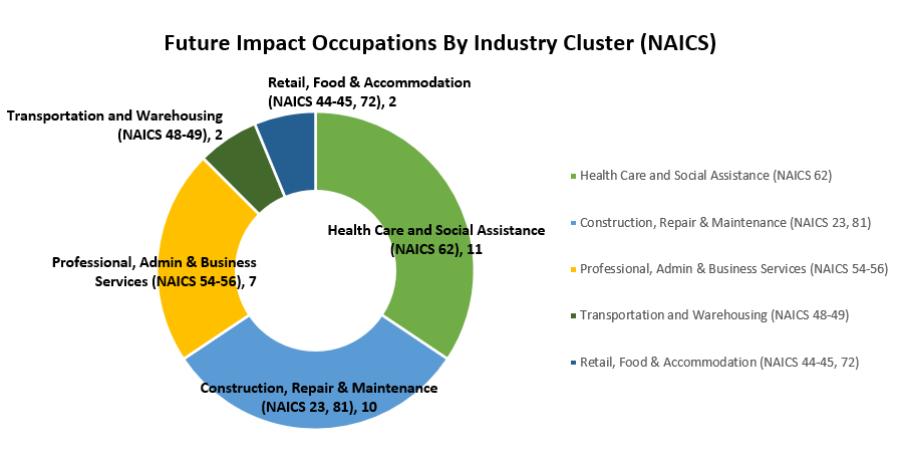
This research presents the 2025 Future Impact Occupations (FIO) list, a strategic guide to identifying high-opportunity occupations with accessible levels of education and training in Philadelphia. The list is designed to guide workforce investment toward careers that offer family-sustaining wages and clear pathways for economic advancement for Philadelphians. Crucially, it focuses on "accessible" careers, defined for this report as those not requiring a four-year bachelor's degree for entry.
The FIO list emerges from a rigorous analysis combining regional wage data with official long-term occupational projections. The primary data source for this employment demand is the "2022-2032 Long-Term Projections" for the Philadelphia County Workforce Development Area (WDA), published by the Pennsylvania Department of Labor & Industry's Center for Workforce Information & Analysis (CWIA).
Figure 1: Future Impact Occupation By NAICS Code
Overall Employment Trends
Quarterly Comparison
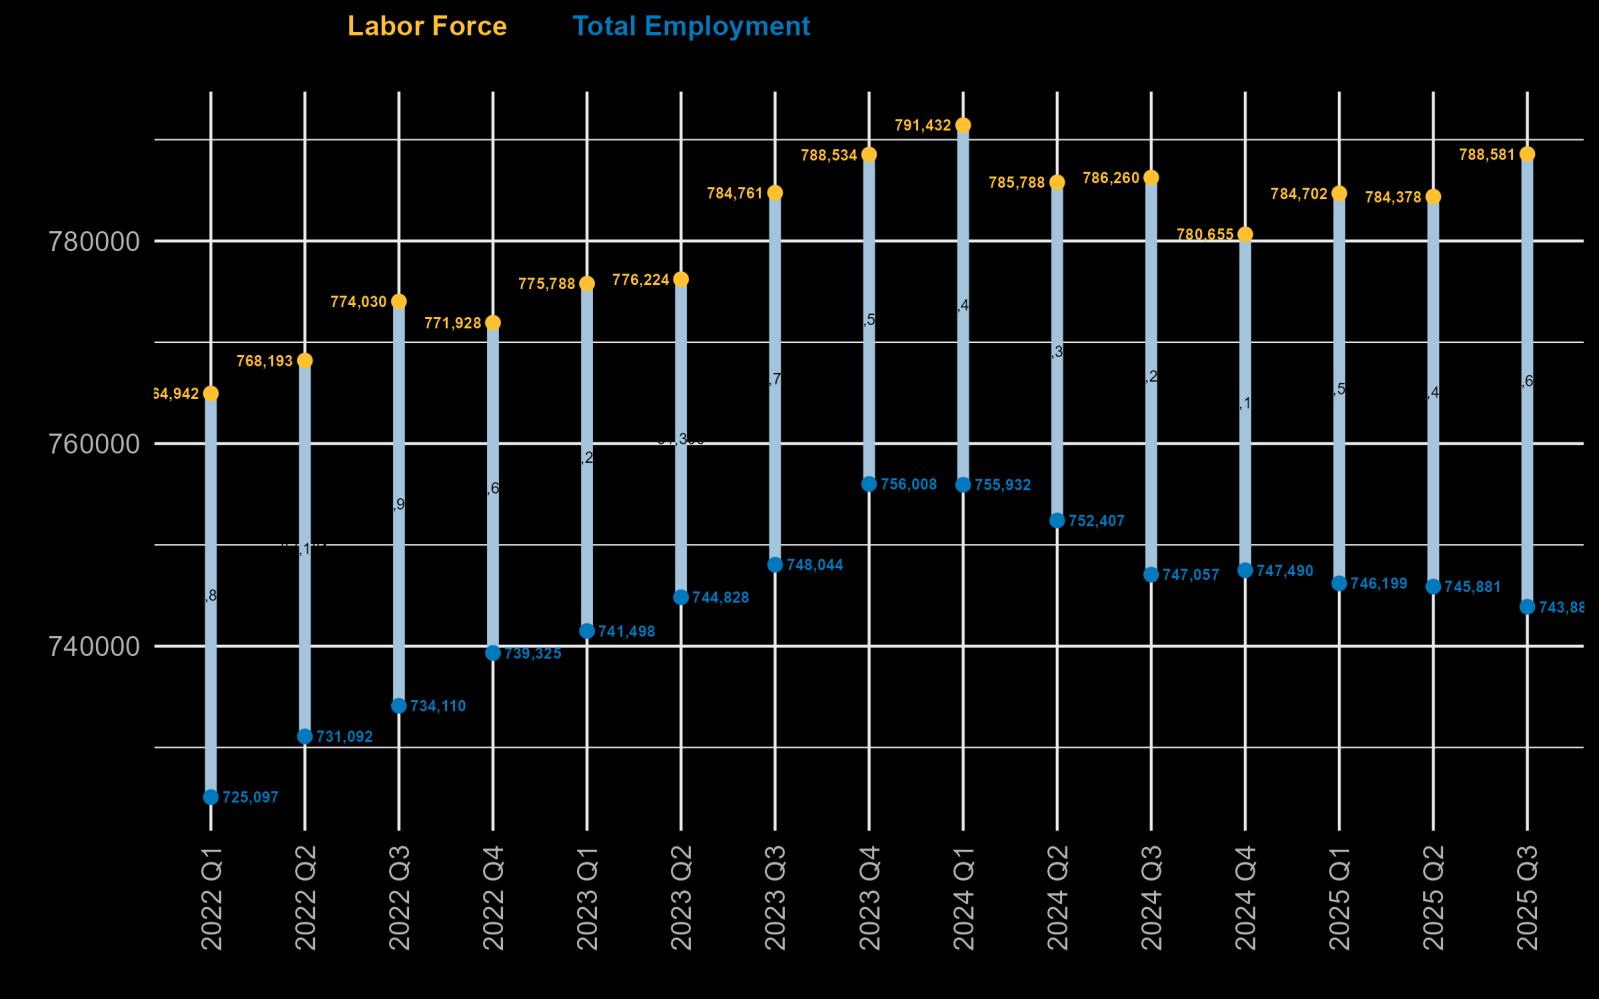
A detailed quarterly analysis reveals that Philadelphia's labor market showed signs of stabilization in the third quarter of 2025. In Q3 2025, the labor force stood at 788,581, with 743,884 people employed, resulting in 44,697 unemployed residents. This represents a slight increase from the 38,496 unemployed recorded in Q2 2025, as the total labor force expanded while employment declined modestly, indicating continued challenges in the labor market.
The annual comparison shows uneven shifts. The 44,697 unemployed residents in Q3 2025 represent a notable increase from the 35,700 unemployed individuals in Q3 2024. A year prior, the labor market showed stronger employment outcomes, with total employment at 752,407 compared to the current 743,884. However, the labor force has grown from 786,260 to 788,581, suggesting continued labor force participation despite the employment challenges.
2: Quarterly Mean Value Comparisonin Philadelphia
Figure
Employment & Unemployment
Total Labor Force in September 2025
789,434
Total Employment in September 2025
746,980 Unemployment Rates in September 2025
5.4%
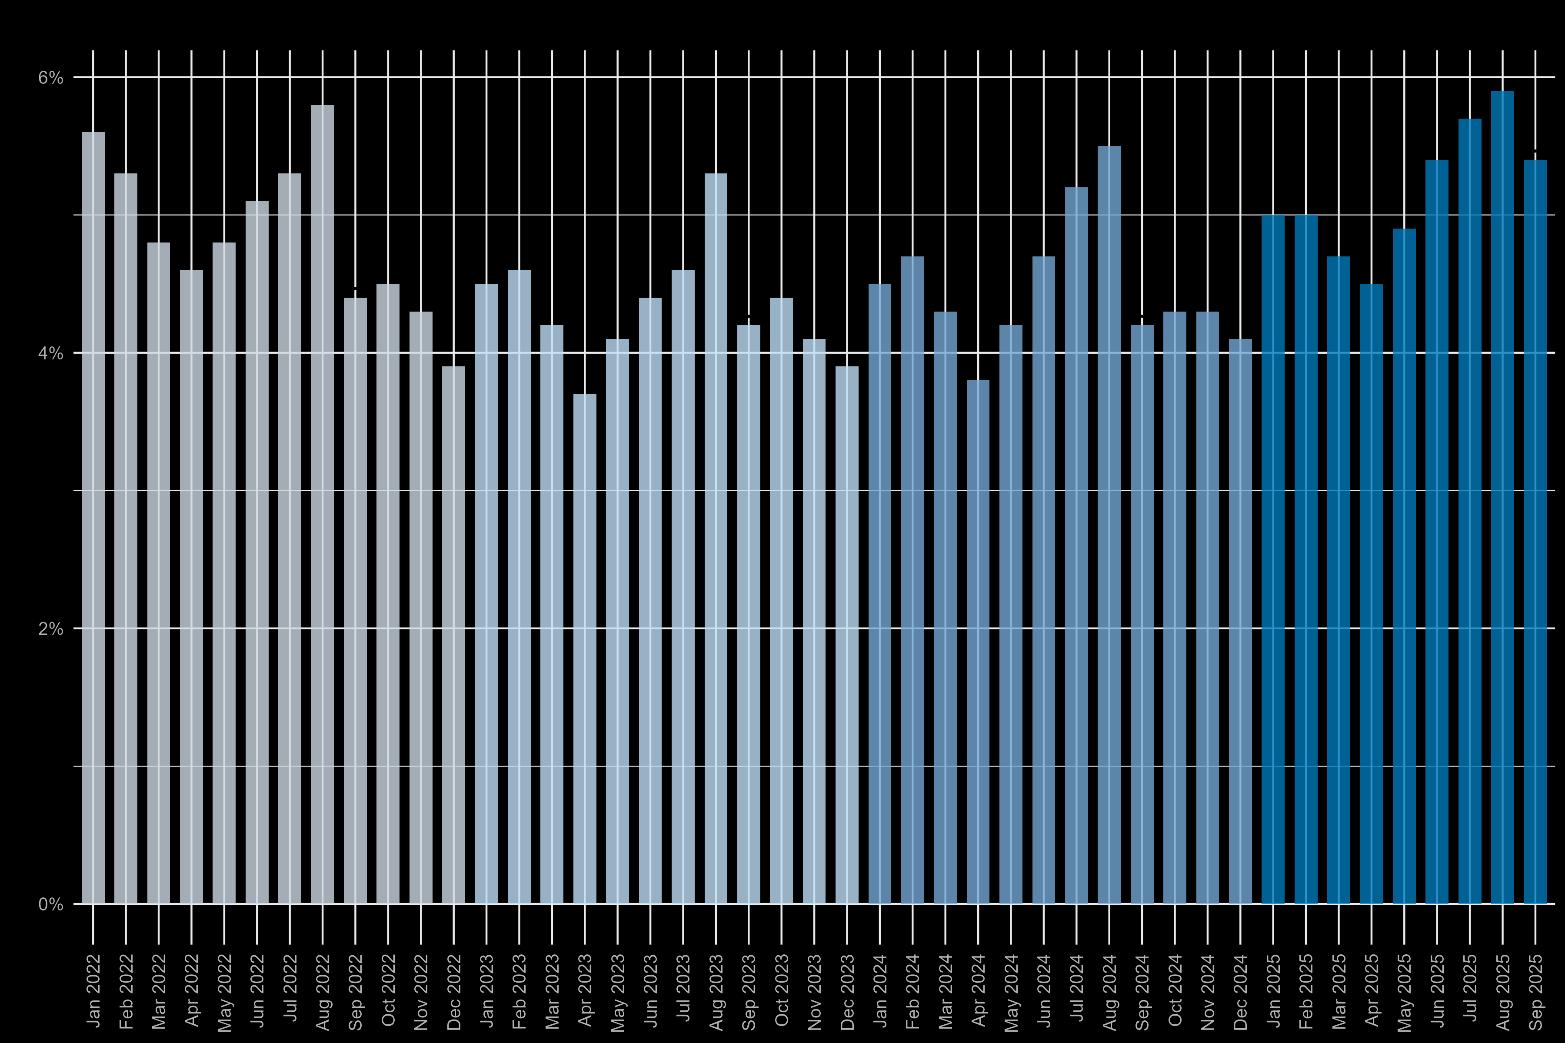
In September 2025, Philadelphia's unemployment rate stood at 5.4%. The total labor force was 789,434, with 746,980 residents employed.
While the June rate provides a snapshot of the month, the historical trend shows that Philadelphia's unemployment rate remains persistently higher than state and national averages.
Figure 3: UnemploymentRate Since January 2022
Philadelphia MSA Industry
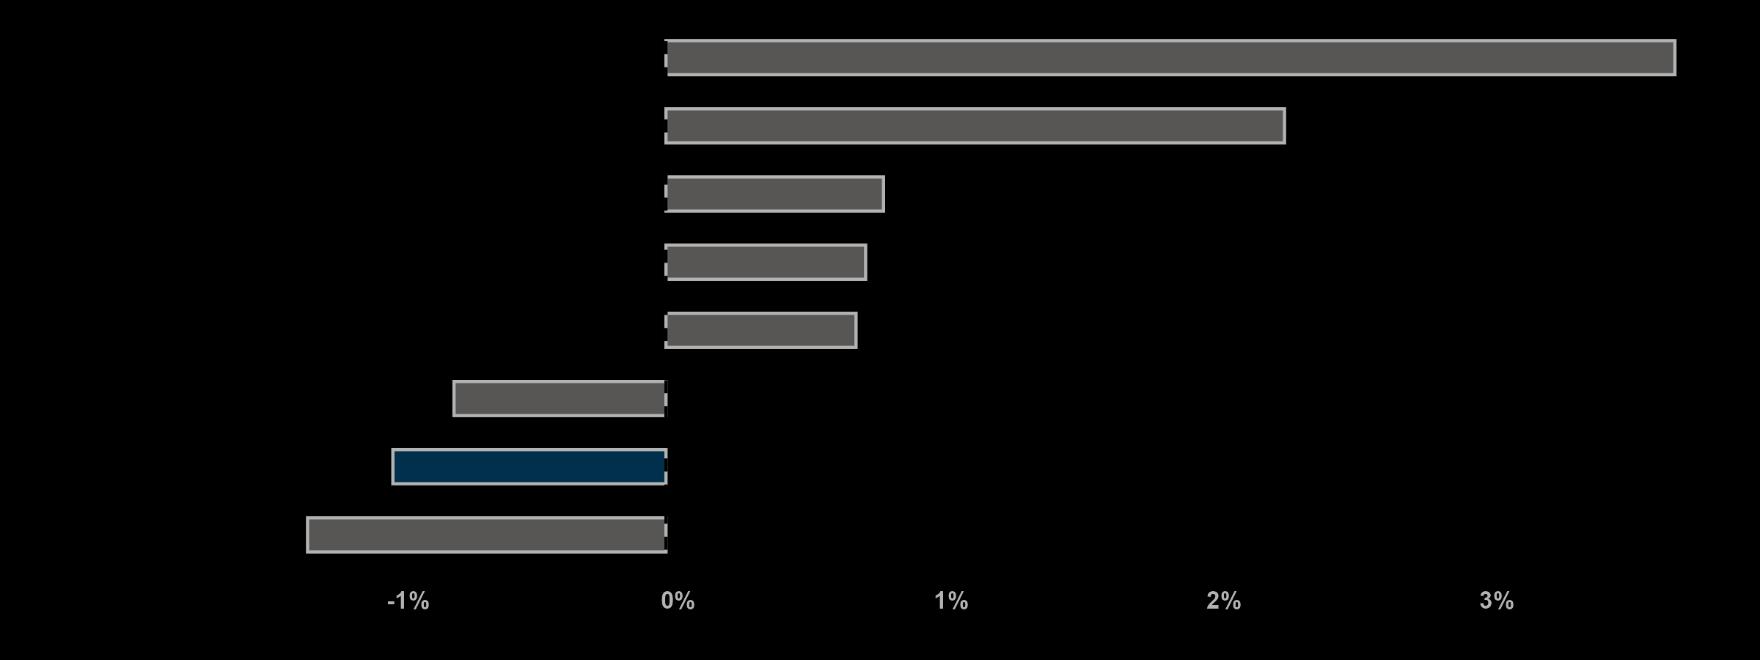
In September 2025, the Philadelphia MSA's overall employment performance experienced a slight contraction of approximately -1% compared to other major metros, while metros like Houston and Chicago saw significant job growth. This modest regional decline reflects a complex and divergent picture across the area's key industries. While the two largest sectors, Education and Health Services and Professional and Business Services, have anchored the region with substantial year-over-year job gains, recent monthly data reveals short-term weakness.
Source: Philadelphia Works Analysis
CES
Figure 5: Regional Employment by Industry Sector in Philadelphia MSA, September 2025
Figure 4: Regional Employment by Industry Sector in Philadelphia MSA, September 2025
The Philadelphia MSA, officially the Philadelphia-Camden-Wilmington, PA-NJ-DE-MD Metropolitan Statistical Area, is a large metropolitan region in the Northeastern US centered on Philadelphia. It encompasses counties in Pennsylvania (Bucks, Chester, Delaware, Montgomery, and Philadelphia), New Jersey (Burlington, Camden, Gloucester, and Salem), Delaware (New Castle), and Maryland (Cecil).
Industry Geospatial Concentration In Philadelphia
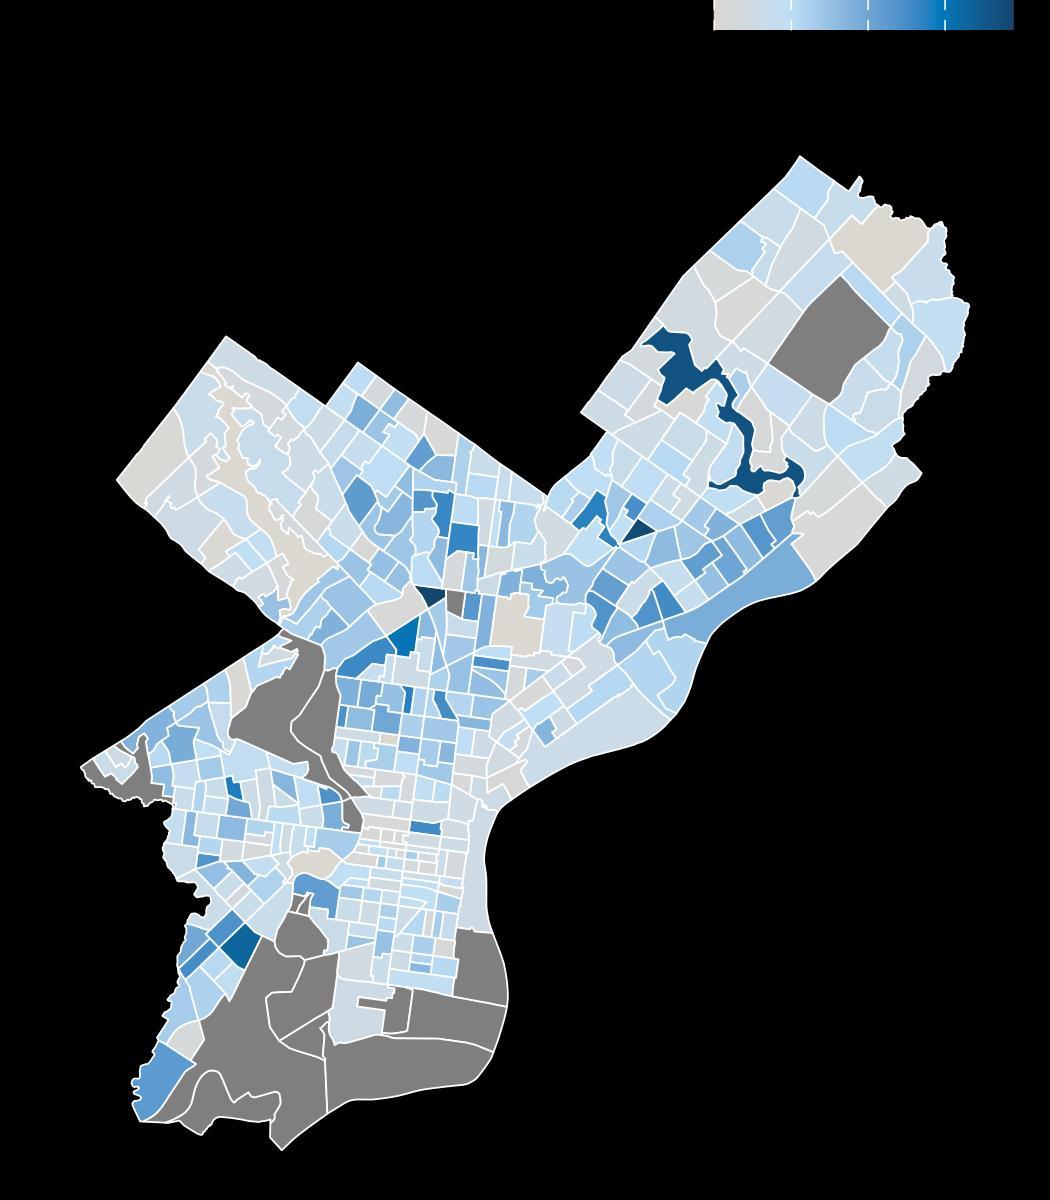
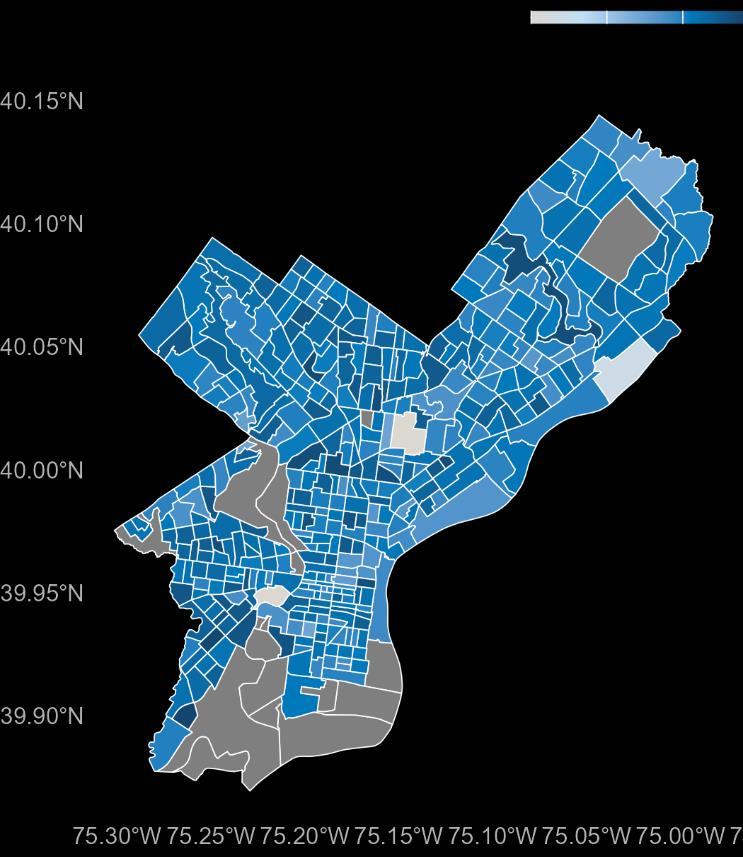
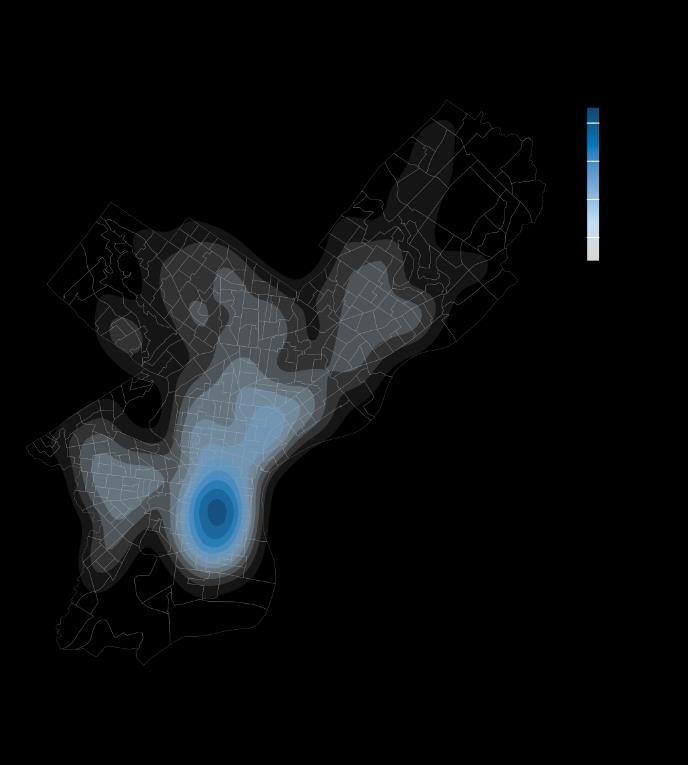
Map 1: Education and Health Services Employed Individuals Distribution, ACS-1 2024
The regional economy in Philadelphia County is primarily driven by the Education and Health Services sector, which has shown predominant demand and growth in general.
The map (Map 1) illustrates the geospatial distribution of sector development and growth at the census tract level in Philadelphia County.
Lighter blue areas have relatively fewer facilities for Education and Health Services, while the grey areas indicate no related clustered Education and Health Services.
Dark blue areas represent the highest concentration of employment in Education and Health Services, mainly in the west, center, and north of Philadelphia, near major health care centers and institutions. It also indicates a high density of employed individuals in those areas.
Education and Wage
The education-wage relationship in Philadelphia shows some expected patterns.
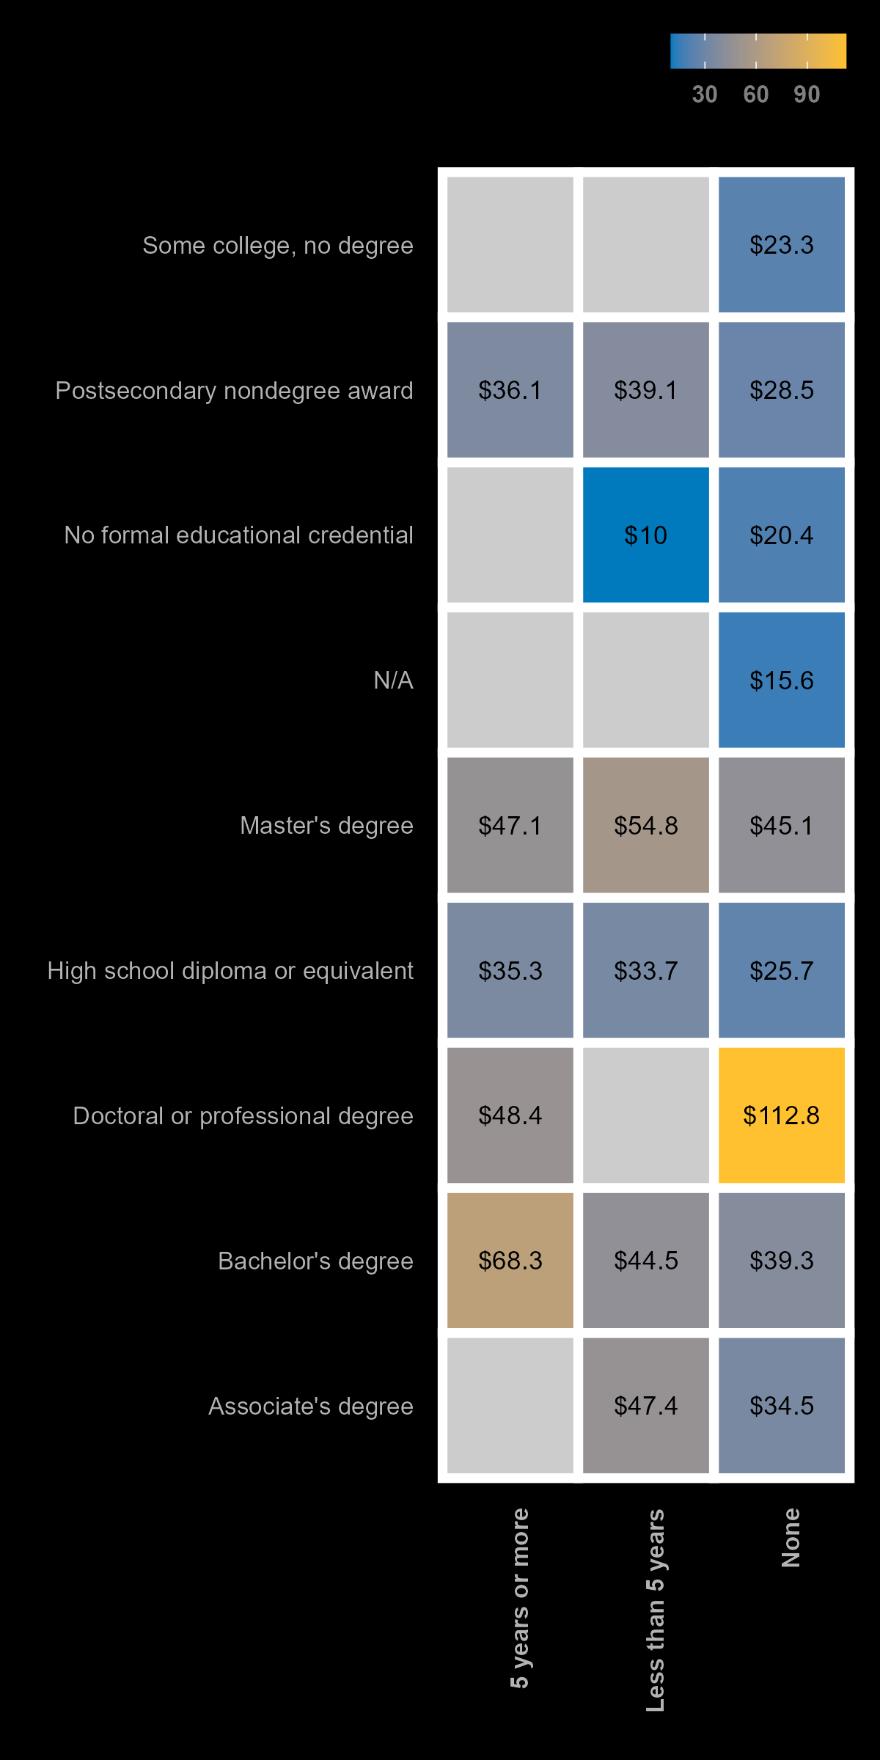
Bachelor's degree holders with 5+ years of experience earn the highest median wages among traditional pathways at $68.3/hour. But the real outlier is doctoral/professional degree holders with no prior experience, commanding $112.8/hour likely driven by fields like medicine and law where credentials alone open high-paying doors.
Experience premiums vary by education level. For high school graduates, 5+ years adds nearly $10/hour ($35.3 vs. $25.7 for no experience). But for master's degree holders, the pattern flips: those with less than 5 years outearn their more experienced peers ($54.8 vs. $47.1), possibly reflecting recent graduates in high-demand tech or analytics roles.
At the lower end, workers without formal credentials and limited experience face the tightest wages just $10/hour for those with under 5 years of experience. The gap between no credential ($1020/hour) and a bachelor's degree ($3968/hour) underscores how much education still shapes earning potential in this labor market.
Figure 6: Relation BetweenEducationLevel, MedianHourly Earnings and Work Experience, 2025
Recent Unemployment Claims
Unemployment Claims in September 2025
3,897
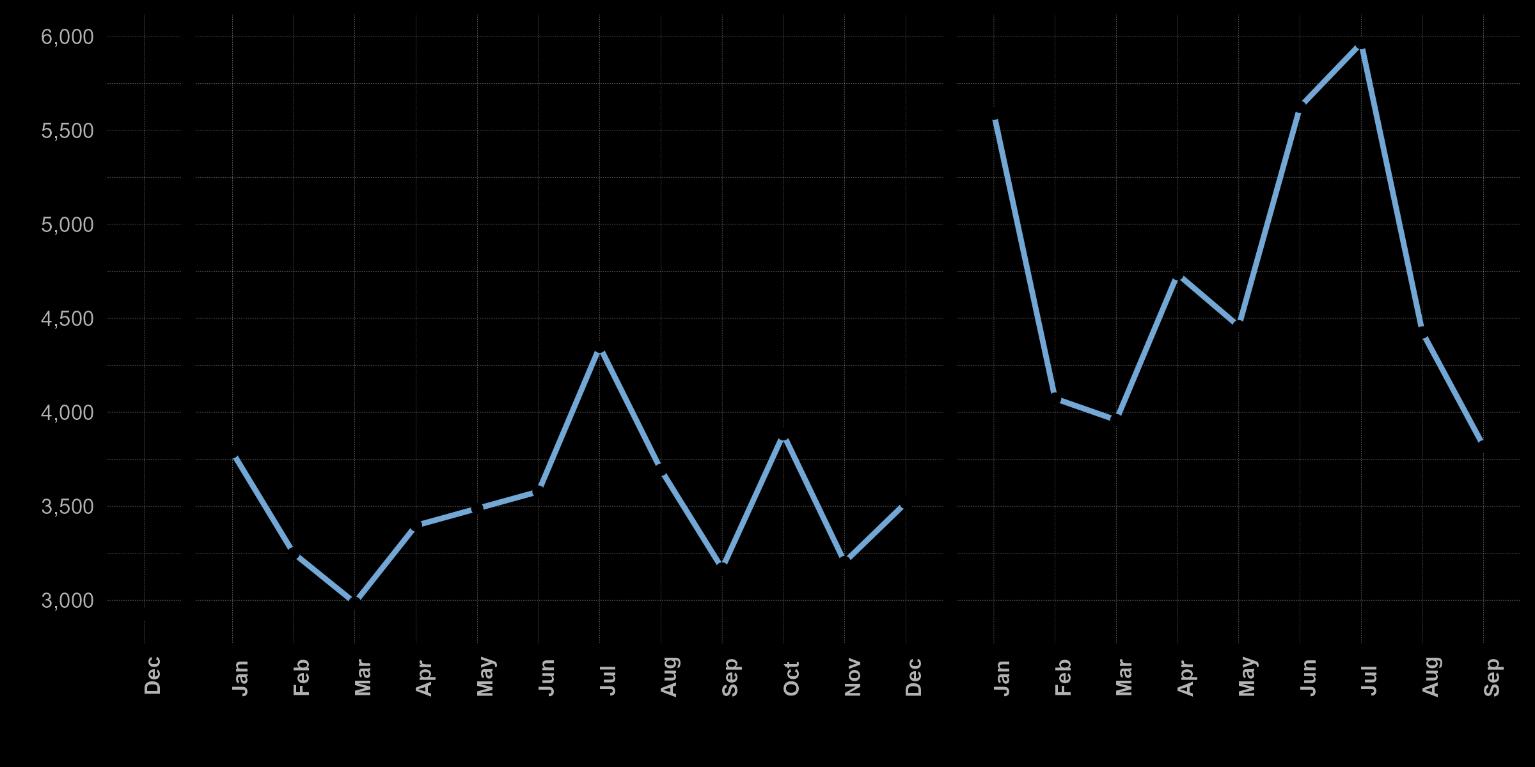
In early 2025, initial unemployment claims in Philadelphia surged sharply, hitting a peak of nearly 6,000 in July 2025 the highest level seen in recent years.
Following this spike, claims moderated through August and September. By September 2025, new initial claims had declined to approximately 3,900, indicating some stabilization in the labor market after the summer volatility.
Customer Service Representatives
Security Guards
Laborers & Freight, Stock & Material Movers
Construction Laborers
Landscaping & Groundskeeping Workers
Figure 7: Monthly Initial Unemployment Claims by Philadelphia Residents, Previous 24 Months
Employer Demand
Overall Trends
Philadelphia employers have shown recovering demand for labor over the last two years. However, this quarter saw a decline in job postings, following national trends of dampened demand.
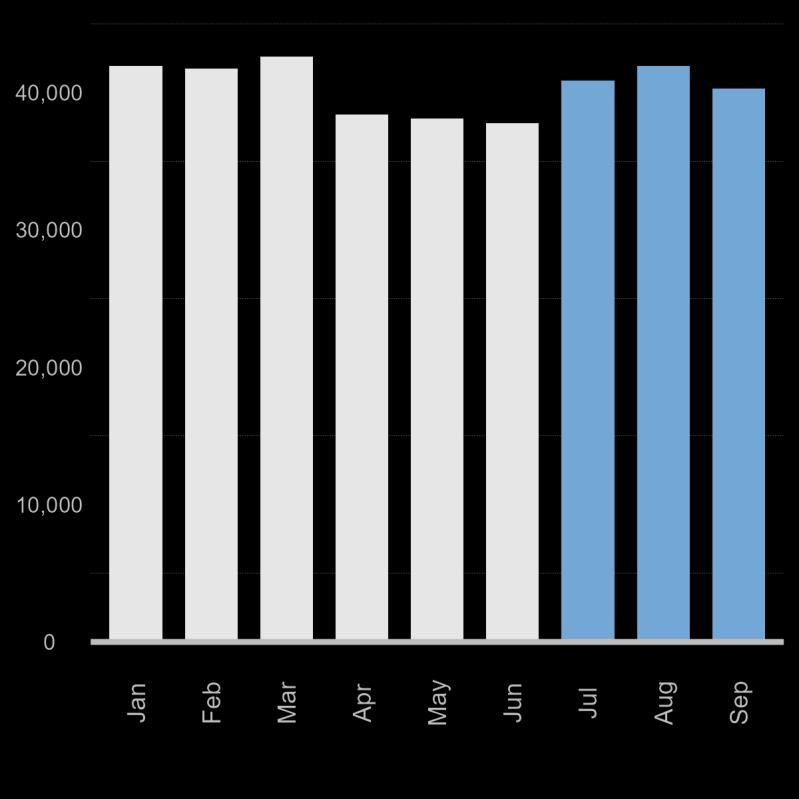
Job postings rebounded in Q3 2025 after a soft spring. The year started strong January through March held steady around 42,000-43,000 postings then dropped sharply in April, bottoming out near 37,000 in June 2025.
Q3 2025 reversed course: July jumped back to 41,000, August hit 42,500, and September settled around 40,500. Employer demand hasn't fully returned to early-year levels, but the Q2 2025 slump appears to be over.
Total Unique Postings in Q3 2025
123,110
Change in Total Postings Over Previous Quarter
+8,820
Figure 8: Monthly Job Postings in Philadelphia County
Demand Highlights
Higher education and healthcare dominate Philadelphia's hiring. Colleges and universities account for 28% of job postings (7,113) during Q3 2025, as a driving force in the job market. Employment placement agencies (25%) and temporary help services (9%) make up over a third of all postings. Hospitals add another 9%. Healthcare demand is fragmented across categories, such as ambulance services, surgical centers, home health, but collectively it's massive. Meanwhile, Engineering services (6%) and commercial banking (3.5%) round out the list.
Figure 9: Top 10 Unique Job Postings By Employer
Figure 10: Top 10 Unique Job Postings By Industry
Wage Growth in Pennsylvania
Wage growth across Pennsylvania showed significant disparities among industries. Mining, Logging, and Construction led all sectors with a 7.07% year-over-year wage increase to an average of $42.40. Finance and Insurance ($48.13) and Leisure and Hospitality ($21.89) also posted strong wage gains of 4.65% and 4.09%, respectively. However, the Information sector saw wages decline by 0.39% to $43.29, while Trade and Transportation ($28.54) and Education and Health Services ($27.76) experienced moderate growth at 2.22% and 2.28% respectively.
Figure 11: PennsylvaniaYear-over-YearWage Growth, September 2025
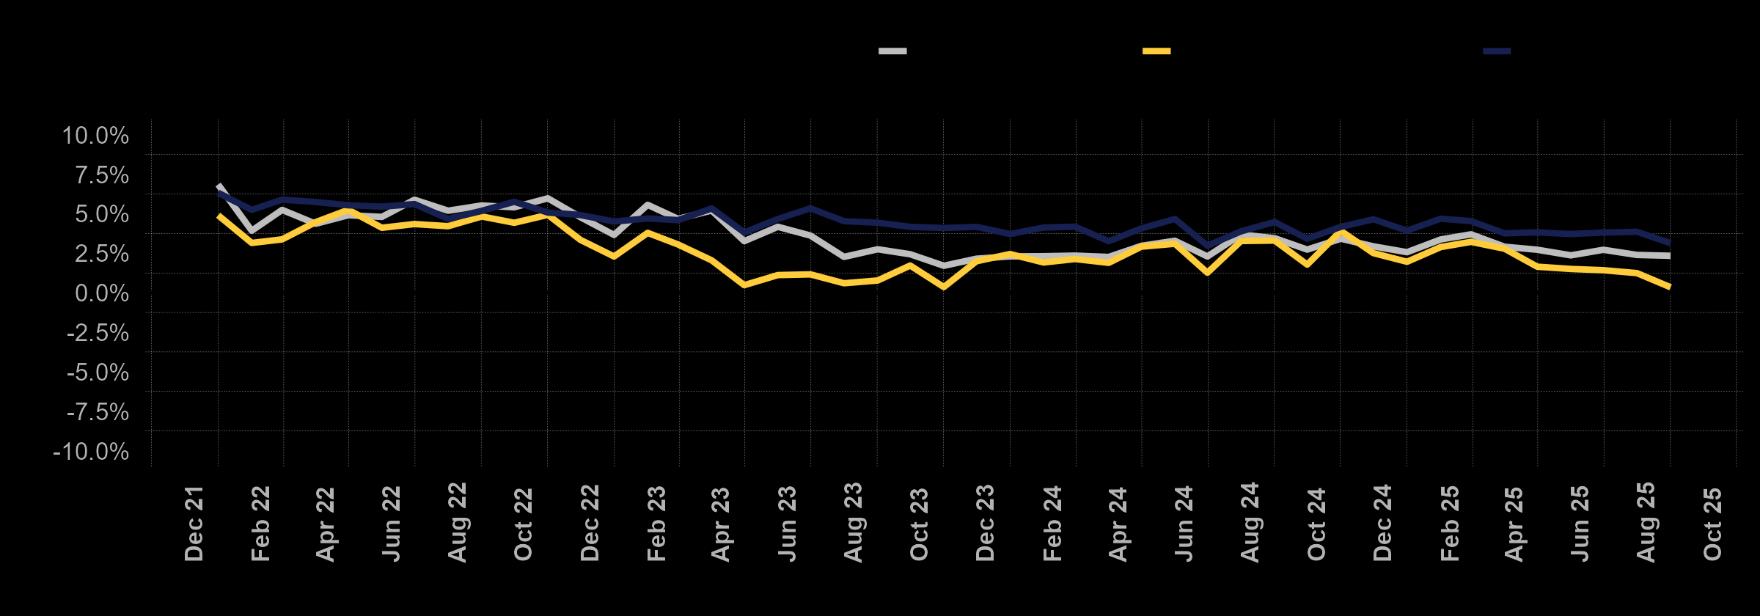
By September 2025, year-over-year wage growth for all private employment showed continued stabilization. The trend lines, which represent the Philadelphia metro area, Pennsylvania, and the U.S., have largely converged after years of post-pandemic volatility. As of the latest data, growth rates are stabilizing around 3% across all three geographies.
Figure 12: Year over YearChange inAverageHourly Wages, All Private Employment
Inflation
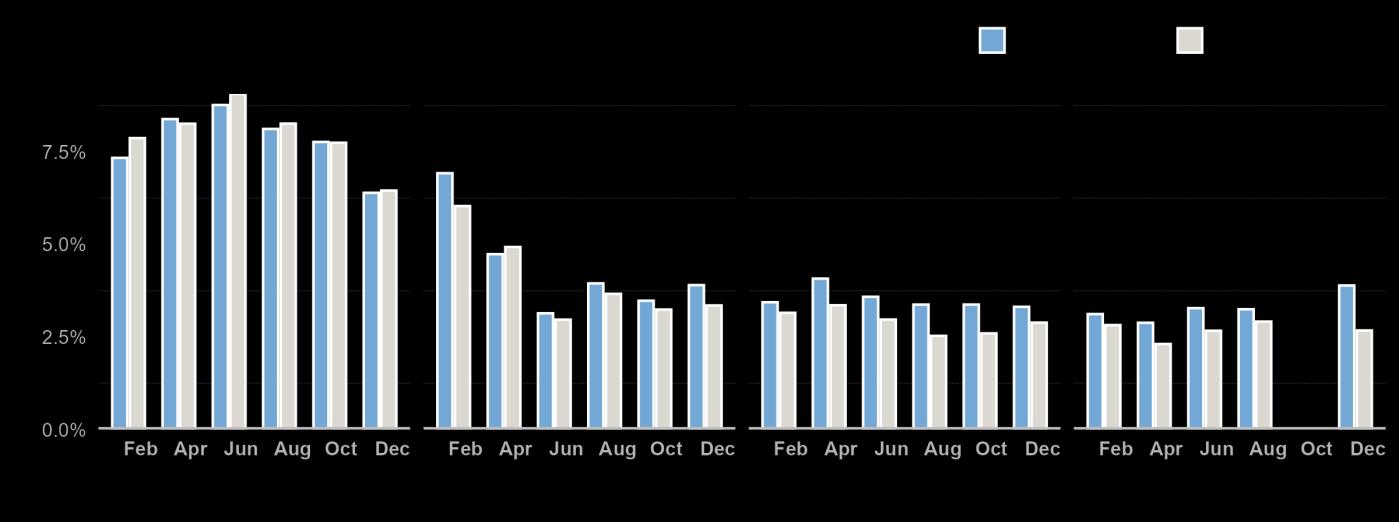
Inflation has cooled considerably from its 2022 highs. Back then, prices were surging 8-9% yearover-year; by August 2025, the national rate had fallen to 2.9% and Philadelphia to 3.3%. The trajectory is clear—steady deceleration over three years.
That said, Philadelphia still runs hotter than the national average. The gap has held around 0.3-0.5 percentage points through most of 2025, and December data shows it widening: 3.9% locally versus 2.7% nationally. Housing and service costs likely drive the difference.
For workers, the picture is mixed. Wage growth in several sectors now outpaces inflation construction at 7%, finance at 4.6% meaning real earnings are rising. But for lower-wage workers in sectors with flat or declining pay, even 3% inflation erodes purchasing power. The post-pandemic price shock is fading, but it hasn't disappeared.
Figure 13: Bimonthly Year-Over-YearInflationAccordingtothe ConsumerPrice Index,2022 to Present
Resident Workers
Resident Workers: Gender
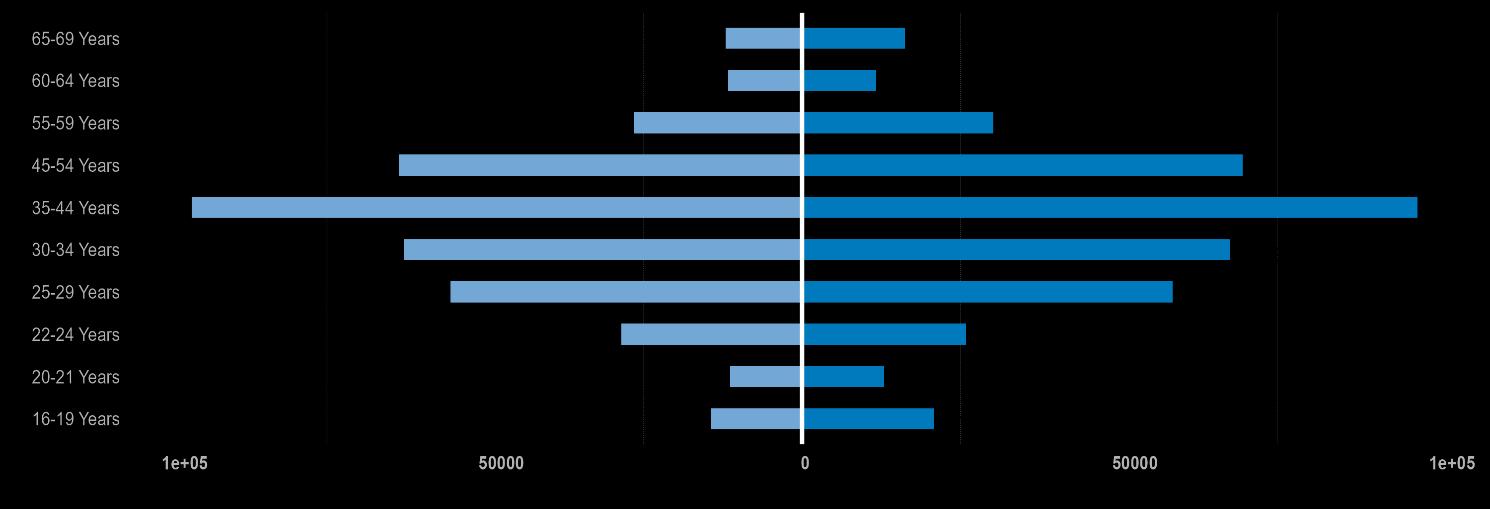
Philadelphia's labor force totals 1.28 million, and concentrates in prime working age, with the 35-44 cohort alone accounting for roughly 193,000 workers. Women outnumber men across nearly all age groups most strikingly among teens (16-19) and older workers (65-69), where female participation rates pull notably ahead.
Figure 14: Labor Force by Age and Binary Sex, ACS 2024
While Philadelphia’s labor force has grown in recent years, employment outcomes vary by race, ethnicity, and educational attainment.
Source:
The gender gap is calculated as the differencebetween female and male Labor Force Participation Rates (LFPR).The map (Map 2) highlights thegender gap in LFPR across Philadelphia County, derivedfrom the2024 ACS.
Areas with darker blue shades,particularly in North and Northeast Philadelphia, indicate significant disparities wheremen's participation rates are much higher than women's. Central and Southern Philadelphia showing up as lighter blue areas,indicating more balanced LFPR between genders.
Female Male
Map 2: Labor Force Participation Rate (%) GenderGap, ACS 2024
Resident Workers: Ethnicity
Residents of color are more likely to be out of the labor force and unemployed.
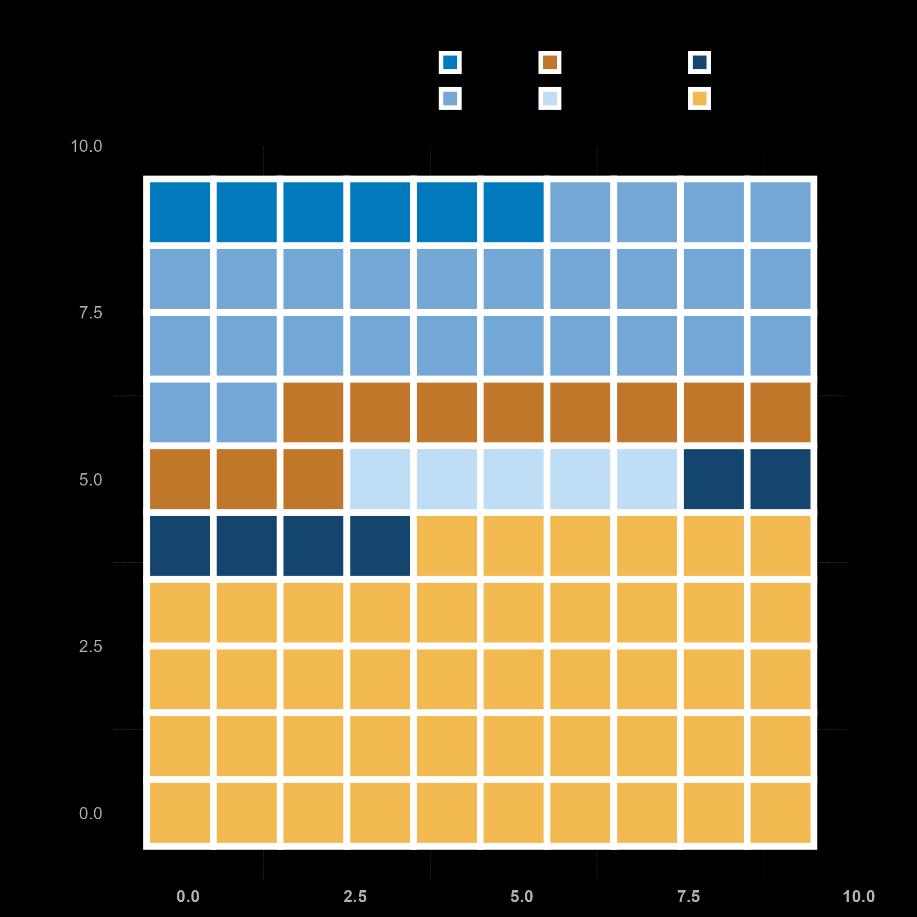
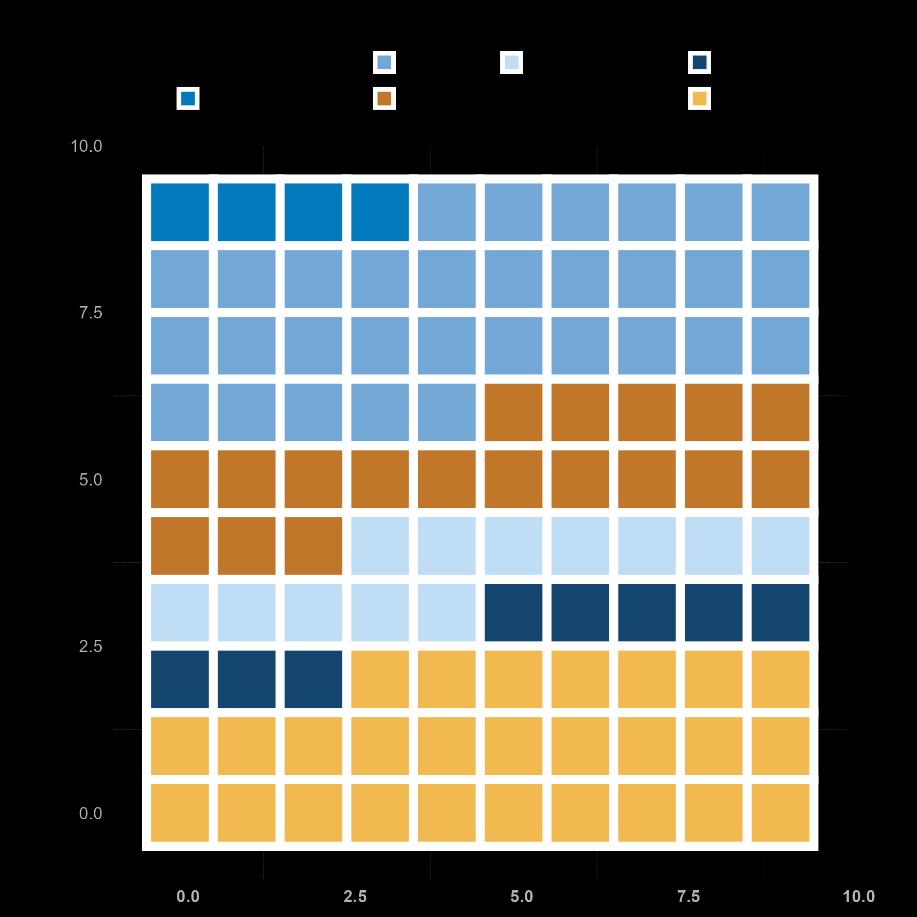
White workers make up 46% of Philadelphia's labor force but only about 27% of the unemployed they're significantly underrepresented among the jobless. Black workers show the opposite: 26% of the workforce but 31% of the unemployed. Hispanic workers face the steepest gap 11% of the labor force, 18% of the unemployed.
The waffle charts visualize the disparities. If unemployment hit all groups equally, the two charts would look the same. Instead, the yellow shrinks dramatically between charts while light blue, orange, and other categories expand. Black and Hispanic Philadelphians bear a disproportionate share of joblessness; white workers are largely insulated.
Figure 15: Labor Force ParticipationRate by Race, ACS 2024
Figure 16: Unemployment Percentage by Race, ACS 2024
Educational Attainment and Geospatial Pattern
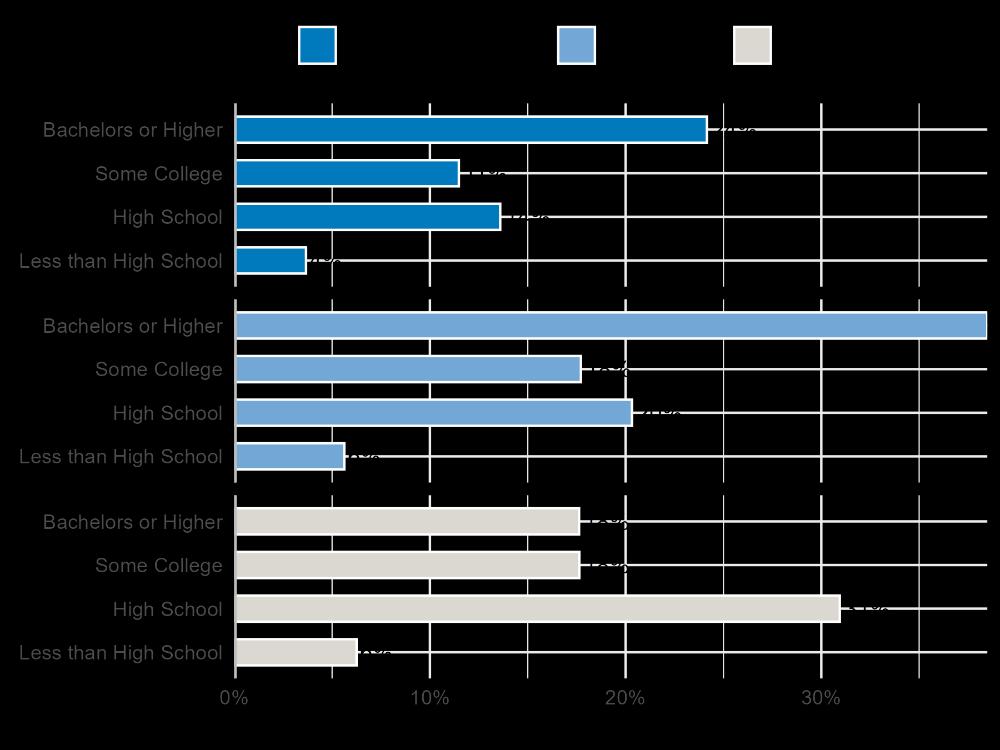
Education is the clearest imbalance. Among employed Philadelphians, 38% hold a bachelor's degree or higher. Among the unemployed, that share drops to 18%. High school graduates tell the reverse story: they're 20% of the employed but 31% of the unemployed. The pattern holds across racial groups. The unemployment rate gap between education levels is consistent regardless of race, though the baseline rates differ.
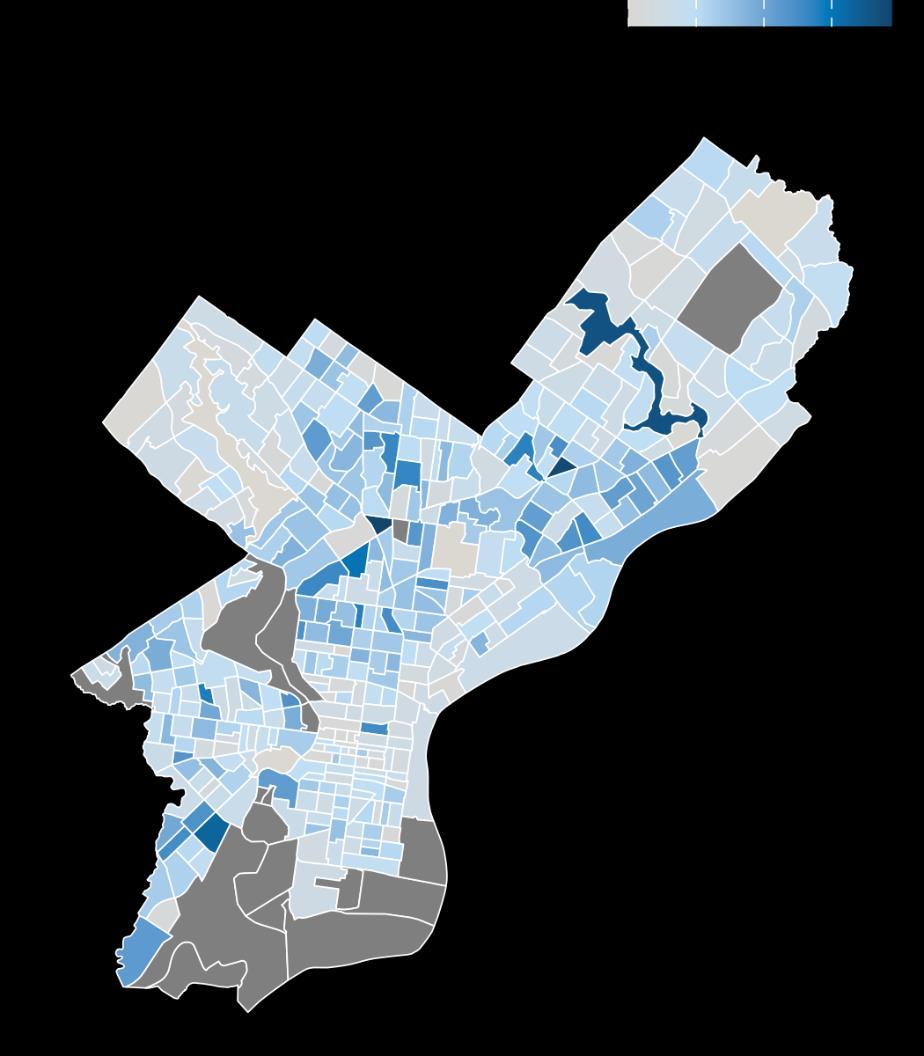
Unemployment clusters in North Philadelphia, parts of West Philadelphia, and sections of the lower Northeast, which shows the darkest shading on the map, census tracts where joblessness runs highest.
Center City, Northwest Philadelphia, and the Far Northeast remain lighter. The spatial pattern mirrors income and educational attainment maps you'd see elsewhere: concentrated disadvantage in the same neighborhoods, decade after decade.
Map 3: Unemployment Rate (%) by Census Tract in Philadelphia,ACS 2024
Figure 17: Proportion of Employmentand Labor Force Participation by Educational Attainment, ACS 2024
Geospatial Inflow & Outflow
Philadelphia is intrinsically connected to its suburban neighbors. Nearly half of all primary jobs in the city are held by workers who commute from outside the city limits.
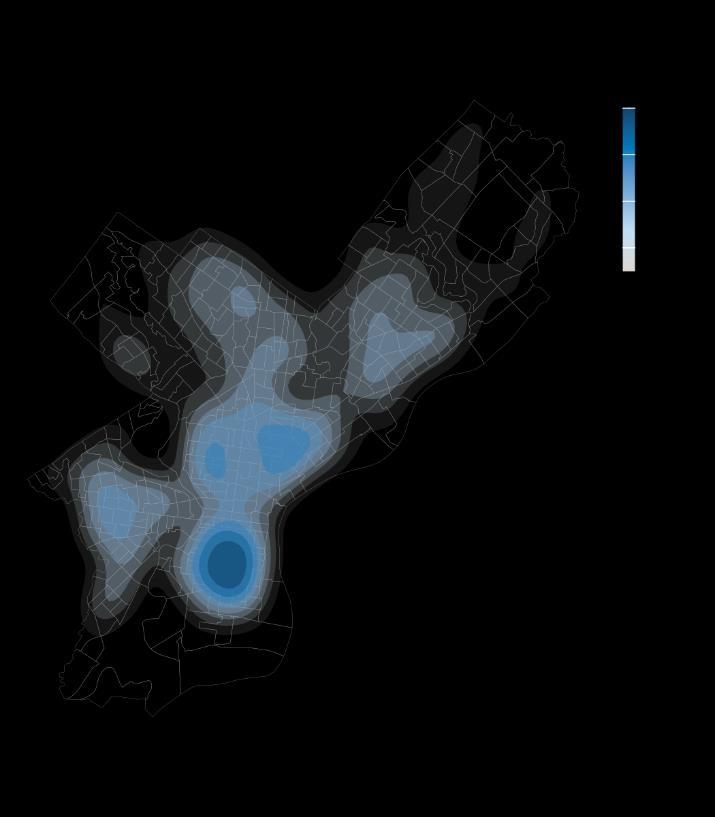
Commuting patterns have greatly changed in the years since COVID-19. According to LEHD 2023, darker shades in Map 4 and Map 5 indicate higher concentrations of employed residents and employed workers. The dense areas are found in Center City and parts of South Philadelphia.
Map 4: Residents Densityof Employmentin Philadelphia , Total All Jobs, LEHD 2023
599,926
Total All Jobs Commute Out
15% Of Resident Workers Relied on Public Transportation in 2023
17% Of Resident Workers Had No Access to a Vehicle in 2023 Source: Philadelphia
Map 5: Workers Density of Employment in Philadelphia, Total All Jobs, LEHD 2023
676,054
Total All Jobs Commute In
Appendix
Detailed Industry and Occupation Tables
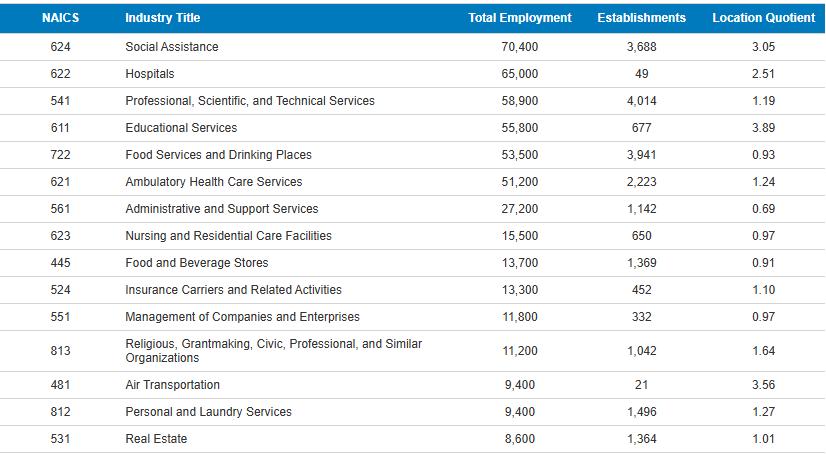
Appendix Table 1: Largest Detailed Industry Sectors in Philadelphia, Q2 2025
From the Quarterly Census of Employment and Wages, this table shows the 15 largest industry sectors by total employment. These data are released on a roughly six-month delay.
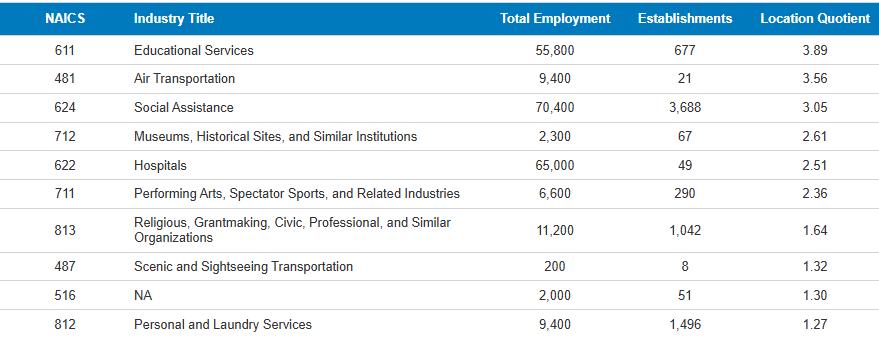
Appendix Table 2: Most Specialized Detailed Industry Sectors in Philadelphia, Q2 2025
From the Quarterly Census of Employment and Wages, this table shows the 10 most specialized industry sectors by total employment. These industries are disproportionately important to Philadelphia’s economy. These data are released on a roughly six-month delay.
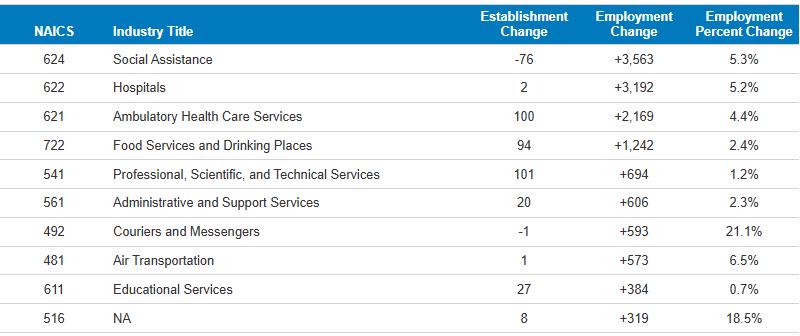
Appendix Table 3: Detailed Industry Sectors in Philadelphia with Largest Year-Over-Year Growth, Q2 2025
From the Quarterly Census of Employment and Wages, this table shows the 10 industry sectors with the largest annual employment growth. These data are released on a roughly six-month delay.
Broadcasting and Content Providers
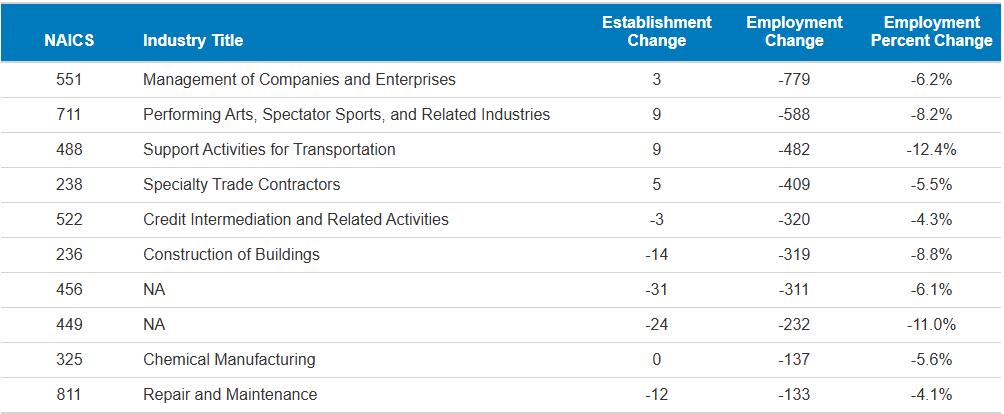
Appendix Table 4: Detailed Industry Sectors in Philadelphia with Largest Year-Over-Year Declines, Q2 2025
From the Quarterly Census of Employment and Wages, this table shows the 10 industry sectors with the largest annual employment declines. These data are released on a roughly six-month delay.
Health and Personal Care Retailers
Furniture, Home Furnishings, Electronics, and Appliance Retailers
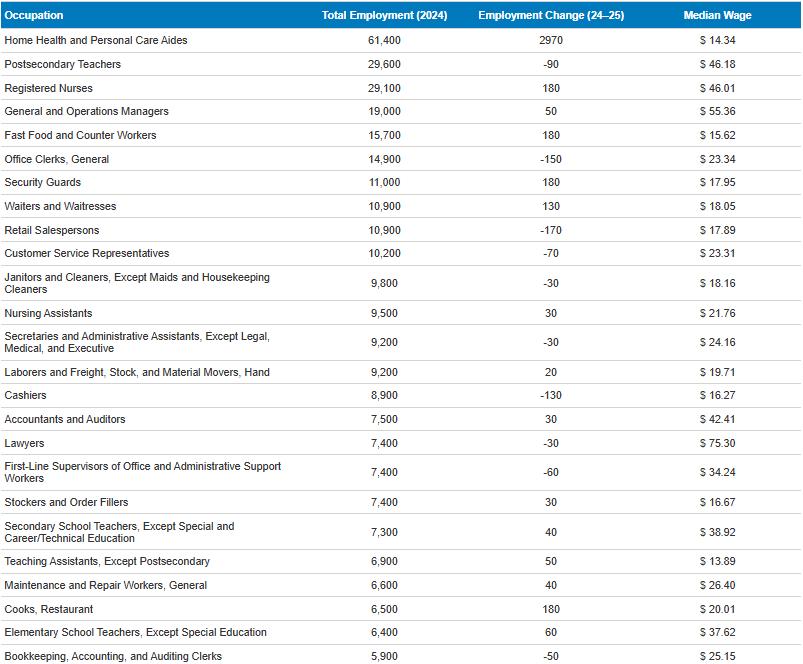
Appendix Table 5: Largest Occupations in Philadelphia with Employment Change from 2024 to 2025
Basedon estimates derived from the Quarterly Census of Employment and Wages, this table shows the 25 largest occupation by total employment. These data are released on a roughly nine-month delay.