Permian Basin Clean Energy
About the Permian Strategic Partnership
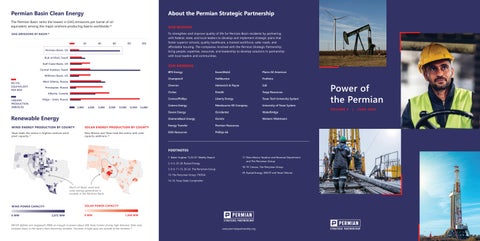
The Permian Basin ranks the lowest in GHG emissions per barrel of oil equivalent, among the major onshore producing basins worldwide.25
OUR MISSION
GHG EMISSIONS BY BASIN
26
20
40
60
80
100
Permian Basin, US Rub al Khali, Saudi Gulf Coast Basin, US
OUR MEMBERS
Central Arabian, Saudi Williston Basin, US KG CO 2 EQUIVALENT PER BOE LIQUIDS PRODUCTION (MBOE/D)
To strengthen and improve quality of life for Permian Basin residents by partnering with federal, state, and local leaders to develop and implement strategic plans that foster superior schools, quality healthcare, a trained workforce, safer roads, and affordable housing. The companies involved with the Permian Strategic Partnership bring people, expertise, resources, and leadership to develop solutions in partnership with local leaders and communities.
West Siberia, Russia Precaspian, Russia Alberta, Canada Volga – Urals, Russia 2,000
4,000
6,000
8,000
10,000
12,000
14,000
Renewable Energy WIND ENERGY PRODUCTION BY COUNTY
SOLAR ENERGY PRODUCTION BY COUNTY
Texas leads the nation in highest onshore wind plant capacity. 27
New Mexico and Texas lead the nation with solar capacity additions. 28
BPX Energy
ExxonMobil
Plains All American
ChampionX
Halliburton
ProPetro
Chevron
Helmerich & Payne
SLB
Civitas
Kinetik
Targa Resources
ConocoPhillips
Liberty Energy
Texas Tech University System
Coterra Energy
Mewbourne Oil Company
University of Texas System
Devon Energy
Occidental
WaterBridge
Diamondback Energy
Ovintiv
Western Midstream
Energy Transfer
Permian Resources
EOG Resources
Phillips 66
FOOTNOTES 1. Baker Hughes “5.23.25” Weekly Report 2, 4-5, 25-28. Rystad Energy 3, 6-9, 11-13, 20-24. The Perryman Group 10. The Perryman Group, TXOGA
17. New Mexico Taxation and Revenue Department and The Perryman Group 18-19. Census, The Perryman Group 29. Rystad Energy, ERCOT and Texas Tribune
14-16. Texas State Comptroller Much of Texas’ wind and solar energy generation is located in the Permian Basin
SOLAR POWER CAPACITY
WIND POWER CAPACITY 0 MW
2,072 MW
0 MW
1,840 MW
ERCOT defines one megawatt (MW) as enough to power about 200 Texas homes during high demand. Data only includes areas in the state’s main electricity markets. Counties in light grey are outside of the markets. 29
www.permianpartnership.org
Power of the Permian VOLUME V
|
JUNE 2025