SLN Profile:
1. Executive Summary
This document outlines guidance recommended by the SLN Profile for Small Lung Nodule Volume 43 Assessment and Monitoring in Low Dose CT Screening. This Profile focuses on improving the consistency
and reliability of quantitative CT volume measurements for solid lung nodules, aiding in the management of
screen-detected nodules and optimizing patient care. This Profile provides a framework to ensure reliable 46 and consistent CT imaging results across different imaging platforms and clinical sites. 47
48
The SLN Profile aims to achieve a useful level of performance for a specific biomarker. It consists of: 49
50
1. The Claim (Section 2): Describes the biomarker performance.
2. Conformance Checklist (Section 3): Outlines activities that generate the biomarker and sets 51 requirements for Actors (Radiographers/technologists)
52
53 between 6-10 mm in diameter. It sets requirements for:
This Profile focuses on the accuracy and precision of quantitative CT volumetry for solid lung nodules
54
55
56
57
58
• Acquisition Devices
• Technologists/Radiographers
• Radiologists
• Image Analysis Tools
These requirements cover various activities, from equipment quality assurance to image analysis, aiming to
achieve accurate measurements and reduce unnecessary variability. The Profile provides two sets of claims:
1. 95% confidence intervals for volumetric measurements of 6-10 mm solid lung nodules. 61
2. Guidance on: 62
• Percentage of volumetric change needed to confirm true solid lung nodule growth with 95%
confidence.
• 95% confidence interval for volumetric size change measurements. 65
This document is a resource for clinicians, imaging staff, vendors, purchasers, and researchers involved with
pulmonary nodule volume measurements. This Profile document includes a conformance test that can be
performed to test the fundamental imaging performance characteristics of the CT scanner to be used at a
clinical site.
Note: This Profile sets requirements to achieve the claim, not standards of care. Patient care always takes
precedence over meeting Profile goals.
2. Clinical Context and Claims
This Profile focuses on quantifying volumes and volume changes of solid lung nodules with a longest bi-
80
83
dimensional diameter between 6 mm and 10 mm.
When all relevant staff and equipment conform to this Profile, the following claims are supported:
Claim 1: Nodule Volume
For a measured nodule volume Y, the 95% confidence interval for the true nodule volume is Y ± (1.96 × Y ×
CV), where CV is the Coefficient of Variation from Table 1.
Claim 2: Nodule Volume Change
a) A measured nodule volume percentage change X indicates a true change if X > (2.77 × CV1 × 100), with
95% confidence.
b) For volume measurements Y1 and Y2 at two time points, with corresponding CVs (CV1 and CV2) from
Table 1, the 95% confidence interval for volume change Z = (Y2-Y1) ± 1.96 × ![Y1 × CV1]² + [Y2 × CV2]²
These claims are valid when:
• The nodule is completely
•
is
• Nodule's shortest diameter is at least 60% of its longest diameter
• Nodule is measurable at both time points
• Interpolation is used for CV values between provided table values
Table 1. Coefficients of Variation (CV)
For a more detailed explanation of the clinical context, including the benefits and challenges of low-dose CT
for lung nodule measurement, please refer to the full discussion in Appendix A
For detailed examples and clinical interpretations of Claims 1 and 2, please refer to Appendix B. A web-
based calculator for computing the equations in the Claims is available at
3. Clinical Site Conformance Checklist
This checklist provides a streamlined approach for clinical sites to achieve conformance with this Profile. It
is designed to be applicable across different regions, including Europe and the USA. The checklist is divided
into two main sections: Preparation and Performance. Each step indicates the responsible actor(s) in
parentheses.
For detailed technical information on Profile requirements, please refer to Section 4.
1. CT Scanner and Lung Nodule Analysis Software Verification (Radiologist)
1.1 Verify that the CT scanner model is approved for use in your region.
1.2 Verify that the volumetric software name and version are approved for use in your
region.
2. CT QA and Lung Screening Protocol Verification (Medical Physicist, Technologist/Radiographer)
Scan a reference object using the
Obtain a passing automated
CT Data Acquisition, Lung Nodule, and Segmentation Verification (Radiologist)
4.1 Verify same CT scanner and protocol used for follow-up
4.2 Confirm no IV contrast was used
4.3 Verify nodule characteristics (solid, 6-10mm longest diameter at baseline, ≤ 1/3
4.4 Check for absence of significant artifacts and excessive noise
4.5 Verify absence of segmentation errors
Note: You can use the approved nodule calculator for measurement error guidance
Note: Specific regional requirements (e.g., CTDIvol limits) should be incorporated into the relevant steps as
needed.
4. Profile Activities
This Profile outlines the activities necessary for proper lung cancer screening to achieve the applicability of
the profile claims. It is organized by key actors involved in the screening process. Each actor is responsible
for specific activities that contribute to the overall quality and consistency of the screening process. Figure
1 provides a quick overview of how the different activities for CT tumor volumetry are sequenced. The
following table (Table 2) outlines the actors and their required activities, with references to detailed
specifications in subsequent sections.
Radiographer Staff Qualification, Protocol Design, Subject Handling, Image Data Acquisition, Image Data Reconstruction, Image Quality Assurance
Note: Successful implementation of this Profile requires a team effort. Each actor must perform their
respective activities as outlined in the table above to ensure the overall quality and consistency of the lung
cancer screening process.
4.1.
This activity evaluates the Acquisition Device and Image Analysis Tool prior to their use in the Profile. It
includes validations and performance assessments necessary to reliably meet the Profile Claim.
4.1.1
• Performance measurements of specific protocols are addressed in section 4.4.2.
• CT scanners should have a minimum of 16 detector rows to ensure:
• Adequate scan duration (entire lung in a single breath-hold)
• Sufficient z-axis resolution
• Appropriate radiation dose management
• Scanners with fewer than 16 detectors and pitch high enough to allow the entire lung to be scanned
in a single breath hold may result in Z-axis resolution that is inadequate for nodule volumetry in
some patients [26]
4.1.2
Table 3: Product Validation - Actors and Requirements 159 Parameter
Number of Detector Rows Acquisition Device Shall have 16 or more detector rows.
Acquisition Protocol Acquisition Device
Image Header Acquisition Device
Reading Paradigm Image Analysis Tool
Change Calculation Image Analysis Tool
Scientific Validation Image Analysis Tool
Shall be capable of storing and performing scans with parameters specified in section 4.4.2. Shall prepare and validate a protocol conformant with section 4.4.2.
Shall record actual values for tags listed in section 4.4.2 in the DICOM image header.
Shall present images from both time points side-by-side for comparison.
Shall calculate change as the difference in volume between two time points relative to the earlier time point, expressed in mm³.
Shall have appropriate scientific validation, including measurement linearity, coefficient of variation, and zero bias.
4.2. Staff Qualification
This activity evaluates the human Actors (Radiologist, Medical Physicist, Radiographer, and Image Analyst)
prior to their participation in the Profile. It includes training, qualification, or performance assessments
necessary to reliably meet the Profile Claim.
4.2.1 Discussion
• These requirements focus on achieving the Profile Claim, not evaluating medical or professional
qualifications.
• In clinical practice, the Radiologist interpreting the examination often will be the Image Analyst.
• In some clinical practice situations and research settings, the image analyst may be a non-radiologist
professional.
• Analyst Training should be appropriate for the setting and purpose of the measurements, covering
topics such as:
o Generation and components of volumetric
o
o
4.2.2 Specification
Radiologist Shall fulfill qualifications required by national or regional radiology boards, including:
- Certification by the appropriate national radiology board
- Appropriate licensing
- Documented experience in CT interpretation
- Compliance with continuing education requirements
Shall fulfill qualifications required by national or regional radiography boards, including:
- Certification by the appropriate national radiography board
Radiographer
- Appropriate licensing
- Documented training and experience in performing CT
- Compliance with continuing education requirements
Shall fulfill qualifications required by national or regional medical physics organizations, including:
Medical Physicist
Image Analyst
- Certification by the appropriate national medical physics board
- Appropriate licensing
- Documented experience in CT physics
- Compliance with continuing education requirements
Shall undergo documented training in performing CT image volumetric analysis of lung nodules in lung cancer screening by a radiologist having qualifications conforming to the requirements of this profile.
Note: If the Image Analyst is a Profile-conformant Radiologist, additional training is not required.
Note: Specific qualifications may vary by country within Europe. Actors should comply with their national
and local regulations and standards.
4.3. Equipment Quality Assurance
This activity involves quality assurance of imaging devices not directly associated with a specific subject. It
includes calibrations, phantom imaging, and performance assessments necessary to reliably meet the
Profile Claim.
4.3.1 Discussion
• Focus is on ensuring the acquisition device is aligned/calibrated/functioning normally.
• Conformance requires adherence to:
o Relevant national or regional regulations (e.g., EU medical device regulation 2017/745
(MDR))
o Equipment performance evaluation procedures of national radiology accreditation programs
o Manufacturer's quality control procedures
Page: 8 Table 4: Staff Qualification - Actors and Requirements
• Annual technical performance evaluation by a qualified medical physicist
• Daily quality control monitoring of water CT number, standard deviation, and artifacts
• Regular preventive maintenance by a qualified service engineer
4.3.2 Specification
Table 5: Equipment Quality Assurance - Actors and Requirements
Parameter
Quality Control Medical Physicist
Quality Control Medical Physicist
Maintenance
Medical Physicist
Shall perform quality control procedures consistent with those generally accepted for routine clinical imaging.
Shall adhere to installation and periodic quality control procedures specified by the scanner manufacturer and relevant national accreditation programs.
Shall ensure that preventive maintenance is conducted and documented by a qualified service engineer at intervals recommended by the scanner manufacturer.
Note: Specific requirements may vary by country within Europe. Actors should comply with their national
and local regulations and standards.
4.4. Protocol Design
This activity involves designing acquisition and reconstruction protocols to reliably meet the Profile Claim.
4.4.1 Discussion
• Protocol Design typically occurs at the imaging site, but sites may use protocols developed
elsewhere.
• Specifications focus on resulting dataset characteristics rather than specific techniques.
• In CT screening for lung cancer, minimizing radiation dose is crucial.
• CTDIvol ≤ 3 mGy is generally sufficient for a standard-sized person (170 cm, 70 kg; as defined by
ICRP Publication 89 (2002))
• Variability in CT nodule volumetry using low dose techniques is comparable to that of standard dose
techniques [14, 17, 18, 27, 28].
• Automatic Exposure Control is optional but should be consistent with baseline if used.
• Reconstructed Slice Thickness: Should be small relative to the size of the smallest nodules detected.
Thinner sections are preferable to reduce partial volume effects and improve accuracy [11-13, 36].
• Reconstruction Kernel should be medium smooth to medium sharp without edge enhancement.
4.4.2 Specification
Parameter
Table 6: Protocol Design - Actors and Requirements
Acquisition Protocol Radiologist and Radiographer
Shall prepare a protocol meeting the specifications in this table. Shall ensure
Tag
Page: 9
Nominal Tomographic Section
Thickness (T)
Reconstruction Protocol
Reconstructed Image Thickness
Reconstructed Image Interval
Resolution
Edge Enhancement
HU Deviation
Voxel Noise
Spatial Warping
Radiologist and Radiographer
Radiologist and Radiographer
Radiologist and Radiographer
Radiologist and Radiographer
Radiologist, Radiographer, and Medical Physicist
Radiologist, Radiographer, and Medical Physicist
Radiologist, Radiographer, and Medical Physicist
Radiologist, Radiographer, and Medical Physicist
Radiologist, Radiographer, and Medical Physicist
radiographers are trained on profile requirements.
Shall set to achieve reconstructed slice thickness ≤ 1.25 mm.
Shall prepare a protocol meeting the specifications in this table. Shall ensure radiographers are trained on profile requirements.
Shall set to ≤ 1.25 mm.
Shall set to ≤ Reconstructed Image Thickness (no gap, may overlap).
Shall validate that the protocol achieves:
• 3D PSF sigma ellipsoid volume ≤ 1.5mm³
• Z PSF sigma < 2x in-plane PSF sigma
Shall validate that the protocol does not result in edge enhancement > 5 %.
Shall validate that the protocol results in CT HU value deviation < 35 HU for Air and Acrylic materials.
Shall validate that the protocol achieves standard deviation ≤ 50 HU for homogeneous Air and Acrylic materials.
Shall validate that 3D image acquisition results in Spatial warping < 0.3 mm Root Mean Square Error (RMSE).
Note: See section 5.1. Technical Evaluation Methods
4.5. Subject Selection
Single Collimation Width (0018,9306)
Slice Thickness (0018,0050)
Spacing Between Slices (0018,0088)
This activity describes criteria and procedures for selecting appropriate imaging subjects to reliably meet
the Profile Claim.
4.5.1 Discussion
• Pulmonary Symptoms: Subjects should be asymptomatic or at baseline for cardiac and pulmonary
symptoms. Acute or subacute abnormalities could interfere with nodule volume measurements or
breath-holding compliance.
• Recent Medical Procedures: Procedures like bronchoscopy, thoracic surgery, or radiation therapy
may cause parenchymal lung abnormalities that could invalidate Profile Claims.
• Oral Contrast: Residual contrast from gastrointestinal imaging may cause artifacts interfering with
quantitative nodule assessment.
Page: 10
• Chronic Abnormalities: Conditions such as pulmonary fibrosis may affect nodule volume
measurement accuracy and invalidate Profile Claims.
4.5.2 Specification
Table 7: Subject Selection - Actors and Requirements
Parameter Actor Requirement
Medical Procedures
Pulmonary Symptoms
Referring Clinician Shall schedule scanning prior to or at an appropriate time, following procedures that could alter the attenuation of the lung nodule or surrounding lung tissue.
Radiologist Shall confirm appropriate timing of scan relative to medical procedures.
Referring Clinician Shall delay scanning for a time period that allows resolution of potential reversible CT abnormalities if pulmonary symptoms are present.
Radiologist Shall confirm absence of acute pulmonary symptoms or appropriate baseline status.
Note: If these conditions cannot be met, measurements may not be of sufficient quality to fulfill the Profile 235 Claims.
4.6. Subject Handling
This activity involves handling each imaging subject at each time point to reliably meet the Profile Claim.
4.6.1 Discussion
• Intravenous Contrast: Not used for CT lung cancer screening [29]. Its use may affect volume
quantification [30, 31] and invalidates Profile Claims.
• Artifact Sources: Radiographers should evaluate for and remove external metallic objects that may
produce artifacts.
• Subject Positioning: Consistent positioning is important to reduce variation in x-ray beam hardening,
scatter, and nodule orientation [32, 33]. 245
o Supine with arms overhead
o Sternum over table midline
o Midaxillary line at widest part of gantry 248
• Breath Holding: Scans should be performed during maximal inspiration to reduce motion artifacts
and improve segmentation [21, 34, 35].
o Live breathing instructions strongly recommended
o Practice round before scanning is advised
4.6.2 Specification
Table 8: Subject Handling - Actors and Requirements
Parameter Actor Requirement
Intravenous contrast Analyst, Radiologist Shall not use images with intravenous contrast for quantitative nodule volumetry in lung cancer screening or follow-up.
Artifact sources Radiographer Shall remove or position potential sources of artifacts to avoid
255
256
Subject Positioning
Table Height & Centering
degrading reconstructed CT volumes.
Radiographer Shall position the subject consistent with baseline.
Radiographer Shall adjust table height for mid-axillary plane to pass through gantry isocenter. Shall be consistent with baseline.
Breath holding Radiographer Shall instruct subject in proper breath-hold and start acquisition shortly after full inspiration. Shall ensure breath hold state is consistent with baseline.
4.7. Image Data Acquisition
257 necessary to reliably meet the Profile Claim.
This activity involves the acquisition of image data for a subject at either time point, including details
258
4.7.1 Discussion
• CT scans should ideally be performed on the same platform (manufacturer, model, and version) for 260 an individual subject to reduce variation.
261
262
• Consistency with baseline scans is crucial for reducing potential sources of variance.
263 requirements.
• Image header recordings of key parameter values facilitate meeting and confirming consistency
264
265
266
• Anatomic Coverage:
o Baseline scan: entire volume of the lungs (apex through base)
o Nodule measurement: full nodule plus 5 to 10 mm of lung region above and below 267
• For recommended dose levels and justification, see Section 4.4 Protocol Design.
• Pitch should not exceed 2.0 for single x-ray tube CT acquisitions or equivalent for dual-source
technology. 270
4.7.2 Specification
Table 9: Image Data Acquisition - Actors and Requirements 272 Parameter Actor Requirement
Acquisition Protocol Radiographer, Radiologist Shall select a protocol previously prepared and validated for this Profile (See section 4.4.2 "Protocol Design Specification").
Scan Duration Radiographer Shall perform the scan in a single breath hold.
Consistency Radiographer Shall ensure that follow-up scans use the same CT scanner model and acquisition protocol settings.
4.8. Image Data Reconstruction
This activity involves the reconstruction of image data for a subject at either time point, including criteria 275 and procedures necessary to reliably meet the Profile Claim.
4.8.1 Discussion
Page: 12
• Reconstructed data must remain consistent with baseline acquisitions (see Section 4.7).
278 Reconstruction Field of View: Set to the widest diameter of the lungs, consistent with baseline [11,
280
279 12].
281
• [11-13, 36].
282 defined in Section 4.4.
• Reconstructed slice thickness and reconstruction kernel settings shall follow the validated protocol
283
284
• Reconstruction Interval: Contiguous or overlapping (50% overlap may provide better accuracy [37]).
285 acceptable [16-18, 28, 38, 39].
• Reconstruction Algorithm Type: Both filtered back projection and iterative reconstruction are
286
• 287
4.8.2 Specification
Table 10: Image Data Reconstruction - Actors and Requirements 289 Parameter Actor Specification DICOM Tag
Reconstruction Protocol
Reconstruction Field of View
Reconstructed Image Thickness
Reconstruction Interval
Reconstruction Kernel
Radiographer Shall select a protocol previously prepared and validated for this purpose (See section 4.4.2).
Radiographer Shall ensure FOV spans full extent of thoracic and abdominal cavity, consistent with baseline.
Radiographer Shall apply the reconstruction interval defined in the validated protocol (see Section 4.4.2) and ensure it is consistent with baseline (no gaps, overlap if specified).
Radiographer Shall apply the reconstruction interval defined in the validated protocol (see Section 4.4.2) and ensure it is consistent with baseline (no gaps, overlap if specified).
Radiographer Shall select the reconstruction kernel defined in the validated protocol (see Section 4.4.2) and ensure the same kernel is used at all time points.
4.9. Image Quality Assurance
Reconstruction Field of View (0018,9317)
Slice Thickness (0018,0050)
Spacing Between Slices (0018,0088)
Convolution Kernel (0018,1210), Convolution Kernel Group (0018,9316)
This activity involves evaluating the reconstructed images prior to image analysis, including image criteria
necessary to reliably meet the Profile Claim.
4.9.1 Discussion
• Factors affecting image quality and nodule volume measurements include:
o Motion artifacts
o Dense object artifacts
o Thoracic disease processes
Page: 13
298
o Nodule contact with anatomic structures
• The Profile Claims do not apply to nodules affected by image quality deficiencies that impair overall
nodule measurability.
4.9.2 Specification
Table 11: Image Quality Assurance - Actors and Requirements
Parameter Actor Requirement
Motion Artifacts Radiographer, Image Analyst
Dense Object Artifacts Radiographer, Image Analyst
Shall confirm images are free from motion artifacts.
Shall confirm images are free from artifacts due to dense objects or anatomic positioning.
Thoracic Disease Image Analyst Shall confirm images are free from disease processes affecting nodule measurability.
Nodule Margin Conspicuity Image Analyst Shall confirm nodules are sufficiently distinct from and not significantly attached to other structures of similar attenuation (attached surface area ≤ 1/3 of total nodule surface area).
Nodule Size Image Analyst Shall confirm nodule longest in-plane bi-dimensional diameter is between 6 mm and 10 mm.
Overall Nodule Measurability Image Analyst Shall disqualify any nodules and images with features that might reasonably be expected to degrade measurement reliability.
4.10. Image Analysis
This activity involves measuring the volume change for subjects over one or more timepoints, including
criteria and procedures necessary to reliably meet the Profile Claim.
4.10.1 Discussion
• Image analysis should be performed using scientifically validated tools.
• The same software program (manufacturer, model, and version) must be used for all time points of 309 a nodule being evaluated for change.
• Segmentation Analysis should be conducted to inspect concordance with visually-assessed nodule
margins.
• Reading Paradigm involves direct side-by-side comparison of current and previous image data.
• Nodule characteristics affecting measurement quality: isolation, smooth borders, and separation
from adjacent structures [40-45].
4.10.2 Specification
Table 12: Image Analysis - Actors and Requirements 317
Parameter Actor Requirement
Image Analysis Tool Image Analyst Shall use the same tool (manufacturer, model, version) for measurements at all time points. Shall verify tool achieves specified performance metrics
(see Section 5.1 Technical Evaluation Methods).
Segmentation Analysis Image Analyst Shall disqualify nodules with inadequate or non-comparable segmentations at both time points.
Image Display Settings Image Analyst Shall set display settings (window and level) to the same lung-appropriate settings for all time points.
Claim Calculations Image Analyst Shall use linear interpolation for calculating intermediate values between those provided in the CV table (Table 1). 318
5. Conformance
To conform to this Profile, participating staff and equipment ("Actors") shall support each activity assigned 320 to them in Table 2, meeting the requirements listed in the specifications table of each activity subsection in
Section 4.
• Many critical performance-oriented requirements require assessment procedures outlined in
Section 4.
• This section covers:
1. Technical Evaluation Methods (Section 5.1)
5.1. Technical Evaluation Methods
Two types of equipment evaluations:
1. CT scanner and acquisition protocol (Section 5.1.1)
2. Analysis software (Section 5.1.2)
Note: Alternative, technically equivalent approaches may be submitted to the SLN Biomarker Committee
for consideration as acceptable conformance methods.
5.1.1 CT Image Quality Characteristics
Page: 15
Six metrics assess image quality:
1. Resolution: Estimated response to a point source
(PSF - point spread function), characterized as a
Gaussian with standard deviation (sigma) in mm
[46]
2. Resolution Aspect Ratio: Ratio of PSF sigma along Z- 341 axis to X-axis.
342
344
3. HU Bias: HU difference between mean and expected 343 value for uniform density material.
4. Voxel Noise: Standard deviation of pixel HU values in
uniform density material.
5. Edge Enhancement: Maximum percent increase in
HU contrast above expected along outer edge of
ideal cylinder. 349
6. Spatial Warping: Mean squared error of outer
cylindrical surface compared to ideal reference.
Assessment process:
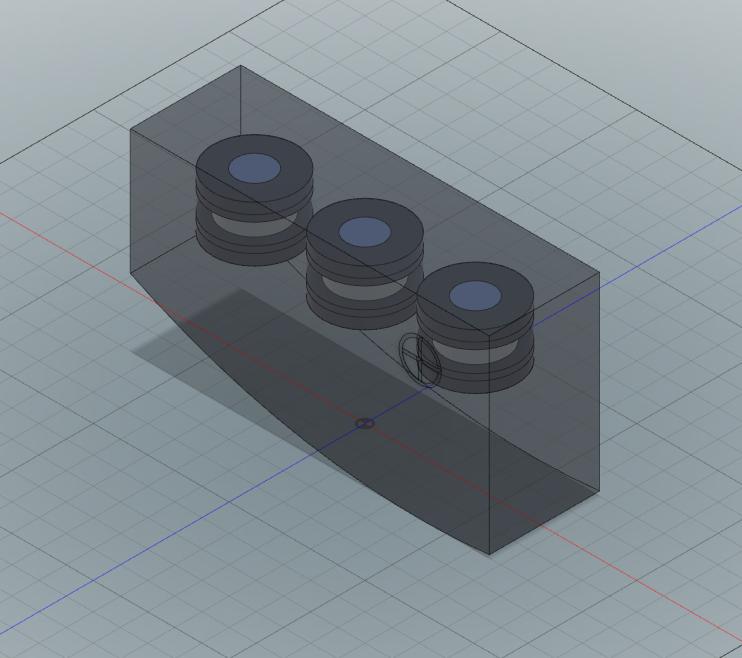
• Scan ALA/QIBA-accepted Quantitative CT reference object (example in Fig. 2)
• Calculate metrics at two locations closest to iso-center and at 160.0 mm
• Use linear interpolation for 160.0 mm measurements
• Follow specific calculation methods for each metric
Note: Alternative protocols may be needed for small Field of View (FOV) scans.
Additional notes: A Modulation Transfer Function at a 50% cutoff frequency (MTF 50) value can be
translated to an In-plane Point Spread Function sigma using the following equation [46]:
where �! is the MTF value and �! is the frequency. Thus, a conversion from gaussian PSF to MTF is:
More specifically, the conversion from PSF to MTF50 is:
The resolution aspect ratio cannot exceed 2.0.
Page: 16
5.1.2 Nodule Analysis Software Characteristics
Two metrics assess measurement quality:
1. Measurement Bias: Deviation of mean value from true value for volumetric measurements
2. Coefficient of Variation (CV): Ratio of standard deviation to mean for repeated measurements
• Measure volumes of geometric objects with known volumes
• Measure volumes of short-time interval repeat scans of nodules with varying characteristics
References
1. Henschke CI, Yankelevitz DF, Libby DM, Pasmantier MW, Smith JP, Miettinen OS. Survival of patients with stage I
lung cancer detected on CT screening. N Engl J Med. 2006; 355(17):1763-71.
378 screening. N Engl J Med. 2011; 365(5):395-409. 379
2. Aberle DR, Adams AM, Berg CD, et al. Reduced lung-cancer mortality with low-dose computed tomographic
3. Yankelevitz DF, Reeves AP, Kostis WJ, Zhao B, Henschke CI. Small pulmonary nodules: volumetrically determined
growth rates based on CT evaluation. Radiology. 2000; 217(1):251-6.
382 segmentation algorithms and observer training levels. Eur J Radiol. 2007; 64(2):285-95.
4. Bolte H, Jahnke T, Schafer FK, et al. Interobserver-variability of lung nodule volumetry considering different
383
384 findings at low-dose CT screening. Radiology. 2008; 246(1):265-72.
5. Gierada DS, Pilgram TK, Ford M, et al. Lung cancer: interobserver agreement on interpretation of pulmonary
385
6. van Klaveren RJ, Oudkerk M, Prokop M, et al. Management of lung nodules detected by volume CT scanning. N 386 Engl J Med. 2009; 361(23):2221-9.
387
7. Singh S, Pinsky P, Fineberg NS, et al. Evaluation of reader variability in the interpretation of follow-up CT scans at 388 lung cancer screening. Radiology. 2011; 259(1):263-70. 389
8. Petrick N, Kim HJ, Clunie D, et al. Comparison of 1D, 2D, and 3D nodule sizing methods by radiologists for 390 spherical and complex nodules on thoracic CT phantom images. Acad Radiol. 2014; 21(1):30-40. 391
9. Mulshine JL, Gierada DS, Armato SG, 3rd, et al. Role of the Quantitative Imaging Biomarker Alliance in optimizing 392 CT for the evaluation of lung cancer screen-detected nodules. J Am Coll Radiol. 2015; 12(4):390-5. 393
10. Das M, Muhlenbruch G, Katoh M, et al. Automated volumetry of solid pulmonary nodules in a phantom: 394 accuracy across different CT scanner technologies. Invest Radiol. 2007; 42(5):297-302. 395
11. Ravenel JG, Leue WM, Nietert PJ, Miller JV, Taylor KK, Silvestri GA. Pulmonary nodule volume: effects of 396 reconstruction parameters on automated measurements a phantom study. Radiology. 2008; 247(2):400-8. 397
12. Goo JM, Tongdee T, Tongdee R, Yeo K, Hildebolt CF, Bae KT. Volumetric measurement of synthetic lung nodules
with multi-detector row CT: effect of various image reconstruction parameters and segmentation thresholds on
measurement accuracy. Radiology. 2005; 235(3):850-6.
13. Chen B, Barnhart H, Richard S, Colsher J, Amurao M, Samei E. Quantitative CT: technique dependence of volume
estimation on pulmonary nodules. Phys Med Biol. 2012; 57(5):1335-48.
14. Larici AR, Storto ML, Torge M, et al. Automated volumetry of pulmonary nodules on multidetector CT: influence
of slice thickness, reconstruction algorithm and tube current. Preliminary results. Radiol Med. 2008; 113(1):29-
15. Xie X, Willemink MJ, de Jong PA, et al. Small irregular pulmonary nodules in low-dose CT: observer detection
sensitivity and volumetry accuracy. AJR Am J Roentgenol. 2014; 202(3):W202-9.
425
16. Willemink MJ, Leiner T, Budde RP, et al. Systematic error in lung nodule volumetry: effect of iterative
reconstruction versus filtered back projection at different CT parameters. AJR Am J Roentgenol. 2012;
199(6):1241-6.
17. Wielputz MO, Lederlin M, Wroblewski J, et al. CT volumetry of artificial pulmonary nodules using an ex vivo lung
phantom: influence of exposure parameters and iterative reconstruction on reproducibility. Eur J Radiol. 2013;
82(9):1577-83.
18. Chen B, Barnhart H, Richard S, Robins M, Colsher J, Samei E. Volumetric quantification of lung nodules in CT with
iterative reconstruction (ASiR and MBIR). Med Phys. 2013; 40(11):111902.
19. Wormanns D, Kohl G, Klotz E, et al. Volumetric measurements of pulmonary nodules at multi-row detector CT: in
vivo reproducibility. Eur Radiol. 2004; 14(1):86-92.
20. Goodman LR, Gulsun M, Washington L, Nagy PG, Piacsek KL. Inherent variability of CT lung nodule
measurements in vivo using semiautomated volumetric measurements. AJR Am J Roentgenol. 2006; 186(4):989-
94.
21. Gietema HA, Schaefer-Prokop CM, Mali WP, Groenewegen G, Prokop M. Pulmonary nodules: Interscan
variability of semiautomated volume measurements with multisection CT influence of inspiration level, nodule
size, and segmentation performance. Radiology. 2007; 245(3):888-94.
22. Rampinelli C, De Fiori E, Raimondi S, Veronesi G, Bellomi M. In vivo repeatability of automated volume
calculations of small pulmonary nodules with CT. AJR Am J Roentgenol. 2009; 192(6):1657-61.
23. de Hoop B, Gietema H, van Ginneken B, Zanen P, Groenewegen G, Prokop M. A comparison of six software 426 packages for evaluation of solid lung nodules using semi-automated volumetry: what is the minimum increase in 427 size to detect growth in repeated CT examinations. Eur Radiol. 2009; 19(4):800-8.
428
429 screening. Radiology. 2009; 251(3):919-25.
24. Marchiano A, Calabro E, Civelli E, et al. Pulmonary nodules: volume repeatability at multidetector CT lung cancer
430
25. Ko JP, Berman EJ, Kaur M, et al. Pulmonary Nodules: growth rate assessment in patients by using serial CT and 431 three-dimensional volumetry. Radiology. 2012; 262(2):662-71.
432
26. Henschke CI, Yankelevitz DF, Yip R, et al. Tumor volume measurement error using computed tomography 433 imaging in a phase II clinical trial in lung cancer. J Med Imaging (Bellingham). 2016; 3(3):035505. 434
27. Das M, Ley-Zaporozhan J, Gietema HA, et al. Accuracy of automated volumetry of pulmonary nodules across 435 different multislice CT scanners. Eur Radiol. 2007; 17(8):1979-84. 436
28. Coenen A, Honda O, van der Jagt EJ, Tomiyama N. Computer-assisted solid lung nodule 3D volumetry on CT: 437 influence of scan mode and iterative reconstruction: a CT phantom study. Jpn J Radiol. 2013; 31(10):677-84. 438
29. ACR-STR. ACR-STR practice parameter for the performance and reporting of lung cancer screening thoracic 439 computed tomography (CT). 2014. 440
30. Honda O, Johkoh T, Sumikawa H, et al. Pulmonary nodules: 3D volumetric measurement with multidetector CT 441 effect of intravenous contrast medium. Radiology. 2007; 245(3):881-7. 442
31. Rampinelli C, Raimondi S, Padrenostro M, et al. Pulmonary nodules: Contrast-enhanced volumetric variation at 443 different CT scan delays. AJR Am J Roentgenol. 2010; 195(1):149-54. 444
32. Toth T, Ge Z, Daly MP. The influence of patient centering on CT dose and image noise. Med Phys. 2007; 445 34(7):3093-101. 446
33. Kaasalainen T, Palmu K, Reijonen V, Kortesniemi M. Effect of patient centering on patient dose and image noise 447 in chest CT. AJR Am J Roentgenol. 2014; 203(1):123-30. 448
34. Goo JM, Kim KG, Gierada DS, Castro M, Bae KT. Volumetric measurements of lung nodules with multi-detector 449 row CT: effect of changes in lung volume. Korean J Radiol. 2006; 7(4):243-8. 450
35. Petkovska I, Brown MS, Goldin JG, et al. The effect of lung volume on nodule size on CT. Acad Radiol. 2007; 451 14(4):476-85. 452
36. Nietert PJ, Ravenel JG, Leue WM, et al. Imprecision in automated volume measurements of pulmonary nodules 453 and its effect on the level of uncertainty in volume doubling time estimation. Chest. 2009; 135(6):1580-7. 454
37. Gavrielides MA, Zeng R, Myers KJ, Sahiner B, Petrick N. Benefit of overlapping reconstruction for improving the 455 quantitative assessment of CT lung nodule volume. Acad Radiol. 2013; 20(2):173-80. 456
38. Willemink MJ, de Jong PA, Leiner T, et al. Iterative reconstruction techniques for computed tomography Part 1: 457
Page: 18
SLN Profile: Small Lung Nodule Assessment in CT Screening Profile - 2026
technical principles. Eur Radiol. 2013; 23(6):1623-31. 458
39. Willemink MJ, Borstlap J, Takx RA, et al. The effects of computed tomography with iterative reconstruction on 459 solid pulmonary nodule volume quantification. PLoS One. 2013; 8(2):e58053. 460
40. Revel MP, Lefort C, Bissery A, et al. Pulmonary nodules: preliminary experience with three-dimensional 461 evaluation. Radiology. 2004; 231(2):459-66. 462
41. Petrou M, Quint LE, Nan B, Baker LH. Pulmonary nodule volumetric measurement variability as a function of CT 463 slice thickness and nodule morphology. AJR Am J Roentgenol. 2007; 188(2):306-12. 464
42. Wang Y, van Klaveren RJ, van der Zaag-Loonen HJ, et al. Effect of nodule characteristics on variability of 465 semiautomated volume measurements in pulmonary nodules detected in a lung cancer screening program. 466 Radiology. 2008; 248(2):625-31. 467
43. Hein PA, Romano VC, Rogalla P, et al. Linear and volume measurements of pulmonary nodules at different CT 468 dose levels - intrascan and interscan analysis. Rofo. 2009; 181(1):24-31. 469
44. Hein PA, Romano VC, Rogalla P, et al. Variability of semiautomated lung nodule volumetry on ultralow-dose CT: 470 comparison with nodule volumetry on standard-dose CT. J Digit Imaging. 2010; 23(1):8-17. 471
45. Gietema HA, Wang Y, Xu D, et al. Pulmonary nodules detected at lung cancer screening: interobserver variability 472 of semiautomated volume measurements. Radiology. 2006; 241(1):251-7. 473
46. Wang GE, Skinner MW, Vannier MW. Temporal Bone Volumetric Image Deblurring in Spiral Computed 474 Tomography Scanning. Academic Radiology. 1995; 2:888-895.
47. Gavrielides MA, Li Q, Zeng R, Myers KJ, Sahiner B, Petrick N. Minimum detectable change in lung nodule volume 481 in a phantom CT study. Acad Radiol. 2013; 20(11):1364-70. 482
48. Bolte H, Riedel C, Jahnke T, et al. Reproducibility of computer-aided volumetry of artificial small pulmonary 483 nodules in ex vivo porcine lungs. Invest Radiol. 2006; 41(1):28-35. 484
49. Bolte H, Riedel C, Muller-Hulsbeck S, et al. Precision of computer-aided volumetry of artificial small solid 485 pulmonary nodules in ex vivo porcine lungs. Br J Radiol. 2007; 80(954):414-21. 486
50. Wang Y, de Bock GH, van Klaveren RJ, et al. Volumetric measurement of pulmonary nodules at low-dose chest 487 CT: effect of reconstruction setting on measurement variability. Eur Radiol. 2010; 20(5):1180-7. 488
51. Bolte H, Riedel C, Knoss N, et al. Computed tomography-based lung nodule volumetry do optimized 489 reconstructions of routine protocols achieve similar accuracy, reproducibility and interobserver variability to that 490 of special volumetry protocols? Rofo. 2007; 179(3):276-81. 491
52. de Jong PA, Leiner T, Lammers JW, Gietema HA. Can low-dose unenhanced chest CT be used for follow-up of 492 lung nodules? AJR Am J Roentgenol. 2012; 199(4):777-80. 493
53. Christe A, Torrente JC, Lin M, et al. CT screening and follow-up of lung nodules: effects of tube current-time 494 setting and nodule size and density on detectability and of tube current-time setting on apparent size. AJR Am J 495 Roentgenol. 2011; 197(3):623-30. 496
54. Honda O, Sumikawa H, Johkoh T, et al. Computer-assisted lung nodule volumetry from multi-detector row CT: 497 influence of image reconstruction parameters. Eur J Radiol. 2007; 62(1):106-13. 498
55. Young S, Kim HJ, Ko MM, Ko WW, Flores C, McNitt-Gray MF. Variability in CT lung-nodule volumetry: Effects of 499 dose reduction and reconstruction methods. Med Phys. 2015; 42(5):2679-89.
500
56. Ashraf H, de Hoop B, Shaker SB, et al. Lung nodule volumetry: segmentation algorithms within the same 501 software package cannot be used interchangeably. Eur Radiol. 2010; 20(8):1878-85. 502
57. Christe A, Bronnimann A, Vock P. Volumetric analysis of lung nodules in computed tomography (CT): comparison 503 of two different segmentation algorithm softwares and two different reconstruction filters on automated 504 volume calculation. Acta Radiol. 2014; 55(1):54-61.
505
58. Zhao YR, Ooijen PM, Dorrius MD, et al. Comparison of three software systems for semi-automatic volumetry of 506 pulmonary nodules on baseline and follow-up CT examinations. Acta Radiol. 2013; 55(6):691-8. 507
Page: 19
59. Gavrielides MA, Kinnard LM, Myers KJ, Petrick N. Noncalcified lung nodules: volumetric assessment with thoracic 508 CT. Radiology. 2009; 251(1):26-37. 509
60. Marten K, Engelke C. Computer-aided detection and automated CT volumetry of pulmonary nodules. Eur Radiol. 510 2007; 17(4):888-901. 511
61. Boll DT, Gilkeson RC, Fleiter TR, Blackham KA, Duerk JL, Lewin JS. Volumetric assessment of pulmonary nodules 512 with ECG-gated MDCT. AJR Am J Roentgenol. 2004; 183(5):1217-23 513
62. Snoeckx A, Silva M, Prosch H et al. Lung cancer screening with low-dose CT: definition of positive, indeterminate, 514 and negative screen results. A nodule management recommendation from the European Society of Thoracic 515 Imaging. Eur Radiol. 2025; 1-13. 516 517
Metrology References 518 519
63. Obuchowski NA, Buckler A, Kinahan PE, Chen-Mayer H, Petrick N, Barboriak DP, Bullen J, Barnhart H, Sullivan 520 DC. Statistical Issues in Testing Conformance with the Quantitative Imaging Biomarker Alliance (ALA/QIBA) 521 Profile Claims. Acad Radiol. 2016; 23(4):496-506 522
64. Kessler LG, Barnhart HX, Buckler AJ, et al. The emerging science of quantitative imaging biomarkers: terminology 523 and definitions for scientific studies and for regulatory submissions. SMMR 2015; 24(1): 9-26. 524
65. Raunig D, McShane LM, Pennello G, et al. Quantitative imaging biomarkers: a 235 review of statistical methods 525 for technical performance assessment. SMMR 2015; 24(1): 27-67. 526
66. Obuchowski NA, Reeves AP, Huang EP, et al. Quantitative Imaging Biomarkers: A Review of Statistical Methods for 527 Computer Algorithm Comparisons. SMMR 2015; 24(1): 68-106. 528 529
Appendix A: Discussion on Clinical Context 532 533
1. Low-dose CT benefits: 534
• Effective for detecting and monitoring pulmonary nodules 535
• Can increase survival [1] and reduce mortality [2] in high-risk individuals 536
2. Nodule measurement: 537
• Automated quantification of whole nodule volume, addressing limitations of manual 538 measurements [3-9] 539
• Accuracy explored in phantoms [10-18] and in vivo precision studies [19-25]
3. Challenges in lung cancer CT screening: 541
• Balancing accurate nodule detection and characterization with radiation exposure risks 542
• Optimizing protocols for long-term screening (potentially over two decades) 543
4. Profile aims: 544
• Establish confidence levels for measuring nodule volume and changes 545
• Quantifies nodule volume and volume doubling time to support standardized nodule 546 management per European Society of Thoracic Imaging recommendations [62] 547
• Provide specifications for users and equipment developers 548
• Target various stakeholders involved in lung cancer screening 549
Page: 20
5. Intended audience: 550
• Healthcare professionals (radiologists, technologists, physicists) 551
• Equipment manufacturers and software developers 552
• Biopharmaceutical companies and clinical trialists 553
• Policy makers and administrators 554
6. Relevance: 555
• Primarily for asymptomatic persons in CT screening programs 556
May also apply to patients with known or incidentally-detected solid pulmonary nodules (6-10 mm 557 diameter range) 558 559 Appendix B: Clinical Interpretation Examples
Claim 1: Nodule Volume 562 563
The true size of a nodule is defined by the measured volume and the 95% confidence intervals. These 564 intervals represent the range within which the true volume likely falls. 565 566
Example 1: 567
• Measured volume: 150 mm³ (6.6 mm diameter) 568
• 95% confidence interval: 65 mm³ to 235 mm³ (5.0 mm to 7.7 mm diameter) 569
Example 2: 570
• Measured volume: 500 mm³ (9.8 mm diameter) 571
• 95% confidence interval: 343 mm³ to 657 mm³ (8.7 mm to 10.8 mm diameter) 572
Example 3: 573
• Measured volume: 800 mm³ (11.5 mm diameter) 574
• 95% confidence interval: 612 mm³ to 988 mm³ (10.5 mm to 12.4 mm diameter) 575
Claim 2: Nodule Volume Change 576 577
This claim helps determine if a change in nodule size is real or due to measurement variability. 578 579
Example 1: 580
• Baseline: 524 mm³ (10.0 mm diameter) 581
• Follow-up: 917 mm³ (12.0 mm diameter) 582
• Measured change: +75% 583
• Interpretation: Since 75% > 39%, we are 95% confident this is a real change. 584
• 95% confidence interval for true change: 149 mm³ to 637 mm³ increase 585
Example 2: 586
• Baseline: 180 mm³ (7.0 mm diameter) 587
• Follow-up: 270 mm³ (8.0 mm diameter)
• Measured change: +50%
• Interpretation: Since 50% < 80%, we cannot be confident this is a real change.
Note: These claims have been informed by clinical trial data, theoretical analysis, simulations, review of the
literature, and expert consensus. They assume compliance with the Profile specifications and may be
subject to refinement based on clinical implementation data. The claims have not yet been fully
substantiated by studies that strictly conform to the specifications given here. It is expected that during
implementation in the clinical setting, data on the actual performance will be collected and any appropriate
changes made to the claims or the details of the Profile. 596
Appendix C: Acknowledgements and Attributions
This document is proffered by the Small Lung Nodule (SLN) Biomarker Committee. The group is composed
of scientists representing academia, the imaging device manufacturers, image analysis tool software
developers, image analysis laboratories, biopharmaceutical industry, government research organizations,
professional societies, and regulatory agencies, among others. All work is classified as pre-competitive.
A description of the former QIBA SLN Biomarker Committee and its work can be found at the following web 604 link: QIBA Small Lung Nodule Biomarker Committee Wiki page Since the cessation of QIBA, the activities of 605 the SLN Biomarker Committee moved to sponsorship of the American Lung Association (ALA). This is the 606 largest lung disease advocacy organization in the United States with long standing and extensive support of 607 lung imaging research both alone and in collaboration with the National Heart, Lung and Blood Institute of 608 the National Institutes of Health. The SLN Biomarker Committee will continue its work on optimizing 609 quantitative imaging processes for chest CT screening with the recently formed Quantitative Medical 610 Imaging Coalition (QMIC), the European consortium, Strengthening the Screening of Lung Cancer in Europe 611 (SOLACE) project and other relevant parties to inclusively make progress in the critical area. 612
Page: 22