
TRANSPORT & MOBILITY

Ahmedabad : A 20 minute city
Ahmedabad is a compact city with an average trip length of 6.6 km based on primary survey data.
Ahmedabad moves on 2 wheels 2 wheelers dominate the work and education trips in Ahmedabad as per primary survey data.
6.60 Km
20 Minutes
11 %
2 Wheeler
494

1.18
5%
42.75%
Inefficiency in Public Transport results in the rise of Private Automobile usage

Public transport is more economical for longer distances, but people still use private vehicles due to lack of multi-modal integration and poor first and last mile connectivity. But the rise in number of private vehicles also lead to higher congestion and accidents in the city, along with poor air quality.
Walkability in Ahmedabad- A Paradox?
People walk more in East than West, even with a higher footpath coverage in West Ahmedabad. The quality of footpaths across the city needs improvement.
Air Quality Index (AQI) in Ahmedabad for *PM10 was 71 in 2011 and 143 in 2019 (for the month of November)[1]. Serious injuries in Ahmedabad have increased from 285 (2009) to 440 (2018) whereas the fatalities have gone up from 200 to 322 during the same time[2]
So how is Ahmedabad actually moving?
Two wheeler is the predominant mode of travel across the city. Even with the provision of public transport, people are hesitant to use it because of the inefficiencies in the infrastructure. With the rise of private transport, the congestion has increased in the city resulting in externalities like air pollution and accidents.
Larger block sizes in the west, coupled with poor footpath quality discourages walkability even though the proportion of footpath is high as compared to the east. Smaller block sizes result in higher walkability.


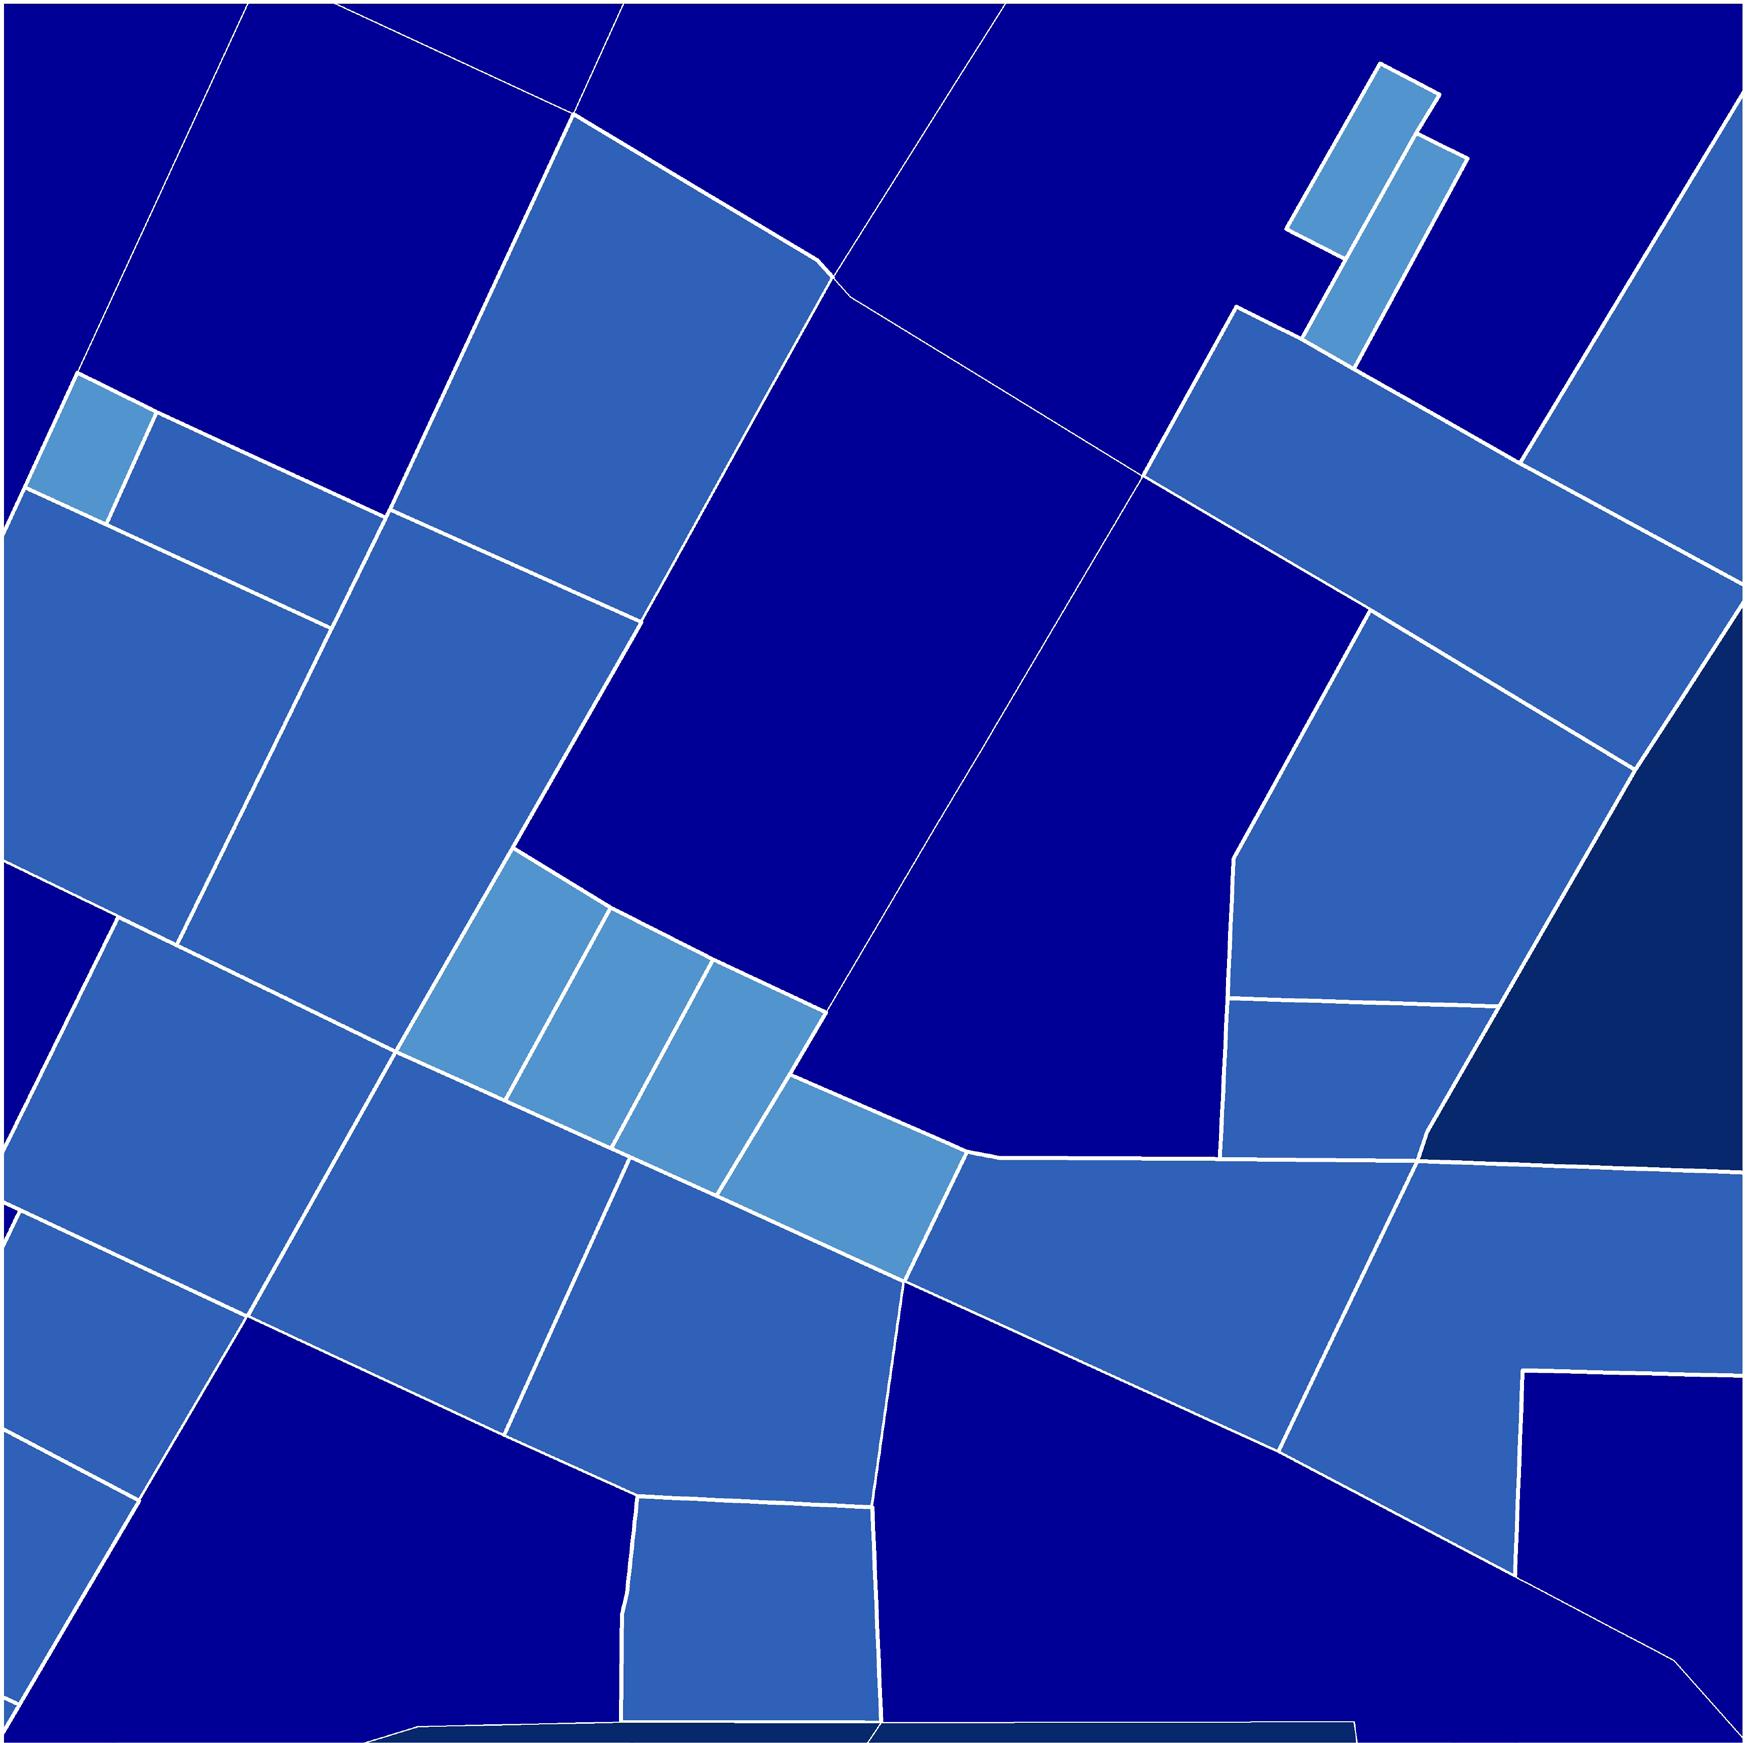
Ahmedabad is a polycentric city with moderate trip lengths and high connectivity. The transport network defines the urban form, and affects the choices of travel, education, job centers and places of residence.