
STEP INTO THE STORY: THE STUDENT LIFE DATA WALK
DISCOVER THE STORIES BEHIND THE STATS— AND HOW WE CAN SHAPE STUDENT SUCCESS TOGETHER.
WELCOME.
Welcome to our annual Student Life Data
Walk! This event is an oppor tunity to dive deep into the data that shapes the student experience, fostering a shared understanding of our progress and areas for growth. Our goal is to spark meaningful conversations and inspire collaborative effor ts that enhance the lives of all students. Together, we’ll explore insights across four key sections. Let’s use this data to drive impactful change!
Press the play button to hear a welcome message from our Vice President, Raphaella Prange.
Engagement & Leadership
The first section dives into the dynamic world of student organizations, examining varying organization types, membership trends, event programming, and financial operations. By analyzing this data, we gain valuable insights into how students actively engage and take on leadership roles.
Living & Learning Experience
Next we will focus on the holistic student experience by exploring key data of how students integrate learning, leadership, and personal growth within their living and working environments on our campus.
Health, Well-being & Safety
This section emphasizes the impor tance of student wellness and safety, backed by data from our Wellness depar tments. We will also explore the impact of community service effor ts, reflecting on our commitment to fostering a suppor tive and inclusive campus environment.
Resources & Operations
Lastly, we’ll evaluate the operational backbone of Student Life by examining the contributions of staff, both on campus and externally. We’ll also analyze our evolving digital footprint to better understand how our resources and infrastructure suppor t the broader campus community.
WHAT IS A DATA WALK?
A Data Walk is an interactive experience that visually shares key data in an engaging and accessible way. Instead of a traditional presentation, par ticipants explore curated displays, reflect on insights, and connect the information to their work.
Visual and Interactive
Data is displayed through infographics, char ts, quotes, and stor ytelling elements to help bring the numbers to life.
Reflective
You're encouraged to ask questions, make connections, and think critically about the stor y the data is telling.
Collaborative
This is a chance to spark conversations, generate ideas, and strengthen par tnerships across campus.
Action-Oriented
The goal isn’t just to share data— it’s to use it! What trends do you notice? What oppor tunities for growth or innovation do you see?
I L L A R S
TO CULTIVATE HOLISTIC WELLNESS RESULTING IN TRANSFORMATIONAL LEARNING AND STUDENT SUCCESS.
Press the play button to hear a message from our Dean of Campus Life, Dr. Aretha Hardrick
ENGAGEMENT & ENGAGEMENT & LEADERSHIP LEADERSHIP
Engagement & Leadership dives into the dynamic world of student organizations, examining varying organization types, membership trends, event programming, and financial operations. By analyzing this data, we gain valuable insights into how students actively engage and take on leadership roles.
STUDENT ORGANIZATION TRENDS
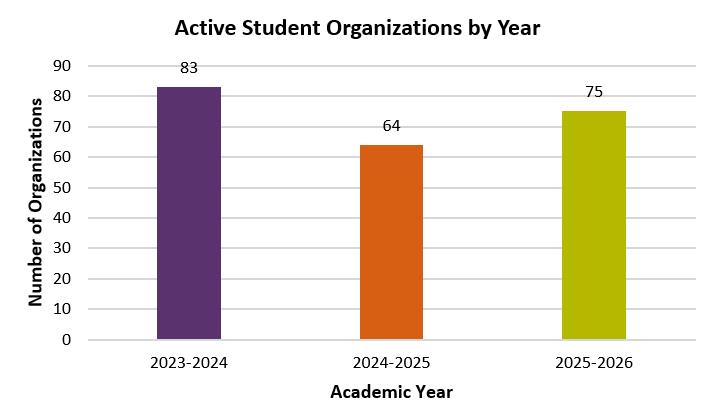
Between 2023 and 2026, the number of active student organizations fluctuated significantly, with 83 organizations in 2023-24, a dip to 64 in 2024-25, and a rebound to 75 in 2025-26.
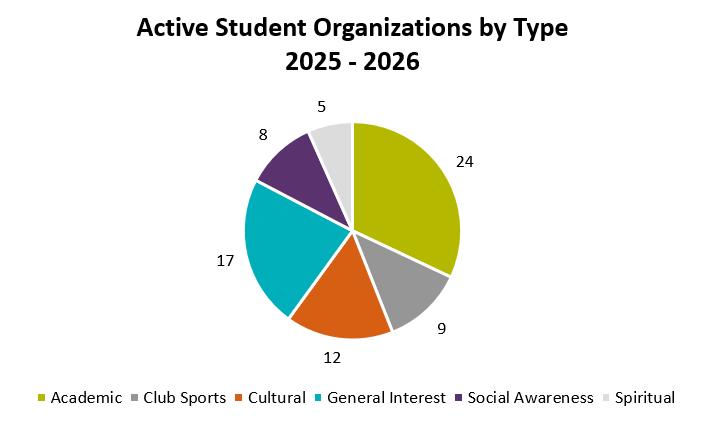
Academic and hobby-based organizations remain the most popular among students, reflecting their primary interests. However, the greatest decline occurred among academic-focused organizations, largely due to challenges such as faculty availability to serve as advisors, graduating leaders leaving without succession plans, and shifting student interests.
Prior to 2023, inconsistent record-keeping also hindered tracking trends and compliance, prompting a renewed focus on ensuring that organizations remain compliant with university policies and maintain accurate records. This renewed process has strengthened the suppor t and accountability for student organizations, helping to sustain their success and relevance over time.
As you review this data, consider:
How can Maryville recruit and support faculty to serve as advisors for academic-focused organizations?
What steps can we take to help student leaders implement effective succession plans?
How can we adapt programming and support to address changing student interests while maintaining a strong foundation for academic and hobby-based organizations?
STUDENT ORGANIZATION MEMBERSHIP TRENDS (2025-2026)
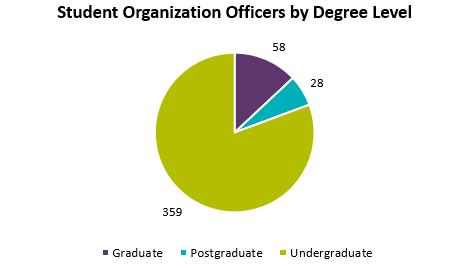
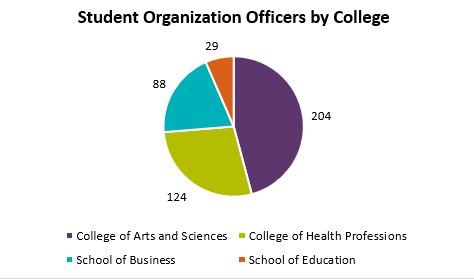
The data shows that undergraduate students make up the over whelming majority of student organization officers, highlighting their strong interest in taking on leadership roles across campus. Graduate and postgraduate students also contribute to leadership, though in much smaller propor tions, suggesting oppor tunities to fur ther engage them. When looking across academic colleges, the College of Ar ts and Sciences leads by a wide margin, with the College of Health Professions and the School of Business also showing strong representation.
Together, these trends reveal a vibrant leadership culture driven primarily by undergraduates and concentrated within key academic areas.
As you review this data, consider:
How can Maryville encourage more leadership participation from graduate and postgraduate students?
What do the trends in officer representation reveal about student leadership opportunities across academic disciplines?
How might leadership development programs be tailored to meet the unique needs of students at different levels of study?
EVENT TRENDS (2025-2026)
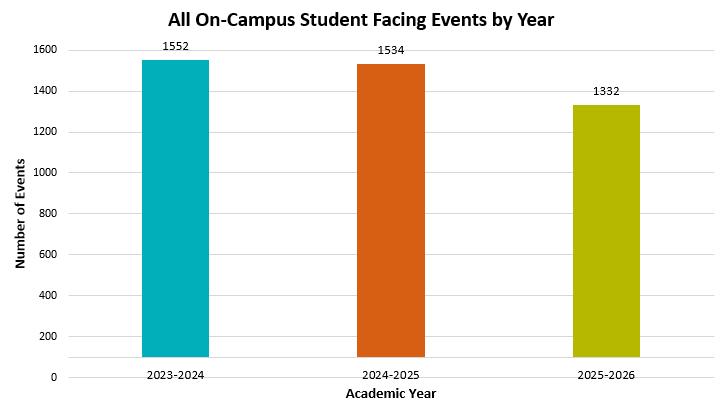
On average, Maryville hosts roughly 30 events per week, offering students a wide variety of opportunities, including guest speakers, social gatherings, club meetings, home athletic games, celebrations, study groups, and more.
The total number of events offered at Mar yville University has seen a slight decline over the past three academic years, with 1,552 events in 2023-24, 1,534 in 2024-25, and 1,332 in 2025-26.
This decrease reflects a strategic shift in focus from the quantity of events to the quality and impact of programming. Mar yville student engagement has prioritized creating intentional, meaningful experiences that resonate with students and contribute to their personal and academic growth.
This shift aligns with Mar yville’s commitment to ensuring that ever y program has a lasting impact on student success.
As you review this data, consider:
How can we measure the impact of intentional, high-quality programming on student success?
What factors might have driven the shift from quantity to quality in event planning?
How can depar tments collaborate to ensure impactful programming aligns with Mar yville’s strategic goals?
EVENTS BY GROUP (2025-2026)
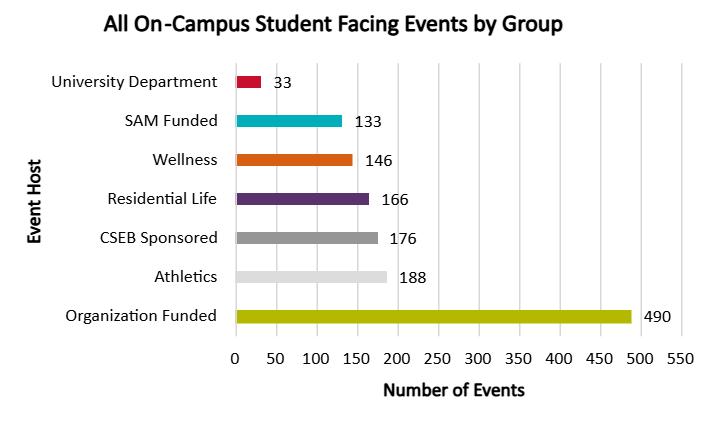
In the 2025-26 academic year, events at Maryville University were hosted by a variety of groups, showcasing the collaborative and diverse nature of campus programming. Athletics led with 188 on-campus events, followed closely by the Center for Student Engagement & Belonging (CSEB) Sponsored events with 176, Residential Life with 166, Wellness with 146, and Organization Funded events with 490.
The "Organization Funded" category refers to events that were hosted and funded directly by student organizations, which includes a significant number of weekly organization meetings
These categories reflect the diverse sources of funding and hosting for events, emphasizing the importance of cross-departmental collaboration in creating a vibrant campus life
As you review this data, consider:
What strategies can we implement to ensure that events hosted by different groups align with shared institutional goals and student needs?
What role do fundraising efforts and departmental collaborations play in expanding programming opportunities?
How can we better utilize data on event attendance and engagement to identify opportunities for crossdepartmental partnerships?
ENGAGEMENT: RESIDENTIAL VS. COMMUTER (2025-2026)
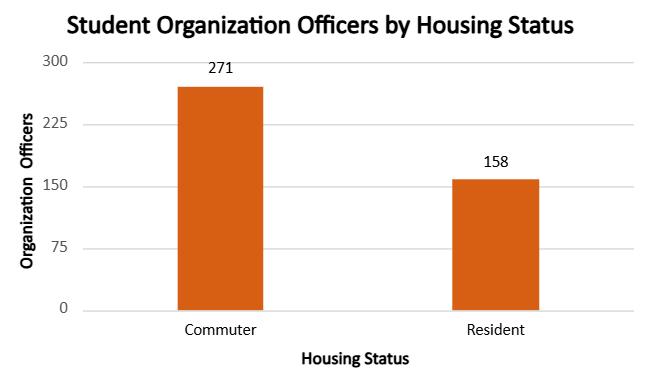
How are we going to close this gap in the future?
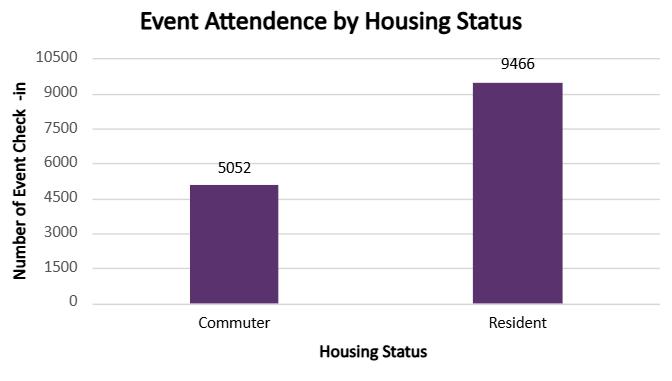
Commuter students and resident students at Maryville University demonstrate distinct engagement patterns based on their living arrangements. Commuter students lead in organization officer representation, with 271 officers compared to 158 residents, highlighting their strong presence as leaders within student organizations. However, resident students show higher event attendance overall, with 9,466 attendees compared to 5,052 commuters.
This data suggests that while residents are more likely to engage as event attendees, commuters are more likely to take on leadership roles. These trends reflect the different ways students on campus and those commuting connect with the university, and they provide an oppor tunity to better suppor t both groups in enhancing their engagement experiences.
As you review this data, consider:
What barriers might prevent commuter students from attending more events?
How can events be designed to meet the needs of both resident and commuter students?
What additional support could enhance both officer participation and event attendance for all students?
CAMPUS SPACE USAGE (2025-2026)
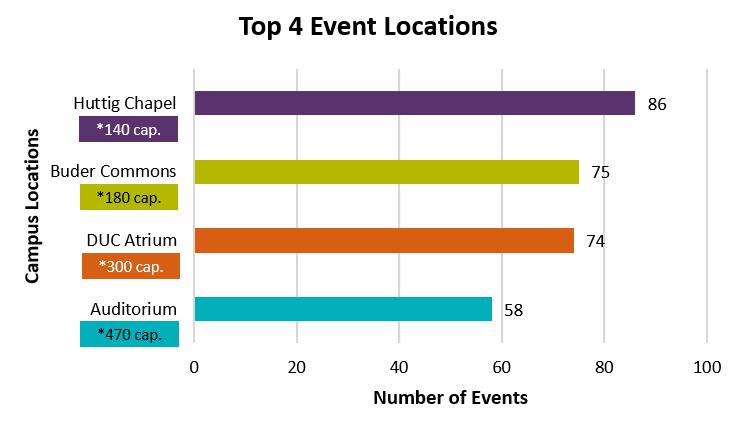
Campus spaces play a vital role in suppor ting Maryville’s dynamic programming.
The variety in room sizes allows for a broad spectrum of events, ranging from intimate gatherings to large-scale celebrations. These spaces are central to hosting cultural showcases, leadership workshops, social gatherings, and more, fostering student engagement and creating a sense of community on campus.
The data also raises questions about how less-utilized spaces might be activated to suppor t programming needs. By analyzing space utilization trends, Maryville can optimize its facilities to better serve students and enhance the overall campus experience.
As you review this data, consider:
What are the key benefits of utilizing high-traffic spaces for campus events?
How can less utilized campus spaces be activated to better support student engagement?
Are there opportunities to redesign existing spaces to better meet the needs of evolving programming? *Location maximim capacity
STUDENT AMBASSADORS OF MARYVILLE (SAM)FUNDING
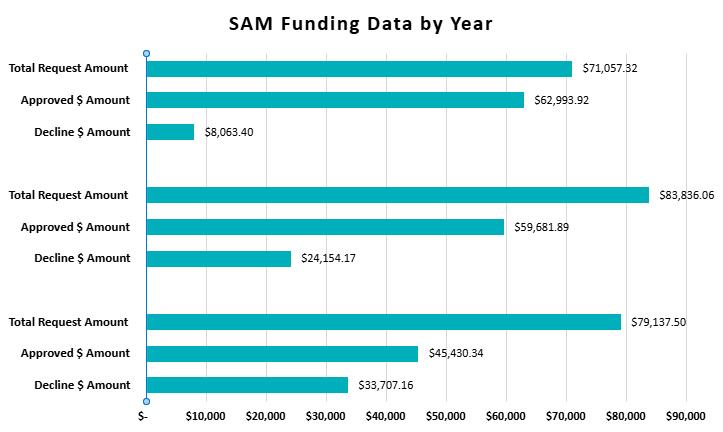
Mar yville’s vibrant student organization ecosystem is powered in par t by the Student Ambassadors of Mar yville (SAM) funding program a vital resource suppor ting student-led events, programs, and initiatives across campus. While not all student orgs request funds each year, the oppor tunity is available to all qualifying groups.
Student organization engagement has risen each year, shown by increasing total funding requests, while the lack of corresponding funding growth has led to a higher dollar amount in declined requests.
As demand continues to outpace available funds, more organizations are seeing par tial or full denials of their proposals.
Formerly known as Maryville Student Government (MSG), the organization underwent a rebranding to become Student Ambassadors of Maryville Since the rebrand, SAM has reallocated funds to assist with outreach and programming initiatives As a result, you will see a sligiht increase in the decline of total funds allocated to organizations each year since the transition as we settle.
As you review this data, consider:
What factors might have led to increased funding requests?
How could SAM better anticipate or plan for rising demand based on this trend?
What implications might this funding gap have on student organizations’ ability to implement their events or initiatives?
Press the play button to hear a message from our Director of Athletics, Brittany Fennell
LIVING & LIVING & LEARNING LEARNING
In Living & Learning we will focus on the holistic student experience by exploring key data of how students integrate learning, leadership, and personal growth within their living and working environments on our campus.
STUDENT ATHLETES
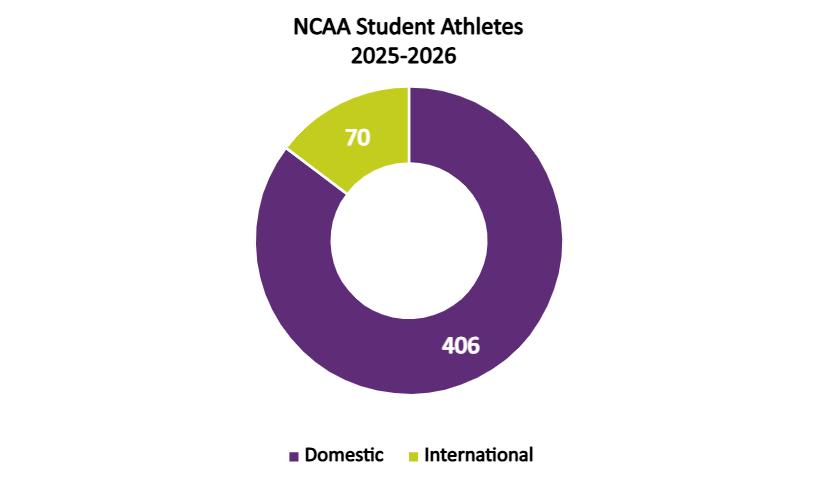
The data reveals a vibrant and globally diverse athletic community while most athletes come from domestic backgrounds, a meaningful por tion travel internationally to be par t of these teams, adding cultural depth to the student experience.
107 CLUB SPORT ATHLETES
Beyond competition, many athletes step into leadership roles as student leaders or resident assistants, showing a strong commitment to shaping campus life. Their academic success, reflected in a solid average GPA, underscores their ability to balance rigorous athletic and scholarly commitments.
ATHLETES 17% OF CAMPUS POPULATION
As you review this data, consider:
How might the leadership roles taken on by athletes influence team dynamics or broader campus involvement?
What oppor tunities exist to better integrate the athletic community with other student groups on campus?
How might this data guide decisions about resources or initiatives to enhance the student-athlete experience?
MULTICULTURAL SCHOLARS PROGRAM (MSP)
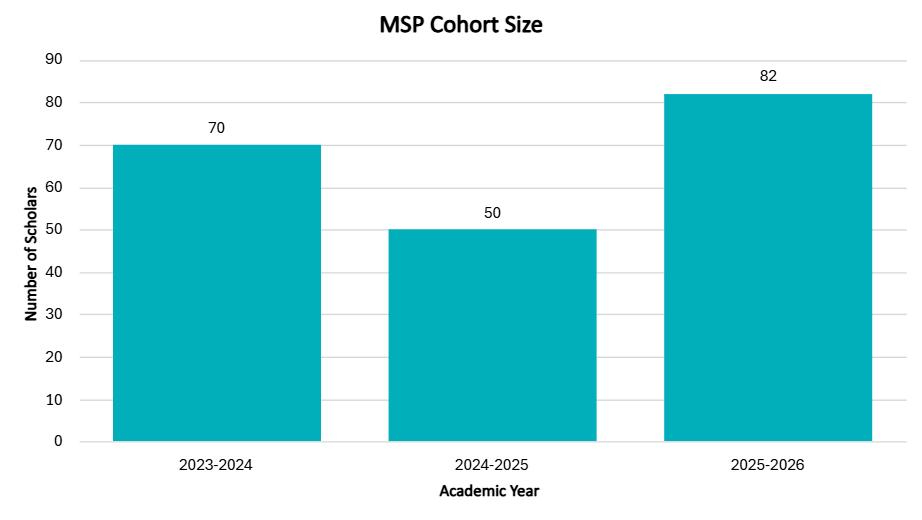
3.42 AVG GPA COMPARED TO CAMPUS 3.34 GPA
For the 2026-27 academic year, we are projecting a cohort size of 78 students leading into the transition from Multicultural Scholars Program to the updated Keith Lovin Scholars Program.
The Multicultural Scholars Program (MSP) is designed to foster academic achievement, leadership, and oppor tunity for students from diverse backgrounds. Together, these data points reflect a power ful narrative: when students are suppor ted academically, financially, and socially, they rise.
Moving into the 2026-27 academic year, the Multicultural Scholars Program will shift to the newly updated Keith Lovin Leadership Program (KLLP). Through progressive coursework, mentorship, and engagement Scholars engage in developmental pathways that culminates in a leadership cer tificate.
As you review this data, consider:
How can we continue to suppor t balancing academic and leadership success?
What resources or recognition can fur ther empower MSP students as scholar-leaders?
How might MSP academic per formance influence their student experience.
RESIDENTIAL LIFE OCCUPANCY TRENDS
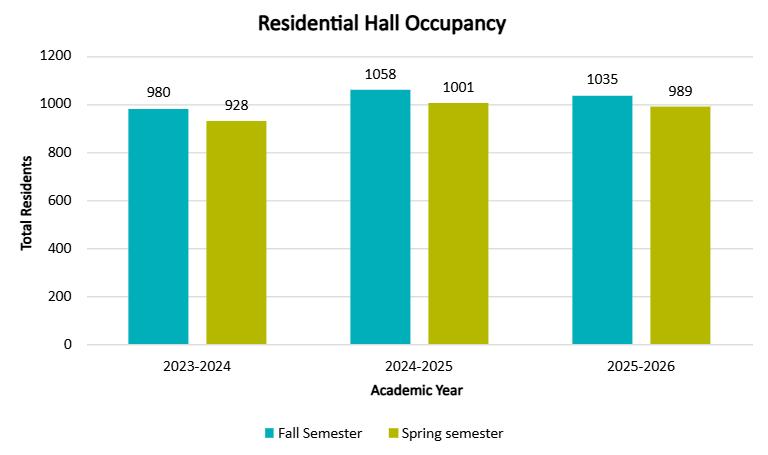
*Occupancy percentage
Over the past three years, Residential Life has suppor ted a consistently vibrant on‐campus community, with each fall semester bringing a strong influx of students eager to connect, settle in, and begin their academic journey. The slight dip between fall and spring each year reflects natural shifts as students study abroad, graduate early, or transition to off‐campus housing, yet the community remains steady and engaged.
Even with a small decline in 2025–26, the residential population continues to reflect a campus where living on‐site remains a central and valued par t of student life. We anticipate 900 residents in 2026-27.
As you review this data, consider:
What campus experiences or programs might have contributed to the peak in occupancy during 2024–25?
What factors could be influencing students’ decisions to remain on campus or move off campus between semesters? How might Residential Life leverage these trends to strengthen community-building effor ts?
RESIDENT ASSISTANTS ACROSS CAMPUS HOUSING
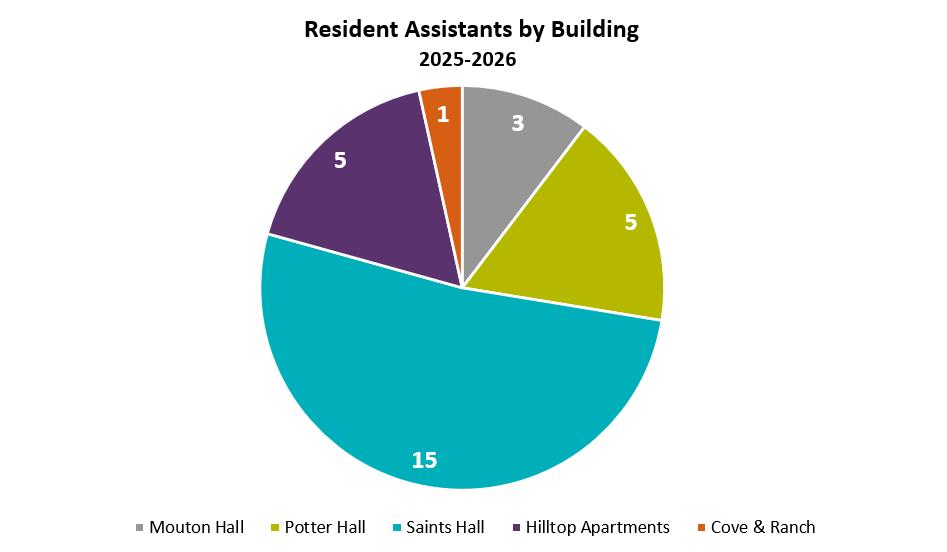
The Resident Assistant (RA) team reflects a group of students who are deeply woven into the fabric of campus life, balancing leadership, academics, and involvement across many corners of the university. The team’s presence stretches across ever y residential area, creating a sense of suppor t for students.
Many RAs are already highly engaged whether ser ving as student leaders or competing as student athletes demonstrating a commitment to their communities that extends well beyond their housing roles. Their strong average GPA highlights not just responsibility but resilience, showing that these students are excelling academically while guiding their peers.
As you review this data, consider:
What might motivate students in different buildings to step into RA roles?
How does the presence of student leaders and student athletes enrich the RA team and the suppor t they provide?
What additional suppor t or development oppor tunities could strengthen the RA program based on the stor y this data tells?
RESIDENTIAL HALL CONDUCT INSIGHTS
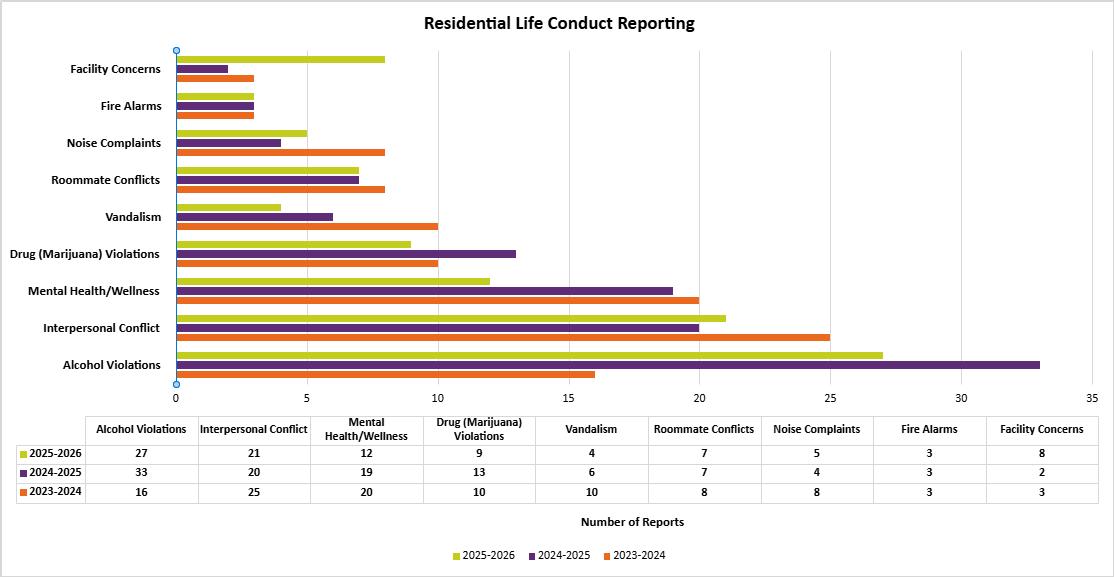
The data shows shifting trends in Residential Life conduct repor ts across the past three academic years. Alcohol violations and interpersonal conflicts remain among the most frequently repor ted issues, with a noticeable peak in alcohol-related repor ts during 2024–25. Facility concerns rise significantly in 2025–2026, while mental health/wellness repor ts fluctuate but remain a consistent area of need.
As our community changes, our repor ting patterns naturally evolve, reflecting new challenges, behaviors, and suppor t needs within Residential Life.
THE OVERALL INCREASE IN REPORTING CAN BE ATTRIBUTED TO ENHANCED COLLABORATION BETWEEN RESIDENTIAL LIFE AND PUBLIC SAFETY, VOLT AI SUPPORT, EXPANDED TITLE IX TRAINING INITIATIVES, AND THE IMPLEMENTATION OF A COMPREHENSIVE WRAPAROUND CARE MODEL THAT PRIORITIZES HOLISTIC SUPPORT.
As you review this data, consider:
What community or environmental factors may have contributed to the spike in alcohol violations during 2024–2025?
How might evolving community dynamics influence future repor ting trends and needed suppor t services?
How can Residential Life adapt staffing, training, or communication to better meet the evolving needs reflected in this data?
EDUCATIONAL TRAININGS (2025-2026)
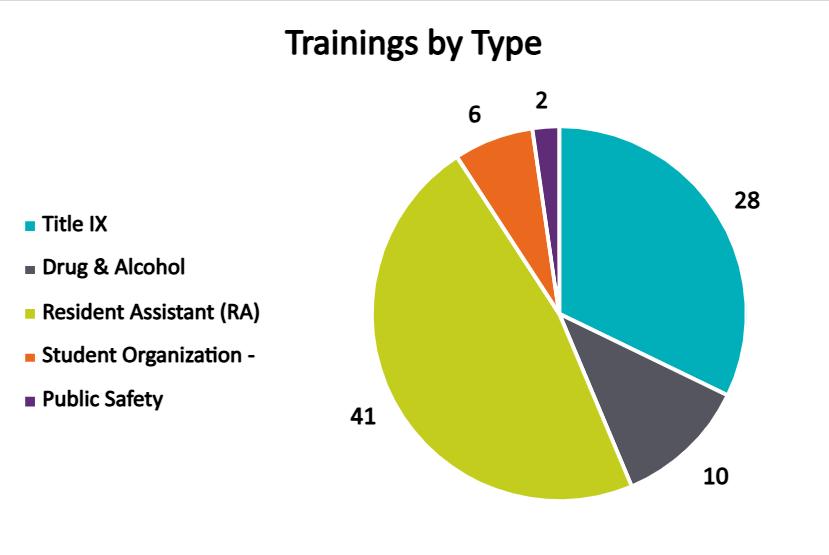
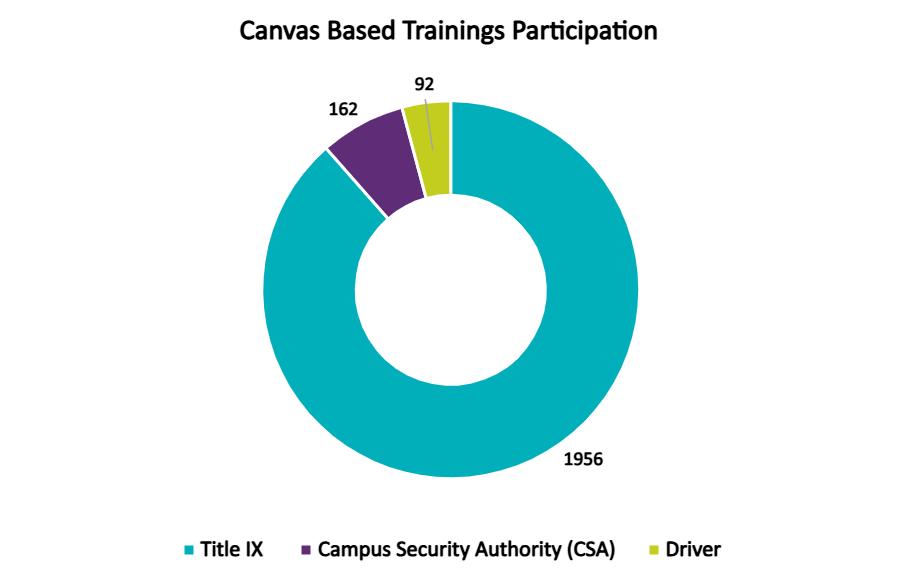
The data shows a strong commitment across campus to educational trainings that suppor t safety, compliance, and well‐being. Title IX training stands out with exceptionally high par ticipation with 93% of first year students and athlete par ticipation. While CSA and Driver trainings represent smaller por tions of total par ticipation, their engagement reflects impor tant attention to campus security responsibilities and safe decision‐making practices.
Together, these trainings reveal a campus that prioritizes preparedness and accountability, using education as a foundation for a healthier and safer community. This collective effor t underscores how essential these trainings are in shaping a culture of awareness, responsibility, and care.
As you review this data, consider:
Are there additional training topics that could strengthen our overall campus preparedness?
How do these trainings contribute to a safer and more suppor tive campus environment?
How can we better ensure that faculty, staff, and students understand the impor tance of par ticipating in these trainings?
STUDENT EMPLOYEES ACROSS THE DIVISION
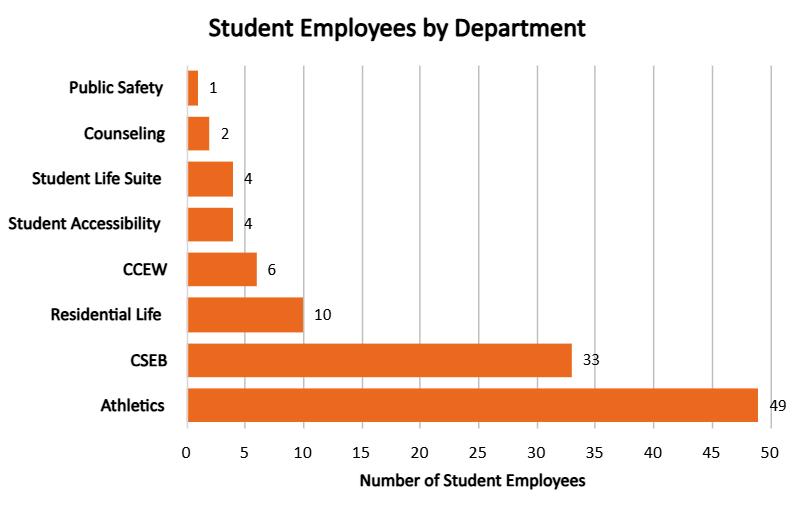
Student employees are at the hear t of the Student Life Division, powering the daily operations that keep programs, services, and student suppor t running smoothly. Their presence strengthens every corner of the division from high-activity areas that depend on large teams to smaller offices where even a single student worker makes a meaningful difference.
Beyond their operational impact, these students demonstrate strong dedication by balancing their roles with their academic commitments, collectively maintaining a high level of achievement. Their work not only suppor ts the campus community but also helps shape their own leadership, professionalism, and sense of belonging.
As you review this data, consider:
How might depar tments better suppor t and develop the student workers they rely on?
How can we elevate the student employee experience while maintaining highquality operations?
In what ways does this data inspire future improvements in staffing, training, or resource allocation?
Press the play button to hear a message from our Dean of Student Wellness, Dr. Oliver Tacto
HEALTH, HEALTH, WELL-BEING & SAFETY WELL-BEING & SAFETY
Health, Well-being, & Safety emphasizes the impor tance of student wellness and safety, backed by data from our Wellness depar tments. We will also explore the impact of community service effor ts, reflecting our commitment to fostering a suppor tive and inclusive campus environment.
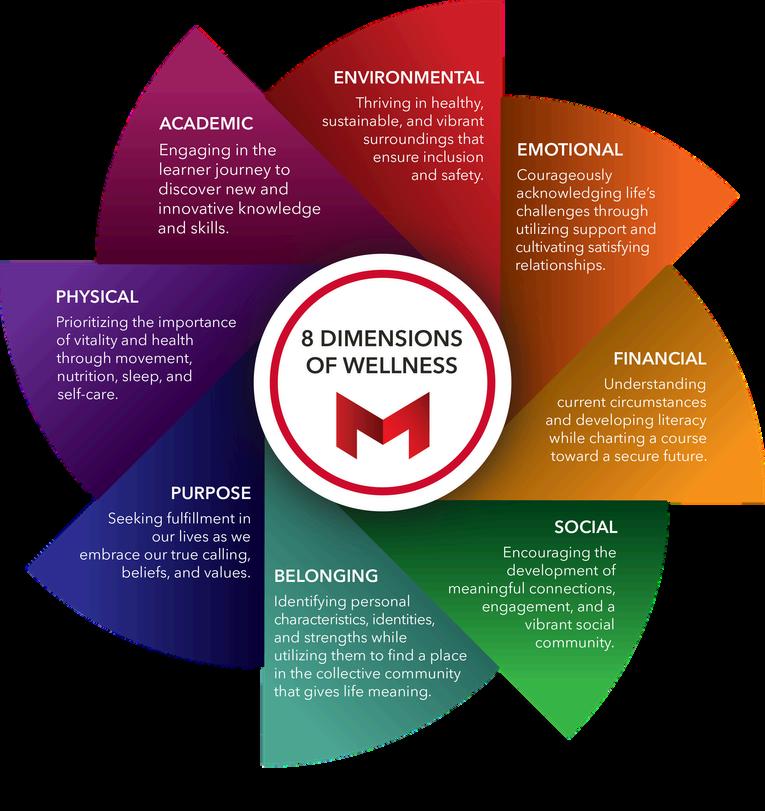
EVENTS HOSTED ACROSS THE 8 DIMENSIONS OF WELLNESS (2025-2026)
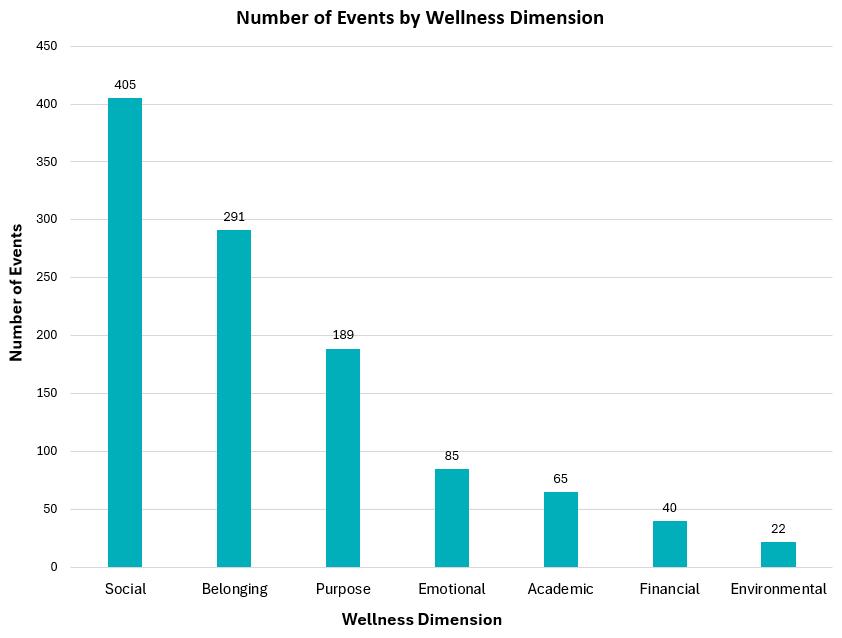
Engagement is clearly thriving in the Social, Belonging, and Purpose dimensions, which make up the majority of events and reflect a strong emphasis on connection, inclusion, and personal growth.
The high number of Social events highlights a vibrant, connectiondriven campus experience, while strong par ticipation in Belonging and Purpose shows that students are finding meaningful ways to engage and feel suppor ted.
As you review this data, consider:
Are Emotional, Academic, Financial, and Environmental dimensions underrepresented due to lower demand or limited resources?
What par tnerships across campus could help expand programming in the underrepresented wellness dimensions?
How can student feedback be used to better understand interest and needs within the underrepresented wellness dimensions?
COMMUNITY SERVICE ENGAGEMENT
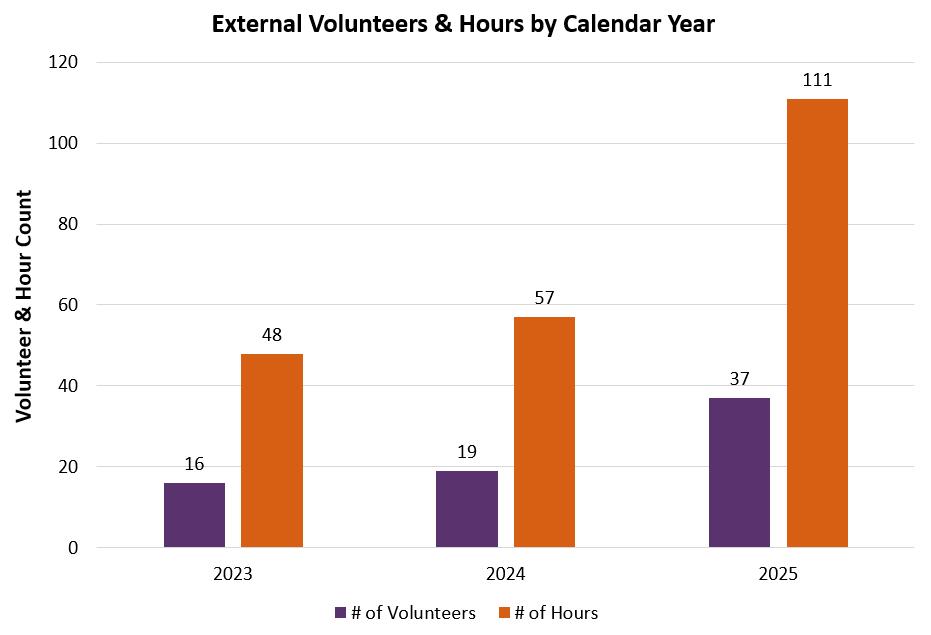
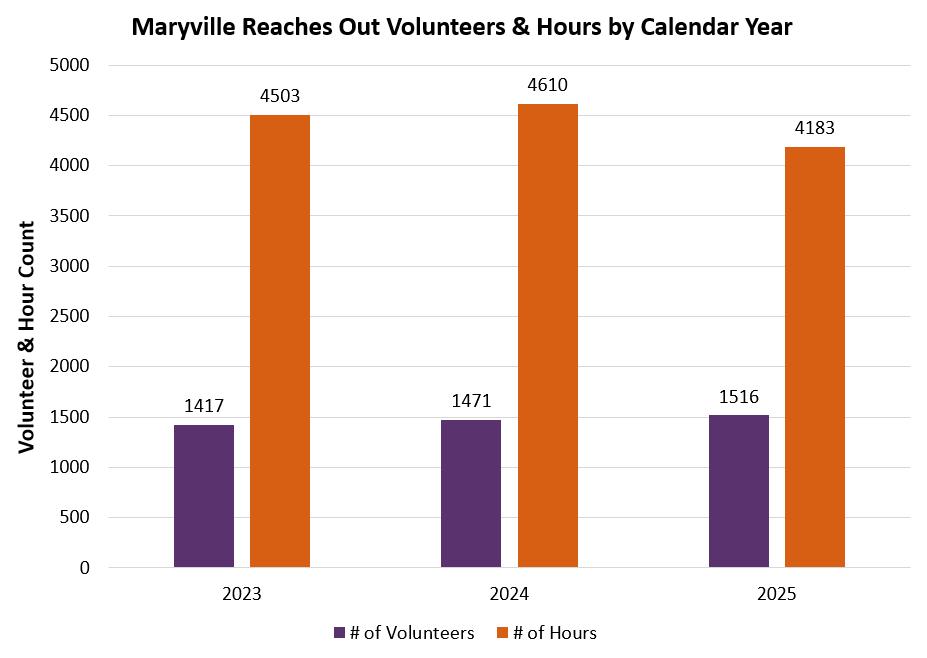
Maryville Reaches Out (MRO) volunteer par ticipation shows consistent growth, with volunteer counts rising each year from 2023 to 2025, accompanied by strong contributions in total hours. Even with a slight dip in hours in 2025, the overall trend reflects a committed and expanding volunteer base.
Non-MRO volunteering displays more year-to-year fluctuation but shows notable peaks in 2025, when both volunteer numbers and hours reached their highest levels.
As you review this data, consider:
What factors might explain shifts in volunteer numbers or hours each year?
Which program elements seem to motivate volunteers to stay engaged?
Where could we adjust scheduling or tasks to better match volunteer capacity?
PEAthlete: Required physicals for student athletes
PEHealthPR: Routine physicals for health profession programs
URI: Visits for upper respiratory infections
STUDENT HEALTH CLINIC TRENDS (2025-2026)
LabOrder: Appointments for provider-ordered lab tests
InHouseLabs: Lab services completed on-site
AllergyShot: Immunotherapy visits
PE: Routine physical exams
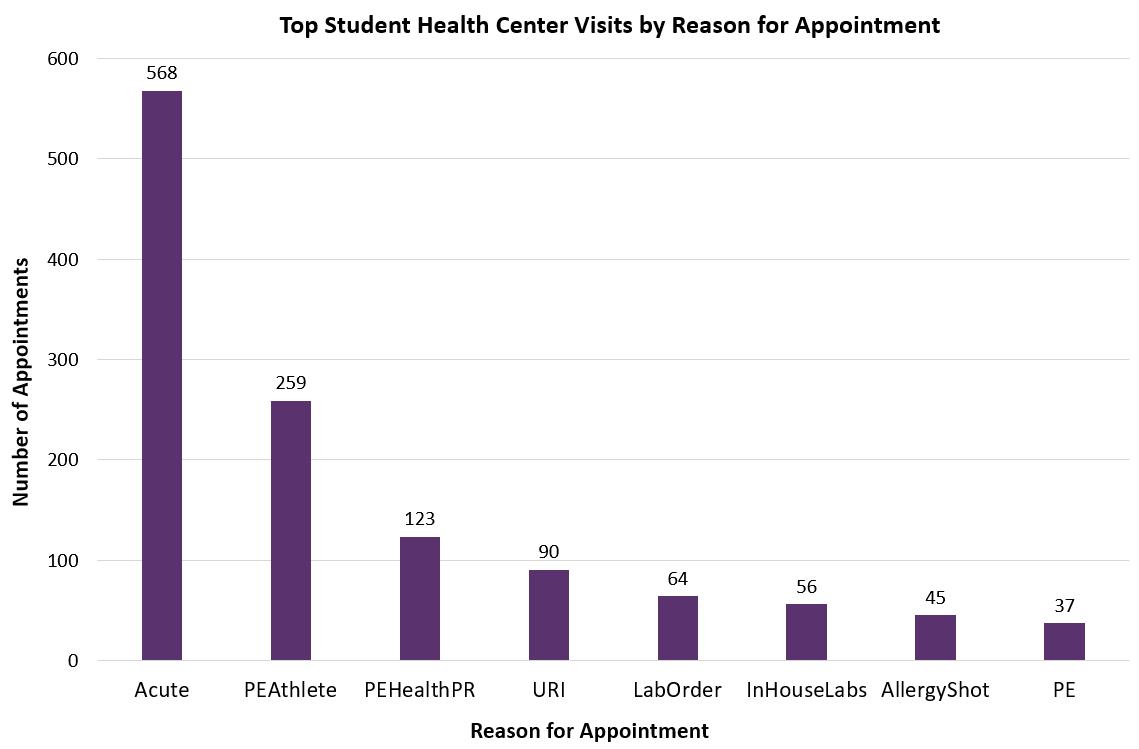
Most student health center visits are for acute concerns (568), such as colds, sore throats, coughs, UTIs, and stomach issues, far exceeding other visit types like PE Athlete exams (259) and routine ser vices including physicals, labs, and allergy shots.
Category Overview
This suggests students are more likely to seek care when sick rather than for preventive needs, though satisfaction remains high (90% overall; 91% would recommend).
As you review this data, consider:
What types of outreach or education could help students better understand the full range of ser vices available at the health center?
What strategies could encourage students to take a more proactive approach to their health?
How can the health center maintain high satisfaction while managing a high volume of acute visits?
STUDENT HEALTH CLINIC SATISFACTION RATES (2025-2026)
Student Testimonials:
“Thank you for giving MU students the opportunity to receive health care. The staff is so kind and understanding.”
“I love the people and how safe, seen, and heard they make me feel when I come in.”
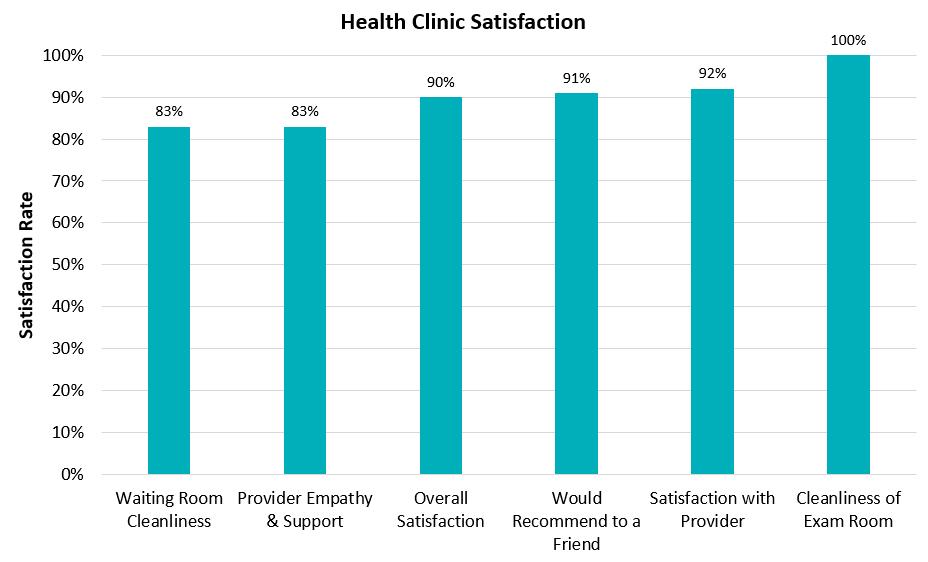
Strong satisfaction across all areas highlights the health clinic’s ability to deliver highquality, trusted care. Per fect cleanliness (100%), along with high provider satisfaction (92%) and recommendation rates (91%), reinforces a consistently positive patient experience.
This indicates that students not only have positive experiences when using health services but also feel confident encouraging others to use them.
As you review this data, consider:
How can the clinic maintain this high level of trust and recommendation as student demand continues to grow?
What small improvements in waiting room experience or provider interaction could elevate already strong satisfaction levels?
How can these positive outcomes be used to encourage more students to utilize health clinic services?
“The nurses were very welcoming and approachable about my medical situation.”
MENTAL HEALTH ENGAGEMENT (2025-2026)
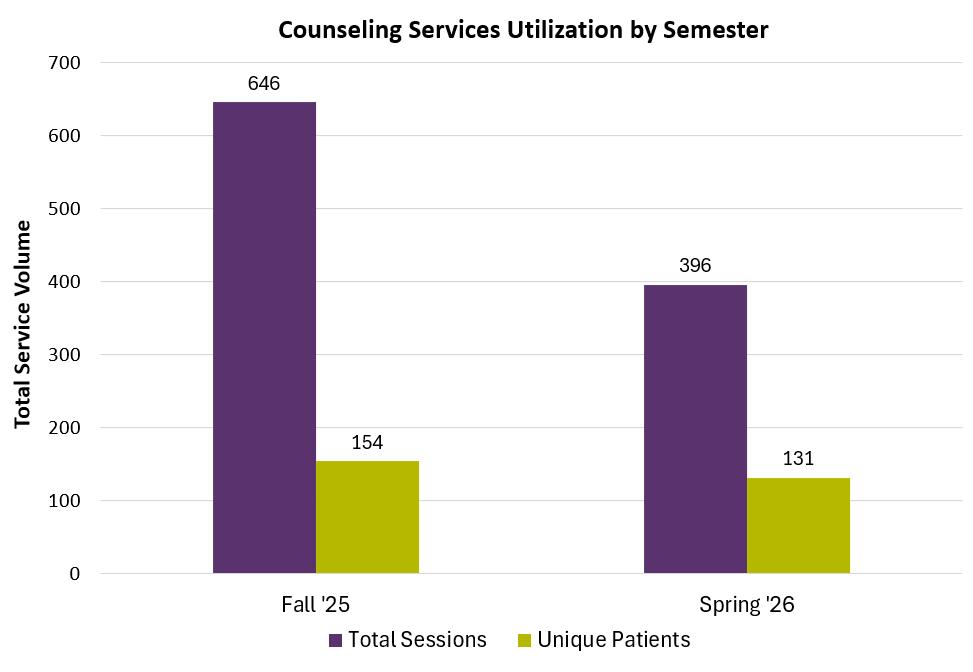
*Spring data through March 2026
Counseling services continue to play a significant role in suppor ting student well-being, with Fall ’25 showing substantially high engagement. In Fall ’25, 646 counseling sessions were provided to 155 unique students, reflecting strong utilization of available mental health resources. By March of Spring ’26, counseling staff had already delivered 396 sessions to 131 unique patients, demonstrating continued student engagement with mental health services throughout the academic year. Together, these numbers reflect the ongoing impor tance of accessible counseling suppor t and the sustained demand for care on campus.
As you review this data, consider: What factors might be contributing to students actively seeking counseling suppor t at this level?
How can we continue to promote awareness and reduce barriers so students feel comfor table accessing these services?
What additional outreach strategies could encourage more students to engage with counseling resources earlier when challenges arise?
STUDENT SATISFACTION WITH MENTAL HEALTH SERVICES (2025-2026)
Student Testimonials:
“The experience brought me a sense of peace and security!”
“Empathetic beyond expectation. I expected wellbeing at MU but staff and services are beyond that. Very grateful.”
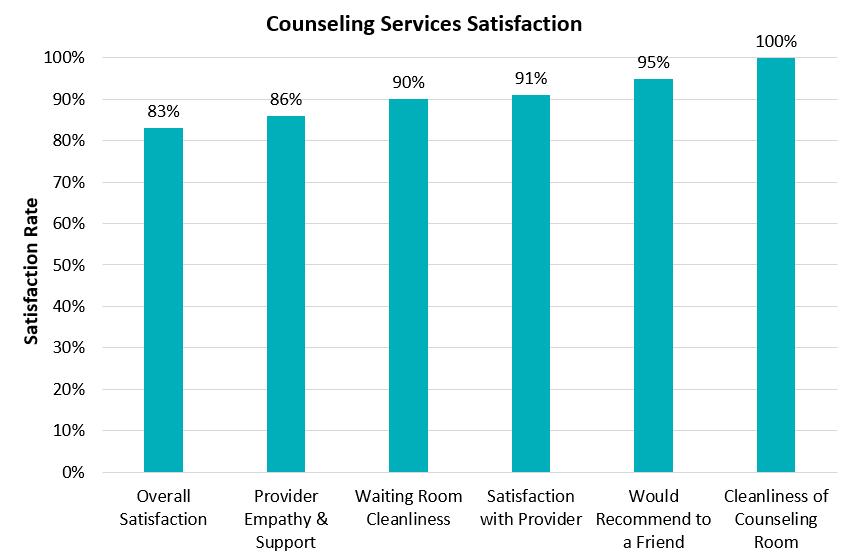
An over whelmingly positive experience stands out across counseling ser vices, with satisfaction consistently high in ever y area. Cleanliness of the counseling room leads at a per fect 100%, alongside strong ratings for recommending ser vices (95%) and satisfaction with providers (91%), highlighting both the quality of care and environment.
These results suggest the counseling depar tment is effectively creating a suppor tive, trusted space for students, while also reinforcing oppor tunities to continue strengthening interpersonal connection and overall experience.
“Such amazing staff and so supportive.”
As you review this data, consider:
What aspects of the counseling experience are contributing most to students’ willingness to recommend these ser vices?
How can feedback from students be used to fur ther improve the counseling experience?
How can these strong outcomes be leveraged to increase awareness and encourage more students to utilize counseling ser vices?
CASE MANAGEMENT IMPACT & STUDENT SUPPORT (2025-2026)
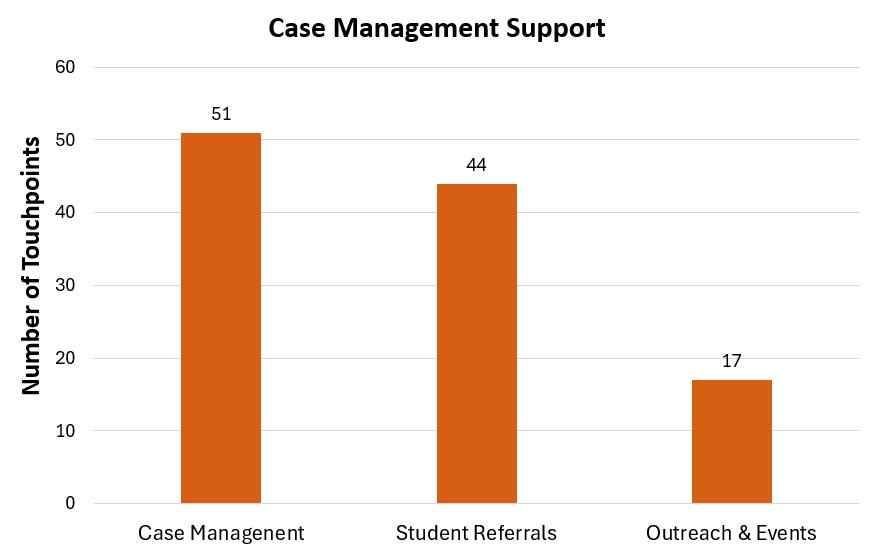
Case Management: one-on-one support where students receive tailored guidance, resource navigation, and ongoing care based on their unique needs.
Student Referrals: Reflect the accessibility and visibility of case management services, where faculty, staff, and students utilize a direct and responsive process to connect students with support.
Outreach & Events: Proactive efforts to increase awareness of case management services and available resources through programming, presentations, and campus-wide initiatives.
Case management effor ts are largely centered on direct student suppor t, with 51 interactions and 44 referrals, alongside numerous outreach events (17). This reflects a strong commitment to individualized care and connecting students with the resources they need.
The addition of the case management role has fur ther strengthened this work, expanding student connections and increasing the program’s reach.
At the same time, the data highlights an oppor tunity to continue growing outreach and prevention effor ts to engage students earlier and broaden overall impact.
As you review this data, consider:
What oppor tunities exist to increase student awareness of case management and available suppor t services?
Are current referral processes effectively connecting students to the resources they need?
What balance should be struck between direct case management and broader outreach effor ts?
UNDERSTANDING STUDENT BELONGING AT MARYVILLE
N=126/18%
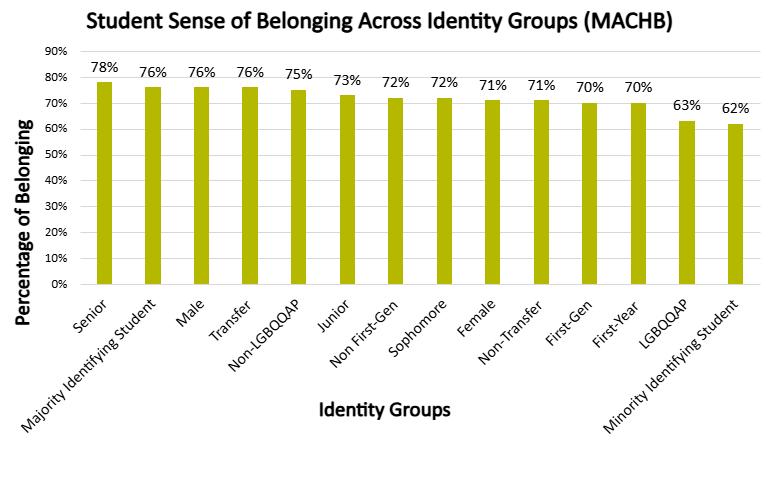
The Missouri Assessment of College Health Behaviors (MACHB) is an annual online survey sent to 1,000 randomly selected undergraduate students at Missouri institutions. It examines substance use, mental health, interpersonal violence, and student perceptions to help inform campus policies and programs that support student well-being.
The data shows that students generally report a strong sense of belonging, with most groups falling between 70–78%. Seniors report the highest sense of belonging (78%), while students who identify as LGBQQAP (63%) and students of color (62%) report the lowest levels. There is also a slight trend of belonging increasing with class year, as upperclassmen report higher percentages than freshmen.
Overall, while belonging is relatively high across the board, there are noticeable gaps among certain identity groups that may point to opportunities for more targeted support and inclusion efforts.
As you review this data, consider:
What actions can be taken to improve the sense of belonging for groups reporting lower percentages?
How can the institution better support students earlier in their college experience to strengthen belonging?
What programs or initiatives could help close the gaps in belonging across different identity groups?
STUDENT ACCESSIBILITY & SUPPORT
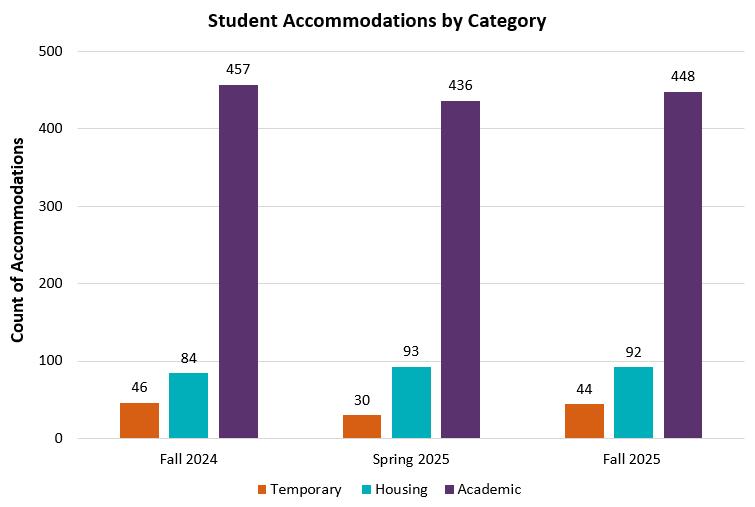
Student accommodations are consistently highest in the academic category across all semesters, with over 430 accommodations each term, highlighting a strong demand for academic suppor t.
Housing accommodations remain steady in the 80–90 range, while temporary accommodations are lower but show slight variation across semesters.
Overall, the data reflects a consistent need for academic suppor t services, alongside stable demand for housing and shor t-term accommodations, emphasizing the impor tance of maintaining and expanding these resources to suppor t student success.
As you review this data, consider:
What factors might be driving the consistently high need for academic accommodations?
How can suppor t services continue to adapt to meet both ongoing and shor t-term student needs?
Are there oppor tunities to better connect students with available accommodations earlier in the semester?
TITLE IX REPORTS
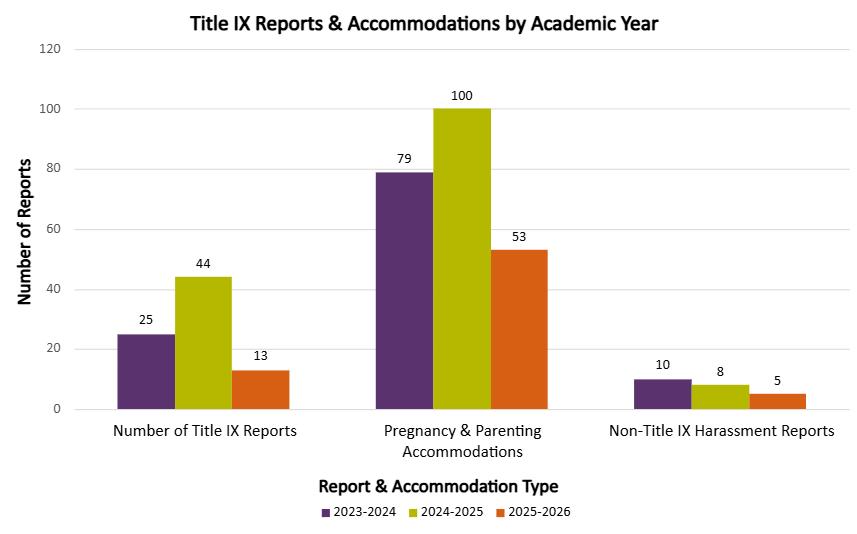
Title IX suppor ts students by addressing sex-based discrimination and by providing pregnancy-related accommodations to ensure equal access to education. Title IX repor ts rise significantly from 25 to 44 between the first two years but then fall sharply to 13, indicating a notable shift in repor ting behavior or campus climate. Non‐Title IX harassment repor ts show a steady decline from 10 to 8 to 5, which point to improved prevention effor ts.
Overall, it reflects ongoing demand for suppor t services and the impor tance of awareness and access to resources.
As you review this data, consider:
How can the university ensure students feel safe and suppor ted when seeking Title IX services?
How can awareness of Title IX resources be strengthened so students feel comfor table seeking suppor t?
What oppor tunities exist to improve coordination between Title IX services and other campus suppor t resources?
COMMERCE BANK MY MILESTONES STUDENT REPORT
My Milestones by Commerce is a financial wellness platform that suppor ts students by providing interactive tools, education, and personalized guidance. It helps students manage their finances by setting savings goals, understanding debt, and planning for their future, while building financial knowledge and confidence.
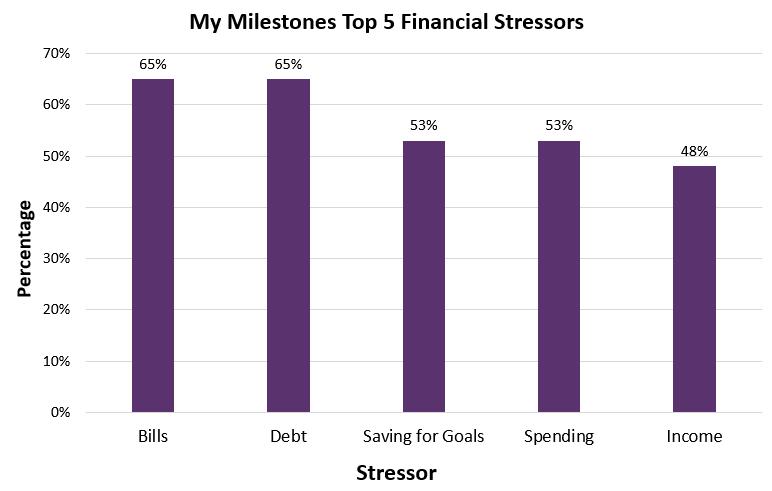
Students are navigating a range of financial stressors, with bills and debt as the most common concerns (65%). Over half also face challenges with saving and spending (53%), and nearly half repor t stress related to income (48%).
These trends highlight oppor tunities to better suppor t students in building confidence and developing skills to manage their finances effectively
To strengthen this suppor t, we have transitioned to a new par tnership with Vantage Credit Union, expanding access to financial education and resources for students.
As you review this data, consider:
How can students be better suppor ted in managing bills and debt, the most common stressors?
What resources or education could help students feel more confident about saving and spending?
Why might income be repor ted as a lower stressor compared to other financial concerns?
BEHAVIORAL INTERVENTION TRENDS (2025-2026)
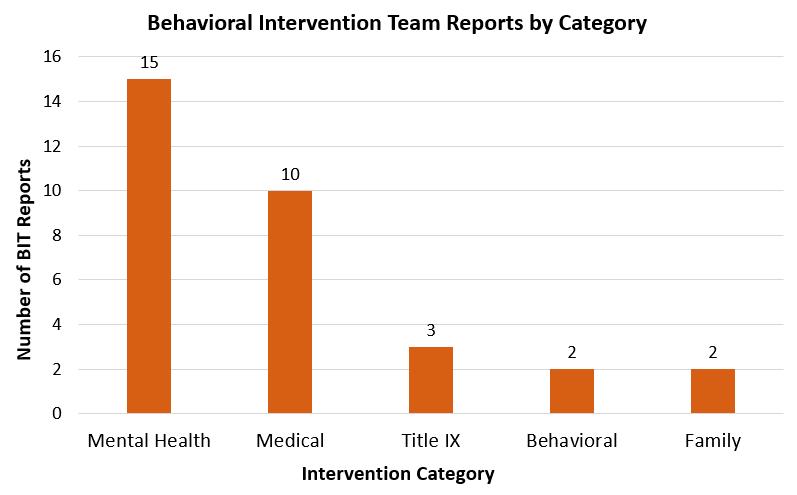
Behavioral Intervention Team (BIT ) repor ts are referrals made when a student’s behavior raises concern about their well-being or the safety of others. These repor ts are typically submitted by faculty, staff, or students and can involve issues such as mental health concerns, unusual or disruptive behavior, threats, or significant life challenges. The BIT team consists of university staff from Public Safety, Residential Life, Title IX, Wellness, Student Conduct, and Life Coach.
Mental health stands out as the leading reason students are connected to the Behavioral Inter vention Team (15 repor ts), followed by medical concerns (10), while other areas such as Title IX (3), behavioral (2), and family-related concerns (2) occur far less frequently. This pattern highlights the critical role mental health plays in student well-being and underscores the impor tance of strong, accessible suppor t resources on campus.
While a range of concerns are present, the data clearly points to mental health as the most pressing area of need.
As you review this data, consider:
How can the university strengthen suppor t systems to address the high number of mental health-related repor ts?
Are there early inter vention strategies that could reduce the need for BIT involvement in these cases?
What resources or par tnerships could help address the range of concerns seen across different repor t categories?
PUBLIC SAFETY REPORTS
VOLT AI has become our eyes and ears where our current operation has limited capacity. As a result of this visual intelligence, we have been able to identify more student concerns and behaviors that lead to successful intervention, wrap-around care, and ultimately student success and retention. VOLT has become another member of our wellness team, identifying cries for help before they become a crisis. Well-being crises hide in plain sight. Our cameras monitor, but VOLT predicts.
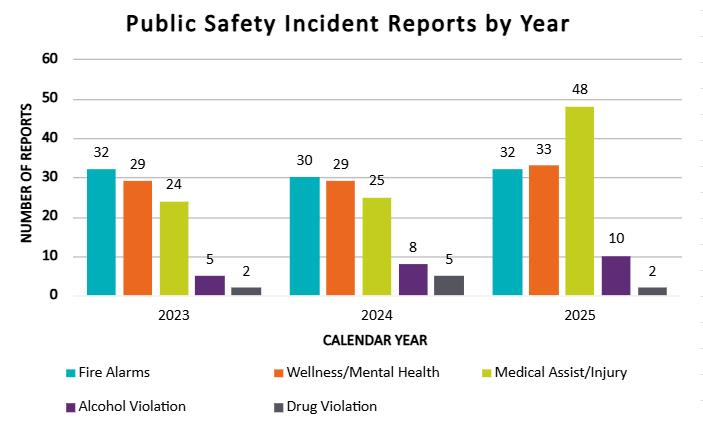
Our Public Safety Team works around the clock to ensure a safe place for our community. The repor ting data shows that fire alarm and wellness/mental health repor ts remained relatively steady from 2023 to 2025, with only slight fluctuations.
Medical assist and injur y repor ts, however, rose sharply in 2025, becoming the most frequent incident type that year Alcohol violations increased gradually over the three-year span, while drug violations stayed consistently low.
Overall, the visual suggests growing needs in health‐related suppor t and continued attention to safety behaviors on campus.
As you review this data, consider:
What factors might explain the significant increase in medical assist and injur y repor ts in 2025?
Which categories appear most stable or most variable, and what might that indicate for future planning?
What resources might need to be expanded if these trends continue into future years?
SAINTS CABINET BASIC NEEDS PANTRY
(2025-2026)
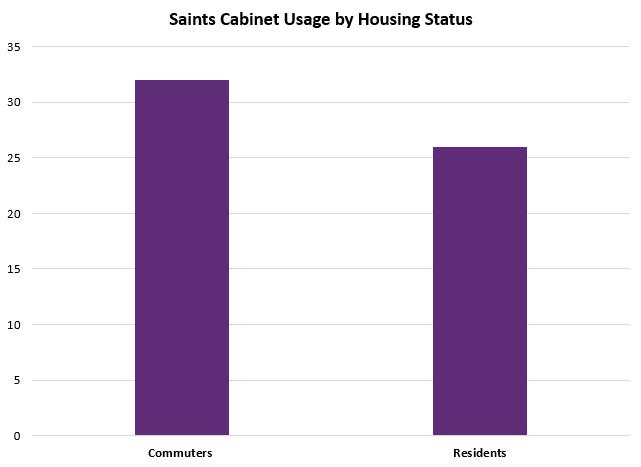
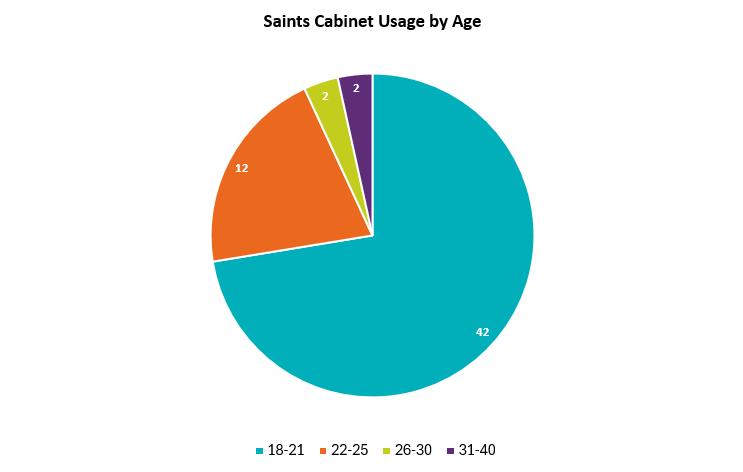
In its first year operating from the renovated McNally House, the Saints Cabinet has quickly become a meaningful resource for students who need suppor t with food, hygiene items, and basic household supplies. The data shows that both commuter and residential students rely on the pantry, with commuters visiting slightly more often. The majority of users are traditional‐age students, highlighting how common it is for young adults to navigate financial or basic‐needs challenges during college.
Overall, the Saints Cabinet’s usage reflects a campus community that is growing more comfor table seeking suppor t and that benefits deeply from accessible, no‐cost resources.
As you review this data, consider:
What factors might influence commuters to use the pantry more frequently than residents?
What outreach strategies could help ensure all students feel welcome using the Saints Cabinet?
How does the pantry’s new location in McNally House affect ease of access and usage patterns?
Press the play button to hear a message from our Director of Public Safety, Brandon Baethke
RESOURCES & RESOURCES & OPERATIONS OPERATIONS
In Resources & Operations we’ll evaluate the operational backbone of the institution by examining the contributions of staff, both on campus and externally. We’ll also analyze our evolving digital footprint to better understand how our resources and infrastructure suppor t the broader campus community.
STUDENT LIFE STAFF DATA (2023-PRESENT)
COMMITTEE
25
STUDENT AFFAIRS STAFF
The data illustrates the extensive internal and external contributions of Student Life staff from 2023–26, showing a strong commitment to collaboration, teaching, and professional engagement.
With 81 full‐time staff members contributing to over 30 conference presentations and teaching 28 classes, the division demonstrates ongoing investment in professional development and knowledge‐sharing.
Staff also hold 44 campus committee seats and 35 external committee seats, reflecting meaningful involvement in both institutional and broader community initiatives.
As you review this data, consider:
How do these contributions (teaching, presentations, committee work) enhance the overall student experience on campus?
How does par ticipation in external committees and conferences benefit the campus community?
How might we communicate the impact of this work more effectively to campus par tners and leadership?
STUDENT LIFE STRATEGIC PLAN (2023-2027)
A CTIONSTEPS DATA
The data shows strong progress on our 2023–27 strategic plan, with 79% of all identified action steps already completed. Out of 112 total steps, 88 have been successfully achieved, demonstrating steady and intentional movement toward our divisional goals. With only 24 steps remaining, the division is well‐positioned to complete the plan on schedule and continue building on this momentum.
As we look ahead, additional action steps will be added once the new strategic plan is released, ensuring our work continues to evolve alongside emerging priorities.
As you review this data, consider:
How can we prepare for integrating new action steps once the next strategic plan is finalized?
How do we ensure future action steps remain aligned with shifting campus needs and long‐term priorities?
In what ways can we sustain momentum and collaboration as we transition to the next phase of planning?
SOCIAL MEDIA FOOTPRINT (2025-2026)
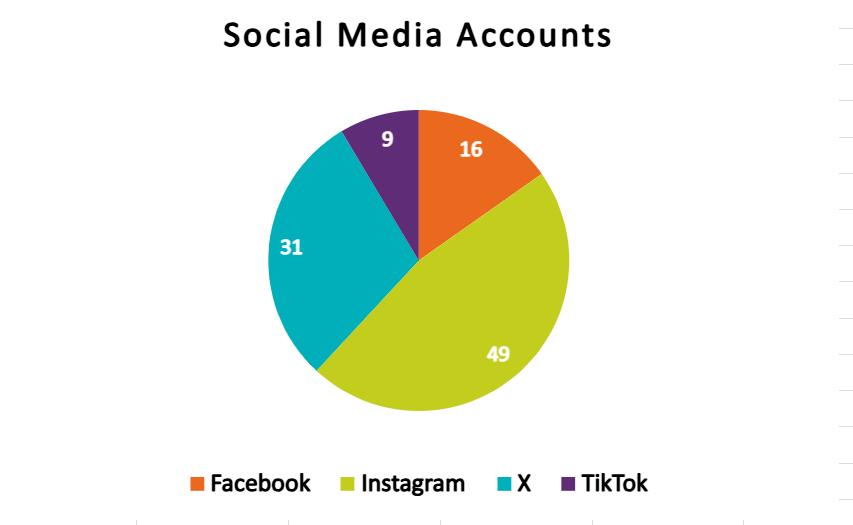
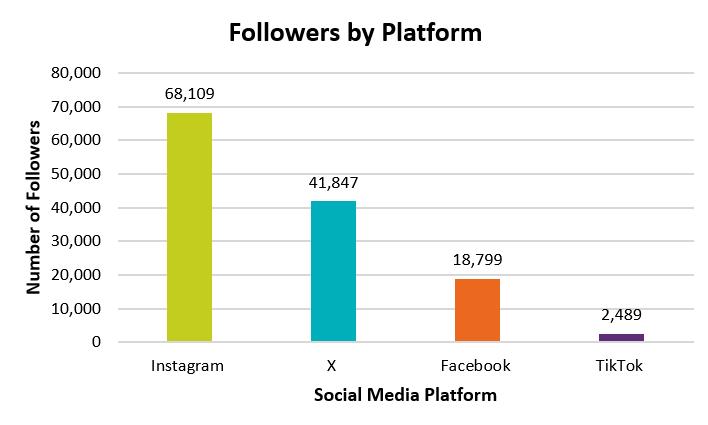
The data emphasizes Instagram as the division's leading platform, with 47 accounts across depar tments and consistently high follower counts, demonstrating its popularity among students. Athletics stands out with the highest engagement rates raking in 8.5M views for this year, showcasing its ability to foster meaningful connections.
This data shares that social media continues to be a primar y tool for connection. However, the large number of accounts across the division may be diluting the overall impact, presenting an oppor tunity to consolidate effor ts and create a more cohesive and effective communication strategy.
As you review this data, consider:
What factors might contribute to Instagram’s popularity as the division’s leading platform for student connection?
With 47 accounts across the division, how might the large number of accounts impact the overall communication strategy and student engagement?
How can the division better leverage Instagram’s popularity to foster even more meaningful connections and engagement with students?
UNIQUE CLICKS ON OUR STREAMS
13,586
CLICKS ON OUR STREAMS 20,715
HOURS 7,477
The streaming data highlights strong engagement with GLVC competitions, showcasing the platform’s ability to attract a large audience. With 20,715 total loads of the site, fans are not only clicking into streams but returning frequently, reflecting high interest and loyalty.
The 13,586 unique loads indicate a broad and diverse reach, while the 7,477.24 total viewer hours demonstrate significant investment in viewership time. This data underscores the impor tance of streaming as a tool to connect with fans, families, and suppor ters, allowing them to stay engaged with competitions in real time.
As you review this data, consider:
What strategies could be implemented to fur ther grow the unique audience base for streams?
In what ways can streaming be leveraged to enhance the overall fan and student-athlete experience?
- UNIVERSITY GEAR SHOP COMMISSIONS
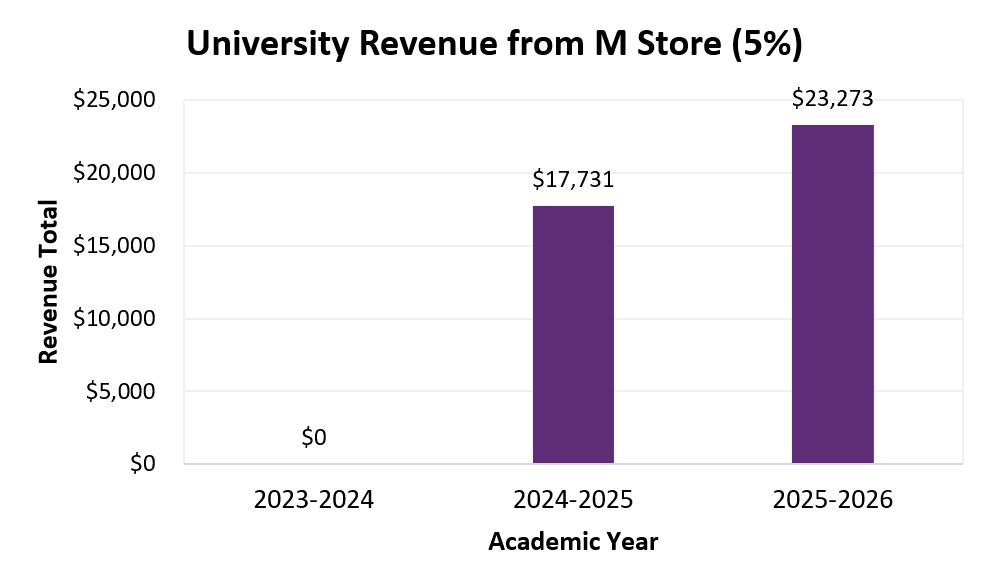
University realized no revenue from the M Store prior to 2024-2025.
In 2024, the store earned $354,622. In 2025, the store earned $465,467
The data shows a dramatic shift in revenue generation following the launch of the University Gear Shop (UGS) par tnership in Summer 2024. Before this par tnership, the University earned no revenue from the M Store, but the first year immediately generated $17,731 in commissions, demonstrating the impact of the new model.
Revenue continued to grow into 2025–26, rising to $23,273 and signaling strong momentum and student interest in the revitalized retail experience. With the University receiving 5% of total M Store revenue, this par tnership is clearly creating a new and reliable revenue stream that did not exist prior to 2024.
As you review this data, consider:
How can the University continue to build on this momentum to fur ther increase M Store revenue?
What role might marketing, campus events, or product offerings play in shaping future revenue trends?
PRINTERS - RICOH/GFI
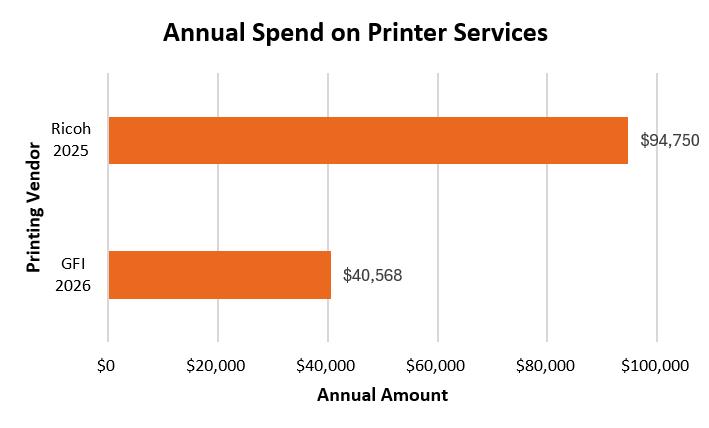
The transition from Ricoh to GFI in Summer 2025 marks a major shift in how the University manages its campus printing services. The char t clearly shows that GFI’s annual cost is significantly lower than Ricoh’s, illustrating the immediate financial impact of the change. This shift results in an annual savings of $54,182 for the University, freeing up resources that can be redirected toward other campus needs.
Overall, the move to GFI represents a strategic decision that strengthens operational efficiency and long‐term budget sustainability.
As you review this data, consider:
In what ways could improved printing efficiency impact staff productivity or workflow?
How can the University monitor per formance to ensure the cost savings also align with quality and reliability?
PEPSI PARTNERSHIP
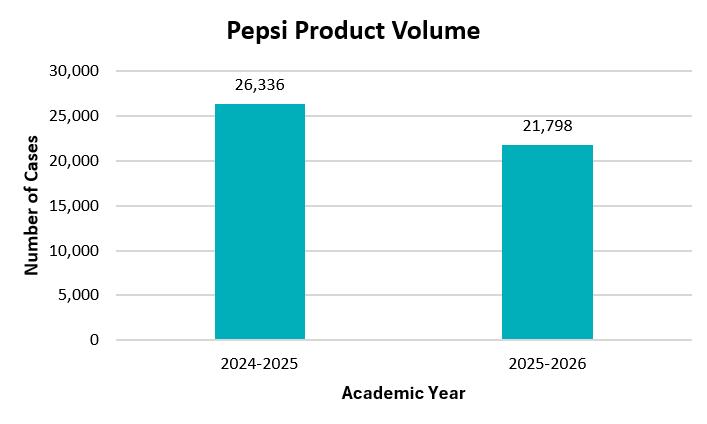
150% over performance since Pepsi
$111,030 in sponsorships received
Projecting 6,500 more cases before end of 2025-2026 fiscal year
The transition from Coke to Pepsi in Summer 2024 initially brought mixed reactions, but the data shows that students and campus par tners quickly embraced the switch. Pepsi product usage remained strong across both years, signaling consistent demand and validating the choice to change vendors.
This increased usage directly contributed to $111,030 in sponsorship payments from Pepsi, creating meaningful financial benefit for the University. As a result, the switch has more than doubled net revenue, turning a debated change into a clear operational success.
As you review this data, consider:
How can we harness Slack even more effectively to build community and boost student engagement?
Are we reaching the right audiences in the right spaces?
What other voices or depar tments could benefit from visibility in high-traffic channels?
WHAT HAPPENS NEXT?
1. Identify Gaps and Oppor tunities: Reflect on the data presented and consider areas where student engagement, resources, or ser vices could be enhanced.
2. Collaborate for Solutions: Engage with colleagues and peers to discuss potential strategies for addressing identified challenges.
3. Set Measurable Goals: Use the insights from this data walk to establish clear, measurable objectives for improvement. Focus on both shor t-term and long-term goals.
4. Share Feedback and Ideas: Contribute to the conversation by sharing your obser vations, feedback, and innovative ideas.
5. Commit to Action: Take ownership of specific areas where you can make an impact, whether through collaboration, program development, or policy changes. Got questions? See an oppor tunity for collaboration? Want to dig deeper into what you saw today? We want to hear from you. Reach us at studentlife@mar yville.edu.
Click here to listen to a closing thank-you message from our Vice President, Raphaella Prange.
Division of Student Life Senior Leadership
Dr. Aretha Hardrick, Dean of Campus Life
Brandon Baethke, Director of Public Safety
Brittany Fennell, Director of Athletics
Dr. Claudia Lyerly, Director of Title IX & Title IX Coordinator
Jennifer Donovan, Chief of Staff
Dr. C. Oliver Tacto, Dean of Student Wellness
Raphaella Prange, Vice President of Student Life
These slides were thoughtfully crafted through the collaboration of Dr. C. Oliver Tacto, Jennifer Donovan, Erin Leigh McKain, and Josie Powers, with valuable data contributions from staff across various departments. Together, we aimed to present meaningful insights that reflect our shared dedication to enhancing the student experience.