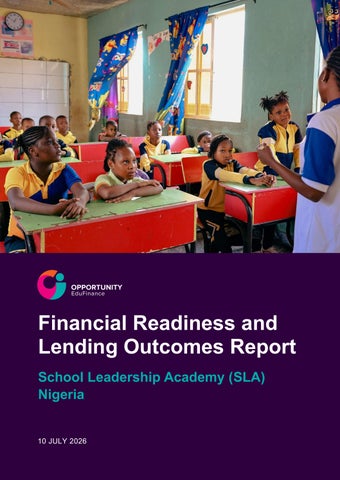
Financial Readiness and Lending Outcomes Report School Leadership Academy (SLA) Nigeria
10 JULY 2026
1
Program Reach and Sample Profile
735
30%
19%
OF TRAINED SCHOOLS
OF SCHOOLS
OF SCHOOLS
Were followed up on
Were contacted by a Financial Institution
Applied for loans
Out of 2,764 schools that participated in the School Leadership Academy (SLA) from May 2023 to December 2025, 27% of the trained cohort had been successfully followed up three months after the workshop. Among the schools reached at follow-up, 30% reported being contacted by a financial institution. This indicates that a meaningful share of trained schools progressed beyond workshop participation into active engagement with formal lenders.
Effects of the Workshop Immediate Shift in Borrowing Appetite
23% INCREASE In willingness to apply for a loan after workshop
Immediately following the workshop, schools reported a substantial increase in their appetite for borrowing. The proportion of participants expressing willingness to apply for a loan increased from 61% prior to the workshop to 84% immediately after. This shift suggests that the training strengthened participants’ confidence, awareness, and perceived readiness to engage with formal lenders.
Three-Month Behavioral Changes Three months after the workshop, observable operational shifts were evident among participating schools. The proportion of schools that were fully registered increased by 8 percentage points, rising from 50% at baseline to 58% at follow-up. Improvements in registration status
2 EDUFINANCE.ORG
reflect progress toward formal compliance, which is often a prerequisite for accessing certain financial products. Bank account ownership also increased modestly, with overall account penetration rising by 5 percentage points to 88%. Formal banking relationships are a foundational component of financial readiness, enabling transaction history, improved transparency, and easier access to credit. In addition to structural changes, participants reported taking concrete steps to improve their bankability:
64%
13%
8%
RECORD KEEPING
BANK ACCOUNTS
INCOME GENERATION
64% implemented more structured record-keeping practice
13% opened new bank accounts
8% engaged In new income-generating activities
These actions suggest that the workshop influenced not only perceptions but also operational behavior. Improved record-keeping, strengthened formalization, and diversified revenue streams collectively enhance a school’s capacity to engage responsibly with formal finance.
Readiness Lending Conversion Analysis A central premise of the SLA model is that improved financial readiness increases schools’ ability and likelihood to engage with formal lenders. This section explores the relationship between observed improvements in operational readiness and subsequent loan application and disbursement outcomes.
3 EDUFINANCE.ORG
I MP R OV E ME N T E FF O R T B Y A P P L I C A TI O N R A TE A N D SU C C E S S R A TE # of Times Selected
Applicatio n Rate (%)
Success Rate (%)
Flag1
Putting in place proper record-keeping methods
467
22%
8%
High potential signal
Improving the school environment (e.g. renovation)
310
21%
8%
High potential signal
Preparing annual and termly school budgets
262
23%
8%
High potential signal
Improving parent engagement
244
18%
7%
High potential signal
Efforts to advertise the school
221
16%
7%
Drives success
Greater efforts for school fee collection
202
16%
4%
Lower signal
Improving on teaching and learning resources
160
13%
6%
Lower signal
Professional development for staff
153
6%
3%
Lower signal
Recruiting quality teachers
127
16%
6%
Lower signal
Improving on learner performance
82
15%
2%
Lower signal
Hiring a technical person to handle school finances
57
23%
4%
Drives demand
Engaging in new income-generating activities
55
36%
13%
High potential signal
1 Improvement categories are classified using a benchmark-based approach that compares each
category’s application rate and successful application rate to overall averages. Categories with both metrics above the benchmark are labeled “High potential signal,” indicating stronger directional association with both loan demand and approval outcomes. Those with above-average application but below-average success are labeled “Drives demand,” while those with below-average application but above-average success are labeled “Drives success.” Categories below the benchmark on both metrics are classified as “Lower signal.” These classifications are indicative and do not imply causation, as schools may undertake multiple improvements simultaneously.
4 EDUFINANCE.ORG
I MP R OV E ME N T E FF O R T B Y A P P L I C A TI O N R A TE A N D SU C C E S S R A TE # of Times Selected
Applicatio n Rate (%)
Success Rate (%)
Flag1
Increased the capacity of my school through new classroom construction
41
20%
15%
High potential signal
Separated washrooms for girls and boys
22
14%
9%
Drives success
Invested in new collateral
1
0%
0%
Lower signal
This table highlights how different school improvement efforts are associated with loan application and success rates. Improvements are flagged based on whether they outperform or underperform relative to overall benchmarks, helping to identify which actions are most strongly linked to lending demand and outcomes.
R EG I S TR A TI O N S TA T U S B Y A P P L I C AT I O N SU C C E S S R AT E
# of schools by registration category
Success rate (%)
Fully registered
94
38%
In the process of licensing my school
17
35%
Licensed but not fully registered
25
28%
Not Started
6
33%
Registration status appears to be an important indicator of lending outcomes, with fully registered schools demonstrating the strongest success rates. Efforts should therefore focus on supporting schools to progress toward full registration, as this may improve their likelihood of approval. While registration status is a strong indicator of lending outcomes, it is notable that a small number of unregistered or not-yet-started schools also demonstrate relatively high success rates. Although this should be interpreted with caution due to the limited sample size, it reflects a growing practice among some financial institutions to lend earlier in a school’s lifecycle. Rather than requiring full registration upfront, these institutions are willing to finance schools as they progress toward compliance, with loan funds often supporting improvements in infrastructure, documentation, and operational processes 5 EDUFINANCE.ORG
needed for licensing. In some cases, lending decisions are further supported by endorsements from Private School Associations or relevant government education offices, providing assurance that the school is operational and recognized within the ecosystem. This suggests that, alongside formal registration, alternative signals of credibility and growth potential can also play a role in unlocking access to finance.
R EG I S TR A TI O N S TA T U S B Y A V E R AG E L O A N S I ZE O F S U C C E S S FU L A P P LI C A TI O N S
Average loan size Fully registered
NGN 5,422,727.27
In the process of licensing my school
NGN 3,216,666.67
Licensed but not fully registered
NGN 6,078,571.43
Not Started
NGN 11,000,000.00
While fully and partially registered schools show relatively consistent average loan sizes, it is notable that unregistered schools report significantly higher loan amounts. This should be interpreted with caution given the small sample size, but it may reflect a deliberate strategy by some financial institutions to invest in high-potential schools earlier in their development. In such cases, larger loans are often used not only for operational needs but also to finance infrastructure and improvements required for registration, naturally increasing ticket sizes. There is also likely a selection effect, where the unregistered schools that successfully access financing tend to be more established and financially stronger despite lacking formal licensing. In addition, lender confidence may be reinforced through endorsements from Private School Associations or government education offices, enabling higher exposure. However, given the unsystematic nature of follow-up, these patterns may also be influenced by sampling bias, and should therefore be interpreted as indicative rather than definitive.
Who Applies & Who Receives Not all schools engage with formal finance in the same way. Differences in registration status, financial management practices, school size, and leadership characteristics may influence borrowing behavior and access to credit. This section examines how application and disbursement outcomes vary across key school characteristics. By identifying patterns in borrower profiles, the analysis provides
6 EDUFINANCE.ORG
insight into which segments demonstrate the strongest conversion and where targeted support may yield the greatest impact. S C H O O L VA R I A BL E S B Y A P P L I C A TI O N R A T E AN D S U CC E S S R A TE Application Success Implication Rate (%) Rate (% of applied schools)
Registration status
Pupil enrolment
Gender of school owner
Lowest school fee charged
Fully registered
66.20%
38.30%
In the process of licensing my school
11.97%
35.29%
Licensed but not fully 17.61% registered Total
28.00%
Not Started
4.23%
33.33%
Quartile 1 (Less than 25.00% or equal to 83 pupils)
25.93%
Median (Above 83 pupils; below 133 pupils)
25.15%
39.29%
Quartile 3 (Above 133 pupils; below 250 25.77% pupils)
48.84%
Above Quartile 3 (above 250 pupils)
24.07%
26.09%
Male
23.67%
37.93%
Female
13.24%
33.33%
Quartile 1 (Less than NGN 9,000)
25.19%
16.13%
Median (Above NGN 9,000; below NGN 15,000)
30.38%
32.35%
Quartile 3 (Above NGN 15,000; below NGN 22,000)
20.00%
47.83%
7 EDUFINANCE.ORG
Registration status strongly correlates with application behaviour and moderately with success More formalised schools are far more likely to apply.
School size has limited correlation with application, but mid-tolarge schools show stronger success outcomes, suggesting operational maturity matters.
Gender appears more correlated with application behaviour than success indicating a potential access or engagement gap rather than a creditworthiness gap. Fee level shows a strong positive correlation with success and a moderate relationship with application Higher-fee schools are more likely to be approved.
S C H O O L VA R I A BL E S B Y A P P L I C A TI O N R A T E AN D S U CC E S S R A TE Implication Application Success Rate (%) Rate (% of applied schools) Above Quartile 3 (above NGN 22,000)
24.43%
50.00%
This table compares key school characteristics against loan application and success rates to highlight which factors are most strongly associated with lending demand and outcomes. It enables side-by-side comparison across variables such as registration status, school size, ownership, and fee levels, with implications summarising the directional relationships observed.
Loan Purpose & Investment Quality A P P LI C A TI O N R A TE A ND S U C C E S S R A T E B Y L O A N P U R P O SE Share of Applications (%)
Success Rate (%)
Differenc e (%)
Insight
Strong alignment: Core lending use case with high demand and approvals Slight under-representation: Some demand but modest conversion
New classroom construction
68%
61%
7%
WASH facilities
4%
7%
-4%
Dormitory construction
0%
0%
0%
No demand observed; no conclusion
Staff salaries
10%
0%
10%
Potential constraint area
Computers
2%
5%
-3%
Low demand and low approvals; limited insight
School bus
0%
0%
0%
No demand observed: no conclusion
Purchase of school land
4%
7%
-4%
Some demand but slightly under-indexed in approvals
8 EDUFINANCE.ORG
A P P LI C A TI O N R A TE A ND S U C C E S S R A T E B Y L O A N P U R P O SE Share of Applications (%)
Success Rate (%)
Differenc e (%)
Insight
Rent of school land
1%
0%
1%
Very small volume; not material
Security Fencing/Boundary wall
4%
10%
-6%
Clear demand but weaker approval share; potential constraint area
School Furniture
9%
10%
-1%
Demand and approvals relatively balanced
This table compares the share of loan applications by purpose with their corresponding success rates to identify areas of alignment and gaps in lending outcomes. The “Difference” highlights whether certain purposes are over- or under-represented in approvals relative to demand, while insights summarize where lending is well aligned or where potential constraints may exist.
Financial Inclusion Impact Access to formal finance among previously unserved schools represents a critical dimension of the SLA’s value proposition. Among schools that received loans following participation in the program, 17% were first-time borrowers. This indicates that a portion of lending outcomes reflects genuine financial inclusion rather than repeat borrowing among already banked institutions. In addition, 44% of schools that received loans were women-led. This suggests that female school leaders are meaningfully represented among loan recipients and are engaging with formal credit at comparable levels within the SLA-trained cohort.
Profile of First-Time Borrowers To better understand the nature of financial inclusion achieved, the profile of first-time borrowers was compared to non-first-time borrowers
9 EDUFINANCE.ORG
C O M P A R I SO N BE TW E E N FI R S T- TI ME B O R R OW E R S A N D N O N FI R S T - TI M E B OR R O W E R S First-time borrowers
Non-first-time borrowers
Insight
Application rate
12%
32%
Much lower uptake among first-time borrowers
Success rate
14%
51%
Significantly lower approval likelihood
Rejection rate
18%
7%
Higher rejection among firsttime borrowers
Waiting to hear back from FI
51%
27%
Larger backlog / slower processing
Average loan amount applied for (NGN)
10,420,175
5,143,902
First-time borrowers request ~2× higher amounts
This table compares lending behavior and outcomes between first-time and repeat borrowers across key pipeline metrics. It highlights differences in application, approval, and processing patterns, as well as variations in loan size, to identify where first-time borrowers may face barriers within the lending process.
Profile of Female Borrowers C O M P A R I SO N BE TW E E N FE M AL E A ND M A L E A P P L I C AN T S
Female
Male
Insight
Application rate
13.24%
23.67%
Male-owned schools are nearly 2× more likely to apply, indicating a gap in access or engagement among female owners
Success rate
33.33%
37.93%
Success rates are relatively similar, suggesting comparable creditworthiness once women apply
Rejection rate
9.26%
8.62%
Almost identical rejection rates indicate no observable bias in approvals based on gender
10 EDUFINANCE.ORG
C O M P A R I SO N BE TW E E N FE M AL E A ND M A L E A P P L I C AN T S
Female
Average loan amount applied for (NGN)
1,059,313
Male
Insight
1,748,775
Male-owned schools apply for significantly larger loans (~65% higher), which may reflect scale or risk appetite differences
This table compares lending participation and outcomes between female and male school owners across key metrics. It highlights differences in application behaviour, approval outcomes, and loan sizes to identify potential gaps in access, engagement, and borrowing patterns by gender.
Barriers and Frictions While post-workshop appetite for borrowing increased substantially, not all schools translated this intent into loan applications. Out of the 627 schools who had indicated after the SLA that they would apply, only 23% did apply for a loan when followed-up on. Among schools that did not apply for a loan, the most frequently cited reason was not being ready to borrow (34%). This suggests that while the workshop may have increased awareness and confidence, a significant share of schools still perceive gaps in their preparedness to take on formal debt. The second most common constraint was interest rates being too high (28%), followed by delays from financial institutions (20%). These responses point to both demand-side and supply-side frictions. On the demand side, perceived cost of borrowing remains a deterrent. On the supply side, institutional responsiveness and processing timelines may influence whether schools proceed with applications. Among schools whose loan applications were rejected, interest rates and institutional requirements were again cited as primary factors. This indicates that pricing expectations and eligibility criteria continue to shape final lending outcomes.
11 EDUFINANCE.ORG
ADDRESS Level 18, 100 Bishopsgate London EC2M 1GT Visit us at edufinance.org © 2026 Opportunity International Education Finance functions under its US and UK affiliates. Opportunity International United Kingdom is registered as a charity in England and Wales (1107713) and in Scotland (SCO39692). Opportunity International United States is a 501(c)3 nonprofit.
12 EDUFINANCE.ORG