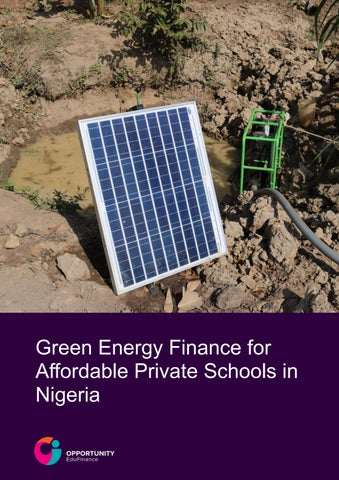
Green Energy Finance for Affordable Private Schools in Nigeria 1
About This Brief The findings in this brief draw on data from 1,894 affordable private schools surveyed through 39 School Leadership Academy (SLA) sessions conducted between March 2024 and June 2026. The analysis focuses on schools' current energy use and expenditure, satisfaction with existing energy sources, demand for renewable energy solutions, and preferences for financing these investments. Q U AR TILE
Student Population Range
Quartile 1
≤ 58 pupils
Quartile 2
59–111 pupils
Quartile 3
112–207 pupils
Quartile 4
> 207 pupils
Where relevant, findings are further analysed by school size, using the same pupilenrolment quartiles applied in the broader 2026 Nigeria Unlocking School Finance Report to identify differences in energy needs and financing preferences across school segments.
2
Energy Needs and Current Costs F I G U R E 1 : D I S T R I B U T I O N O F M O N T H LY E N E R G Y E X P E N D I T U R E A M O N G SURVEYED SCHOOLS
15% 9%
38%
38%
Above N100,000
Below N20,000
N20,000 – N50,000
N50,000 – N100,000
Energy expenditure varies considerably across surveyed schools, although spending is concentrated in the lower and middle expenditure bands. A smaller segment faces substantially higher monthly energy costs, indicating that the financial burden of powering school operations is not uniform across the market. Further analysis by school size helps identify whether higher energy expenditure is associated with larger school operations.
F I G U R E 2 : S AT I S FA C T I O N W I T H C U R R E N T P O W E R S U P P LY A M O N G SURVEYED SCHOOLS 5% 4%
23%
50%
18%
Very dissatisfied
Somewhat dissatisfied
Somewhat satisfied
Mostly satisfied
Satisfaction with current power supply is generally low, with dissatisfaction outweighing satisfaction among surveyed schools. This suggests that existing energy arrangements are not adequately meeting the needs of a substantial share of schools and provides important context for assessing demand for alternative energy solutions.
Very satisfied
F I G U R E 3 : M O N T H LY E N E R G Y E X P E N D I T U R E B Y S C H O O L S I Z E SEGMENT
Energy expenditure generally increases with school size. Lower-enrolment schools are more concentrated in the lower expenditure bands, while higher-enrolment schools are considerably more likely to report higher monthly energy costs. This likely reflects the greater energy requirements associated with operating larger schools and suggests that the potential value and financing requirements of energy investments may differ by school size. Unlike energy expenditure, satisfaction with current power supply varies relatively little by school size. Dissatisfaction is evident across all school segments, suggesting
that inadequate power supply is a market-wide challenge rather than one concentrated among schools of a particular size. F I G U R E 4 : S AT I S FA C T I O N W I T H C U R R E N T P O W E R S U P P LY B Y M O N T H LY E N E R G Y E X P E N D I T U R E 3.85% Above N100,000
53.08%
16.92%
14.62%
11.54% 2.68%
N50,000 – N100,000
45.09%
18.75%
26.34%
7.14% 3.15%
N20,000 – N50,000
49.26%
21.85%
19.07%
6.67% 3.85%
Below N20,000
Very dissatisfied
50.48%
Somewhat dissatisfied
16.76%
Somewhat satisfied
23.89%
Mostly satisfied
5.01%
Very satisfied
Higher energy expenditure does not appear to translate consistently into greater satisfaction with power supply. Dissatisfaction remains evident across expenditure bands, including among schools with relatively high monthly energy costs. This suggests that schools may face both an energy cost and energy reliability challenge, strengthening the potential case for alternative energy solutions.
Demand for Renewable Energy FIGU R E 5: C U R R E N T IN TE R E S T IN A N D A D OP TION OF R E N E WA B LE ENERGY AMONG SURVEYED SCHOOLS
No, we haven't considered it at this time
Yes, and we are already implementing it
15% 34% 10%
Yes, but we haven't started and would need support 41%
Yes, we have considered it but haven't taken any steps yet and would like to learn more
Interest in renewable energy is widespread among surveyed schools, although adoption remains at an early stage. Most schools have considered renewable energy but have yet to implement a solution, with a substantial proportion indicating that they would require support to move forward. A further group is interested but remains at the information-gathering stage, while relatively few schools are already implementing renewable energy or have not considered it at all. This suggests that the principal opportunity lies in helping interested schools move from consideration to adoption.
Solar lighting emerges as the clear priority among surveyed schools (88%), with interest substantially higher than for other environmental solutions. Interest in water management (25%) and waste-related solutions (19%) is more modest, while energysaving cookstoves (16%) attract comparatively limited demand. This suggests that solar lighting solutions represent the most immediate opportunity for developing green finance products targeted at affordable private schools.
FIGU R E 6: IN TE R E S T IN R E N E WA B LE E N E R GY B Y S C H OOL S IZE SEGMENT
Quartile 1
Quartile 2
Quartile 3
Quartile 4
14.35%
13.93%
20.93%
15.40%
9.93%
33.06%
5.81%
7.98%
11.80%
42.79%
38.67%
30.47%
43.35%
33.27%
45.88%
32.40%
No, we haven't considered it at this time
Yes, and we are already implementing it Yes, but we haven't started and would need support Yes, we have considered it but haven't taken any steps yet and would like to learn more
Interest in renewable energy is widespread across all school sizes, although schools are at different stages of adoption. Higher-enrolment schools are less likely to have not considered renewable energy and are increasingly represented among schools that are interested but require support to move forward. However, implementation does not increase consistently with school size, with both the smallest and largest school segments reporting relatively higher levels of existing adoption. This suggests that renewable energy demand extends across the market, while the type of support required may differ between school segments.
Financing Renewable Energy
95% OF PROSPECTIVE ADOPTERS WOULD CONSIDER A LOAN
Willingness to access finance for renewable energy is exceptionally high among prospective adopters. Among schools that have expressed interest in renewable energy but have not yet implemented a solution, 95% would consider accessing a loan to finance the investment. Willingness is consistently high regardless of whether schools are actively seeking implementation support or are still exploring their options, indicating that financing could play an important role in converting renewable energy interest into adoption.
FIGU R E 7: P R E FE R R E D FIN A N C IN G A PP R OA C H FOR R E N E WAB LE ENERGY INVESTMENTS
20% 35%
45%
Leasing payment of rentals Outright purchase Pay as you go
Schools demonstrate demand for a range of financing approaches rather than a single preferred model. Outright purchase is the most commonly preferred approach, followed by leasing, while payas-you-go attracts a smaller but still meaningful share of schools. Preferences are broadly consistent across schools at different stages of renewable energy consideration, suggesting that financial institutions and energy providers may need to offer multiple financing pathways to accommodate different schools' financial capacity and preferences.
Illustrative Solar Financing Scenario Schools already allocate a recurring portion of their operating expenditure to meeting their energy needs. For schools spending NGN 75,000– NGN150,000 per month, which potentially represents maximum 24% of the market based on data above, transitioning to solar could potentially allow a portion of existing energy expenditure to be redirected towards financing the upfront cost of a solar system. The scenario below illustrates how different proportions of existing monthly energy expenditure could contribute towards solar loan repayments. TA B LE 1 : ILLU STR A TIVE SOLA R L O AN R EP A YM EN T SC E N AR IO F OR SC HO OL S SPE N DING N G N 50 ,0 00 – 1 00 ,0 00 P ER MO N TH ON EN ER G Y Conservative
Moderate
Upper-bound Illustration
75,000
100,000
150,000
75%
75%
75%
Illustrative Monthly Repayment
56,250
75,000
112,500
Assumed Loan Tenure (months)
36
36
36
Assumed Loan Interest Rate Monthly (Flat Rate)
4%
4%
4%
Indicative Loan Amount
1,141,340
1,521,787
2,282,681
Illustrative Current Monthly Energy Spend Share Redirected to Loan Repayment
Note: Scenarios are illustrative only and do not represent assessed repayment capacity. Actual savings and repayment affordability will depend on existing energy sources and costs, continued grid or generator use, solar system performance and maintenance costs, school cash flows, system price, and applicable financing terms.
Implications for Green Education Finance Finding
Implication for Green Education Finance
Energy expenditure increases with school size, with higher-enrolment schools more likely to fall within the higher monthly expenditure bands.
Segment financing by school size and energy needs. Consider differentiated loan sizes and financing structures rather than a standard green energy product across all schools. Position renewable energy around reliability as well as cost savings. Product propositions should recognise that schools may be seeking more dependable power supply, rather than simply lower energy expenditure. Incorporate current energy expenditure into affordability assessments. Existing expenditure may provide a useful starting point for assessing schools' capacity to redirect energy costs towards repayments, although actual affordability would require further assessment. Combine finance with implementation support. Financing alone may not be sufficient; partnerships with vetted renewable-energy providers could help schools assess their energy needs, select appropriate systems, install equipment and access after-sales support. Prioritise solar within initial green finance offerings. A focused solar-finance proposition may provide a clearer entry point than developing a broad environmental finance product covering multiple technologies. Develop differentiated customer journeys. Schools requiring implementation support may be ready for direct provider and financing referrals, while schools still exploring renewable energy may benefit first from information and awareness-building. Explore a dedicated green school finance proposition. High stated willingness to borrow indicates a potentially sizeable financing opportunity, subject to further assessment of affordability, loan size requirements and repayment capacity.
Dissatisfaction with current power supply is widespread across school sizes and expenditure levels.
Higher energy expenditure does not consistently translate into greater satisfaction with current power supply.
Interest in renewable energy is widespread, but most interested schools have not yet implemented a solution.
Solar is by far the most sought-after environmental solution among surveyed schools.
Schools across all pupil-size segments express interest in renewable energy, although their stage of readiness differs.
95% of prospective adopters would consider accessing a loan to finance renewable energy.
Finding
Implication for Green Education Finance
Schools express preferences for outright purchase, leasing and pay-as-you-go models rather than a single financing approach.
Offer or facilitate multiple financing pathways. Alongside conventional assetpurchase loans, FIs could explore partnerships with energy providers offering leasing and pay-as-you-go arrangements to serve schools with different financial capacities and ownership preferences.