Key Insight BORROWING INTENTIONS, LOAN READINESS AND SCHOOL IMPROVEMENT LOAN ACCESS IN INDIA August 2026
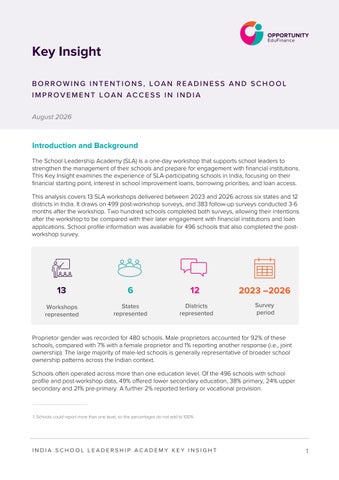
Introduction and Background The School Leadership Academy (SLA) is a one-day workshop that supports school leaders to strengthen the management of their schools and prepare for engagement with financial institutions. This Key Insight examines the experience of SLA-participating schools in India, focusing on their financial starting point, interest in school improvement loans, borrowing priorities, and loan access. This analysis covers 13 SLA workshops delivered between 2023 and 2026 across six states and 12 districts in India. It draws on 499 post-workshop surveys, and 383 follow-up surveys conducted 3-6 months after the workshop. Two hundred schools completed both surveys, allowing their intentions after the workshop to be compared with their later engagement with financial institutions and loan applications. School profile information was available for 496 schools that also completed the postworkshop survey.
13
6
12
2023 –2026
Workshops represented
States represented
Districts represented
Survey period
Proprietor gender was recorded for 480 schools. Male proprietors accounted for 92% of these schools, compared with 7% with a female proprietor and 1% reporting another response (i.e., joint ownership). The large majority of male-led schools is generally representative of broader school ownership patterns across the Indian context. Schools often operated across more than one education level. Of the 496 schools with school profile and post-workshop data, 49% offered lower secondary education, 38% primary, 24% upper secondary and 21% pre-primary. A further 2% reported tertiary or vocational provision.
1. Schools could report more than one level, so the percentages do not add to 100%
INDIA SCHOOL LEADERSHIP ACADEMY KEY INSIGHT
1
Key Findings at a Glance
78% had never taken a bank loan previously, showing that SLA reached many potential firsttime borrowers.
60% 1
23%
planned to apply for a loan after the workshop, compared with 31% before the workshop.
reported contact with a financial institution at followup, while 6% had applied for a school improvement loan.
These findings are based on School Profile, Post-Workshop and Follow-Up survey data from India SLA workshops delivered between 2023 and 2026.
School levels offered Tertiary or vocational
2%
Upper secondary
24%
00
Lower secondary Primary
49% 38%
Pre-primary
21%
Figure 1: School levels offered
Establishment year was available for 480 schools. The schools had been operating for an average of 20 years, with the median also at 20 years. Most had been established for between 11 and 30 years, while the longest-established school had been operating for 58 years.
School age (years of operation)
38%
33%
16%
Up to 10 years
14%
11 to 20 years
21 to 30 years
More than 30 years
Figure 2: School age (years of operation)
INDIA SCHOOL LEADERSHIP ACADEMY KEY INSIGHT
2
School enrolment varied considerably across the schools represented in the analysis. Enrolment information was available for 479 schools, representing more than 212,000 pupils.
212,134
443
300
Pupils represented
Average enrolment
Median enrolment
25 to 6,000
44%
479
Range in school enrolment
Girls as a share of reported enrolment
Schools with enrolment data
The median school enrolled 300 pupils, compared with an average of 443, reflecting the influence of a smaller number of much larger schools. Among schools reporting both total and girls’ enrolment, girls represented 44% of pupils. The girls’ enrolment rate of 44% is consistent with other Opportunity International school partners and affordable non-state schools in the Indian context. A recent gender analysis of school partners in Opportunity International’s EduQuality programme in India found that girls accounted for 45% of enrolment on average. This also aligns closely with national data from UDISE+ (Unified District Information System for Education Plus), the Government of India’s official school education data system, which shows girls representing approximately 44% of enrolment in private unaided recognized schools in 2024-25 report.
Key Finding #1 78% of schools that attended the SLA had never taken a bank loan previously, demonstrating that SLA workshops reached many potential first-time borrowers. Of the 349 schools that reported their borrowing history, 78% had never taken a bank loan and 22% had borrowed before, illustrating how SLAs reached many schools with limited previous exposure to formal bank finance. Akey objective of the SLA workshop is to support schools to better understand, prepare for, and access finance and reaching schools with no experience of borrowing is critical. This supports Opportunity International’s wider objective of expanding financial inclusion and access to finance, including for schools engaging with formal finance for the first time.
Most schools had not borrowed from a bank 78%
22%
No previous bank loan
Previously borrowed
Figure 3: Previous bank borrowing among schools
2. Opportunity EduFinance, 2026. Exploring Gender Differences and Opportunities to Improve Male and Female School Leader Outcomes. https://edufinance.org/publications/key-insights/exploring-gender-differences-and-opportunities-to-improve-male-and-female-school-leaderoutcomes/ 3. UDISE+ 2024-25 Yearly Report, 2025. Unified District Information System for Education Plus. Accessed August 24th 2026: https://dashboard.udiseplus.gov.in/
INDIA SCHOOL LEADERSHIP ACADEMY KEY INSIGHT
3
Key Finding #2 Appetite for borrowing increased substantially after the workshop, with 60% of schools stating they intended to apply for a loan after attending the SLA workshop, compared to only 31% before. School leaders reported a clear shift in borrowing intention after attending the SLA workshop. Based on school profile surveys collected before the workshop, 31% said they planned to apply for a school improvement loan. Immediately afterwards, this increased to 60%, a rise of 29 percentage points. This shift suggests that the SLA not only enhanced participants' financial literacy and confidence but also demonstrated that school leaders saw the potential of school improvement loans to improve school quality; they were able to recognize borrowing as a strategic tool for improving infrastructure and sustainability.
Plans to apply for school improvement loans before and after the workshop 60%
31%
Before workshop
After workshop
Figure 4: Plans to apply for school improvement loans before and after the workshop
Key Finding #3 Among the 383 schools contacted at the three-month follow-up survey, 23% reported contact with a financial institution and 6% had applied for a loan.
Among the 383 schools that responded to the three-month follow-up survey, 87 schools (23%) reported that they had contacted or been contacted by a financial institution, while 22 schools (6%) reported applying for a school improvement loan. Within three months, almost one-quarter of schools had made contact with a financial institution, while 6% had submitted a loan application. This shows early engagement with financial institutions, but also a considerable gap between the 60% of schools that had plans to apply immediately after the workshop and the 6% that had applied by follow-up.
Financial institution engagement at follow-up
23%
6% FI contact
Applied
Figure 5: Financial institution engagement at follow-up
INDIA SCHOOL LEADERSHIP ACADEMY KEY INSIGHT
4
Previous borrowing history was available for 16 of the 22 applicants. Of these, 10 out of 16 (63%) had never previously taken a bank loan, showing that first-time borrowing was relatively common among applicants for whom borrowing history was available. For the remaining respondents, when asked why they had not applied for a loan, 84% of schools said they were not yet ready to borrow. This was a much more common response than any specific reason such as interest rates being too high (5%), financial institution delays (3%) or missing documentation (2%), showing that broader loan readiness remained important at follow-up. Further research and follow-up by the program team could explore what “not ready to borrow” means for schools, including whether they are waiting for a specific investment need, concerned about taking on debt for the first time, or facing other barriers that are not captured by the current survey response options.
Key Finding #4 In total, $348,089 has been reported as disbursed and received by loan applicants at the three-month follow-up, representing a significant amount of capital disbursed within a short period. Out of the 22 schools reporting that they had applied for a school improvement loan, 10 were recorded as disbursed and received, 11 were still in process, and one was waiting for a response from the financial institution.
Application status and reported application value
$1,304,280
11
$348,089 $210,708
10
1 In process
Waiting for response Reported application value (USD)
Disbursed and received Number of schools
Figure 6: Application status and reported application value
Together, the 22 applicants reported applying for $1.86 million. Applications still in process accounted for $1.3 million, the application waiting for a response was valued at $210,708, and applications recorded as disbursed and received accounted for $348,089. Individual application values ranged from $1,054 to $526,769, with a median of $13,696. Five schools reported application values of $131,692 or higher, a relatively high loan size compared to programme averages. As these five schools also had an average enrolment of 1,080 pupils, compared with the overall average of 443 pupils, it is likely these schools have higher annual revenue and are thus more likely to be eligible for high loan amounts. However, only one of these five loan applications was recorded as disbursed and received. As application values in this analysis are reported by schools, amounts ultimately approved or disbursed may therefore differ from those requested. INDIA SCHOOL LEADERSHIP ACADEMY KEY INSIGHT
5
Key Finding #5 New classroom construction emerged as the leading financing priority, both at the time of the workshop and among schools that later applied for loans. Out of the 255 schools reporting that they had plans to apply for a loan and reporting how they intended to use desired loans, 45% planned to use financing for new classroom construction. This was followed by the purchase of school land at 22% and school buses at 17%. At follow-up, classroom construction remained the most prominent financing priority, reported by 77% of the 22 schools that had applied for a loan.
Financing priorities reported after the workshop and at follow-up 77%
New classroom construction
Improve WASH facilities
45% 9% 4% 9%
Dormitory construction
Staff salaries
7% 0% 4% 9%
Computers
15% 5%
School bus
17% 5%
Purchase school land
Rent school land
Security fencing or boundary wall
22% 5% 1% 0% 3% 14%
School furniture or desks
Other
10% 0% 9%
Follow-Up application purpose (n=22)
Post-Workshop intended use (n=255)
Figure 7: Financing priorities reported after the workshop and at follow-up
INDIA SCHOOL LEADERSHIP ACADEMY KEY INSIGHT
6
Among the 296 schools that planned to apply for a loan after the workshop, 203 (69%), identified at least one form of collateral or security they believed they could offer. This suggests that many schools had already considered and prepared for how they might meet this aspect of loan eligibility.
Security schools said they could offer Other
10%
Personal guarantee
21%
Personal belongings Vehicle log book
12% 6%
Land title
18%
Land agreement
48%
Figure 8: Security schools said they could offer
Land-related security was the most frequently reported form of collateral. Of the 203 schools that described what they believed they could offer, 48% selected a land agreement, 21% a personal guarantee and 18% a land title. Personal belongings and vehicle logbooks were also reported.
Key Finding #6 Fee collection remains a persistent challenge affecting cashflow, with 66% of schools reporting at least 10% of fees uncollected and 15% identifying insufficient cashflow to repay loans. Fee collection pressure was evident in the School Profile data and was also reflected in the loan application challenges reported after the workshop, shown in the challenges chart (see Figure 11). Of the 327 schools reporting the share of fees left uncollected in the previous school year, 66% said that at least 10% of school fees remained outstanding.
% fees remaining uncollected 51% 34% 10% Less than 10%
10% to 30%
30% to 50%
5% More than 50%
Figure 9: % fees remaining uncollected 4. Respondents could select more than one option.
INDIA SCHOOL LEADERSHIP ACADEMY KEY INSIGHT
7
As far as how schools collect fees and manage their finances, cash collection remained almost universal, although many schools were also using mobile and other digital payment channels. Of the 312 schools describing how fees were collected, 94% accepted cash, 69% used mobile money, 33% used digital money and 8% received direct bank deposits.
How schools collect fees Other
2%
Cash Direct bank deposit
94% 8%
Mobile money
69%
Digital money
33%
Figure 10: How schools collect fees
Schools also reported that the majority are using manual or paper systems to maintain their financial records. Of the 316 schools reporting how they kept financial records, 81% used manual or paper records, while 24% used digital or computer-based records and 12% used school finance software or an app (schools could select more than one method). Lastly, schools reported challenges they expected to face when applying for loans. Of the 141 schools reporting possible application challenges, 21% identified limited knowledge of loan products, 15% stated missing documentation, and 15% reported insufficient cash flow to repay. These responses point to practical areas for further preparation, particularly understanding available loan products, assessing repayment capacity and organizing the documentation needed for an application. Further, particularly in light of the above results around fee arrears, improving processes for fee collection and therefore cash flow management is an important opportunity to improve school loan readiness for 15% of schools reporting cash flow challenges.
Challenges schools expected when applying for loans Other
24%
Missing documentation
15%
Lack of knowledge about loan products Existing debt
21% 7%
Collateral requirements Audited or clear accounts Registration status
9% 4% 6%
Land of their own Insufficient cash flow to repay
13% 15%
Figure 11: Challenges schools expected when applying for loans 5. Respondents could select more than one option.
INDIA SCHOOL LEADERSHIP ACADEMY KEY INSIGHT
8
Key Finding #7 Schools reporting parent interest in school fee loans were more likely to report higher fee arrears, 38% compared with 27%. Schools were asked to report whether parents of children in their school would be interested in school fee loans. Among schools expecting parent interest, 38% reported that 30% or more of fees remained uncollected, compared with 27% of schools that did not expect parent interest. This suggests a possible relationship between higher fee arrears, associated cash flow pressure, and schools’ perceptions of parent interest in school fee loans. As this reflects schools’ views rather than direct responses from parents, a future parent survey or focused study could help assess actual interest in and demand for this type of financial support.
Schools reporting 30% or more of fees uncollected 38% 27%
Parents may be interested in SFLs
Parents not expected to be interested
Figure 12: Schools reporting 30% or more of fees uncollected
Conclusion Implications for the SLA workshop and financial institution engagement Overall, this report highlights encouraging early momentum in schools' financing journeys following the SLA workshop, alongside valuable opportunities to deepen impact going forward. 60% of schools reported plans to borrow after the workshop and 23% reported contact with a financial institution by follow-up, suggesting some continued interest in financing. However, actual rates of loan applications remain low at only 6%. This may also reflect constraints specific to the Indian context, including eligibility criteria used by financial institutions that can limit access for smaller schools. Currrently, schools with fewer than 300 pupils are considered “not eligible” by almost all financial institution partners in the programme portfolio, thus presenting a key challenge and also limiting the number of lenders serving the low-fee school segment. Demand for school improvement loans can be further unlocked through continued engagement, practical readiness support, and financing products better aligned with schools' full range of investment priorities, from classroom construction to technology and transport. Further, continued engagement with financial institution partners, and particularly with those with more lenient eligibility requirements, may be beneficial. This report also points to promising areas for future research, including how targeted financial management support shapes borrowing outcomes, and how more granular tracking, from intention through disbursement, can clarify where schools benefit most from support. This work offers a strong foundation for refining engagement strategies that help more schools turn financing interest into realized investment.
INDIA SCHOOL LEADERSHIP ACADEMY KEY INSIGHT
9
Methodology This Key Insight draws on data from three survey tools: the school profile intake survey, postworkshop survey, and follow-up survey data collected from schools participating in the India School Leadership Academy workshop between 2023 and 2026. The school profile collects information on participating schools’ basic information and their financial starting point, and is collected in-person at the workshop. The post-workshop survey, also collected in-person, captures school leaders’ plans to apply for finance, intended use of a school improvement loan, and financial management practices. The follow-up survey conducted via phone 3-6 months after the workshop records subsequent engagement with financial institutions, loan application status, and reasons schools had not applied. The analysis includes 496 school profile surveys, 499 post-workshop surveys, and 383 follow-up surveys. 198 schools completed all three surveys and could therefore be followed from their responses immediately after the workshop to their reported experience at follow-up. Results are based on the schools that provided information for each question, so the number of schools represented can vary between measures. Enrolment summaries use school records with usable pupil figures, while the original values remain unchanged in the source data. Loan application values are reported in US dollars, converted from the amounts reported in Indian rupees using the current exchange rate (August 2026).
ADDRESS Level 18, 100 Bishopsgate London EC2M 1GT Visit us at edufinance.org © 2026 Opportunity International Education Finance functions under its US and UK affiliates. Opportunity International United Kingdom is registered as a charity in England and Wales (1107713) and in Scotland (SCO39692). Opportunity I International NDIA SC United H O States O L LisEaA501(c)3 D E R nonprofit. SHIP ACADEMY KEY INSIGHT
10